 Open Access Article
Experimental and theoretical investigations of the effect of heteroatom-doped carbon microsphere supports on the stability and storage capacity of nano-Co3O4 conversion anodes for application in lithium-ion batteries†
Pravin K.
Dwivedi
ab,
Aathira
Nair
a,
Rupali S.
Mehare
ab,
Vikash
Chaturvedi
ab,
Kavita
Joshi
 *ab and
Manjusha V.
Shelke
 *ab
*ab
aPhysical and Materials Chemistry Division, CSIR-National Chemical Laboratory, Pune 411008, MH, India. E-mail: mv.shelke@ncl.res.in; k.joshi@ncl.res.in
bAcademy of Scientific and Innovative Research (AcSIR), Ghaziabad-200112, UP, India
First published on 11th May 2020
Abstract
Conversion-type anode materials have been intensely studied for application in Li-ion batteries (LIBs) due to their potentially higher capacities than current graphite-based anodes. This work reports the development of a high-capacity and stable anode from a nanocomposite of N and S co-doped carbon spheres (NSCSs) with Co3O4 (NSCS–Co3O4). A hydrothermal reaction of saccharose with L-cysteine was carried out, followed by its carbonization. CSs when used as supports for conversion-type materials provide efficient electron/ion transfer channels, enhancing the overall electrochemical performance of the electrodes. Additionally, the heteroatoms doped in a carbon matrix alter the electronic properties, often increasing the reactivity of the carbon surface, and they are reported to be effective for anchoring metal oxide nanoparticles. Consequently, the NSCS–Co3O4 nanocomposites developed in this work exhibit enhanced and stable reversible specific capacity over several cycles. Stable cycling behavior was observed at 1 A g−1 with 1285 mA h g−1 of specific capacity retained after 350 cycles along with more than 99% of coulombic efficiency. This material shows excellent rate capability with a specific capacity of 745 mA h g−1 retained even at a high current density of 5 A g−1. Detailed DFT-based calculations revealed the role of doped supports in controlling the volume expansion upon lithiation.
Introduction
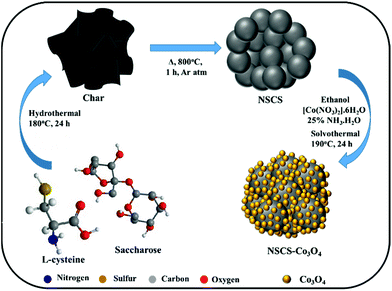
LIBs are one of the most studied systems for clean energy storage due to their compact size, longer life cycle, high efficiency and high energy density.1,2 Their ever-increasing demand for the extended range of advanced applications, e.g., electric mobility requires high energy and high power densities.3–5 Since decades, intense research has been done on transition metal oxides such as CoO, MnO2, Fe2O3, and Co3O4 to replace graphitic anodes that have a limited theoretical capacity of 372 mA h g−1vs. Li+.6–8 Among them, Co3O4 can be produced in large volumes due to its low cost, and it has been demonstrated as a potential high-energy material for application in LIBs with a theoretical capacity of around 890 mA h g−1.9 However, the commercial application of Co3O4 has not been viable yet due to its low electrical conductivity, high volume expansion during charge and discharge cycles, capacity fading at high current density, and poor cyclic stability.10,11 Some new synthesis strategies have been demonstrated for producing nanostructures of Co3O4 with different morphologies having different pore distributions and a specific surface area, leading to the high capacity and improved stability of LIBs.12–19 The high surface areas and small dimensions of these nanostructures help to improve the interaction of the electrode–electrolyte surface and reduce the Li-ion diffusion length into the solid surface. However, the high volume expansion of Co3O4 results in the crystal deformation and agglomeration of anode materials, restricting the capacity gains.20 It has been reported that preparing composites of metal oxide nanostructures with conducting carbon networks compensates for the volume expansion and the lacking conductivity, which also enhances the electrochemical performance. This strategy helps in remarkably reducing the volume expansion of Co3O4; moreover, the carbon matrix improves the conduction of electrons to the current collector.21 Different carbon forms such as nano-onions, nanotubes, nanofibers, graphene sheets and 3D porous carbon networks are widely used to prepare composites with Co3O4, demonstrating anodic capacity enhancement.21–28 Among these carbon structures, spherical carbon has maximum packing density, low surface-to-volume ratio and high structural resistance.29–31 However, there is a large scope for further improvements in the performance by introducing defects in carbon matrices, e.g., doping of heteroatoms such as N, B, and S.32–37 These dopant atoms on the surface of carbon materials improve the reactivity, which enhances the lithiation capacity. Additionally, the large atomic size of sulfur atoms can increase the interlayer spacing of the graphitized carbon, create micropores in the carbon matrix and hence improve the charge storage capacity of the carbon material. Moreover, lone-pair electrons of N and S atoms contribute to extending the conjugated electron clouds of the carbon matrix, resulting in increased conductivity that enhances the rate capacity and cycle life of the electrode material.Taking into consideration the potential effects of the co-doped carbon matrix for the stable performance of high-energy conversion-type anode materials like metal oxides, we synthesized a composite of nitrogen and sulphur co-doped carbon spheres and Co3O4 as an anode material for application in LIBs with enhanced reversible capacity and potential for large-scale production (Scheme 1). N and S co-doping in carbon spheres is found to efficiently inhibit the agglomeration of Co3O4 NPs and facilitate robust interactions between the electrode and Li-ions, which improves the kinetics of lithium diffusion and reduces the charge transfer resistance. The NSCS–Co3O4 nanocomposite exhibits excellent rate performance with a specific capacity of 745 mA h g−1 at a high current density of 5 A g−1. It retains a remarkable and stable discharge capacity of 1285 mA h g−1 at 1 A g−1 after 350 cycles with more than 99% coulombic efficiency.
Experimental section
Synthesis of NS co-doped carbon spheres
For the synthesis of NS co-doped carbon spheres, saccharose and L-cysteine in 5![[thin space (1/6-em)]](https://www.rsc.org/images/entities/char_2009.gif) :
:![[thin space (1/6-em)]](https://www.rsc.org/images/entities/char_2009.gif) 1 ratio were used as precursors. In a typical experiment, 10 g of saccharose was first dissolved in 120 ml of de-ionized water followed by the addition of 2 g of L-cysteine under stirring. The resultant solution was then treated hydrothermally at 180 °C for 24 h. After cooling down to room temperature, the obtained product was washed several times with de-ionized water and ethanol by vacuum filtration followed by overnight drying at 80 °C. After drying, the as-prepared material was annealed at 800 °C in an inert atmosphere for 1 h. For the synthesis of non-doped CSs, only saccharose was treated hydrothermally.
1 ratio were used as precursors. In a typical experiment, 10 g of saccharose was first dissolved in 120 ml of de-ionized water followed by the addition of 2 g of L-cysteine under stirring. The resultant solution was then treated hydrothermally at 180 °C for 24 h. After cooling down to room temperature, the obtained product was washed several times with de-ionized water and ethanol by vacuum filtration followed by overnight drying at 80 °C. After drying, the as-prepared material was annealed at 800 °C in an inert atmosphere for 1 h. For the synthesis of non-doped CSs, only saccharose was treated hydrothermally.
Synthesis of a Co3O4 NP composite with NS co-doped carbon spheres
To synthesize an NSCS–Co3O4 nanocomposite, 50 mg of NSCS was dispersed in 20 ml of ethanol by ultra-sonication and a separate solution of 0.29 g of Co(NO3)2·6H2O in 20 ml of ethanol was prepared by stirring. Both solutions were mixed under stirring for 30 minutes followed by the addition of ammonia solution (NH3·H2O, 25%). The obtained solution was then transferred into a Teflon-lined stainless steel autoclave and heated at 190 °C for 24 h. Finally, the reaction mixture was washed with DI water and ethanol by vacuum filtration followed by overnight drying at 80 °C. For comparison, pure Co3O4 was synthesized without the addition of NSCSs and CS–Co3O4 with non-doped CSs.Material characterization
Powder X-ray diffraction (p-XRD) patterns were recorded using a Phillips PAN analytical diffractometer with CuKα radiation (λ = 1.5406 Å). Transmission electron microscopy (TEM) was carried out using a Tecnai F30 FEG machine operating at an accelerating voltage of 300 kV. The morphology and chemical composition of the ternary hybrid composite were examined using a Quanta 200 3D, FEI scanning electron microscope (SEM). X-ray photoelectron spectroscopic (XPS) measurements were carried out using a VG Micro Tech ESCA 3000 instrument. Thermogravimetric analysis (TGA) was performed using an SDT model Q600 of TA instrument at a heating rate of 10 °C min−1 in an air atmosphere.Electrochemical characterization
The electrochemical properties of the as-prepared electrode materials were examined in a two-electrode coin cell (CR2032) configuration. The Co3O4 nanostructures, non-doped CSs and NSCS–Co3O4 were tested as anode materials by preparing their slurry with a conducting carbon additive (super P) and a binder (polyvinylidene difluoride, PVDF) in an NMP solvent. Further, the slurry was coated onto a Cu foil, which serves as the current collector, and subsequently dried at 90 °C overnight before assembling the cell in an Ar-filled glove box. The average mass loading of the active material in various electrodes was nearly 1 mg. The coin cells were assembled using a lithium metal foil as the counter electrode, a quartz microfiber paper (Whatman) as the separator and 1 M LiPF6 in ethylene carbonate (EC)–diethyl carbonate (DEC) (1![[thin space (1/6-em)]](https://www.rsc.org/images/entities/char_2009.gif) :
:![[thin space (1/6-em)]](https://www.rsc.org/images/entities/char_2009.gif) 1 by volume) as the electrolyte. Cyclic voltammetry (CV) was performed using a SP-300 EC Biologic potentiostat at a scan rate of 0.25 mV s−1 in the potential window of 0.01–3.0 V. The galvanostatic discharge–charge cycling of the cells was carried out at different current densities between the potential windows of 0.01 V and 3.0 V using an MTI battery analyser. The electrochemical impedance spectroscopy (EIS) spectra were used to measure the impedance in the frequency range from 100 kHz to 50 mHz with an AC amplitude of 10 mV.
1 by volume) as the electrolyte. Cyclic voltammetry (CV) was performed using a SP-300 EC Biologic potentiostat at a scan rate of 0.25 mV s−1 in the potential window of 0.01–3.0 V. The galvanostatic discharge–charge cycling of the cells was carried out at different current densities between the potential windows of 0.01 V and 3.0 V using an MTI battery analyser. The electrochemical impedance spectroscopy (EIS) spectra were used to measure the impedance in the frequency range from 100 kHz to 50 mHz with an AC amplitude of 10 mV.
Computational details
All the calculations were carried out using the Kohn–Sham formulation of DFT. The projector augmented wave potential38 is used with the Perdew–Burke–Ernzerhof (PBE) approximation for the exchange-correlation39 and generalized gradient approximation, as implemented in a plane-wave, pseudo-potential-based code, VASP.40–42 Furthermore, for the correct representation of 3d orbitals of Co, spin-polarized calculations with the Hubbard U correction (GGA + U) were included. The U parameter (3.32 eV) was selected from the material project43 and further verified for its transferability. The Monkhorst–Pack (MP) formulation was used for the grid of 6 × 6 × 6, for bulk Co3O4, which resulted in 108 k-points in the irreducible Brillouin zone (IBZ) and yielded an energy convergence of about 0.005 eV. While, for the composites of Co3O4 with doped and undoped graphite, a 2D slab was created with a vacuum of 15 Å, which increased appropriately as lithiation progressed. A gamma-centered grid of 6 × 6 × 1 was employed for all the surface calculations. This choice of MP grid resulted in 20 k-points in the IBZ. As Li-ions are alloying with Co3O4 and its composites, the enthalpy of alloy formation ΔEmix is calculated (see eqn (1)) to estimate the stability of the systems:44| ΔEmix = Esys − Ratiosys × ELi − (1 − Ratiosys) × Ebare_sys | (1) |
Result and discussion
The crystallographic structures and phase purity of the as-prepared materials were investigated by p-XRD. The p-XRD spectra of the synthesized materials are given in Fig. 1a. The p-XRD spectra of CSs and NSCS samples showed the presence of two broad peaks appearing at 24.2° and 43.6° of 2θ corresponding to the (002) and (101) planes of graphitized carbon respectively. The p-XRD spectra of Co3O4, CS–Co3O4 and NSCS–Co3O4 consist of peaks at 19.0°, 31.29°, 36.94°, 44.86°, 59.29° and 65.27° of 2θ corresponding to the (111), (220), (400), (511) and (440) planes respectively, indicating the Co3O4 spinel structure with a face-centred cubic lattice (JCPDS card no. 42-1467). Peaks of the CSs and NSCSs are not detected in the composite samples as the carbon spheres are completely covered by Co3O4 NPs. No residual/impurity peaks could be seen in the p-XRD spectra, indicating the good quality of the samples.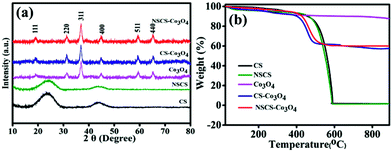 | ||
| Fig. 1 (a) p-XRD pattern of CS, NSCS, Co3O4, CS–Co3O4 and NSCS–Co3O4. (b) TGA analysis of Co3O4, CS–Co3O4 and NSCS–Co3O4. | ||
TGA was performed for all five samples in an air atmosphere at a rate of 10 °C min−1 up to 900 °C to quantify the weight percentage of individual components in the composites. In Fig. 1b, the weight loss below 150 °C can be attributed to the release of adsorbed moisture and gases from the surface of the samples.25 CSs and NSCSs show complete weight loss after heating at 600 °C due to the formation of CO2 in an oxygen atmosphere. In case of the CS–Co3O4 and NSCS–Co3O4 nanocomposites, weight loss occurred from 400 °C to 500 °C and then showed a stable TGA profile, indicating the removal of carbon from the composites, and the residual peak corresponded to the weight percentage of Co3O4. Hence, Co3O4 and carbon contents in the composites are approximately 60% and 40% respectively.
X-ray photoelectron spectroscopic (XPS) analysis was carried out to find out the oxidation states of cobalt and elemental composition in the NSCS–Co3O4 composite. Fig. 2a shows the XPS survey spectra of the composite, which displays the presence of Co 2p, C 1s, N 1s and S 2p peaks. In Fig. 2b–e, core level peaks are further deconvoluted to understand the surface composition of the constituting elements. As shown in Fig. 2b, a combination of tetrahedral Co2+ and octahedral Co3+ contributes to the doublet 2p spectral profile of Co3O4 separated in high- and low-energy components due to spin–orbit coupling corresponding to 2p1/2 to 2p3/2 with a separation of 15.2 eV.45,46 The deconvolution of the Co 2p peak at 779.3 eV and 780.6 eV is assigned to Co3+ 2p3/2 and Co2+ 2p3/2, respectively. The other spin–orbit components, Co3+ 2p1/2 and Co2+ 2p1/2, have been detected at 794.5 and 795.8 eV, respectively. The peaks at 782.1 eV and 797.3 eV may occur due to the chemical shift of the main spin–orbit components, resulting from the chemical interaction of Co cations with surface hydroxyl groups. In addition to these peaks, four small peaks are also observed corresponding to the shake-up satellite peaks of Co3O4 in the high-binding-energy side of 2p3/2 and 2p1/2 transitions, indicating the co-existence of Co(II) and Co(III) on the surface of the material. Fig. 2c shows four deconvolution peaks in the C 1s spectra at 284.6, 285.6, 286.5 and 288.5 eV, which correspond to the sp2 hybridized carbon, sp3 hybridized carbon, C–O/C–N and C![[double bond, length as m-dash]](https://www.rsc.org/images/entities/char_e001.gif) O bonds respectively.47–49 The high-resolution S 2p spectra (Fig. 2d) show two peaks at 163.9 eV and 165.2 eV, which may correspond to the presence of C–S–C and C
O bonds respectively.47–49 The high-resolution S 2p spectra (Fig. 2d) show two peaks at 163.9 eV and 165.2 eV, which may correspond to the presence of C–S–C and C![[double bond, length as m-dash]](https://www.rsc.org/images/entities/char_e001.gif) S respectively and weak peaks at around 168 eV can be related to the oxidized sulfur.50,51 The high-resolution N 1s spectrum (Fig. 2e) with four deconvoluted peaks at 398.5 eV, 399.7 eV, 400.7 eV and 401.6 eV could be attributed to the presence of pyridinic N, pyrrolic N, quaternary-graphitic N and oxidized species respectively.52
S respectively and weak peaks at around 168 eV can be related to the oxidized sulfur.50,51 The high-resolution N 1s spectrum (Fig. 2e) with four deconvoluted peaks at 398.5 eV, 399.7 eV, 400.7 eV and 401.6 eV could be attributed to the presence of pyridinic N, pyrrolic N, quaternary-graphitic N and oxidized species respectively.52
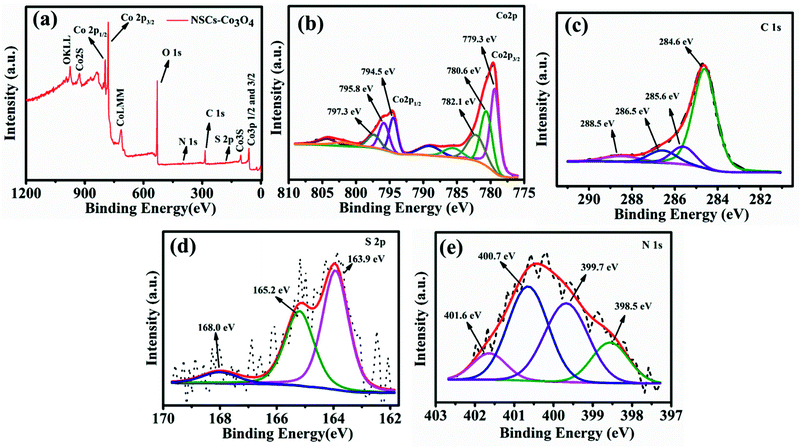 | ||
| Fig. 2 (a) XPS survey scan of NSCS–Co3O4. Deconvoluted spectra of (b) Co 2p (c) C 1s (d) S 2p and (e) N 1s. | ||
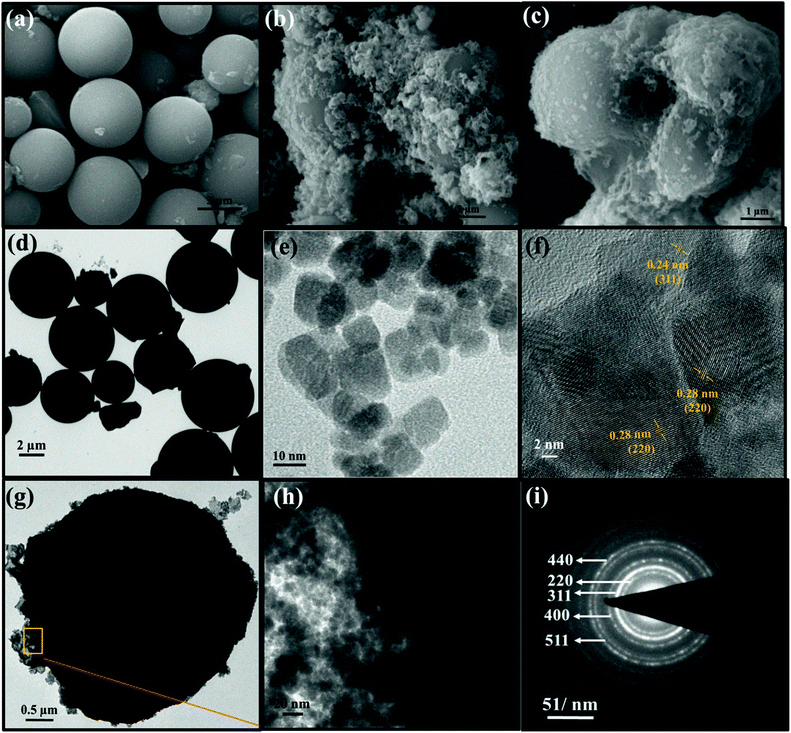
The surface and structural morphology of the as-prepared materials was observed by scanning electron microscopy (SEM), and the images are shown in Fig. 3. Fig. 3a represents the micron-sized particles of NSCSs. Fig. 3b shows Co3O4 NPs decorated on the surface of CSs. Here, Co3O4 NPs are distributed unevenly on the surface of CSs, leading to clustering, whereas in NSCS–Co3O4 (Fig. 3c), Co3O4 NPs are well distributed and homogeneously decorated on the NSCS surface forming an extended nanosheet-like structure, which uniformly covers the surface of NSCSs. It is also observable from the images that N and S doping is playing a vital role for the uniform nucleation and growth of Co3O4 nanoparticles by providing well-dispersed nucleation sites in NSCSs. Morphological control on the uniform growth of Co3O4 NPs through N and S doping can be highlighted using atomic distribution of different elements over the surface of NSCS–Co3O4. SEM elemental maps are shown in Fig. S1a–f,† which indicate the presence of all five elements (Co, C, N, S and O) that are homogeneously distributed throughout the sample.
Transmission electron microscopic (TEM) characterization was performed on all samples to provide an insight into the inner architecture and crystallographic structure of the as-prepared materials. Fig. 3d represents the TEM image of well-dispersed N- and S-doped carbon spheres with a diameter ranging between 2 and 5 micrometres. Fig. 3e shows the Co3O4 nanoparticles with 10–20 nm size. The higher magnification image in Fig. 3f clearly verifies the cubic structure of Co3O4 NPs with interplanar spacings of 0.28 nm and 0.24 nm, corresponding to the (220) and (311) planes of the face-centred cubic phase of Co3O4, respectively.53Fig. 3g shows that N and S co-doped carbon spheres are closely and densely surrounded by Co3O4 NPs, which are extended into sheet-like structures due to uniform coverage over the NSCS surface. The high-magnification image (Fig. 3h) of NSCS–Co3O4 also reveals the surface boundary of NSCSs and Co3O4 NPs aggregated like sheets, which indicates the homogeneous distribution of Co3O4 NPs on the surface of NSCSs. Fig. 3i illustrates the typical selected-area electron diffraction (SAED) pattern of the NSCS–Co3O4 nanocomposites. The diffraction rings correspond to (220), (311), (400), (511), and (440) planes of polycrystalline Co3O4.54
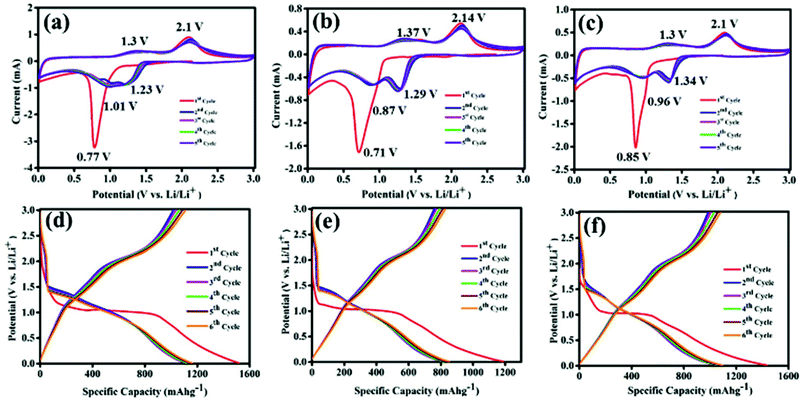
Lithium storage properties of Co3O4, CS–Co3O4 and NSCS–Co3O4 composites were examined in a coin cell configuration versus Li/Li+ under identical conditions, and the results are shown in Fig. 4a–e. The cyclic voltammetry (CV) measurements for Co3O4, CS–Co3O4 and NSCS–Co3O4 composite electrodes were performed at a scan rate of 0.25 mV s−1 in the potential window of 0.01 V to 3.0 V. A distinct and irreversible reduction peak appeared at 0.77 V in the first cathodic scan of the Co3O4 CV curve (Fig. 4a) due to the reduction of Co3O4 to metallic Co and the formation of amorphous Li2O by a conversion reaction. Simultaneous decomposition of electrolytes takes place to form a solid electrolyte interphase (SEI) layer on the surface of the electrode.26,27 From the second cycle onwards, cathodic peak split into two distinguishable peaks appearing nearly at 1.01 V and 1.23 V with a lesser intensity, which is due to a multistep reaction during lithiation and the presence of some irreversible transformation that gives structural modification in the first cycle.26,27,34 Moreover, two broad peaks are observed during an anodic scan at potentials of 1.35 V and 2.1 V, which could be attributed to the oxidation of metallic Co. The electrochemical reaction mechanism of Co3O4 involves the formation and decomposition of Li2O, accompanied by the reduction of Co3+ to Co2+ and Co2+ to Co and the oxidation of Co to Co2+ and Co2+ to Co3+ through an intermediate of CoO. This multiple electron process can be represented by eqn (2) and (3).55
| Co3O4 + 2Li+ + 2e− ↔ Li2O + 3CoO | (2) |
| 3CoO + 6Li+ + 6e− ↔ 3Li2O + 3Co | (3) |
In case of the CS–Co3O4 electrode, as shown in Fig. 4b, during the first cathodic scan, a reduction peak was observed at 0.71 V and subsequent cathodic peaks (2nd cycle onwards) were observed at 0.87 V and 1.29 V vs. Li/Li+, whereas the anodic peaks were obtained at approximately 1.37 V and 2.14 V. Fig. 4c represents the CV curve of the NSCS–Co3O4 composite, where the first cathodic peak appeared at 0.85 V and subsequent cathodic peaks appeared at 0.96 and 1.34 V, whereas anodic peaks were observed at 1.3 V and 2.1 V. In the NSCS–Co3O4 composite, the subsequent cycles represent the proper overlapping of anodic and cathodic peaks, an indication of the good electrochemical reversibility of the electrode material.
The galvanostatic charge–discharge (GCD) curves are shown in Fig. 4d, e and f for Co3O4, CS–Co3O4 and NSCS–Co3O4 respectively within a voltage window of 0.01–3.00 V (vs. Li/Li+). The GCD curves were recorded at a current density of 100 mA g−1, and the obtained results are in well accordance with the CV results. In the charge–discharge profiles of Co3O4, CS–Co3O4 and NSCS–Co3O4, an extended voltage plateau is observed at around 1.1 V, resulting from the lithiation of Co3O4 and the formation of Co and Li2O. In the charge curves, the slope region from 1.2 to 2.5 V corresponds to the reversible oxidation of Co3O4. Discharge capacity values calculated from the second cycle are around 1106 mA h g−1, 836 mA h g−1 and 1075 mA h g−1 for Co3O4, CS–Co3O4 and NSCS–Co3O4 respectively. A lower specific capacity value of CS–Co3O4 compared to bare Co3O4 is probably due to the addition of CSs, but in case of NSCS–Co3O4, reversible capacity increases due to N and S co-doping in CSs, which may provide a large number of edge defects with enhanced electronic conductivity and improved lithium-ion accessibility.34 Another reason could be the homogeneous distribution of Co3O4 nanoparticles on the surface of NSCSs, which may allow better charge transfer.
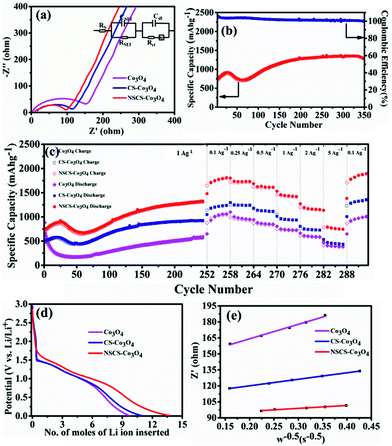
Impedance measurements of Co3O4, CS–Co3O4 and NSCS–Co3O4 electrodes were carried out in the frequency range of 100 kHz to 0.05 Hz at room temperature. As shown in Fig. 5a, Nyquist plots of all three electrodes consist of a depressed semicircle at the high-frequency region and an inclined line at the low-frequency region. The high-frequency semicircle is attributed to the SEI film formation, contact resistance, and charge transfer resistance on the electrode/electrolyte interface, whereas the inclined line in the low-frequency region corresponds to the lithium-diffusion process within electrodes.56 The charge transfer resistance is calculated by the fitting circuit model. It is observed to be lower for NSCS–Co3O4 (65.72 Ω) as compared to bare Co3O4 (152.5 Ω) and CS–Co3O4 (106.1 Ω), implying more conducting nature and faster Li+ diffusion rate of NSCS–Co3O4 nanocomposites. Reduced charge transfer resistance of NSCS–Co3O4 electrodes is possibly due to the carbon matrix, which reduces the mechanical strain and avoids volume expansion during the charge–discharge process. Additionally, N and S co-doping enhances the electronic conductivity, providing continuous and rapid electron transport, which may accelerate the Li ion storage capacity of the electrode material. Fig. 5b shows the cyclability of NSCS–Co3O4 composites at a current density of 1 A g−1 for 350 cycles. It can be observed that the as-prepared NSCS–Co3O4 electrode exhibits long cycle life over 350 cycles with higher specific capacity value and nearly 100% of coulombic efficiency. Over the cycling, more reactive sites of NSCS–Co3O4 are activated and contributing in lithium-ion storage, which is reflected in the gradually increasing specific capacity up to 919 mA h g−1 for initial 25 cycles. Additionally, heteroatom-doped carbon spheres provide more reactive sites, leading to the increased lithium-ion storage capacity while cycling.56–58 Afterwards, for 70 cycles, the capacity value decreases to 720 mA h g−1, which may be due to the deterioration of the electrode material on the continuous charge–discharge process, resulting in increased charge transfer resistance which is an inherent characteristic of the TMO electrodes.35,59 A further increase in capacity value was observed up to 250 cycles (1331 mA h g−1), which remained stable over 350 cycles with 96.5% capacity retention as well as >99% coulombic efficiency. This increasing trend in the discharge capacity is probably due to the enhanced kinetics of Li ion diffusion by the gradual activation process and the formation of the polymeric gel-like film with better electrolyte infiltration during cycling.60 Moreover, heteroatom-doped carbon spheres reduce the volume expansion during cycling and provide structural stability to Co3O4 NPs. NSCSs increase the electronic and ionic conductivities of the composite electrode, leading to fast Li+ insertion kinetics in Co3O4.34 A similar trend was observed in another composite anode CS–Co3O4 though with lesser specific capacity than NSCS–Co3O4. Therefore, the rate performance of these materials was analysed after 250 cycles. Fig. 5c illustrates the comparative rate performance of the Co3O4, CS–Co3O4 and NSCS–Co3O4 electrodes after 251 continuous charge–discharge cycles at 1 A g−1 and varying current densities between 0.1 A g−1 and 5 A g−1. Among all, NSCS–Co3O4 electrodes exhibit excellent rate performance with reversible discharge capacities of 1807, 1730, 1616, 1419, and 1151 mA h g−1 at 0.1, 0.25, 0.5, 1 and 2 A g−1, respectively. Even at a high current density of 5 A g−1, the NSCS–Co3O4 electrode delivers a high specific capacity of 745 mA h g−1. However, bare Co3O4 electrodes exhibit a specific capacity of 1060 mA h g−1 at 0.1 A g−1 and 384 mA h g−1 at 5 A g−1, while CS–Co3O4 composite electrodes deliver a specific capacity of 1237 mA h g−1 at 0.1 A g−1 and 437 mA h g−1 at 5 A g−1. When current density reverted to 0.1 A g−1, NSCS–Co3O4 gives 1889 mA h g−1 of specific capacity after 292 cycles, whereas Co3O4 and CS–Co3O4 deliver 1007 and 1356 mA h g−1 of specific capacity. The enhanced rate performance of the NSCS–Co3O4 nanocomposites could be ascribed to the improved electron transfer due to nanostructured cobalt oxides and the increased electronic conductivity provided by the conducting carbon network, fast kinetics, and reduced volume expansion at a higher current density of the NSCS in the nanocomposites.34 Hence, from Fig. 5c, it can be clearly observed that in comparison to Co3O4 and CS–Co3O4, NSCS–Co3O4 shows excellent rate performance at high current density, which is the result of doped nitrogen and sulphur in carbon.
Furthermore, the Li ion diffusion coefficient (DLi+) of the cell was calculated using the following eqn (4):61
 | (4) |
![[thin space (1/6-em)]](https://www.rsc.org/images/entities/char_2009.gif) 500 coulomb mol−1), σw is the Warburg coefficient and ∂E/∂x is the slope of potential vs. Li concentration plot as shown in Fig. 5d. σ is obtained from the extrapolation of the straight line in the lower frequency region from the semicircle to real axis.62
500 coulomb mol−1), σw is the Warburg coefficient and ∂E/∂x is the slope of potential vs. Li concentration plot as shown in Fig. 5d. σ is obtained from the extrapolation of the straight line in the lower frequency region from the semicircle to real axis.62| Zre = Re + Rct + σω−0.5 | (5) |
| Electrode | σ w (Ω s−1/2) | X (mol cm−3) | D Li (cm2 s−1) |
|---|---|---|---|
| Co3O4 | 135.96 | 0.1852 | 0.123 × 10⁻¹² |
| CS–Co3O4 | 61.24 | 0.1768 | 0.56 × 10⁻¹² |
| NSCS–Co3O4 | 27.42 | 0.1394 | 1.73 × 10⁻¹² |
To understand the effect of charge–discharge cycling on the cell after 350 cycles, we have performed the impedance measurement (Fig. S4a†) and TEM study (Fig. S4b and c†), and the corresponding figures and discussion are given in ESI.†
Computational study
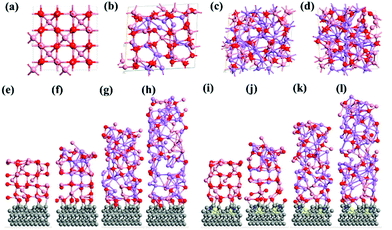
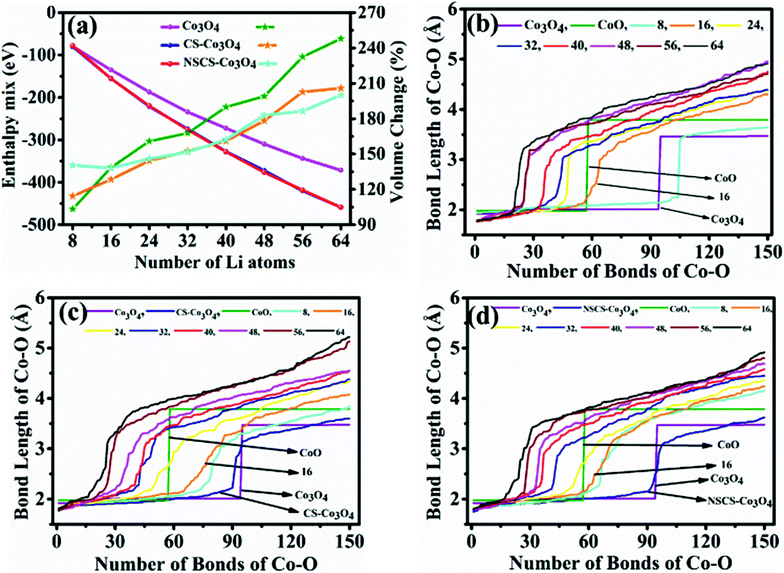
The computed crystal structure of Co3O4 with the Hubbard U correction was verified against the experimentally reported structure. The deviation between the computed and experimental lattice parameters is found to be less than 0.1%, confirming that the parameters and methodology utilized are appropriate. As stated, the Li-atoms were added to the structure, in steps of eight atoms. Hence, the initial structure has 8 Li-atoms, while the fully lithiated Co3O4 structure has 64 Li-atoms. The lithiation strategy was modeled in accordance with eqn (2) and (3) representing the chemical reaction. Some representative models are shown in Fig. 6a–d for Co3O4, Fig. 6e–h for CS–Co3O4 and Fig. 6i–l for NSCS–Co3O4.A trend of increase in the volume of the crystal structure (Co3O4) is observed with the increase in number of Li-atoms. The volume of the bulk system is 573.57 Å3, while the volume of the fully lithiated structure is 1421.70 Å3. An increase of approximately 248% is observed. CS–Co3O4 and NSCS–Co3O4 structures were also lithiated to investigate the effect of the substrate as well as doping on the volume expansion and overall functioning of the electrode. Volume expansion upon lithiation, in CS–Co3O4 and NSCS–Co3O4 systems, is significantly lower than that of bulk Co3O4. The initial volume of CS–Co3O4 and NSCS–Co3O4 systems was 790.832 Å3 and 808.515 Å3 respectively, which increased to 1628.31 Å3 and 1618.36 Å3, respectively upon lithiation. The percentage volume expansion was found to be 206% and 200% for CS–Co3O4 and NSCS–Co3O4 respectively. A considerable downshift in volume expansion upon lithiation underlines the role of support in restraining the volume as compared to unsupported Co3O4. A downshift in the volume expansion and the corresponding ΔEmix value reflect the enhanced stability of the system. In Fig. 7a, the ΔEmix value (on the left y-axis) and change in volume (on the right y-axis) have been plotted against the number of Li atoms added to the system. The change in volume is considerably less in the composite systems compared to Co3O4. The support provides additional strength to the lattice of Co3O4 by providing an anchoring point. The presence of the support for Co3O4 results in bonding between C and Co as well as between C and O, thus restricting the expansion of at least Co and O atoms in contact with the support upon lithiation. This does reflect the lesser volume expansion for supported systems. The support also affects the functioning of Co3O4 in terms of slowing down the reaction from Co3O4 to CoO-like phase. This could be understood from the analysis of Co–O bonds as a function of lithiation in these three systems. In Fig. 7b, we have shown the shortest Co–O bonds as a function of increasing Li contents in the system. In the case of Co3O4, a sudden shift in the number of short Co–O bonds is observed, while the number of Li atoms within the system changes from 8 to 16. There are about 103 short Co–O bonds in the Co3O4 + 8 Li system. This number drastically reduces to 55 in case of the Co3O4 + 16 Li system. Furthermore, the long-range order in the system is lost as evident from the continuous distribution of the bond lengths. This sudden shift marks the transition from Co3O4 to CoO-like phase. It is interesting to note the effect of the support on the Co–O bond lengths in CS–Co3O4. The bare (or unlithiated) CS–Co3O4 has less number of Co–O short bonds compared to unsupported Co3O4 because Co, as well as O, gets bonded with the support. However, upon lithiation, the transition is slowed down, as reflected from the Co–O bond lengths shown in Fig. 7c. For 16 Li atoms in CS–Co3O4, there are 64 short Co–O bonds, which were about 55 in case of unsupported Co3O4, indicating 10–15% reduction in Co–O short bonds. This marks the negative effect of support which although helps in controlling the volume expansion but only at the cost of Li holding capacity and therefore showing reduced performance. However, when we compare it with NSCS–Co3O4, the number of Co–O short bonds upon addition of 16 Li atoms are about 57, indicating that the behaviour of NSCS–Co3O4 is similar to that of unsupported Co3O4 (Fig. 7d). Thus, Co3O4 placed over N and S doped carbon reduces the volume expansion and does not compromise on the Li holding capacity as much as in the case of CS–Co3O4.
The specific capacity of the Co3O4 system can be related to its ability to undergo reactions in order to form CoO and Li2O and finally CoO getting converted into metallic Co (as given by eqn (1) and (2)). As lithiation progresses, Co3O4 gets converted into CoO and finally into metallic Co, as discussed above. In terms of effective charge on Co, it changes from Co3+ to Co2+ in CoO and then to metallic Co0 upon complete lithiation. This transition also reflects the Bader charges as well as Co–O bond lengths as a function of lithiation.
Our detailed DFT calculations demonstrate that the presence of the support below the Co3O4 nanoparticle does play an important role, in controlling both the volume expansion and the specific capacity. The carbon support holds the Co and O atoms that not only restrain volume expansion but also decrease the interaction of Li atoms with cobalt and oxygen, which would have otherwise lead to the conversion of Co3O4 into CoO and further into metallic Co. However, the presence of dopants have helped in controlling the formation of C–Co bonds, such that Li atoms can interact in a better way with the Co and O atoms to form CoO and metallic Co without resisting its capability to reduce volume expansion.
In summary, the excellent electrochemical performance of NSCS–Co3O4 could be attributed to the synergetic effect of Co3O4 and N and S co-doped carbon spheres. Nanoparticles of Co3O4 effectively reduce the path length for lithium-ion migration during the charge/discharge process. Heteroatom doping offers suitable pathways for electron transfer and provides a good conductive matrix for Co3O4 nanoparticles. NSCSs also act as a buffer substrate to accommodate the volume changes of Co3O4 in the process of lithium-ion insertion/extraction. Nitrogen and sulphur doping introduce defects, thus leading to the formation of disordered carbon structure, which tends to be electron accepting and provides anchor sites for the Co3O4 nanoparticles.
Conclusions
An NSCS–Co3O4 nanocomposite has been synthesized as an anode material with a significant potential for application in lithium-ion batteries as a high-energy material. Doped N and S atoms enhance the electronic conductivity and also provide binding sites for the facile deposition of a large number of Co3O4 nanoparticles. It also provides the channels for charge and ionic transport, which effectively alleviates the aggregation of Co3O4 in the Li+ insertion/extraction. As a result, NSCS–Co3O4 shows excellent rate performance and long cycle life. Among all the three electrodes, NSCS–Co3O4 exhibits less charge transfer resistance with a higher Li ion diffusion coefficient value of 1.73 × 10⁻¹² cm2 s−1.Conflicts of interest
The authors declare no competing financial interest.Acknowledgements
We acknowledge the Council of Scientific and Industrial Research, New Delhi, India and DST-Nanomission for providing financial support.References
- R. Marom, S. F. Amalraj, N. Leifer, D. Jacob and D. Aurbach, J. Mater. Chem., 2011, 21, 9938–9954 RSC.
- M. Armand and J.-M. Tarascon, Nature, 2008, 451, 652 CrossRef CAS PubMed.
- S. Goriparti, E. Miele, F. De Angelis, E. Di Fabrizio, R. Proietti Zaccaria and C. Capiglia, J. Power Sources, 2014, 257, 421–443 CrossRef CAS.
- D. P. Dubal, O. Ayyad, V. Ruiz and P. Gomez-Romero, Chem. Soc. Rev., 2015, 44, 1777–1790 RSC.
- J. Jiang, Y. Li, J. Liu and X. Huang, Nanoscale, 2011, 3, 45–58 RSC.
- A. S. Aricò, P. Bruce, B. Scrosati, J.-M. Tarascon and W. van Schalkwijk, Nat. Mater., 2005, 4, 366 CrossRef PubMed.
- L. Zhang, H. Bin Wu and X. W. Lou, Adv. Energy Mater., 2013, 4, 1300958 CrossRef.
- J. Ming, J.-B. Park and Y.-K. Sun, ACS Appl. Mater. Interfaces, 2013, 5, 2133–2136 CrossRef CAS PubMed.
- Y. Wang, B. Wang, F. Xiao, Z. Huang, Y. Wang, C. Richardson, Z. Chen, L. Jiao and H. Yuan, J. Power Sources, 2015, 298, 203–208 CrossRef CAS.
- M. R. Palacín, Chem. Soc. Rev., 2009, 38, 2565–2575 RSC.
- D. Gu, W. Li, F. Wang, H. Bongard, B. Spliethoff, W. Schmidt, C. Weidenthaler, Y. Xia, D. Zhao and F. Schüth, Angew. Chem., 2015, 127, 7166–7170 CrossRef.
- Y. Huang, C. Chen, C. An, C. Xu, Y. Xu, Y. Wang, L. Jiao and H. Yuan, Electrochim. Acta, 2014, 145, 34–39 CrossRef CAS.
- L. Zhan, S. Wang, L.-X. Ding, Z. Li and H. Wang, Electrochim. Acta, 2014, 135, 35–41 CrossRef CAS.
- J. Guo, L. Chen, X. Zhang and H. Chen, J. Solid State Chem., 2014, 213, 193–197 CrossRef CAS.
- L. Tian, H. Zou, J. Fu, X. Yang, Y. Wang, H. Guo, X. Fu, C. Liang, M. Wu, P. K. Shen and Q. Gao, Adv. Funct. Mater., 2010, 20, 617–623 CrossRef CAS.
- K. Qiu, Y. Lu, J. Cheng, H. Yan, X. Hou, D. Zhang, M. Lu, X. Liu and Y. Luo, Electrochim. Acta, 2015, 157, 62–68 CrossRef CAS.
- D. Liu, X. Wang, X. Wang, W. Tian, Y. Bando and D. Golberg, Sci. Rep., 2013, 3, 2543 CrossRef PubMed.
- X. Liu, Q. Long, C. Jiang, B. Zhan, C. Li, S. Liu, Q. Zhao, W. Huang and X. Dong, Nanoscale, 2013, 5, 6525–6529 RSC.
- Y. Zhang, Y. Wu, Y. Chu, L. Li, Q. Yu, Y. Zhu, G. Liu, Q. Hou, R. Zeng and L. Zhao, Electrochim. Acta, 2016, 188, 909–916 CrossRef CAS.
- G. Huang, S. Xu, S. Lu, L. Li and H. Sun, ACS Appl. Mater. Interfaces, 2014, 6, 7236–7243 CrossRef CAS PubMed.
- S. Abouali, M. Akbari Garakani, B. Zhang, H. Luo, Z.-L. Xu, J.-Q. Huang, J. Huang and J.-K. Kim, J. Mater. Chem. A, 2014, 2, 16939–16944 RSC.
- J. Xu, J. Wu, L. Luo, X. Chen, H. Qin, V. Dravid, S. Mi and C. Jia, J. Power Sources, 2015, 274, 816–822 CrossRef CAS.
- Y. Liu, Z. Cheng, H. Sun, H. Arandiyan, J. Li and M. Ahmad, J. Power Sources, 2015, 273, 878–884 CrossRef CAS.
- X. Zhou, J. Shi, Y. Liu, Q. Su, J. Zhang and G. Du, Electrochim. Acta, 2014, 143, 175–179 CrossRef CAS.
- Y. Lou, J. Liang, Y. Peng and J. Chen, Phys. Chem. Chem. Phys., 2015, 17, 8885–8893 RSC.
- G. Huang, F. Zhang, X. Du, Y. Qin, D. Yin and L. Wang, ACS Nano, 2015, 9, 1592–1599 CrossRef CAS PubMed.
- L. Shen and C. Wang, Electrochim. Acta, 2014, 133, 16–22 CrossRef CAS.
- X. Liu, S. W. Or, C. Jin, Y. Lv, W. Li, C. Feng, F. Xiao and Y. Sun, Electrochim. Acta, 2013, 100, 140–146 CrossRef CAS.
- K. Sun, Y. Hu, X. Zhang, K. San Hui, K. Zhang, G. Xu, J. Ma and W. He, Electrochim. Acta, 2020, 335, 135680 CrossRef CAS.
- X. Zhang, Z. Bi, G. Xu, C. Li, W. He and J. Zhu, J. Power Sources, 2019, 438, 226980 CrossRef CAS.
- X. Yi, W. He, X. Zhang, G. Yang and Y. Wang, J. Alloys Compd., 2018, 735, 1306–1313 CrossRef CAS.
- L. Wang, Y. Zheng, X. Wang, S. Chen, F. Xu, L. Zuo, J. Wu, L. Sun, Z. Li, H. Hou and Y. Song, ACS Appl. Mater. Interfaces, 2014, 6, 7117–7125 CrossRef CAS PubMed.
- Y. Sun, F. Huang, S. Li, Y. Shen and A. Xie, Nano Res., 2017, 10, 3457–3467 CrossRef CAS.
- L. Guo, Y. Ding, C. Qin, W. Li, J. Du, Z. Fu, W. Song and F. Wang, Electrochim. Acta, 2016, 187, 234–242 CrossRef CAS.
- D. Li, D. Shi, Z. Chen, H. Liu, D. Jia and Z. Guo, RSC Adv., 2013, 3, 5003–5008 RSC.
- Y. Fang, R. Liu, L. Zeng, J. Liu, L. Xu, X. He, B. Huang, Q. Chen, M. Wei and Q. Qian, Electrochim. Acta, 2019, 318, 737–745 CrossRef CAS.
- L. Zeng, B. Kang, F. Luo, Y. Fang, C. Zheng, J. Liu, R. Liu, X. Li, Q. Chen, M. Wei and Q. Qian, Chem.–Eur. J., 2019, 25, 13411–13421 CrossRef CAS PubMed.
- G. Kresse and D. Joubert, Phys. Rev. B: Condens. Matter Mater. Phys., 1999, 59, 1758–1775 CrossRef CAS.
- J. Paier, M. Marsman, K. Hummer, G. Kresse, I. C. Gerber and J. G. Ángyán, J. Chem. Phys., 2006, 124, 154709 CrossRef CAS PubMed.
- G. Kresse and J. Furthmüller, Phys. Rev. B: Condens. Matter Mater. Phys., 1996, 54, 11169–11186 CrossRef CAS PubMed.
- G. Kresse and J. Furthmüller, Comput. Mater. Sci., 1996, 6, 15–50 CrossRef CAS.
- G. Kresse and J. Hafner, Phys. Rev. B: Condens. Matter Mater. Phys., 1993, 47, 558–561 CrossRef CAS PubMed.
- A. Jain, S. P. Ong, G. Hautier, W. Chen, W. D. Richards, S. Dacek, S. Cholia, D. Gunter, D. Skinner, G. Ceder and K. A. Persson, APL Mater., 2013, 1, 11002 CrossRef.
- H. Kim, C.-Y. Chou, J. G. Ekerdt and G. S. Hwang, J. Phys. Chem. C, 2011, 115, 2514–2521 CrossRef CAS.
- X. Tian, X. Sun, Z. Jiang, Z.-J. Jiang, X. Hao, D. Shao and T. Maiyalagan, ACS Appl. Energy Mater., 2018, 1, 143–153 CrossRef CAS.
- C. K. Ranaweera, C. Zhang, S. Bhoyate, P. K. Kahol, M. Ghimire, S. R. Mishra, F. Perez, B. K. Gupta and R. K. Gupta, Mater. Chem. Front., 2017, 1, 1580–1584 RSC.
- Z. Yang, K. Qian, J. Lv, W. Yan, J. Liu, J. Ai, Y. Zhang, T. Guo, X. Zhou, S. Xu and Z. Guo, Sci. Rep., 2016, 6, 27957 CrossRef CAS PubMed.
- L. Zhang, Z. Su, F. Jiang, L. Yang, J. Qian, Y. Zhou, W. Li and M. Hong, Nanoscale, 2014, 6, 6590–6602 RSC.
- D. Bhattacharjya, H.-Y. Park, M.-S. Kim, H.-S. Choi, S. N. Inamdar and J.-S. Yu, Langmuir, 2014, 30, 318–324 CrossRef CAS PubMed.
- W. Deng, Y. Zhang, L. Yang, Y. Tan, M. Ma and Q. Xie, RSC Adv., 2015, 5, 13046–13051 RSC.
- W. Si, J. Zhou, S. Zhang, S. Li, W. Xing and S. Zhuo, Electrochim. Acta, 2013, 107, 397–405 CrossRef CAS.
- X. Li, Y. Fang, L. Wen, F. Li, G. Yin, W. Chen, X. An, J. Jin and J. Ma, Dalton Trans., 2016, 45, 5575–5582 RSC.
- J. Liu, H. Xia, L. Lu and D. Xue, J. Mater. Chem., 2010, 20, 1506–1510 RSC.
- C. Cheng, G. Zhou, J. Du, H. Zhang, D. Guo, Q. Li, W. Wei and L. Chen, New J. Chem., 2014, 38, 2250–2253 RSC.
- X. Chi, L. Chang, D. Xie, J. Zhang and G. Du, Mater. Lett., 2013, 106, 178–181 CrossRef CAS.
- X. Leng, S. Wei, Z. Jiang, J. Lian, G. Wang and Q. Jiang, Sci. Rep., 2015, 5, 16629 CrossRef CAS PubMed.
- H.-H. Li, L. Zhou, L.-L. Zhang, C.-Y. Fan, H.-H. Fan, X.-L. Wu, H.-Z. Sun and J.-P. Zhang, ACS Energy Lett., 2017, 2, 52–59 CrossRef CAS.
- Z. Fang, W. Xu, T. Huang, M. Li, W. Wang, Y. Liu, C. Mao, F. Meng, M. Wang, M. Cheng, A. Yu and X. Guo, Mater. Res. Bull., 2013, 48, 4419–4423 CrossRef CAS.
- Z. Zhang, L. Li, Q. Xu and B. Cao, RSC Adv., 2015, 5, 61631–61638 RSC.
- J. Mujtaba, H. Sun, G. Huang, K. Mølhave, Y. Liu, Y. Zhao, X. Wang, S. Xu and J. Zhu, Sci. Rep., 2016, 6, 20592 CrossRef CAS PubMed.
- Y. Bai, X. Wang, X. Zhang, H. Shu, X. Yang, B. Hu, Q. Wei, H. Wu and Y. Song, Electrochim. Acta, 2013, 109, 355–364 CrossRef CAS.
- A. Y. Shenouda and H. K. Liu, J. Power Sources, 2008, 185, 1386–1391 CrossRef CAS.
Footnote |
| † Electronic supplementary information (ESI) available. See DOI: 10.1039/d0na00261e |
| This journal is © The Royal Society of Chemistry 2020 |

