DOI:
10.1039/D0NA00260G
(Paper)
Nanoscale Adv., 2020,
2, 3033-3049
A La3+-doped TiO2 nanoparticle decorated functionalized-MWCNT catalyst: novel electrochemical non-enzymatic sensing of paraoxon-ethyl†
Received
3rd April 2020
, Accepted 18th May 2020
First published on 17th June 2020
Abstract
The development of novel chemical sensors for pesticide detection has found particular application in the area of environmental monitoring. However, designing primary sensors as weapons to destroy contaminants (e.g., paraoxon-ethyl) in water and soil remains a challenge. Herein, we show different strategies, such as modification of TiO2 NPs through La3+ doping and decoration of f-MWCNTs, which can provide possibilities for notable developments in electrocatalytic performance. Using this approach, we introduce an active La3+ doped TiO2 NP decorated f-MWCNT electrocatalyst for pollutant monitoring applications. Thereby, our findings move towards an outstanding LOD (0.0019 μM) performance, high selectivity, and exceptional sensitivity (7.6690 μA μM−1 cm−2) on an as-presented catalytic platform for a PE sensor. Interestingly, the practical applicability of the suggested catalyst shows a rich sensing platform for PE-contaminated environmental samples.
1. Introduction
Organophosphate pesticides (OPs) are considered to be a premier type of pesticide owing to their extraordinary accomplishments in pest control but have caused prodigious pollution in the environment, and in food and water. Paraoxon-ethyl (PE) is an organophosphate pesticide, and is broadly used to control pests/insects and increase the yields of a large number of agricultural crops.1 OP pesticides are mainly employed for the cultivation of fruits, wheat, rice, garlic, beans, and cotton via a spraying technique.2 The long-term persistence of pesticides and insecticides are complexities in the ecological system; usage of a large quantity of PE causes a significant issue in groundwater contamination. However, PE can easily penetrate pure groundwater and can migrate through the food chain in day-to-day consumption. Meanwhile the level of intake of PE-contaminated foods is increasing, which in turn causes severe health risks, including diarrhea, vomiting, poor vision, headaches, and critical neurotoxic effects.3–5 Therefore, the U.S Environment Protection Agency (EPA) stated that PE is an extremely toxic substance for both animals and human beings.6
Environmentally friendly and efficient technologies for the detection of pesticides are highly desired. Nowadays, there are many possible conventional techniques for the detection of pesticides in contaminated water, such as high-performance liquid chromatography (HPLC) and HPLC-MS/MS,7–9 gas chromatography and ultra-violet spectrophotometry,10,11 and high-performance capillary zone electrophoresis.12 Among these methods, those based on electrochemical sensors have been extensively used and have shown satisfactory results for OP analysis due to their uncomplicated operation, fast response, on-site detection, low-cost impact, extraordinary sensitivity, and selectivity.6
Over past decades, various metal oxides have been investigated to enhance the electrochemical catalytic activity towards features needed for pesticide monitoring in the field of electrochemistry.13 To date, there has been interest in exploring the chemical and bio-sensing of several semiconducting metal oxides due to their tunable redox and conducting characteristics, affordability, high level of sensitivity, fast response time, and ability to classify the species of analytes. Many n-type and p-type semiconducting metal oxides have been studied, including ZnO, SnO2, TiO2, Fe3O4, NiO, and many others. Among the others, titania (TiO2) has been used to construct a variety of novel materials in the fields of electrochemical sensors,14 and catalytic reduction.15–20 TiO2 is a typical semiconductor and a versatile catalyst, which shows high stability, low cost, and non-toxicity for practical applications. Because of these considerations, TiO2 NPs are a prominent key factor for studying catalytic behavior towards pollutant monitoring, while TiO2 NPs are of great interest for their industrial importance. However, systematic efforts are still needed to develop a superior electrocatalyst towards the electrochemical sensing of pollutants due to the electron–hole pair recombination of TiO2 NPs. To overcome these issues, the doping phenomenon is a powerful strategy to improve the catalytic performance of TiO2 NPs in an electrochemical sensor platform, which can be accomplished by different approaches, such as doping with non-metals, transition metals, or rare-earth metals.21–23 Herein, the utilization of rare-earth elements is a significant idea to enhance catalytic activity towards pesticide detection; the rare-earth dopants act as an electron sink on the surface of the semiconductors, which reduces electron–hole pair recombination.24 Notably, when doping La3+ into TiO2 NPs, an increase in the concentration of oxygen vacancies in the unit cell of the doped TiO2 structure is expected. This feature promotes the migration of oxygen ions through the lattice oxide and provides the material with high oxygen ion conductivity. Besides, it is expected that the La3+ doped TiO2 NPs will increase chemical adsorption on the semiconductor surfaces, which will help to enhance the sensing performance in pollutant determination using chemical sensors. Carbon materials have noteworthy high electrical conductivity, good mechanical strength, a high specific surface area, and catalytic properties. Among carbon nanotubes (CNTs) both single-walled and multi-walled carbon nanotubes (MWCNTs) have become attractive electrode materials in recent decades for the detection of pesticide pollutants. The f-MWCNTs with La3+ doped TiO2 NPs will be excellent candidates for use as substrates, and might have a notable impact on the electrochemical sensing platform due to their synergetic effect.25
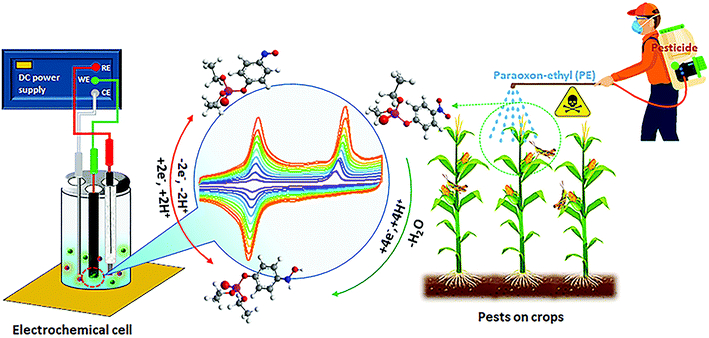
In this study, we propose the decoration of f-MWCNTs with La3+ doped TiO2 nanoparticles (NPs) by an ultrasound sonication process. Using this composite, we analyzed the electrocatalytic sensing behavior for organophosphate pesticide (PE), according to the electrochemical schematic illustration shown in Scheme 1. The results showed that we had achieved remarkable sensing behavior towards the detection of PE with excellent selectivity and selectivity. Furthermore, the functions of the modified electrode materials show long-term stability and real-time applicability, which will help to accomplish the challenge of finding a catalyst for the detection of PE-contaminated groundwater samples.
 |
| | Scheme 1 Schematic illustration for the development of novel chemical sensors for pesticide detection. | |
2. Experimental
2.1. Chemicals and reagents
Pure-MWCNTs, titanium(IV) isopropoxide (97%), lanthanum nitrate hexahydrate, La(NO3)3·6H2O (99.999%), isopropyl alcohol (IPA), and paraoxon-ethyl (O2NC6H4OP(O)(OC2H5)2) (analytical standard) were purchased from Sigma-Aldrich; all the reagents were employed without additional purification. The phosphate buffer (PB) (0.05 M) electrolyte was prepared using Na2HPO4 (dibasic, anhydrous), and NaH2PO4 (monobasic, anhydrous). All the electrolytes were prepared in de-ionized (DI) water to carry out the electrochemical investigations.
2.2 Synthesis of functionalized multiwall carbon nanotubes (f-MWCNTs)
The MWCNTs were functionalized according to a previously reported procedure.26 Typically, the pristine-MWCNTs (1 g) were dispersed into 50 mL of a 1![[thin space (1/6-em)]](https://www.rsc.org/images/entities/char_2009.gif) :1 (v/v) ratio of HNO3 (67%) and H2SO4 (97%) and kept at 60 °C for 30 min under constant magnetic stirring. Afterwards, the well-dispersed solution was ultra-sonicated for 6 h (37 kHz), and then it was kept at room temperature. Subsequently, the f-MWCNT residue was washed with DI water to remove acid by centrifugation. The black residue of f-MWCNTs was allowed to dry at room temperature.
:1 (v/v) ratio of HNO3 (67%) and H2SO4 (97%) and kept at 60 °C for 30 min under constant magnetic stirring. Afterwards, the well-dispersed solution was ultra-sonicated for 6 h (37 kHz), and then it was kept at room temperature. Subsequently, the f-MWCNT residue was washed with DI water to remove acid by centrifugation. The black residue of f-MWCNTs was allowed to dry at room temperature.
2.3 Synthesis of La3+ doped TiO2 NPs
The mixed-phase TiO2 (anatase/rutile) with La3+ doped NPs was synthesized via the sol–gel method by polycondensation and hydrolysis of titanium tetra-isopropoxide (TTIP) and a lanthanum precursor (lanthanum nitrate hexahydrate (99.999% purity)) in the presence of isopropanol. Typically, TTIP (13 mL) was dissolved in 65 mL of isopropanol in a beaker and then the solutions were mixed well and continuously until a homogeneous solution of the suspension was obtained. Subsequently, a separate mixture of a 1:1 (v/v) ratio of isopropyl alcohol (45 mL) and water (45 mL) was added into the homogenous suspension drop-by-drop and mixed completely for up to 30 min. Then the lanthanum precursor (10%) was slowly added into the reaction mixture solution with continuous stirring. Afterward, 1 mL of concentrated (68%) nitric acid was added dropwise into the reaction compounds followed by vigorous stirring for thorough dispersion. Subsequently, the reaction compounds were kept under continuous stirring (2 h), which was followed by aging at room temperature for 24 h. The reaction mixture of La3+ doped TiO2 NPs was centrifuged and drenched with isopropanol and water and then washed many times and dried at 343 K for 12 h. Finally, the obtained La3+ doped TiO2 NPs underwent an annealing process which was carried out with a 2 °C min−1 ramp rate at 773 K under an air atmosphere. The TiO2 nanomaterial was prepared by an identical procedure with a tiny modification (without the presence of a dopant). An illustration of the synthesis procedure for La3+ doped TiO2 NPs is shown in Scheme 2.
 |
| | Scheme 2 Schematic illustration of the synthesis procedure for La3+ doped TiO2 NPs. | |
2.4 Synthesis of La3+ doped TiO2 NP decorated f-MWCNTs
The La3+ doped TiO2 NP decorated f-MWCNTs were sonochemically synthesized with three different ratios of f-MWCNTs and TiO2 (1:1, 2:1, and 3:1). In a typical composition, the f-MWCNTs were dispersed in 100 mL of DI water and then ultra-sonicated for 30 min. Then as-prepared La3+ doped TiO2 was added to the suspension of f-MWCNT solution. The attained solution mixture was ultra-sonicated for 1 h (at 37 kHz). After completing the sonication process, the suspension settled down at room temperature. Subsequently, the collected product was centrifuged with DI water and ethanol several times. The final residue was dried at room temperature, and then it was designated as La3+-doped TiO2 NP decorated f-MWCNTs.
2.5 Characterization
Powder X-ray diffraction (XRD) was performed using a Bruker D8 Advance X-ray diffractometer. Fourier transform infrared spectroscopy (FTIR) used a CHI 10000 C FT/IR-6600 instrument. Transmission electron microscopy (TEM) and energy-dispersive X-ray spectroscopy (EDS) elemental analysis were recorded using a TEM-JEM-2100F (HR) instrument. XPS measurements were analyzed with a Kratos Axis Ultra spectrometer, using focused monochromatized Al Kα radiation (hν) of 1486.6 eV. The specific surface area and the pore size distribution were analyzed by using the Brunauer–Emmett–Teller (BET) and Barrett–Joyner–Halenda (BJH) methods. The electrochemical characterizations and analytical techniques were implemented by two different voltammetry techniques (CV & DPV) using CHI instruments (1205 C and CHI 900, USA).
2.6. Fabrication of La3+ doped TiO2 NP decorated f-MWCNT modified electrode
The La3+ doped TiO2 NP decorated f-MWCNTs were fabricated onto the GCE surface via the drop-casting method. Before the GCE surface modification, the GCE was well-polished with alumina slurry and then washed with DI water to remove the alumina slurry. Typically, 1 mg of La3+ doped TiO2 NP decorated f-MWCNT catalyst was dispersed in 1.0 mL of DI water and then ultra-sonicated for 15 min to obtain a uniform mixture. Subsequently, the obtained catalyst (optimized concentration 6 μL) was drop cast on the well-polished GCE surfaces and then allowed to dry at room temperature. The GCE modified with La3+ doped TiO2 NP decorated f-MWCNTs was employed for further electrochemical measurements.
3. Results and discussions
3.1 Physicochemical characterizations
First, the La3+ doped TiO2 on f-MWCNTs were synthesized via the sonochemical method, and the detailed synthesis can found in the Experimental section. The structure and purity of TiO2 NPs were analyzed before doping without La3+ ions using powder X-ray diffraction (PXRD).
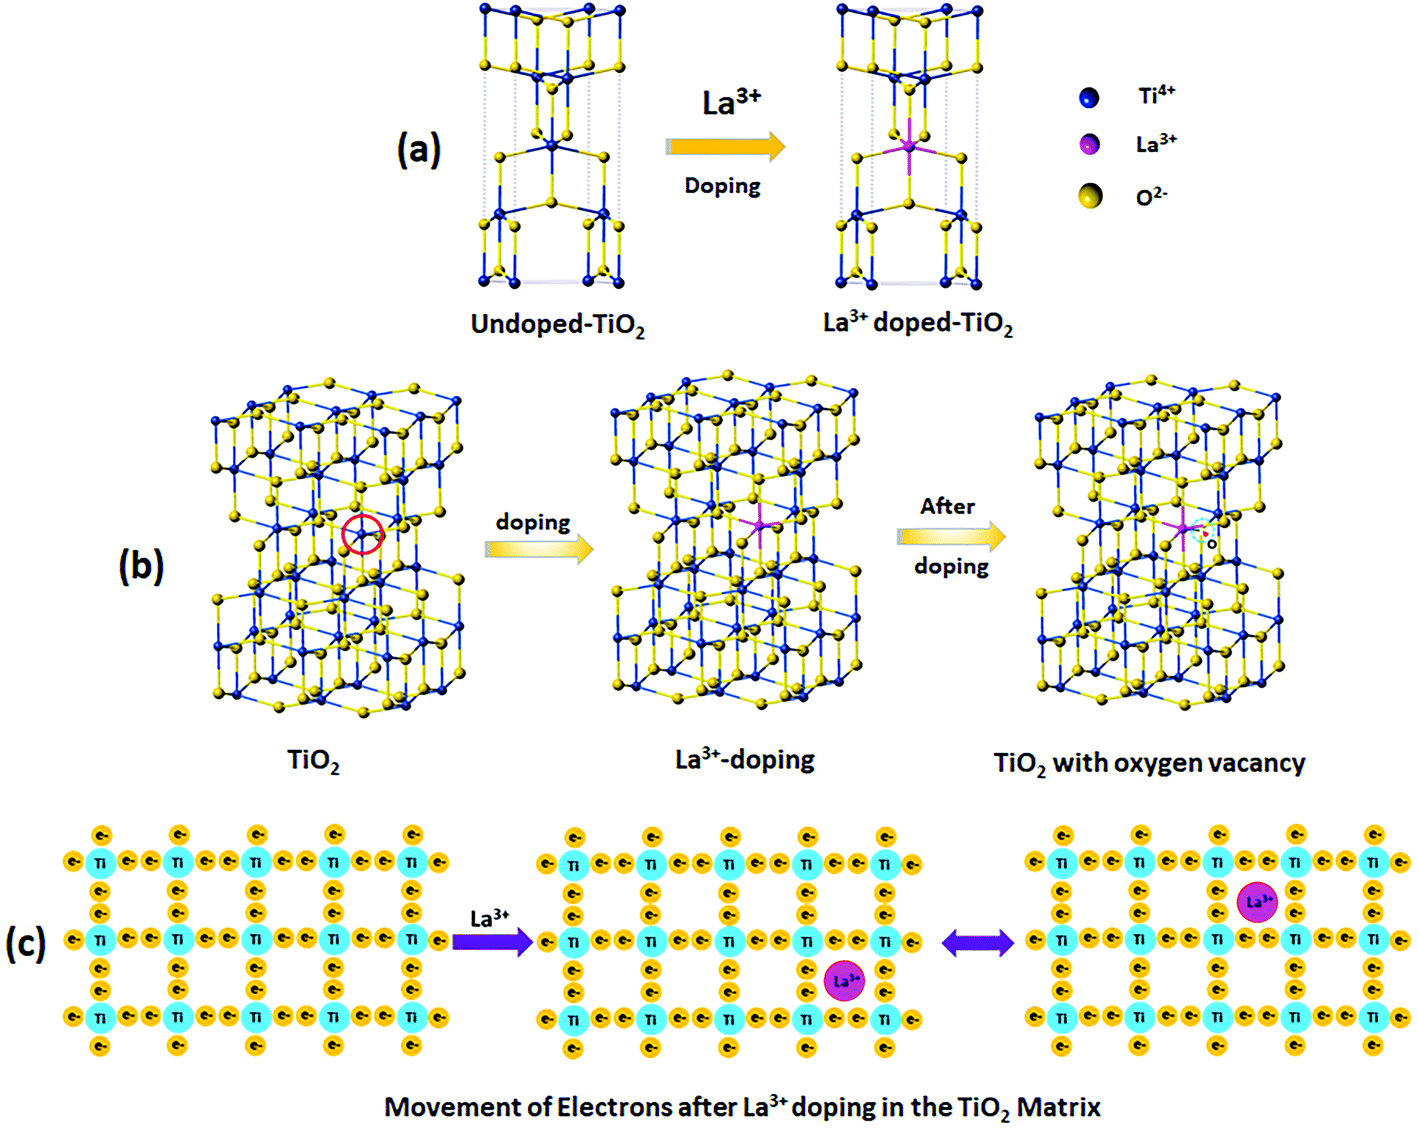
The observed PXRD pattern was correctly correlated with a tetragonal crystal structure with I41/amd symmetry. The crystal structure of anatase and rutile are given in Fig. 1(a). From the XRD pattern, the unit cell parameters can be estimated as a = 3.7842 Å, b = 3.7842 Å, c = 9.5146 Å, and α = β = γ = 90°. The characteristic diffraction peaks of the anatase TiO2 phase were found at 25.6°, 37.9°, 48.1°, 54.5°, 56.0°, 63.5°, 68.2°, 69.7°, and 76.5°, corresponding to the Bragg reflections from the (101), (004), (200), (105), (211), (204), (116), (220), and (215) planes, respectively. Moreover, the specific rutile phase TiO2 NP peak responses were located at 27.5°, and 36.3°, corresponding to the phase responses of (110), and (101), as shown by the orange line in Fig. 1(b). Thus, the observed peak responses of the mixed-phase of TiO2 NPs are in good agreement with the authorized research report (JCPDS: 73-1764). Furthermore, we analyzed the PXRD of La3+ doped TiO2, as shown in Fig. 1(b) (blue line), which clearly shows that there is no evidence for the separate phase formation of La2O3. This suggests that La3+ ions diffused on the surface of the TiO2 matrix as small clusters.27 The ionic radius of La3+ (1.15 Å) is bigger than the ionic radius of Ti4+ (0.68 Å), and La3+ ions cannot enter into the lattice of TiO2; however, Ti4+ ions may enter into the lattice of La2O3, leading to a change in the electronic field of La3+ and an increase in the electron density and a decrease in the binding energy of La3+. So, it can be concluded that the lattice parameters of the TiO2 NPs remain unchanged after doping with La3+ ions due to the ionic radius factor and percentage of La3+ as a monoatomic layer on the TiO2 surfaces, which are not detected by XRD.28,29
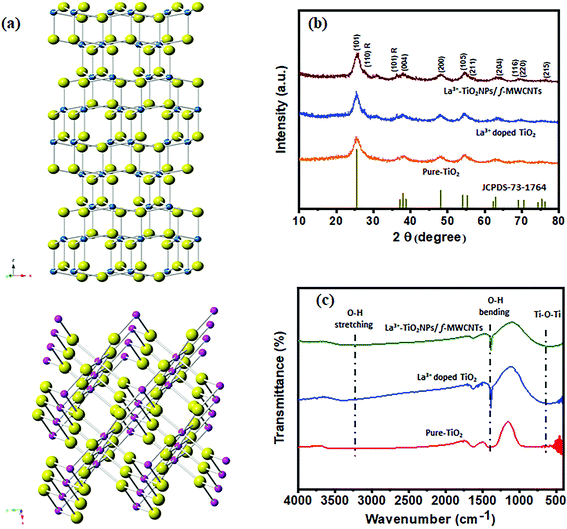 |
| | Fig. 1 (a) The crystal structure of TiO2 (anatase and rutile), (b) X-ray powder diffraction patterns, and (c) FTIR spectra of pure-TiO2, La3+ doped TiO2, La3+ doped TiO2 NP decorated f-MWCNTs. | |
Moreover, the substitution of Ti4+ ions by La3+ ions means that no distortion will take place on the crystal structure of TiO2. The 3D schematic unit cell representation of the undoped TiO2 and La3+ doped TiO2 crystal structures can be seen in Scheme 3(a). Scheme 3(b) shows that the substitution of Ti4+ ions by La3+ ions takes place via doping on the Ti position (La3+Ti), which generates interstitial Ti3+ ions and oxygen vacancies, as shown by eqn (1).
| | | La3+ + Ti4+ + O2− → (La3+Ti + Ti4+ + O2−) + Ti3+ interstitial + O2 | (1) |
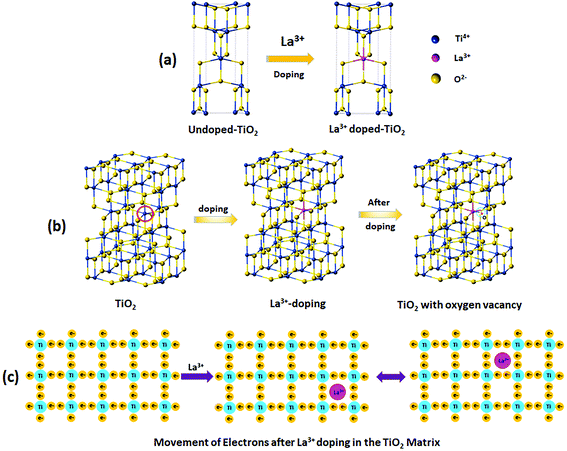 |
| | Scheme 3 (a) 3D schematic unit cell representation of undoped TiO2 and La3+ doped TiO2 crystal structures, (b) the substitution of Ti4+ ions by La3+ ions in the TiO2 matrix, (c) 2D schematic representation of the movement of electrons in the TiO2 matrix after La3+ doping. | |
The addition of a rare earth cationic dopant (La3+) in semiconductors of TiO2 crystals modifies their catalytic behavior due to the bandgap energy (Fig. S1(a)–(c)†), which is related to the movement of electrons. The dopant ion creates an intermediate mid-gap state between the valance band and the conduction band, which causes electron hopping. A 2D schematic illustration of the movement of electrons in the TiO2 crystal matrix after doping with La3+ can be seen in Scheme 3(c). Furthermore, we analyzed the PXRD of f-MWCNTs and La3+ doped TiO2 NP decorated f-MWCNTs. Fig. S1(a)† shows the PXRD of f-MWCNTs, which reveals that the formation of CNTs and high peak intensity vary after the functionalization due to the configuration or extension of a functional group on the boundary edge of the carbon nanotubes.30 In Fig. S2a,† the peaks located at 25.9° and 42.9° show the characteristic diffraction of (002) and (100) f-MWCNTs, which are in good agreement with an earlier report.31
A study of the interplay between f-MWCNTS, TiO2 NPs, La3+ doped TiO2 NPs, and La3+ doped TiO2 NP decorated f-MWCNTs was carried out using Fourier-transform infrared spectroscopy (FT-IR). The acid-treated oxidized multi-walled carbon nanotubes (Fig. S2b†) show noticeable peaks around 1715 cm−1 and 1056 cm−1, contributed by the presence of C![[double bond, length as m-dash]](https://www.rsc.org/images/entities/char_e001.gif) O and C–O stretching vibrations of the carboxylic groups (–COOH).32 Moreover, the relative intensity of the –OH bands at 3445 and 1635 cm−1 shows f-MWCNT associated water molecules and stretching of the carbon nanotube.33,34 The peak at 2919 cm−1 is attributed to the C–H stretching mode of H–CO in the carbonyl group, which shows the presence of a long-chain alkyl molecule.35 The peak at 1715 cm−1 representing the presence of CO and C–O stretching vibrations, reveals that the acid treatments introduce carboxylic groups (–COOH) on the surface of the carbon nanotubes. Also, the FTIR spectra of pure TiO2 (red curve), La3+ doped TiO2 (blue curve), and La3+ doped TiO2 decorated f-MWCNTs (green curve) have been observed in the range between 400 and 4000 cm−1, as shown in Fig. 1(c). This confirms a definite band at 452 cm−1, which has been attributed to Ti–O–Ti that was found in an earlier report.36 Hence, the metal–oxygen vibration of Ti–O was confirmed, which revealed that the TiO2 nanoparticles were successfully formed in the sol–gel synthesis medium. The absorption bands at 3422 and 1386 cm−1 indicate the characteristic vibrations of –O–H stretching and bending vibrations, according to the standard spectra.
O and C–O stretching vibrations of the carboxylic groups (–COOH).32 Moreover, the relative intensity of the –OH bands at 3445 and 1635 cm−1 shows f-MWCNT associated water molecules and stretching of the carbon nanotube.33,34 The peak at 2919 cm−1 is attributed to the C–H stretching mode of H–CO in the carbonyl group, which shows the presence of a long-chain alkyl molecule.35 The peak at 1715 cm−1 representing the presence of CO and C–O stretching vibrations, reveals that the acid treatments introduce carboxylic groups (–COOH) on the surface of the carbon nanotubes. Also, the FTIR spectra of pure TiO2 (red curve), La3+ doped TiO2 (blue curve), and La3+ doped TiO2 decorated f-MWCNTs (green curve) have been observed in the range between 400 and 4000 cm−1, as shown in Fig. 1(c). This confirms a definite band at 452 cm−1, which has been attributed to Ti–O–Ti that was found in an earlier report.36 Hence, the metal–oxygen vibration of Ti–O was confirmed, which revealed that the TiO2 nanoparticles were successfully formed in the sol–gel synthesis medium. The absorption bands at 3422 and 1386 cm−1 indicate the characteristic vibrations of –O–H stretching and bending vibrations, according to the standard spectra.
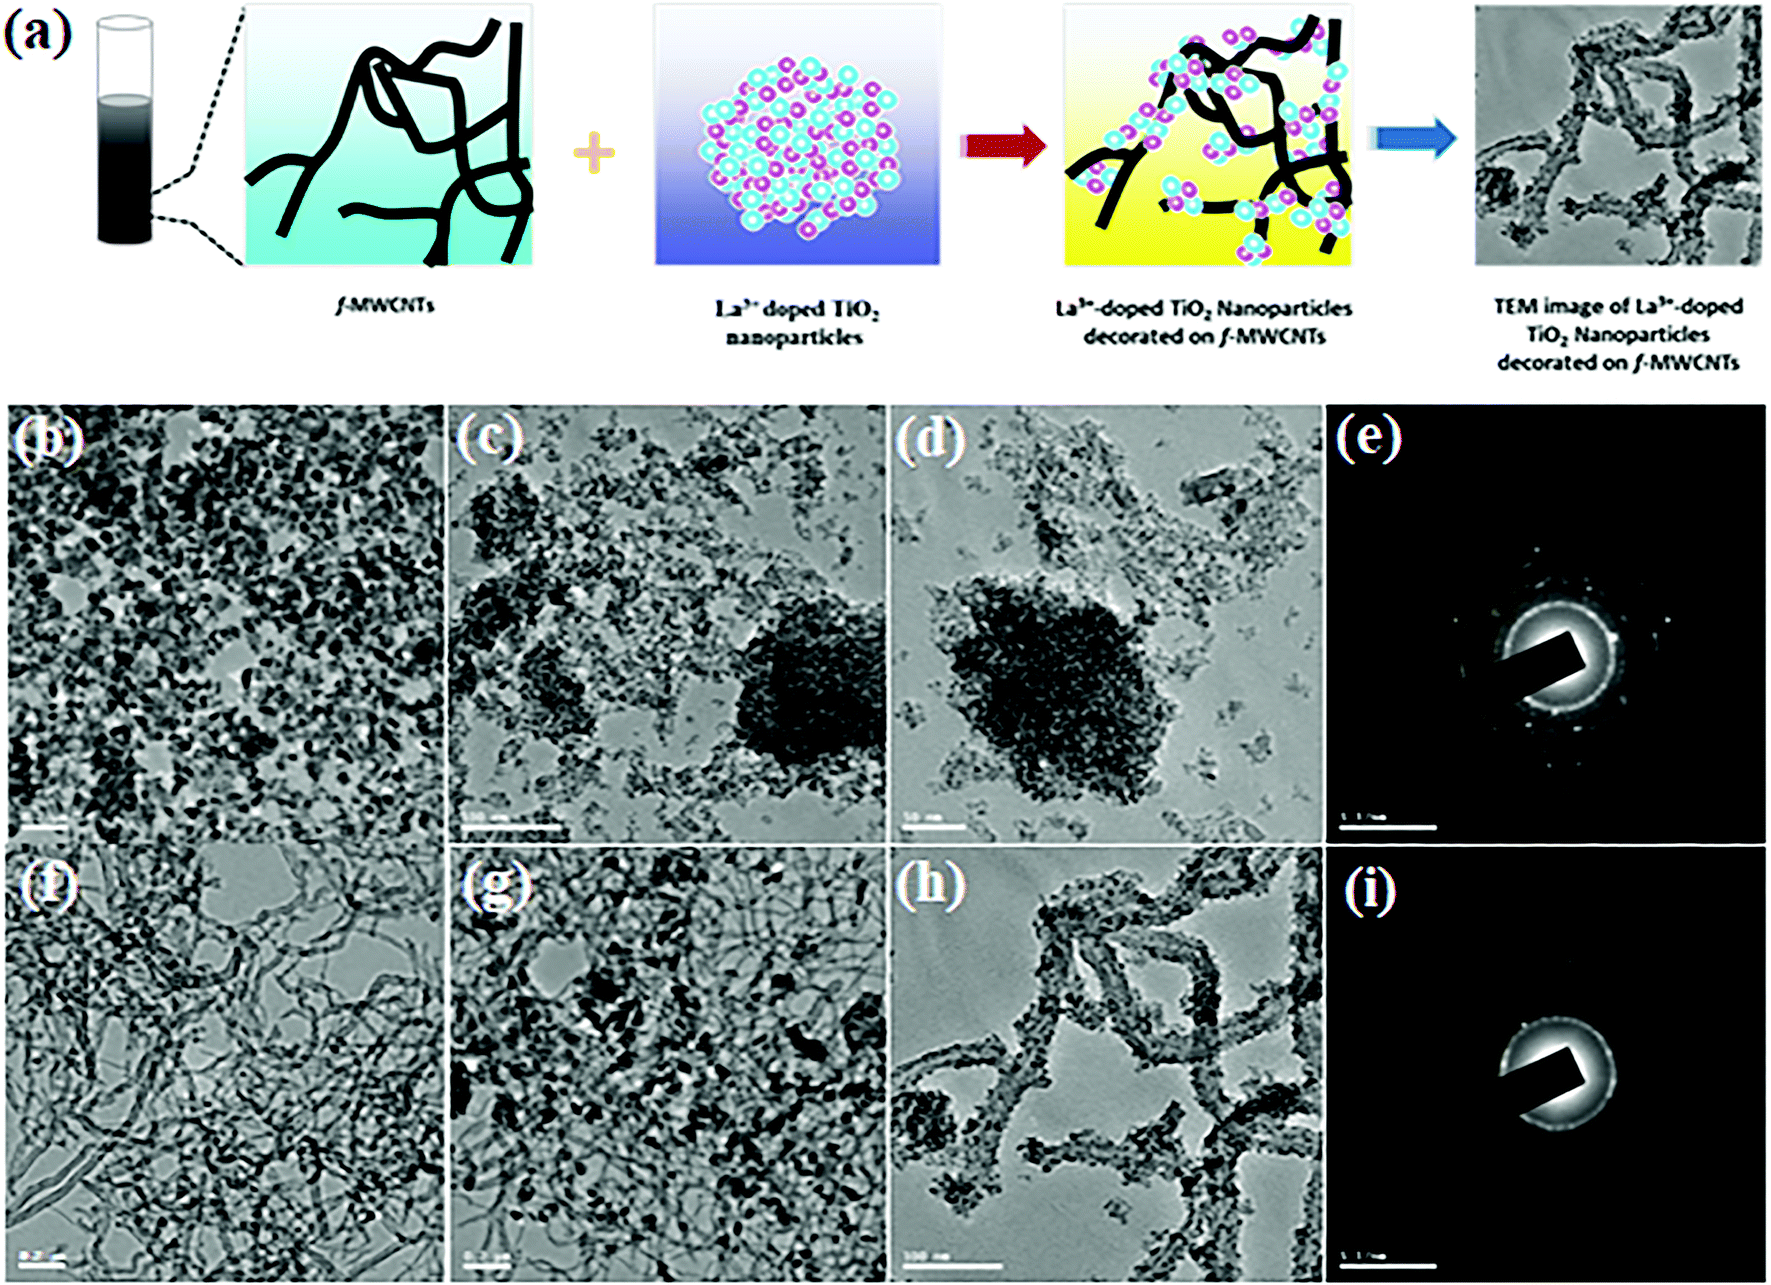
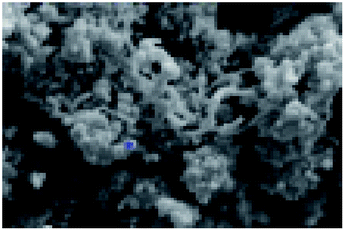
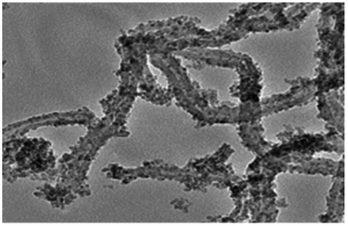
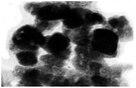
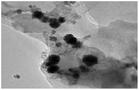
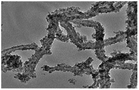
In order to investigate the structural features of f-MWCNTS, TiO2 NPs, TiO2 NP decorated f-MWCNTS, La3+ doped TiO2 NPs and La3+ doped TiO2 NP decorated f-MWCNTs, transmission electron microscopy (TEM) measurements were carried out on all the samples and the results are shown in Fig. 2. A schematic representation of the formation of La3+ doped TiO2 NP decorated f-MWCNTs is shown in Fig. 2(a). The TiO2 NPs can be observed in Fig. 2(b), which shows an average particle size of ≈50–60 nm. Furthermore, the results for undoped TiO2 NPs obtained by high-resolution transmission electron microscopy (HRTEM) are given in Fig. S3(a).† The corresponding d-spacing of the undoped TiO2 NPs was estimated to be 0.381 nm, in good agreement with the line profile patterns of Fig. S3(c).† Fig. S3(b)† shows the lattice SAED patterns of the TiO2 crystalline (101) plane, in which the observed patterns show a good relationship with the PXRD results for TiO2 NPs. In addition, La3+ doped TiO2 NPs were analyzed by TEM measurements at high and low magnification, as shown in Fig. 2(c) and (d). Herein, the La3+ doped TiO2 sol–gel mixed (anatase/rutile) phase NPs consist of densely aggregated crystalline nature, which was roughly estimated to be ≈ 15 nm. The highly crystalline nature was observed from the SAED pattern of La3+ doped TiO2 NPs, as shown in Fig. 2(e). Compared to SAED patterns of pure undoped TiO2 NPs, the La3+ doped TiO2 NPs show dislocations due to electric stress, which may due to the La3+ ions originating in the TiO2 NPs. From the TEM observation, the particle size of the La3+ doped TiO2 NPs has decreased appreciably compared to undoped TiO2 NPs, which reveals that the rare earth element (La3+) preserved the growth of TiO2 NPs, and so reduced particle sizes with higher agglomeration are observed. Furthermore, the TEM finding was systematically observed for f-MWCNTs, f-MWCNTs with undoped TiO2, and La3+ doped TiO2 NP decorated f-MWCNTs, as shown in Fig. 2(f)–(h). Herein, the introduction of f-MWCNTs into the undoped TiO2 NPs and La3+ doped TiO2 NPs favors less extended crystallized domains on f-MWCNTs surfaces, preventing agglomeration and helping more electrolyte ion adsorption and electron transport during electrochemical reactions. Fig. 2(h) shows clear evidence for La3+ doped TiO2 NPs favoring less extended crystallized domains on f-MWCNT surfaces while a comparison with undoped TiO2 reveals that the La3+ doped TiO2 NPs decorated the f-MWCNT active edge surface of the carboxyl group well without any agglomeration. Fig. 2(i) shows the SAED pattern of f-MWCNTs decorated with La3+ doped TiO2 NPs, which shows a ring of polycrystalline nature due to the presence of f-MWCNTs.
 |
| | Fig. 2 (a) Schematic illustration of La3+ doped TiO2 NP decorated f-MWCNTs, TEM image of (b) TiO2 NPs, (c and d) low and high magnification La3+ doped TiO2 NPs, (f) f-MWCNTs, (g) f-MWCNTs/TiO2 NPs, (h) La3+ doped TiO2 NP decorated f-MWCNTs, (e and i) SAED for La3+ doped TiO2 NPs and La3+ doped TiO2 NP decorated f-MWCNTs. | |
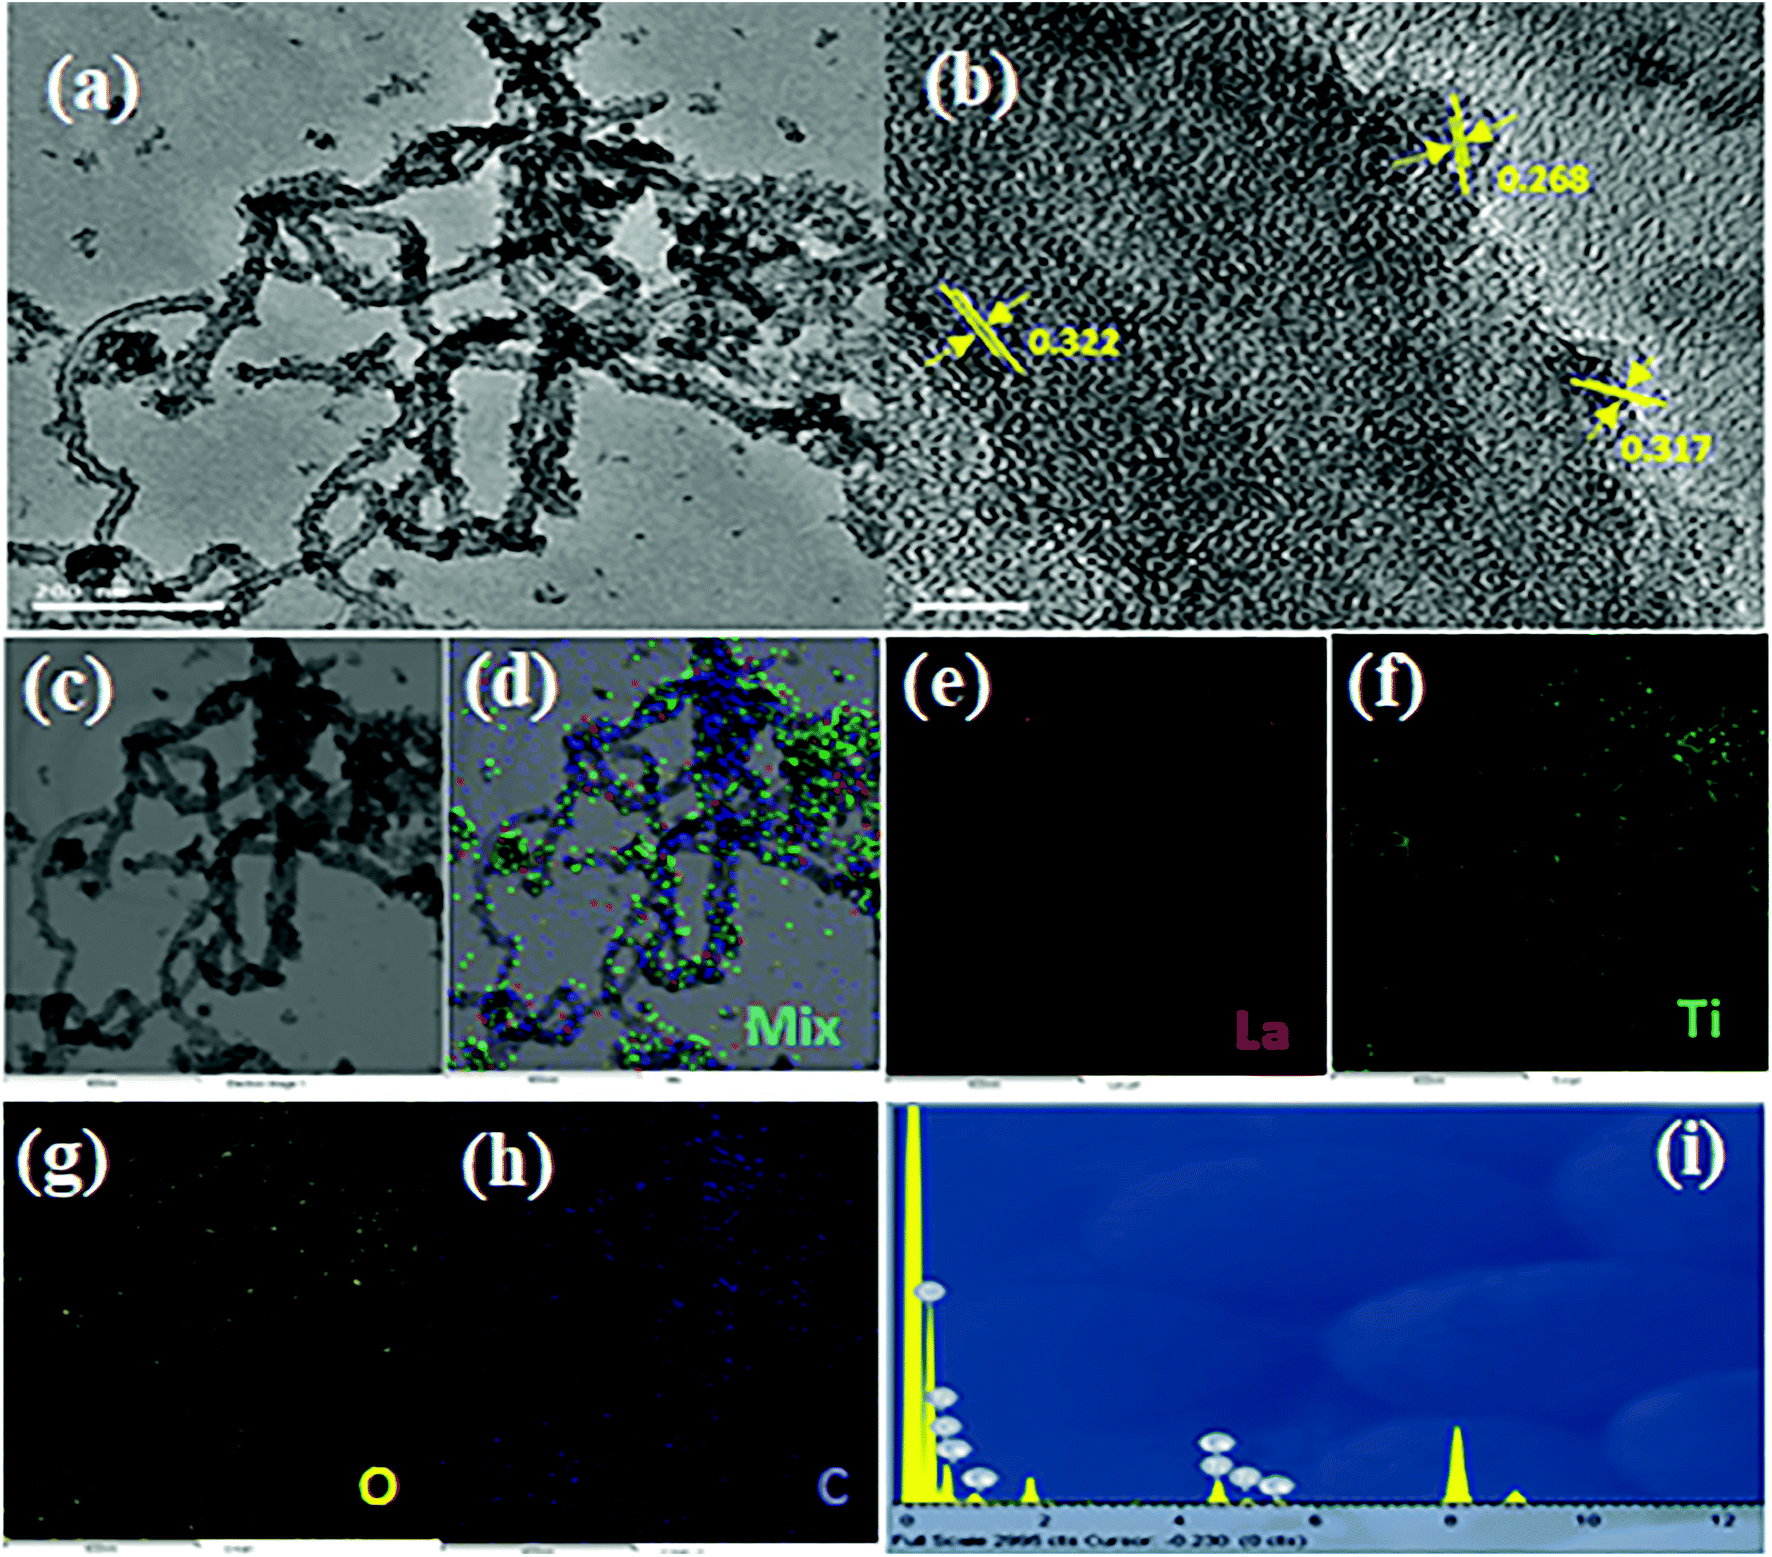
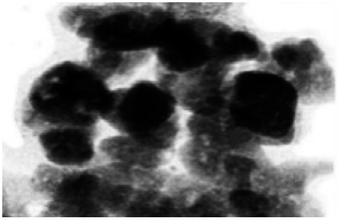
Transmission electron microscopy (TEM) images were used to further investigate new insights into La3+ doped TiO2 NP decorated f-MWCNTs. Noticeably, the HR-TEM image shows the rare-earth cation (La3+) doped on the semiconductors of TiO2 crystals, as shown in Fig. 3(a). The high-resolution TEM image of La3+ doped TiO2 NP decorated f-MWCNTs was analyzed, as displayed in Fig. 3(b). Herein, the La3+ doped TiO2 NPs were decorated on the surface of the f-MWCNTs, as can be seen from Fig. 3(b). The interplanar distance of 0.322 nm corresponds to f-MWCNTs, while the 0.317 and 0.268 nm distances are attributed to the mixed-phase of TiO2 NPs doped with La3+ ions. The prominent interaction between the La3+ doped TiO2 NPs and f-MWCNTs promotes catalytic activity towards an electrochemical sensor.
 |
| | Fig. 3 (a) TEM, (b) HRTEM, (c–h) EDS mapping images, and (i) EDX spectrum of the as-prepared La3+ doped TiO2 NP decorated f-MWCNTs. | |
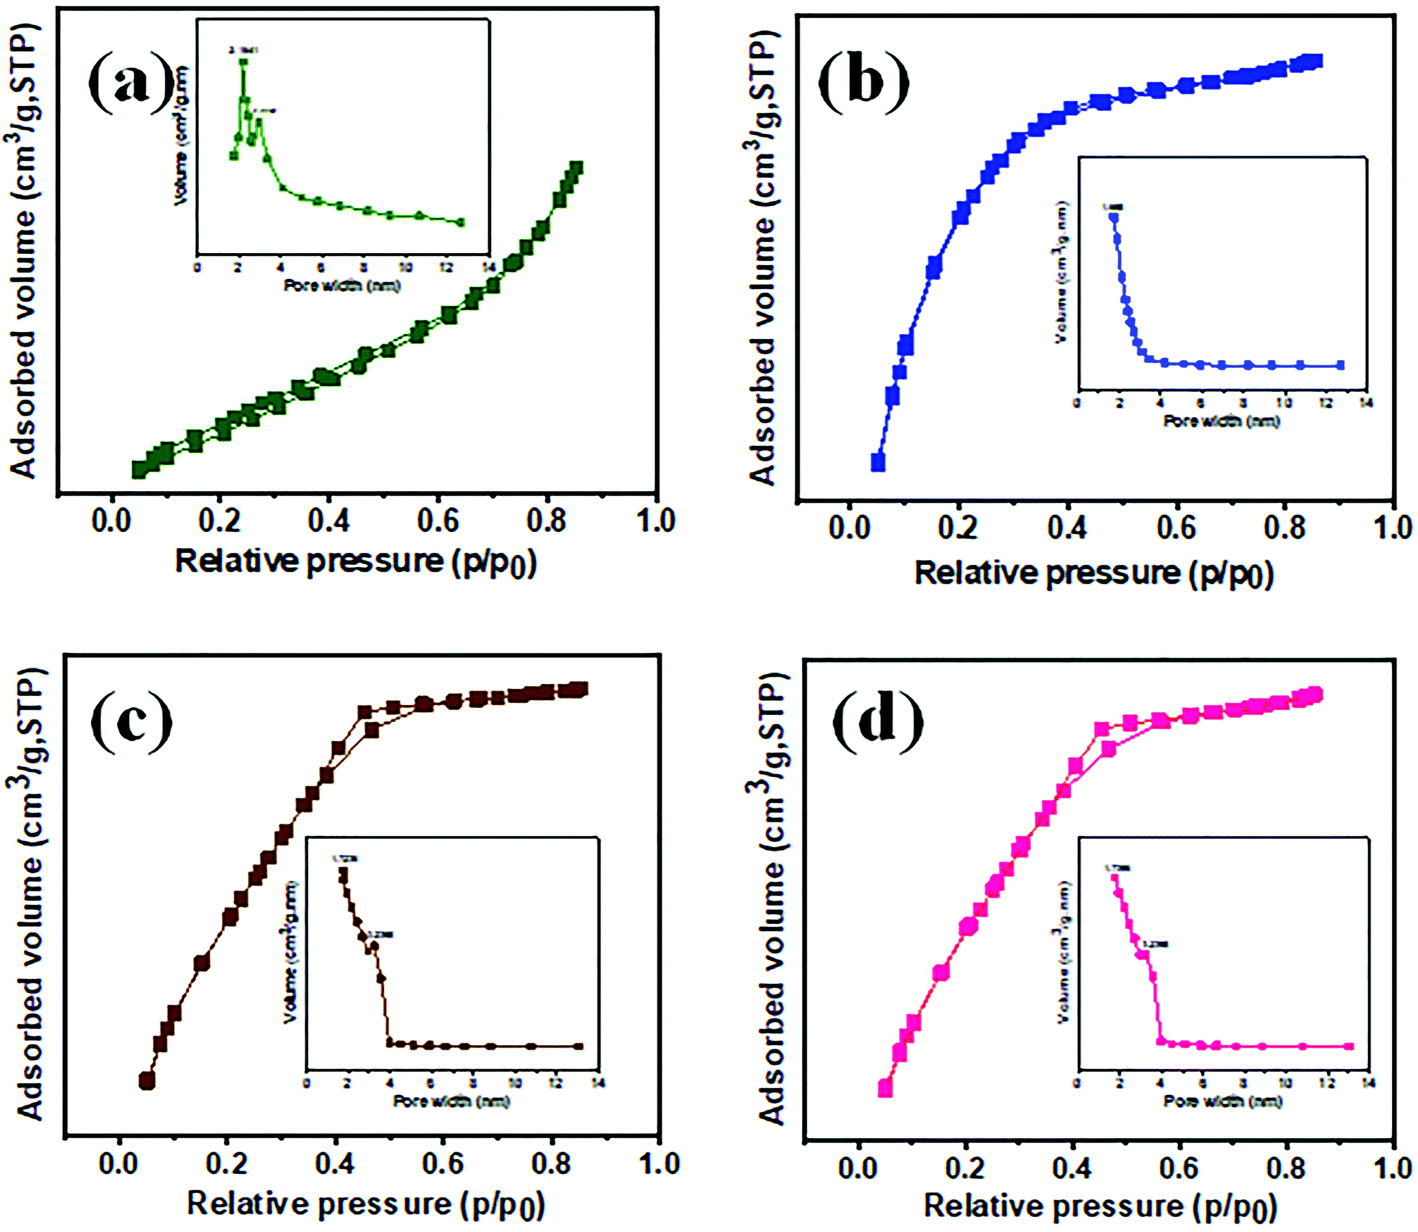
Moreover, to investigate the elemental distribution of lanthanum (La), titanium (Ti), oxygen (O), and carbon (C) in the La3+ doped TiO2 NP decorated f-MWCNTs, energy dispersive X-ray (EDX) spectroscopy-elemental mapping was carried out, as shown in Fig. 3(c)–(h). These elemental maps exhibit the uniform distribution of the identical elements over the La3+ doped TiO2 NP decorated f-MWCNTs. The EDX spectrum of La3+ doped TiO2 NP decorated f-MWCNTs shows the presence of atomic percentages of lanthanum (La), titanium (Ti), oxygen (O) and carbon (C) without any confirmation of additional impurities, as shown in Fig. 3(i). N2 adsorption–desorption isotherm analysis was carried out to understand the porous characteristics of f-MWCNTS, TiO2 NPs, La3+ doped TiO2 NPs, and La3+ doped TiO2 NP decorated f-MWCNTs, as shown in Fig. 4(a)–(d). The specific surface area and pore width were calculated based on the N2 adsorption–desorption isotherms using the Brunauer–Emmett–Teller (BET) method and the Barrett–Joyner–Halenda (BJH) method; the estimated surface area of f-MWCNTs, TiO2 NPs, La3+ doped TiO2 NPs, and La3+ doped TiO2 NP decorated f-MWCNTs were calculated to be 124.7675, 141.0792, 167.0390, and 165.1778 m2 g−1, respectively. These results indicated that La3+ doped TiO2 NPs show a high surface area, and a while after the decoration of f-MWCNTs slight changes were noted, which revealed that the La3+ doped TiO2 NPs attached well on the surface of f-MWCNTs. Moreover, this outcome was effective in making contact with the analyte while electrochemically responding to the electrolyte solution.
 |
| | Fig. 4 The N2 adsorption–desorption isotherms and inset of pore volume of (a) f-MWCNTs, (b) pure-TiO2 NPs, (c) La3+ doped TiO2 NPs, (d) La3+ doped TiO2 NP decorated f-MWCNTs. | |
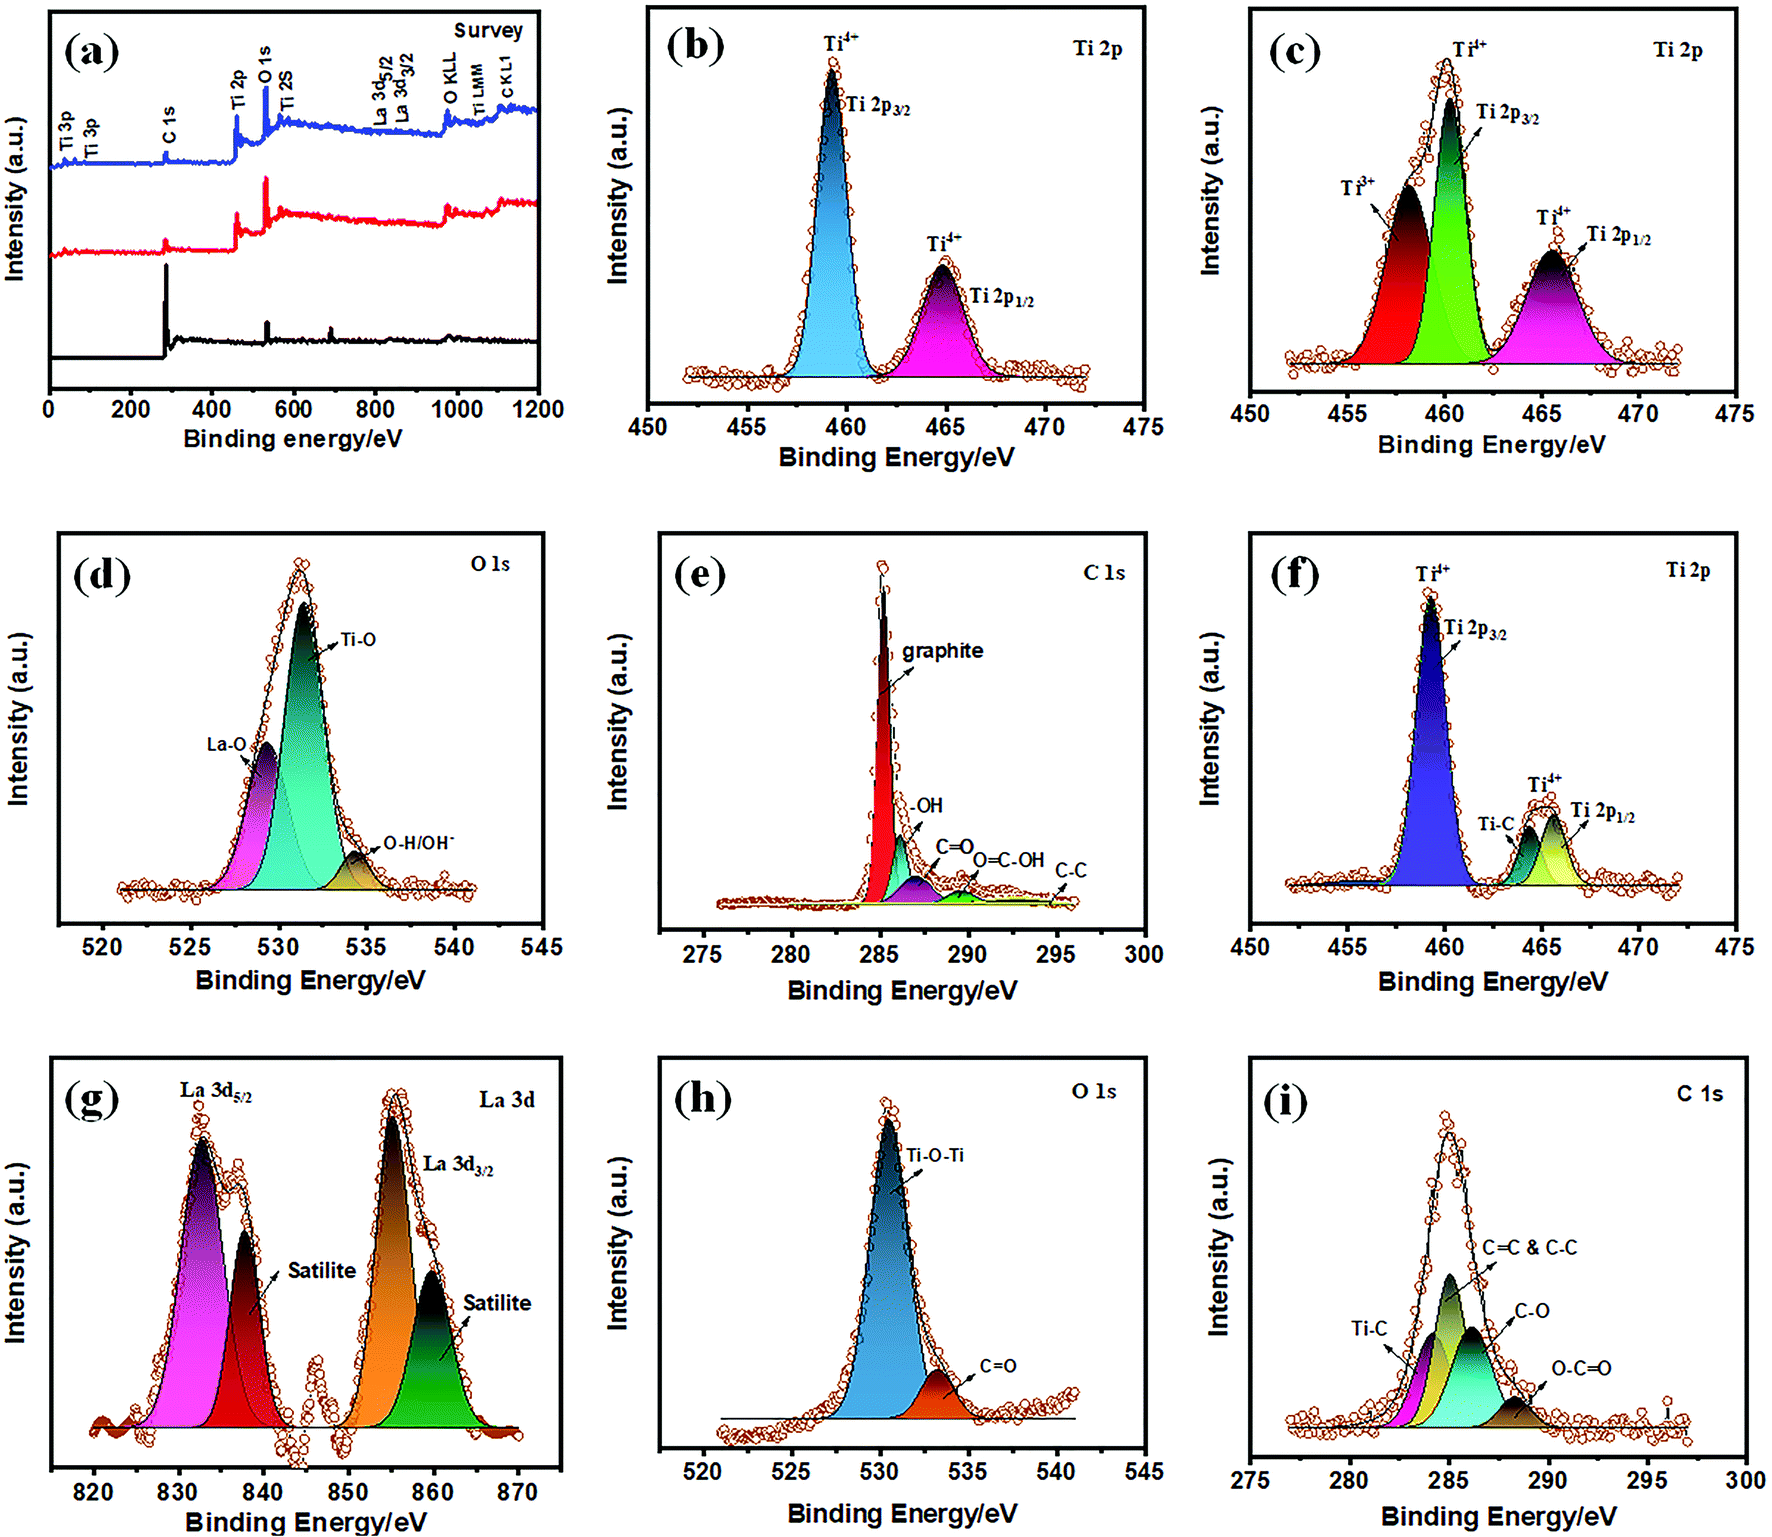
X-ray photoelectron spectroscopic (XPS) analysis further confirms the chemical composition and atomic valence states of f-MWCNTS, TiO2 NPs, La3+ doped TiO2 NPs, and La3+ doped TiO2 NP decorated f-MWCNTs, as shown in Fig. 4. The X-ray photoelectron survey spectra of f-MWCNTS, La3+ doped TiO2, and La3+ doped TiO2 NP decorated f-MWCNTs, as shown in Fig. 5(a), reveal that the signals originated from C, La, Ti, and O. The high-resolution XPS Ti 2p spectrum of TiO2 NPs can be seen in Fig. 5(b), showing peaks at 459.2 and 464.8 eV for Ti 2p3/2 and Ti 2p1/2, respectively. Fig. 5(c) shows the high-resolution XPS spectrum of Ti 2p for La3+ doped TiO2 NPs. The XPS spectra in the core level elements of La3+ and Ti4+ consist of chemical states, which reveals that the interstitials of Ti3+ were observed at 458.1 eV.37 The shift in the binding energy suggests that La3+ may capture electrons from Ti4+ states, provoking the reduction of titanium to a low-valence state.38 The two peaks at 460.2 and 465.4 eV are ascribed to Ti 2p3/2 and Ti 2p1/2, respectively, with a slight shift in binding energy, indicating the presence of Ti4+ species rather than Ti3+ species on the TiO2 surface of La3+ doped TiO2 NPs, which specifies the strong interaction of the La–O–Ti bond between La3+ and the TiO2 matrix.
 |
| | Fig. 5 (a) X-ray photoelectron survey spectrum of f-MWCNTS, La3+ doped TiO2 NPs and La3+ doped TiO2 NP decorated f-MWCNTs, (b and c) high-resolution XPS spectrum of Ti 2p of TiO2 NPs and La3+ doped TiO2 NPs, (d) XPS O 1s spectrum of La3+ doped TiO2 NPs, (e) C 1s spectrum of f-MWCNTS, (f–i) high-resolution XPS spectrum of (f) Ti 2p (g) La 3d, (h) O 1s, (i) C 1s for La3+ doped TiO2 NP decorated f-MWCNTs. | |
Moreover, the high-resolution XPS O 1s spectrum of La3+ doped TiO2 NPs (Fig. 5d) depicts the spectra at 529.3, 531.4, and 534.3 eV, related to there being La–O, Ti–O, and O–H/OH− bonds on the surface of TiO2.39 These pieces of evidence confirm the strong interaction in La–O–Ti bond formation. Furthermore, the high-resolution XPS spectra of f-MWCNTs have peaks at 285.1, 286.1, 287.2, 289.7, and 292.7 eV for graphitic (pure nanotubes), –OH, CO, OC–H, and C–C, as shown in Fig. 5(e).40–42 Herein, the strong intensity peak at 285.1 eV showed the presence of graphitic carbon and an additional weakened bond, indicating more active groups with a COOH structure. In the high-resolution XPS Ti 2p spectra of La3+ doped TiO2 NP decorated f-MWCNTs, shown in Fig. 5(f), the peaks at 459.3 and 465.7 eV are ascribed to Ti 2p3/2 and Ti 2p1/2, respectively. Herein, the notable peaks appearing at 464.3 eV of Ti–C, and the interstitials of Ti3+ disappeared, revealing that the composite of La3+ doped TiO2 NPs was well decorated on the active functional sites (–COOH) of f-MWCNTs. In the high-resolution f-MWCNT decorated La3+ doped TiO2 XPS spectrum of La 3d, shown in Fig. 5(g), the two peaks at 832.7 and 855.1 eV are assigned to two spin orbits of La 3d5/2 and La 3d3/2, respectively. Moreover, the other two peaks at 837.8 and 859.8 eV are La 3d satellite peaks. As we know, there is a general agreement in the literature that the split-spin orbit reflects states with configurations [3d9]hole 4f0 L and [3d9]hole 4f1 [L]hole, where L indicates the oxygen ligand.43 The XPS spectra of La 3d show the satellite peaks at higher energy sides, which caused by the f0 domination at lower binding energy and reflected to be f1 of La, indicating the presence of La into the TiO2 matrix. In the high-resolution XPS spectrum of O 1s, shown in Fig. 5(h), the two O 1s peaks centered at 530.3 and 533.3 eV are assigned to Ti–O–Ti, and CO, and associated with oxygen defects in the TiO2 matrix caused by oxygen vacancies. From the chemical state of the C 1s spectrum (Fig. 5(i)) arise the peaks at 284.1, 285.0, 286.1 and 288.3 eV, which implies the presence of Ti–C, C–C & CC, C–O, and O–CO, respectively.44 These results indicate that the La3+ doped TiO2 NPs were successfully decorated on the f-MWCNTs.
3.2. Electrochemical characterizations
3.2.1. Electrocatalysis of modified electrodes.
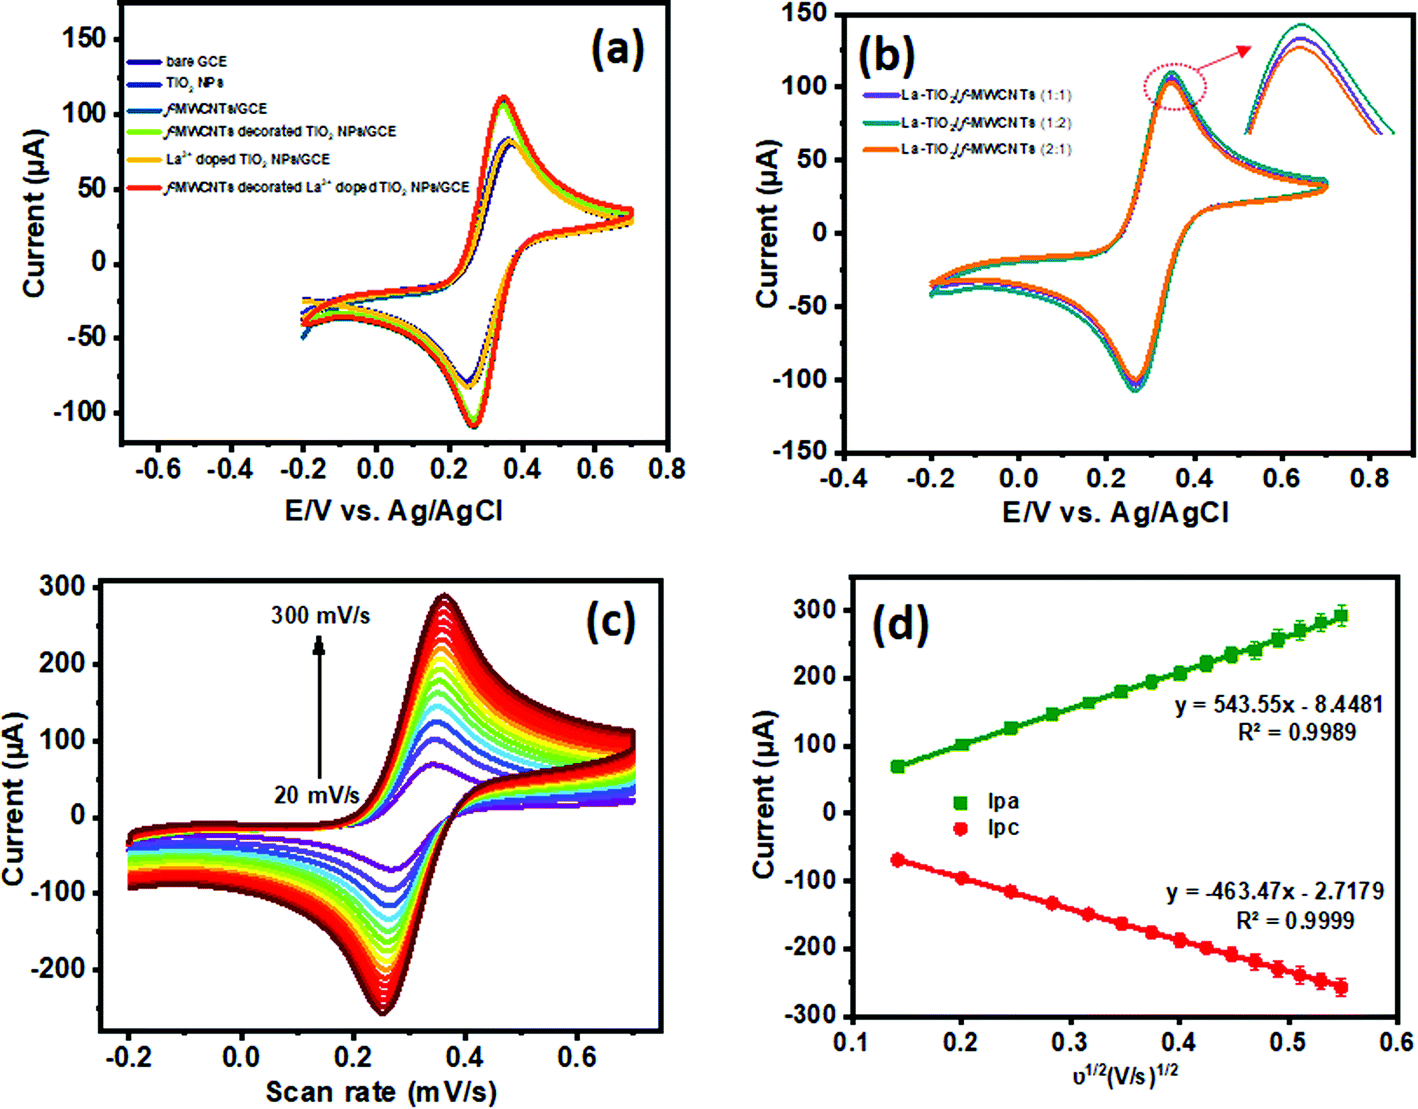
The first task was to analyze and estimate the electrocatalytic response of the individual modified sensors, which were systematically investigated with a 0.1 M KCl; 5 mM [Fe(CN)6]3−/4− redox probe electrolyte. The electrochemical performances of bare GCE, TiO2NPs/GCE, f-MWCNTs/GCE, f-MWCNT decorated TiO2/GCE, La3+ doped TiO2/GCE, and La3+ doped TiO2 NP decorated f-MWCNTs/GCE can be seen in Fig. 6(a). From observation of Fig. 6(a), the La3+ doped TiO2 NP decorated f-MWCNTs/GCE shows a well-defined redox peak current and high electron transfer capability, which are systematically compared with other modified electrodes: f-MWCNT decorated TiO2/GCE, f-MWCNTs/GCE, La3+ doped TiO2 NPs/GCE, TiO2NPs/GCE, and bare GCE. Thus, La3+ doped TiO2 NP decorated f-MWCNTs/GCE modified electrochemical sensors act as efficient electron mediators owing to their excellent electrical conductivity and high specific surface area on the modified GCE surface. The peak-to-peak potential (ΔEp) separations of bare GCE, f-MWCNTs/GCE, TiO2NPs/GCE, f-MWCNT decorated TiO2/GCE, La3+ doped TiO2 NPs/GCE and La3+ doped TiO2 NP decorated f-MWCNTs/GCE are 122.8, 108.5, 81.9, 82, 112.9 and 80.9 mV, respectively. The redox peak current of La3+ doped TiO2 NP decorated f-MWCNTs/GCE is significantly lower than that of bare GCE, f-MWCNTs/GCE, TiO2 NPs/GCE, f-MWCNT decorated TiO2/GCE, or La3+ doped TiO2 NPs/GCE, and shows a well-defined peak current with a noticeable negative peak shift compared to other modified GCE electrodes. Moreover, the La3+ doped TiO2 NP decorated f-MWCNTs/GCE exhibits an Ipa/Ipc value of 1.03, which implies that the [Fe(CN)6]3−/4− redox probe was quasi-reversible. The La3+ doped TiO2 NP decorated f-MWCNTs/GCE obtained definite peak current responses compared to other modified sensors, such as TiO2 NPs/GCE, La3+ doped TiO2 NPs/GCE, or bare GCE, which demonstrates that La3+ doped TiO2 NPs are very attracted to the surface of f-MWCNTs. These factors must be strongly influenced by the current enhancement with fast electron transfer in the electrode–electrolyte system. These results demonstrate that the La3+ doped TiO2 NP decorated f-MWCNTs/GCE exhibits active electron transfer ability, excellent electrical conductivity, and high surface area on the GCE electrode surfaces. Fig. 6(b) shows the different ratios (1:1, 1:2, and 2:1) of La3+ doped TiO2 NP decorated f-MWCNTs modified GCE that were used to analyze the electrode surface catalytic activity in the presence of a [Fe(CN)6]3−/4− redox probe at 50 mV s−1. The La3+ doped TiO2 NP decorated f-MWCNT modified GCE (1:2 ratio) shows much more electron transfer capability compared to other ratios. Due to this factor, we preferred a (1:2) ratio for the modified electrode in the electrocatalytic analysis. Furthermore, the electrochemically active surface area of the modified electrode was calculated from the Randles–Sevcik equation, as can be seen in eqn (2):45| | | ip = 2.69 × 10⁵n3/2AD1/2Cν1/2 | (2) |
where ip is the peak current (A), A is the electrochemically active area (cm2), n is the number of electrons transferred, C is the concentration of electroactive species (mol cm−3), D is the diffusion coefficient (cm2 s−1), and ν1/2 is the scan rate (V s−1). Thereby, the redox properties of La3+ doped TiO2 NP decorated f-MWCNT modified GCE were observed in the presence of a redox probe ([Fe(CN)6]3−/4−) at various scan rates ranging from 20 to 300 mV s−1, as shown in Fig. 6(c). Fig. 6(d) shows the corresponding calibration plot for current vs. ν1/2 (mV s−1)1/2. From the calculation, the electrochemically active surface area of the GCE modified electrode was calculated to be 1469.0 cm2.
 |
| | Fig. 6 (a) Cyclic voltammetry of 0.1 M-KCl; 5 mM [Fe(CN)6]3−/4− redox probe at bare GCE, f-MWCNTs/GCE, TiO2 NPs/GCE, f-MWCNT decorated TiO2/GCE, La3+ doped TiO2/GCE and La3+ doped TiO2 NP decorated f-MWCNTs/GCE, (b) CV responses of different ratios (1:1, 1:2, and 2:1) of La3+ doped TiO2 NP decorated f-MWCNTs/GCE nanocomposite in the presence of 0.1 M KCl; 5 mM [Fe(CN)6]3−/4− redox probe, (c) CVs obtained for La3+ doped TiO2 NP decorated f-MWCNTs/GCE nanocomposite with different scan rates (20–300 mV s−1), (d) corresponding calibration plots for current vs. ν1/2 (mV s−1)1/2. | |
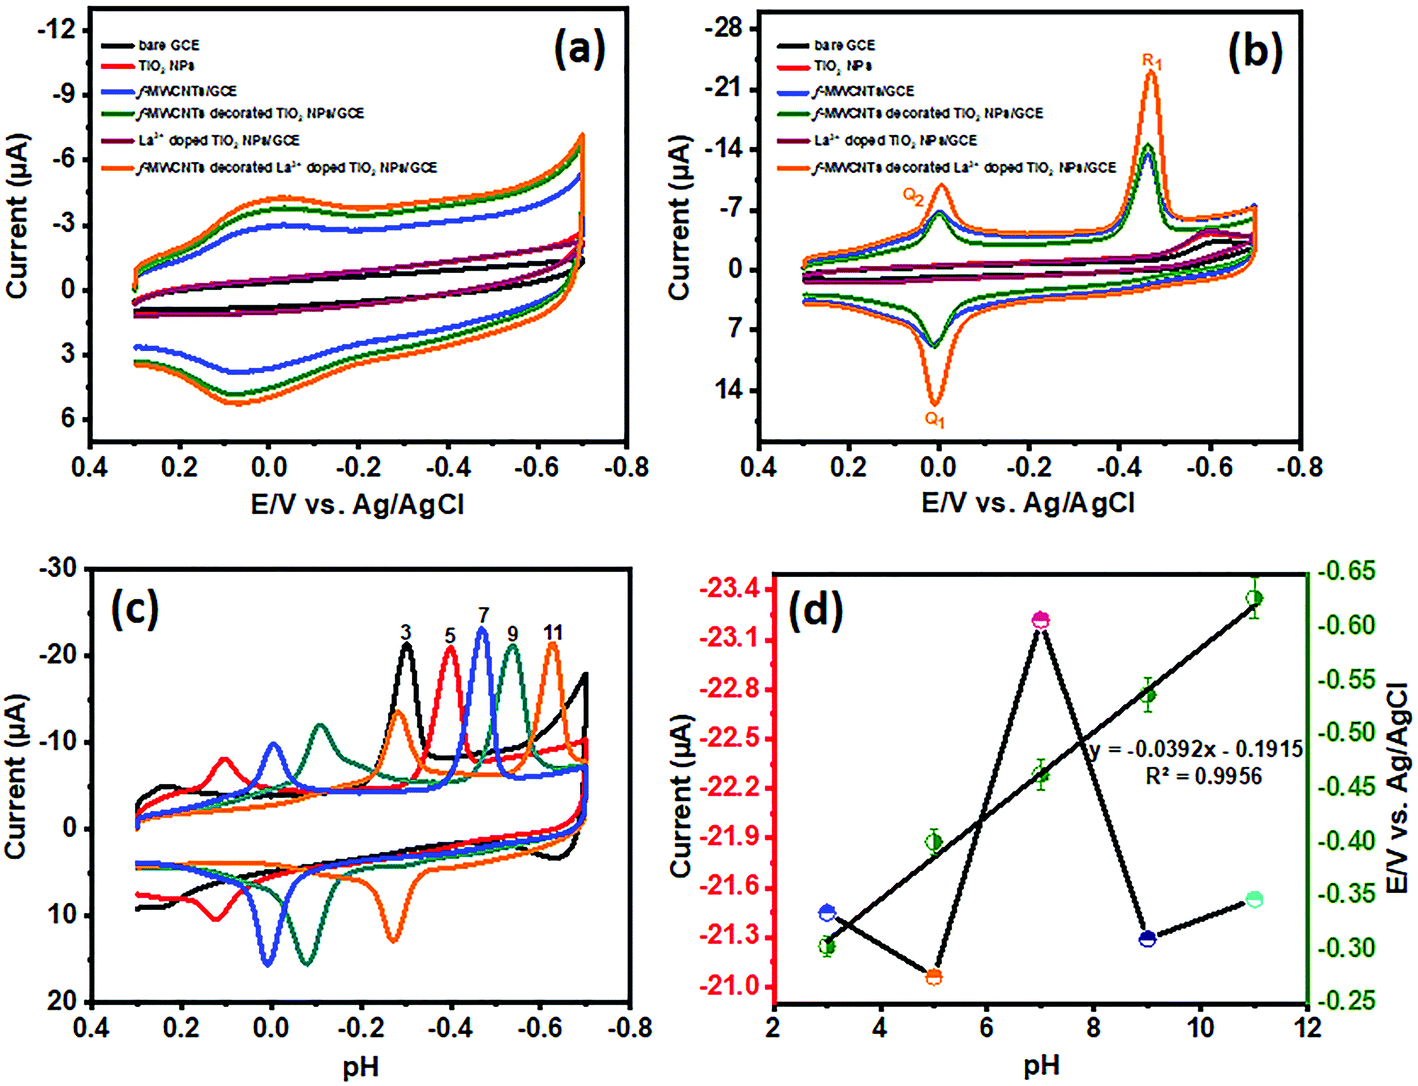
The electrochemical sensor has a vital role in monitoring the type and level of pollution. Notably, the sensing performance of a chemically modified electrode depends upon its electrode–electrolyte activity in the presence and absence of the analyte. Herein, we use paraoxon-ethyl (PE) for the electrocatalytic analysis of the sensing performance of the modified electrode, in order to monitor the pollutant in an environmental eco-system. Fig. 7(a) and (b) show the CV electrocatalytic behavior of bare GCE, TiO2 NPs/GCE, f-MWCNTs/GCE, f-MWCNT decorated TiO2 NPs/GCE, La3+ doped TiO2 NPs/GCE and La3+ doped TiO2 NP decorated f-MWCNTs/GCE in the absence and presence of PE (50 μM), evaluated with 0.05 M phosphate buffer (PB) solution at a scan rate of 50 mV s−1. Fig. 7(a) displays the CVs of unmodified and modified GCE electrodes (1 mg mL−1; 6 μL), wherein the modified electrodes of f-MWCNTs/GCE, f-MWCNT decorated TiO2 NPs/GCE, and La3+ doped TiO2 NP decorated f-MWCNTs/GCE show a high background capacitance. It can be seen from Fig. 7(a) that the modified electrodes of TiO2 NPs/GCE and La3+ doped TiO2 NPs/GCE show very low capacitance, which suggests that there is not that much corresponding increase in capacitance when La3+ is introduced into the TiO2 NPs at a scan rate of 50 mV s−1. In particular, the carbon materials are much attracted, resulting in a greater surface area, and the capacitance of f-MWCNTs/GCE showed a similar response to f-MWCNT decorated TiO2 NPs/GCE and La3+ doped TiO2 NP decorated f-MWCNTs/GCE electrode. Thus, these indicate the synergetic effect generated on the f-MWCNT decorated TiO2 and La3+ doped TiO2 NP modified GCE electrode. Notably, the La3+ doped TiO2 NP decorated f-MWCNT modified GCE electrode exposes a highly active surface to the electrolyte, and the intermediate layer of f-MWCNTs ensures super electrical conductivity towards the electrode–electrolyte system. The layered structures of f-MWCNTs facilitate fast electron transportation and ion diffusion within the modified electrode, which is helpful for the use of the electroactive materials, improving their capacitive performance and enhancing their catalytic activity.
 |
| | Fig. 7 (a and b) CVs of bare GCE, TiO2 NPs, f-MWCNTs/GCE, f-MWCNT decorated TiO2 NPs/GCE, La3+ doped TiO2 NPs/GCE and La3+ doped TiO2 NP decorated f-MWCNTs/GCE in the absence and presence of PE (50 μM), (c) CVs of the reduction of PE (50 μM) at f-MWCNT decorated TiO2 NPs/GCE at various pH values ranging from 3.0 to 11.0, and (d) the corresponding PE reduction peak current and potential responses vs. different pH values. | |
Furthermore, for the unmodified and modified GCE electrodes evaluated with PE (50 μM), the electrocatalysis of PE recorded with 0.05 M PB solution at a scan rate of 50 mV s−1, and the CVs are shown in Fig. 7(b). The rate of electro-reduction behavior of PE was used to further evaluate the unmodified and modified electrodes with onset reduction potentials (Eonset). The onset reduction potentials were −0.5084 V for bare GCE, −0.4011 V for f-MWCNTs/GCE, −0.4988 V for TiO2 NPs/GCE, −0.4045 V for f-MWCNT decorated TiO2/GCE, −0.504 V for La3+ doped TiO2/GCE, and −0.4097 V for La3+ doped TiO2 NP decorated f-MWCNTs/GCE. The electrocatalytic activity for PE validation was considered in terms of activation potential (Ep − Eonset). The bare GCE, f-MWCNTs/GCE, TiO2 NPs/GCE, f-MWCNT decorated TiO2/GCE, La3+ doped TiO2/GCE, and La3+ doped TiO2 NP decorated f-MWCNTs/GCE show reductions in peak potential of 113.5, 62.8, 105.6, 58.6, 96.9 and 53.4 mV from the onset potential. Thus, these observations revealed that La3+ doped TiO2 NP decorated f-MWCNTs/GCE gives the most satisfying electrocatalytic performance for PE in terms of reduction potential.
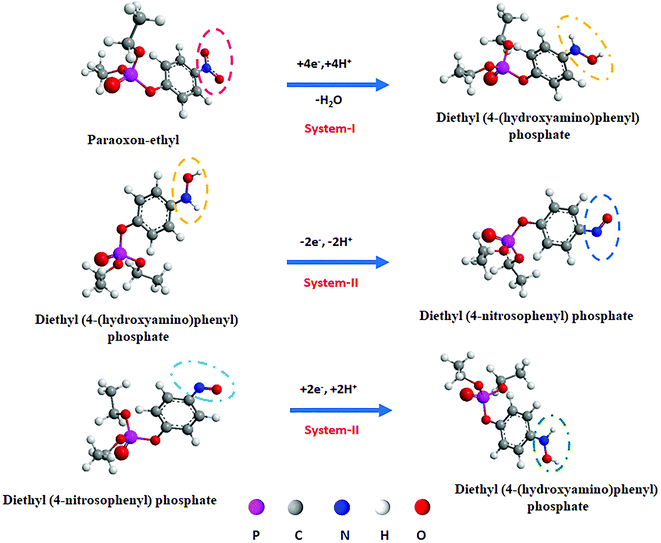
3.2.2. Mechanism of PE reduction.
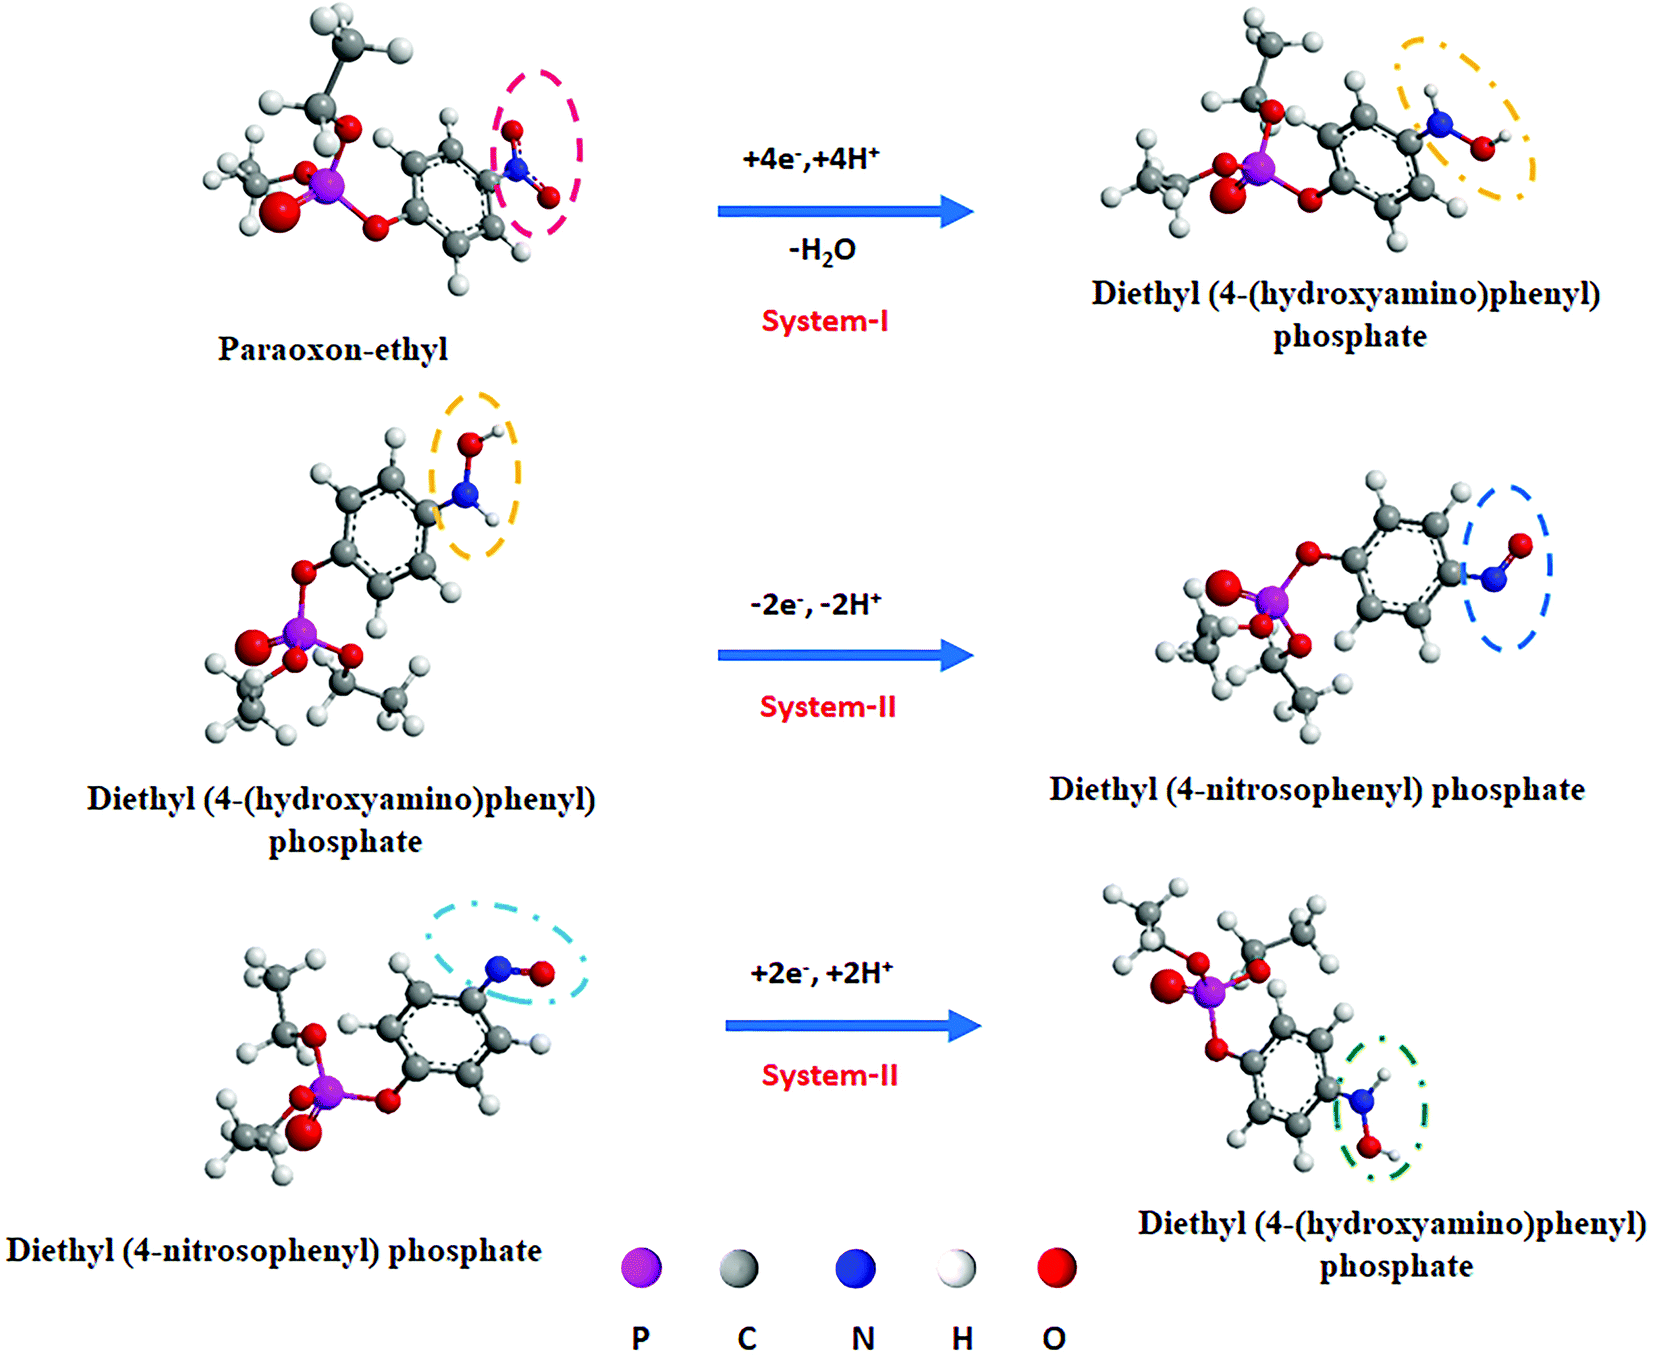
The mechanism of PE reduction was recently demonstrated by Raj Karthik et al. by analysis of the electrochemical sensor.6Fig. 7(b) shows the experimental CV results of PE reduction and redox reaction at the La3+ doped TiO2 NP decorated f-MWCNT modified GCE recorded at a scan rate of 50 mV s−1, which is summarized as a detailed mechanistic overview in Scheme 4. In detail, the electrochemical behavior of PE at the GCE modified electrode shows the reduction peak current (R1) at −0.4707 V. This observed peak initially related to the (irreversible) direct (4 e−; 4H+) electron transfer process, which converts the paraoxon-ethyl (PE) to diethyl(4-hydroxyamino) phenyl phosphate (system I). The clear evidence of Fig. 7(b) shows that no oxidation peak was observed corresponding to the reduction peak of R1 (system I), which revealed that R1 is a direct (irreversible) electron transfer process. Moreover, the redox couples at 0.0083 V (Q1) and 0.0049 V (Q2) are related to the two electron (e−) and two proton (H+) transfer process at the hydroxylamine group (systems II and III). Notably, Fig. 7(b) shows the reversible peaks of diethyl (4-nitrosophenyl) phosphate from diethyl (4-(hydroxyamino)phenyl) phosphate, respectively. Furthermore, the obtained cathodic peak (R1) response of PE is crucial compared with Q2, which is related to the direct and fast electron transfer process. For the choice of an La3+ doped TiO2 NP decorated f-MWCNT modified GCE being favorable to detect PE, it has a lower potential (−0.4707 V) compared to the value from R. Karthik et al. (−0.62)6 previously reported in the literature.
 |
| | Scheme 4 A plausible mechanism for the electrochemical reduction of PE. | |
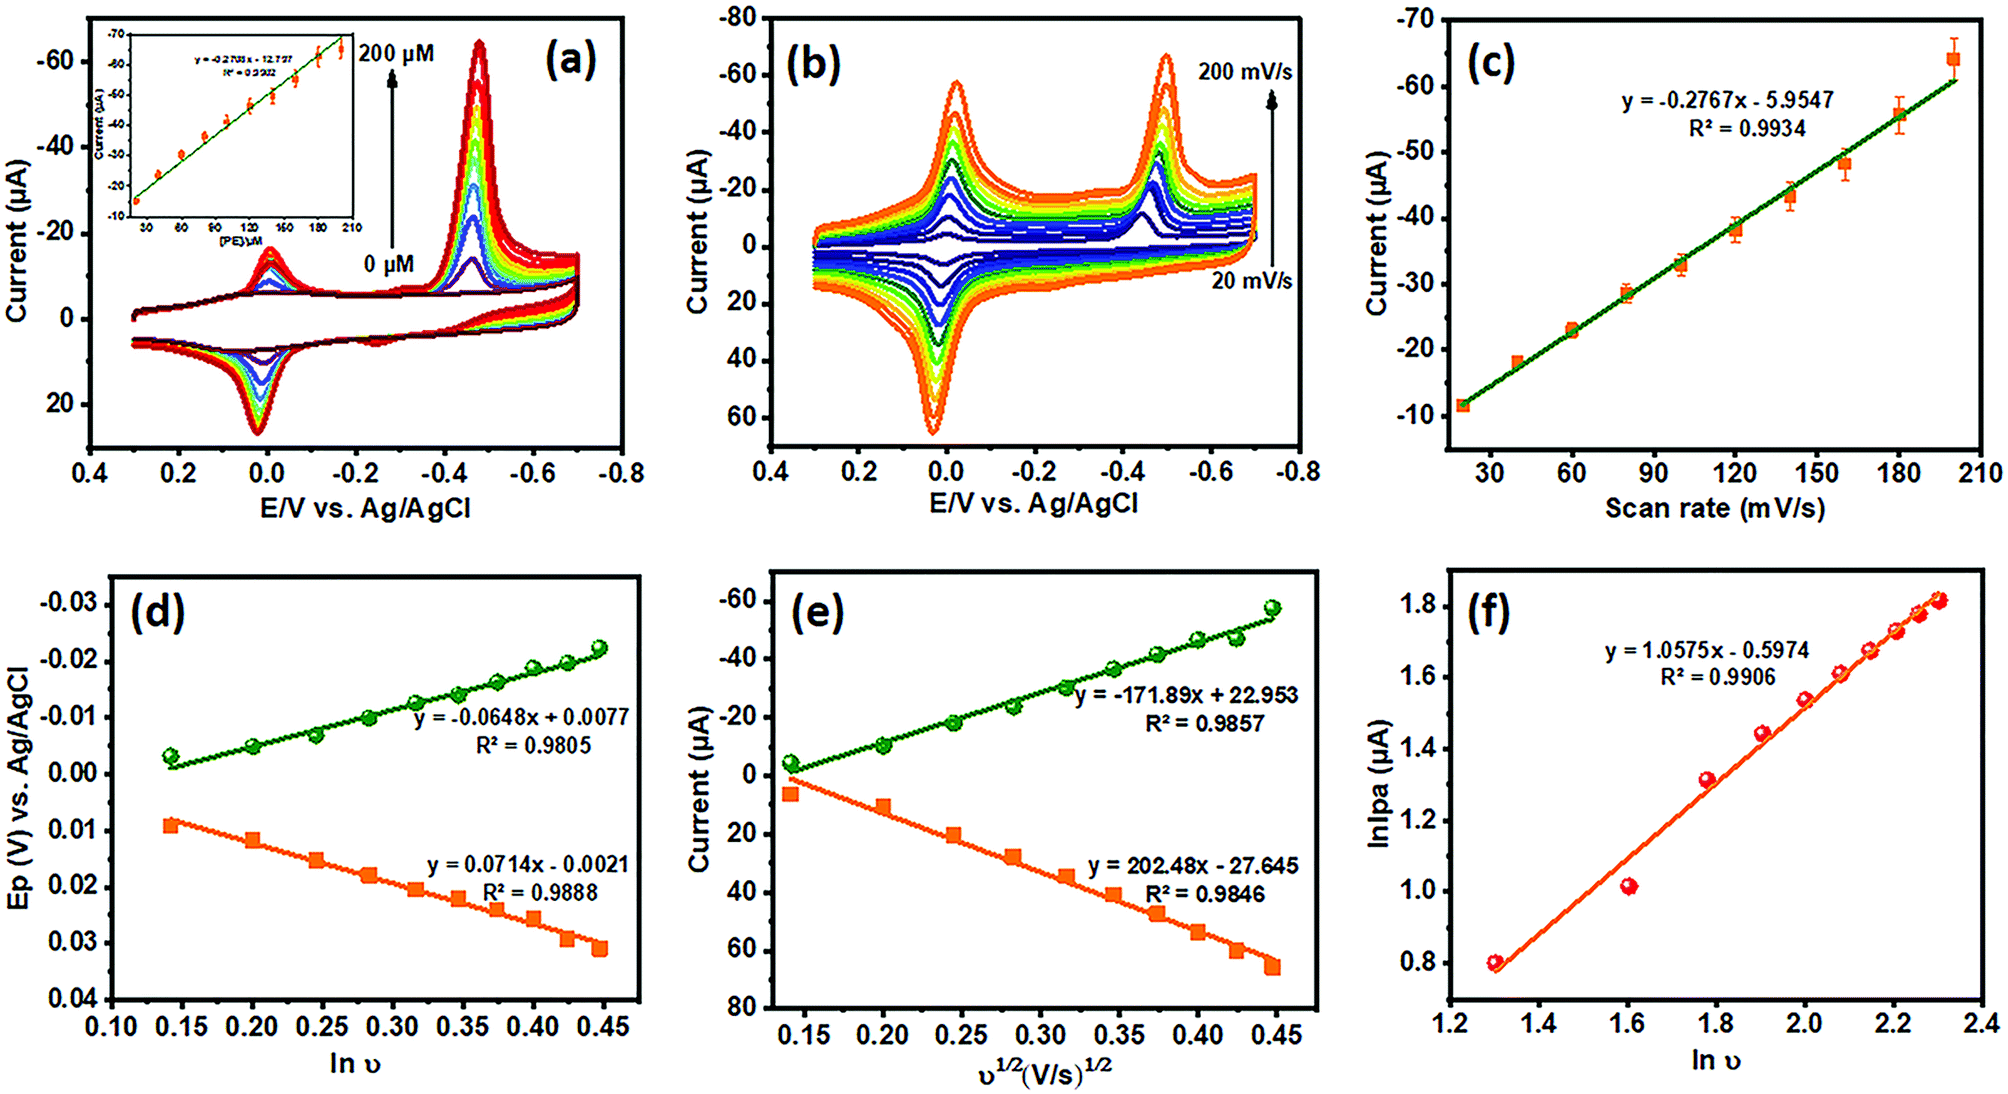
3.2.3. Effect of electrolyte, concentration, and kinetics.
One of the essential determinants of electrolytes is a prominent factor for the catalytic activity of PE in the oxidation and reduction processes at different pH values, which are responsible for the catalytic behavior of La3+ doped TiO2 NP decorated f-MWCNT modified GCE at 50 mV s−1. The CV profiles of electrocatalytic behavior for the La3+ doped TiO2 NP decorated f-MWCNT modified GCE in different aqueous electrolytes (with different pH values) were recorded, and are depicted in Fig. 7(c). This signified that with an increase in pH, the reduction peak potentials shifted towards the positive direction, which suggests that protons were involved in the electrode process. As displayed in Fig. 7(c), the peak current occurred for La3+ doped TiO2 NP decorated f-MWCNT modified GCE at 50 μM (PE) at 50 mV s−1, while a shift in the peak was observed towards the negative direction between the potentials of 0.2 and −0.7 V. To verify the cathodic peak current responses of 50 μM (PE) at the La3+ doped TiO2 NP decorated f-MWCNT modified GCE at different pH (pH values = 3.0, 4.0, 7.0, 9.0, and 11.0), the peak current (Ipc) was plotted against pH, as shown in Fig. 7(d). The cathodic peak current responses of PE show that the neutral medium of PB (pH 7) shows the highest peak current responses compared with others under optimal conditions. Therefore, pH 7 was chosen for all the analytical electrochemical studies. Subsequently, a linear plot of pH vs. Epc was constructed, and the peak potential was found to be linear with pH, obeying the Nernst equation (−0.0392 V/pH; R2 = 0.9956), as displayed in Fig. 7(d).| | | Ep = E0 − (m/n)0.059pH | (3) |
where E0 is the standard potential, and m and n are the numbers of protons and electrons. From the linear plot of Epc (V) vs. pH, the numbers of electrons and protons are equally involved on La3+ doped TiO2 NP decorated f-MWCNT modified GCE for the detection of PE.
The dependence of peak current of PE was analyzed via different concentrations in 0.05 M PB (pH 7) using cyclic voltammetry (CV). To ascertain the effect of PE at the La3+ doped TiO2 NP decorated f-MWCNT modified GCE, the PE concentration was increased to 200 μM, as shown in Fig. 8(a). As displayed in Fig. 8(a), the peak current responses of PE increased gradually when the concentration of PE was increased. Thus, these results suggested that the concentration of PE was directly proportional to the concentration of the analyte (PE). The corresponding peak current responses (with the linear correlation coefficient R2 = 0.9902) are shown in the inset of Fig. 8(a).
 |
| | Fig. 8 (a) CVs of PE at the La3+ doped TiO2 NP decorated f-MWCNT modified GCE for different concentrations from 0 to 200 μM, and (b) the corresponding different cathodic peak current vs. concentration (Ag/AgCl), (c) CVs of the La3+ doped TiO2 NP decorated f-MWCNT modified GCE in 0.05 M PB (pH 7) containing PE (50 μM) for different scan rates (20 to 200 mV s−1), (d) corresponding cathodic peak current responses vs. scan rate (e) peak current (Q1 and Q2) vs. square root of scan rate, (f) log of peak current (Ipa; Q1) plotted vs. the natural logarithm of scan rate (lnν). | |
The electrochemical kinetics of PE were analyzed via different scan rates (20 to 200 mV s−1) at the La3+ doped TiO2 NP decorated f-MWCNT modified GCE, as displayed in Fig. 8(b). Initially, the reduction peak (R1) of PE at 0.4456 V was observed on the modified electrode at an initial scan rate of 20 mV s−1, then with a continuous scan rate the peak potential moved slightly towards the negative side, because of the internal resistance of the adsorbed products. Thus, these irreversible reduction processes were associated with the transfer of 4e−; 4H+, as addressed earlier. Noticeably, the cathodic peak current (R1) of PE increased linearly with an increase in the scan rate; see the corresponding linear calibration plot shown in Fig. 8(c). This linear plot relates to the linear regression equation, shown in eqn (4). Furthermore, after the reduction in PE (peak R1), no corresponding oxidation peak is observed, suggesting that the direct electron transfer (4e−; 4H+) on the La3+ doped TiO2 NP decorated f-MWCNT modified GCE at different scan rates.
| | | Ipc = −0.2767(PE) − 5.9547 (R2 = 0.9934) | (4) |
Fig. 7(b) shows the active redox peaks (Q1/Q2) of diethyl (4-nitrosophenyl)phosphate from diethyl (4-(hydroxyamino)phenyl)phosphate; thereby this was related to the c 2e−; 2H+ transfer process. Fig. 8(d) show the peaks of Q1 and Q2 of potential (Ep) plotted against the natural logarithm of scan rate (lnν). Moreover, Fig. 8(e) shows the resultant peak current (Q1 and Q2) plotted against the square root of the scan rate with the linear correlation coefficient (Ipc; R2 = 0.9857 and Ipa; R2 = 0.9846) followed by the linear regression equation. The results indicate that the electrochemical redox behavior of Q1 and Q2 (systems II and III) at the La3+ doped TiO2 NP decorated f-MWCNT modified GCE electrode was a reversible adsorption-controlled process,46 which is favorable for quantitative applications. Furthermore, the peak potential (Epa: Q1) plotted vs. the natural logarithm of scan rate (lnν) shows a slope of 1.05 (R2 = 0.9906) for the anodic peak (Q1) of PE, as shown in Fig. 8(f). According to the kinetic theory of the electrode reaction (eqn (5)),47 the slope values of logIpavs. log(mV s−1) should be 0.5 V and 1 V for pure diffusion and adsorption-controlled processes.
where
Ipa is the oxidation peak current (A),
ν is the scan rate (mV s
−1), and
x corresponds to −0.5, and 1, respectively. Moreover, the electron-transfer kinetic parameters, such as electron-transfer coefficient (
α) and apparent charge-transfer rate constant (
Ks) for the reversible processes of Q
1 and Q
2, calculated from the Laviron equation (
eqn (6)–(10)), gave values of 0.8201 and 1.1038 s
−1, respectively.
| | | Epa = E0 + Alnν | (6) |
| | | Epc = E0 − Blnν | (7) |
A =
RT/(1 −
α)
nF;
B =
RT/
αnF| | | Epa = E0 + (RT|(1 − α)nF)lnν | (8) |
| |  | (9) |
| |  | (10) |
where
E0 is the formal redox potential,
n is the number of transferred electrons,
ν is the scan rate, Δ
Ep is the peak-to-peak potential separation, and the other symbols have their usual significance.
3.2.4. Analytical performance.
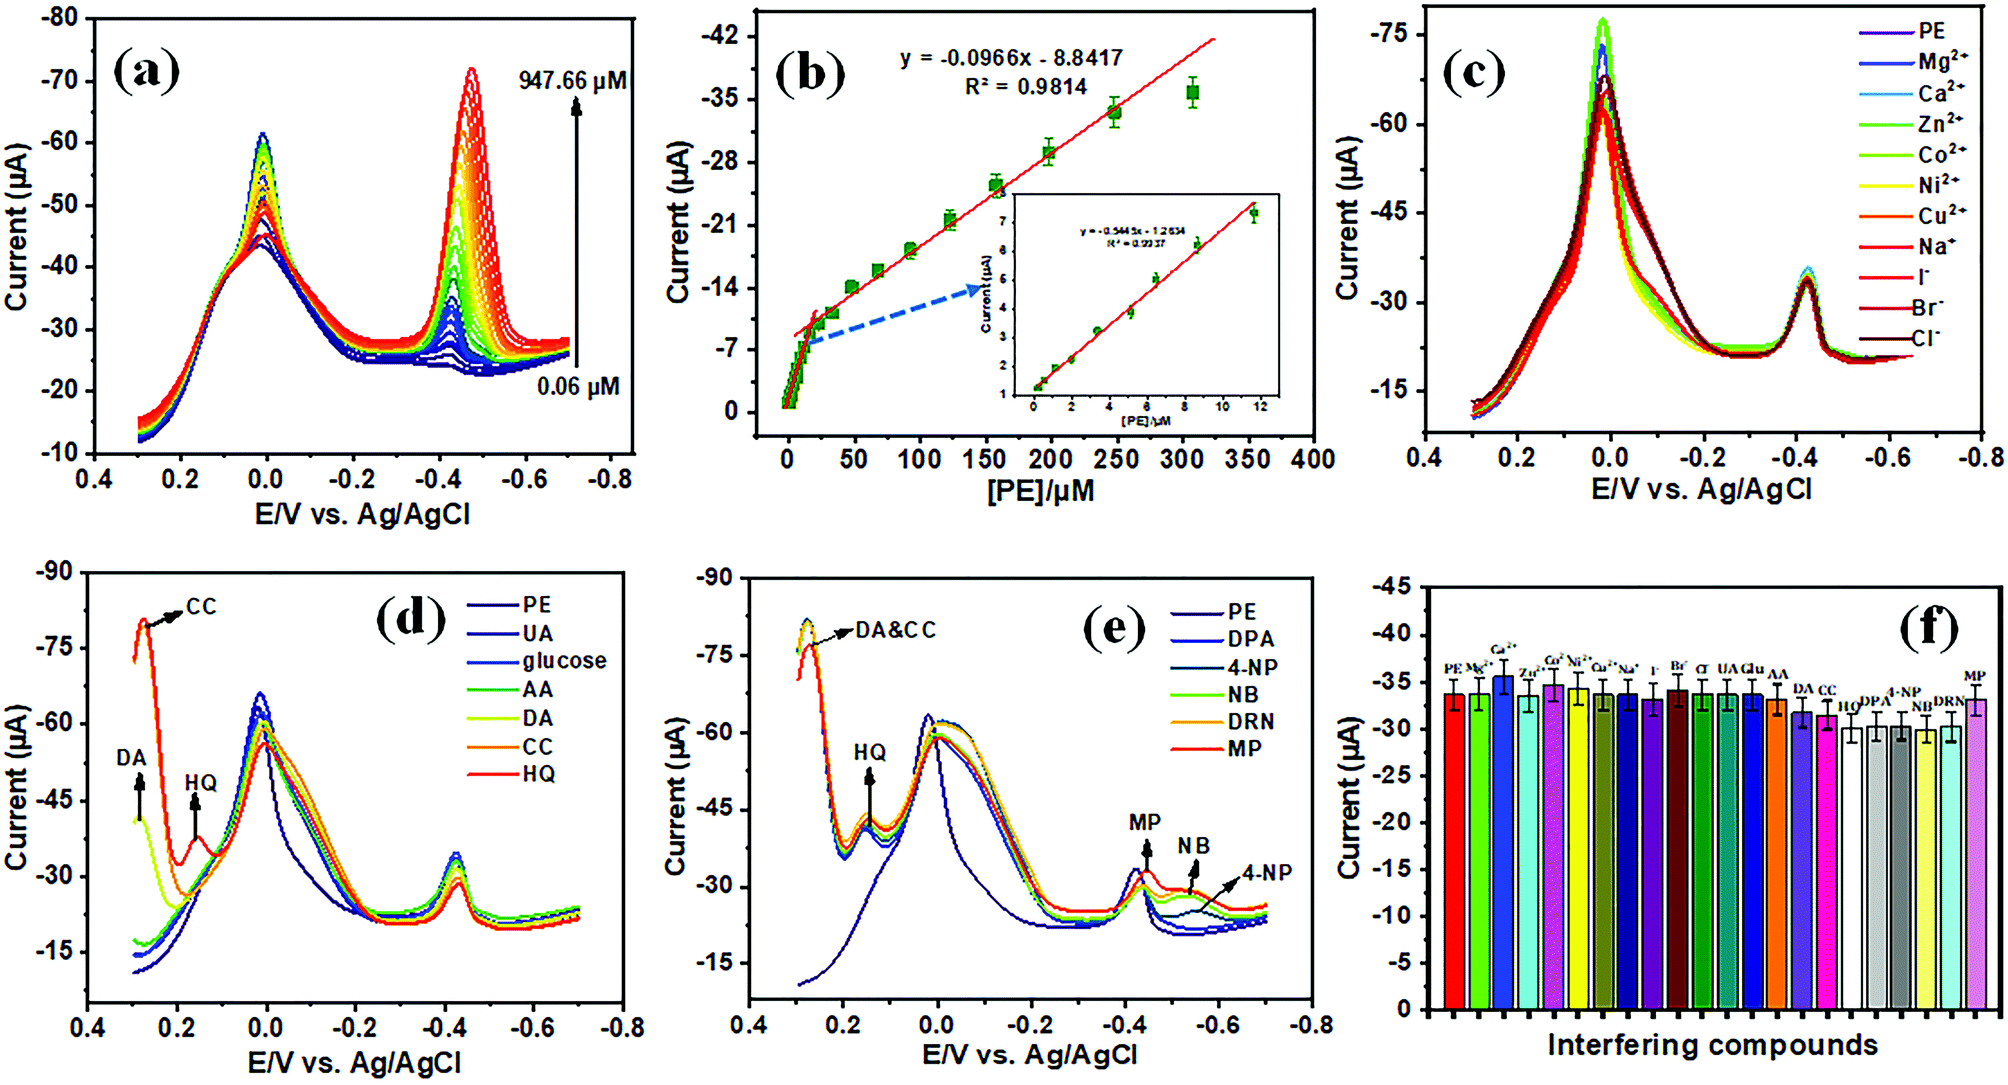
The differential pulse voltammetry (DPV) response of the La3+ doped TiO2 NP decorated f-MWCNT modified GCE electrode was recorded to determine the PE sensing performance by successive additions of PE concentrations (Fig. 9(a)); where the strength of PE increased from 0.06 to 947.66 μM in the presence of 0.05 M PB (pH 7) in a fixed potential window (0.3 to −0.7). Under the selected conditions, the initial concentration of PE (up to 11.66 μM) shows that the cathodic peak (R1) current increases linearly with a linear correlation coefficient of 0.9937, as shown in the inset of Fig. 9(b). For the continuous addition, we observed the reduction peak current with satisfactory linearity from 11.66 to 307.66 μM with a linear correlation coefficient of R2 = 0.9814, as shown in Fig. 9(b). Conversely, the cathodic peak current of PE (Q2) decreased when a higher concentration was reached; this implies that there are no more active sites, which means that due to saturation of PE, the kinetic limitation has been reached on the modified electrode. Furthermore, to estimate the PE performance of the designed electrochemical sensor, it was utilized to consider the sensitivity of the La3+ doped TiO2 NP decorated f-MWCNT modified GCE electrode in terms of the limit of detection (LOD) and limit of quantification (LOQ) for PE detection. DPV is a pulse voltammetry technique that supports an essential function during electrochemical sensing while analyzing traditional sweep systems. The LOD and LOQ of the PE were calculated from the slope value of the calibration plot according to eqn (11) and (12).48where SD is the standard deviation of the blank, B is the calibration sensitivity that is the slope of the linear plot of concentration vs. current. Accordingly, LOD and LOQ were found to be 0.0019 μM and 0.0065 μM. It is worth noting that the sensitivity to PE at the La3+ doped TiO2 NP decorated f-MWCNT modified GCE electrode was found to be 7.6690 μA μM−1 cm−1; which is comparable with values lately reported in the literature, such as YbM/f-CNFs/GCE (2.87 μA μM−1 cm−1)6 and Pd NPs/BNHJ/GCE (2.33 μA μM−1 cm−1).49 These comparison data further indicate that the La3+ doped TiO2 NP decorated f-MWCNT modified GCE electrode shows remarkable electrocatalytic action towards the reduction of PE, and these results are highly comparable with a previously reported PE sensor (Table 1).6,50–54 These observed data further indicate that the La3+ doped TiO2 NP decorated f-MWCNT modified GCE electrode shows very remarkable electrocatalytic action towards PE detection.
 |
| | Fig. 9 (a) DPV responses of the La3+ doped TiO2 NP decorated f-MWCNT modified GCE for PE detection, (b) corresponding linear current responses vs. concentration of PE, (c) DPV response at the La3+ doped TiO2 NP decorated f-MWCNT modified GCE with the addition of 10 μM PE and 200 μM concentrations of interfering species such as Mg2+, Ca2+, Zn2+, Fe2+, Co2+, Ni2+, Cu2+, Na+, I−, Br−, and Cl−, (d) the continuous addition of 100 μM of biological substances of uric acid (UA), glucose (Glu), ascorbic acid (AA), dopamine (DA), caffeic acid (CA), catechol (CC), and hydroquinone (HQ), (e) 30 μM excess of nitro-aromatic and pesticides containing compounds of diphenylamine (DPA), 4-nitrophenol (4-NP), nitrobenzene (NB), diuron (DRN), and methyl parathion (MP), (f) the calibration plot of Ipcvs. interfering compounds. | |
Table 1 Comparison of the electrocatalytic performance of the La3+ doped TiO2 NP decorated f-MWCNT modified GCE electrode towards PE detection with previously reported sensors
| Modified electrodes/methods |
Morphology |
Sensitivity (μA μM−1 cm−2) |
Linear range (μM) |
LOD (μM) |
Ref. |
| CP/OPH (amperometric) |
— |
0.0014 |
4.6–46.0 |
0.9 |
50
|
| CLEC-OPH (amperometric) |
— |
0.025 |
0.50–2.0 |
0.314 |
51
|
| CNT/OPH (amperometric) |
— |
0.025 |
0.25–4.0 |
0.15 |
52
|
| BSA@Cu-SWCNT (SWV) |
|
— |
0.05–35 |
0.0128 |
53
|
| Gr@NiFeSP/GCE (SWV) |
|
— |
0.012–10 |
0.0037 |
54
|
| GCE/YbM/f-CNFs (amperometric) |

|
2.87 |
0.01–12 & 14–406 |
0.002 |
6
|
| PdNPs/BNHJ/GCE (LSV) |
|
2.23 |
0.01–210 |
0.003 |
49
|
| f-MWCNTs/La3+–TiO2/GCE (DPV) |
|
7.6690 |
0.06–11.66 & 11.66–307.66 |
0.0019 |
This work |
3.2.5. The selectivity of the La3+ doped TiO2 NP decorated f-MWCNT modified GCE for PE sensing.
Selectivity is known to be another attribute of a proposed sensor; therefore, the DPV of the La3+ doped TiO2 NP decorated f-MWCNT modified GCE electrode was examined for PE (10 μM) with some non-specific cations including Mg2+, Ca2+, Zn2+, Fe2+, Co2+, Ni2+, Cu2+ and so on. Herein, after the successive addition (200 μM) of interfering substances, there was no reasonable current augmentation caused by adding the species of metal ions, as displayed in Fig. 9(c). This shows that the introduction of unusual species of metal ions does not influence the sensing performance during PE sensing. Subsequently, the continuous addition of an 100 μM excess of biological substances of uric acid (UA), glucose (Glu), ascorbic acid (AA), dopamine (DA), caffeic acid (CA), catechol (CC), and hydroquinone (HQ) was introduced; the interfering compounds of biological substances give corresponding peak responses to their original potential of individual species during the interference study, although no reasonable interaction was observed during PE sensing, as shown in Fig. 9(d). Ultimately, with the consecutive addition of nitro-aromatics, and pesticides containing species (30 μM) of diphenylamine (DPA), 4-nitrophenol (4-NP), nitrobenzene (NB), diuron (DRN) and methyl parathion (MP) in the presence of PE, we observed less than ±5% error during the interference study, as shown in Fig. 9(e). The calibration plot of Ipcvs. interfering compounds of metal ions, biological substance, nitro-aromatics, and pesticide compounds is presented in Fig. 9(f). Thus, this result exhibited that the extensive addition of interfering species will not affect the real-time detection of PE at the front of the La3+ doped TiO2 NP decorated f-MWCNT modified GCE electrode. Accordingly, sensing of paraoxon-ethyl (PE) is most effective for the employed potential window of 0.3 to −0.7 V, and in particular sensing onto the La3+ doped TiO2 NP decorated f-MWCNT GCE electrode results in an exceptional development in electrochemical sensing performance for PE.
3.2.6. Reproducibility and stability study.
The accurate detection of pesticide (PE) is necessary to investigate the reliability of the proposed sensor. Therefore, the reproducibility of the GCE electrode was analyzed with different modified electrodes using La3+ doped TiO2 NP decorated f-MWCNTs under similar experimental conditions by adding 50 μM of PE within the potential window of 0.3 to −0.7 V; which are explored by CV techniques (Fig. S4†). The current responses were measured with the relative standard deviation (RSD) of the proposed sensing performance for the individual current response being estimated at 2.39%, revealing that it gives reliable sensing activity with good reproducibility. Moreover, the proposed sensor was analyzed for stability; the reduction peak current responses of PE (50 μM) were recorded at 50 mV s−1 by the CV technique. Herein, the stability measurement was carried out three times within 30 days; meanwhile, the fabricated GCE electrode was kept in PBS (pH 7) at ≈4 °C. The proposed sensor was observed to hold 87.4% of its initial current responses; the suggested sensor gives an outstanding stability response towards PE sensing with an La3+ doped TiO2 NP decorated f-MWCNT developed GCE platform.
3.2.7. Real sample analysis.
The functional applicability of the recommended sensor was analyzed using soil and water samples. However, because these two samples were collected from New Taipei City, Taiwan, where there is no PE contaminant for practical investigation, a standard addition method was applied. So, a known concentration was introduced into the as-taken working sample by the standard addition method. After collecting the PE contaminated sample, we analyzed the practical response of PE by DPV. The obtained recoveries were in the range of 95.8–100.6% (Table 2), indicating that the modified sensor shows satisfactory results.
Table 2 Real-time determination of PE in practical samples using the La3+ doped TiO2 NP decorated f-MWCNT developed GCE sensor
| Sample |
Added (μM) |
Found (μM) |
Recovery (%) |
|
Standard addition method.
Not detected.
|
| Water samplea |
0 |
NDb |
— |
| 5 |
5.03 |
100.6 |
| 10 |
9.95 |
99.5 |
| Soil samplea |
0 |
NDb |
— |
| 5 |
4.79 |
95.8 |
| 10 |
9.76 |
97.6 |
4. Conclusion
In summary, the electrochemical sensing performance and mechanisms are reported for a PE sensor with an La3+ doped TiO2 NP decorated f-MWCNT modified GCE platform. The recommended sensor abilities were greatly enhanced by the conformal doping of La3+ ions into the TiO2 NPs as well as the inclusion of f-MWCNT decorations. The proposed sensor shows an outstanding LOD (0.0019 μM) performance and exceptional sensitivity (7.6690 μA μM−1 cm−2) on an as-presented catalytic platform of an La3+ doped TiO2 NP decorated f-MWCNT modified GCE for a PE sensor. The recommended sensor also showed outstanding performance in terms of reproducibility, stability, and selectivity toward PE detection. We believe that our present approaches to electrochemical PE sensors solve prevailing difficulties and ensure ways to achieve the purpose of low-cost and high-performance pollutant monitoring sensors. Taking advantage of this approach, the good analytical performances of the La3+ doped TiO2 NP decorated f-MWCNT modified GCE electrode promotes it as a viable sensor platform for the determination of PE in the environmental sector.
Conflicts of interest
The authors declare that they have no known competing for financial interests or personal relationships that could have appeared to influence the work reported in this paper.
Acknowledgements
The authors are grateful for financial support (MOST 107-2113-M-027-005-MY3) from the Ministry of Science and Technology (MOST), Taiwan.
References
- S. Uniyal and R. K. Sharma, Biosens. Bioelectron., 2018, 116, 37–50 CrossRef CAS PubMed.
- G. G. Pimenta, M. E. de Queiroz, R. P. Victor, L. M. Noronha, A. A. Neves, A. F. d. Oliveira and F. F. Heleno, J. Braz. Chem. Soc., 2017, 28, 2045–2053 CAS.
- X. Tian, L. Liu, Y. Li, C. Yang, Z. Zhou, Y. Nie and Y. Wang, Sens. Actuators, B, 2018, 256, 135–142 CrossRef CAS.
- J. E. Chambers and S. F. Oppenheimer, Toxicol. Sci., 2004, 77, 185–187 CrossRef CAS PubMed.
- S. Marx, A. Zaltsman, I. Turyan and D. Mandler, Anal. Chem., 2004, 76, 120–126 CrossRef CAS.
- R. Karthik, J. V. Kumar, S.-M. Chen, T. Kokulnathan, H.-Y. Yang and V. Muthuraj, ACS Sustainable Chem. Eng., 2018, 6, 8615–8630 CrossRef CAS.
- J. Wang, W. Chow, D. Leung and J. Chang, J. Agric. Food Chem., 2012, 60, 12088–12104 CrossRef CAS PubMed.
- Z.-L. Xu, H. Deng, X.-F. Deng, J.-Y. Yang, Y.-M. Jiang, D.-P. Zeng, F. Huang, Y.-D. Shen, H.-T. Lei and H. Wang, Food Chem., 2012, 131, 1569–1576 CrossRef CAS.
- E. C. Hopmans, S. Schouten, R. D. Pancost, M. T. van der Meer and J. Sinninghe Damsté, Rapid Commun. Mass Spectrom., 2000, 14, 585–589 CrossRef CAS.
- H. Fan, J. Smuts, P. Walsh, D. Harrison and K. Schug, J. Chromatogr. A, 2015, 1389, 120–127 CrossRef CAS PubMed.
- S. Berijani, Y. Assadi, M. Anbia, M.-R. M. Hosseini and E. Aghaee, J. Chromatogr. A., 2006, 1123, 1–9 CrossRef CAS PubMed.
- X. C. Huang, J. K. Ma, R. X. Feng and S. Wei, J. Sci. Food Agric., 2019, 99, 6998–7007 CrossRef CAS PubMed.
- A. K. Ravi, P. Navaneeth, P. V. Suneesh, B. G. Nair and T. Babu, J. Electroanal. Chem., 2020, 113841 CrossRef CAS.
- J. Qiu, S. Zhang and H. Zhao, Sens. Actuators, B, 2011, 160, 875–890 CrossRef CAS.
- O. A. Zelekew and D.-H. Kuo, Phys. Chem. Chem. Phys., 2016, 18, 4405–4414 RSC.
- M. M. Mohamed and M. Al-Sharif, Appl. Catal., B, 2013, 142, 432–441 CrossRef.
- D. Xu, P. Diao, T. Jin, Q. Wu, X. Liu, X. Guo, H. Gong, F. Li, M. Xiang and Y. Ronghai, ACS Appl. Mater. Interfaces, 2015, 7, 16738–16749 CrossRef CAS PubMed.
- M. T. Islam, H. Jing, T. Yang, E. Zubia, A. G. Goos, R. A. Bernal, C. E. Botez, M. Narayan, C. K. Chan and J. Noveron, J. Environ. Chem. Eng., 2018, 6, 3827–3836 CrossRef CAS.
- Z.-X. Xu, A.-Q. Wang and Y.-F. Zhu, Rare Met., 2019, 38, 390–396 CrossRef CAS.
- Y. Yang, M. Wu, X. Zhu, H. Xu, S. Ma, Y. Zhi, H. Xia, X. Liu, J. Pan and J.-Y. Tang, Chin. Chem. Lett., 2019, 30, 2065–2088 CrossRef CAS.
- J. Wang, Y. Zeng, L. Wan, J. Zhao, J. Yang, J. Hu, F. Miao, W. Zhan, R. Chen and F. Liang, Appl. Surf. Sci., 2020, 145301 CrossRef CAS.
- N. P. Shetti, D. S. Nayak, S. J. Malode and R. Kulkarni, Sens. Actuators, B, 2017, 247, 858–867 CrossRef CAS.
- H. Chen, M. Shen, R. Chen, K. Dai and T. Peng, Environ. Technol., 2011, 32, 1515–1522 CrossRef CAS PubMed.
- N. P. Shetti, D. S. Nayak, S. J. Malode and R. Kulkarni, J. Electrochem. Soc., 2017, 164, B3036–B3042 CrossRef CAS.
- L. Bazli, M. Siavashi and A. Shiravi, Compounds, 2019, 1, 1–9 CrossRef.
- G. Rosace, V. Trovato, C. Colleoni, M. Caldara, V. Re, M. Brucale, E. Piperopoulos, E. Mastronardo, C. Milone and G. De Luca, Sens. Actuators, B, 2017, 252, 428–439 CrossRef CAS.
- J. Liqiang, S. Xiaojun, X. Baifu, W. Baiqi, C. Weimin and F. Honggang, J. Solid State Chem., 2004, 177, 3375–3382 CrossRef.
- S. Sadhu and P. Poddar, RSC Adv., 2013, 3, 10363–10369 RSC.
- W. Guan, F. Ji, Z. Xie, R. Li and N. Mei, J. Nanomater., 2015, 2015, 4 Search PubMed.
- M. Perez-Cabero, I. Rodrıguez-Ramos and A. Guerrero-Ruız, J. Catal., 2003, 215, 305–316 CrossRef CAS.
- U. Kumar and B. Yadav, J. Taiwan Inst. Chem. Eng., 2019, 96, 652–663 CrossRef CAS.
- C. Velasco-Santos, A. L. Martínez-Hernández, F. T. Fisher, R. Ruoff and V. Castano, Chem. Mater., 2003, 15, 4470–4475 CrossRef CAS.
- G. Trykowski, S. Biniak, L. Stobinski and B. Lesiak, Acta Phys. Pol., A, 2010, 118, 515–518 CrossRef CAS.
- S. Goyanes, G. Rubiolo, A. Salazar, A. Jimeno, M. Corcuera and I. Mondragon, Diamond Relat. Mater., 2007, 16, 412–417 CrossRef CAS.
- F. A. Abuilaiwi, T. Laoui, M. Al-Harthi and M. Atieh, Arabian J. Sci. Eng., 2010, 35, 37–48 CAS.
- E. S. Babu, B. J. Rani, G. Ravi, R. Yuvakkumar, R. K. Guduru, V. Ganesh and S. Kim, Mater. Lett., 2018, 220, 209–212 CrossRef CAS.
- A. M. Ruiz, A. Cornet and J. R. Morante, Sens. Actuators, B, 2005, 111, 7–12 Search PubMed.
- A. M. Ruiz, A. Cornet and J. Morante, Sens. Actuators, B, 2005, 111, 7–12 Search PubMed.
- R. Shwetharani, A. Poojashree, G. R. Balakrishna and M. Jyothi, New J. Chem., 2018, 42, 1067–1077 RSC.
- H. Ago, T. Kugler, F. Cacialli, W. R. Salaneck, M. S. Shaffer, A. H. Windle and R. H. Friend, J. Phys. Chem. B, 1999, 103, 8116–8121 CrossRef CAS.
- E. Mickelson, C. Huffman, A. Rinzler, R. Smalley, R. Hauge and J. Margrave, Chem. Phys. Lett., 1998, 296, 188–194 CrossRef CAS.
- Z. Rastian, A. A. Khodadadi, F. Vahabzadeh, C. Bortolini, M. Dong, Y. Mortazavi, A. Mogharei, M. V. Naseh and Z. Guo, Biochem. Eng. J., 2014, 90, 16–26 CrossRef CAS.
- B. Ding, C. Han, L. Zheng, J. Zhang, R. Wang and Z. Tang, Sci. Rep., 2015, 5, 9443 CrossRef PubMed.
- Y. Zhang, W. Hong, Y. Zhang, W. Xu, Z. Shi, X. Li, H. Hou and X. Ji, Electrochim. Acta, 2018, 283, 1514–1524 CrossRef CAS.
- P. T. Kissinger and W. R. Heineman, J. Chem. Educ., 1983, 60, 702 CrossRef CAS.
- Y. Li, L. Zou, G. Song, K. Li and B. Ye, J. Electroanal. Chem., 2013, 709, 1–9 CrossRef CAS.
- N. Erk, Anal. Bioanal. Chem., 2004, 378, 1351–1356 CrossRef CAS PubMed.
- Y. V. M. Reddy, S. Bathinapatla, T. Łuczak, M. Osińska, H. Maseed, P. Ragavendra, L. S. Sarma, V. Srikanth and G. Madhavi, Biosens. Bioelectron., 2018, 42, 3137–3146 Search PubMed.
- V. Renganathan, R. Balaji, S.-M. Chen and T. Kokulnathan, Sens. Actuators, B, 2020, 307, 127586 CrossRef.
- J. Wang, L. Chen, A. Mulchandani, P. Mulchandani and W. Chen, Electroanalysis, 1999, 11, 866–869 CrossRef CAS.
- T. Laothanachareon, V. Champreda, P. Sritongkham, M. Somasundrum and W. Surareungchai, World J. Microbiol. Biotechnol., 2008, 24, 3049 CrossRef CAS.
- R. P. Deo, J. Wang, I. Block, A. Mulchandani, K. A. Joshi, M. Trojanowicz, F. Scholz, W. Chen and Y. Lin, Anal. Chim. Acta, 2005, 530, 185–189 CrossRef CAS.
- H. Bagheri, A. Afkhami, H. Khoshsafar, A. Hajian and A. Shahriyari, Biosens. Bioelectron., 2017, 89, 829–836 CrossRef CAS PubMed.
- A. Aghaie, A. Khanmohammadi, A. Hajian, U. Schmid and H. Bagheri, Food Anal. Methods, 2019, 12, 1545–1555 CrossRef.
Footnote |
| † Electronic supplementary information (ESI) available. See DOI: 10.1039/d0na00260g |
|
| This journal is © The Royal Society of Chemistry 2020 |
Click here to see how this site uses Cookies. View our privacy policy here. 
 Open Access Article
 This Open Access Article is licensed under a Creative Commons Attribution-Non Commercial 3.0 Unported Licence
 and
Shen-Ming
Chen
and
Shen-Ming
Chen