 Open Access Article
Boosting activity and selectivity of glycerol oxidation over platinum–palladium–silver electrocatalysts via surface engineering†
Yongfang
Zhou
a,
Yi
Shen
 *ab,
Xuanli
Luo
c,
Guo
Liu
d and
Yong
Cao
d
aSchool of Food Science and Engineering, South China University of Technology, #381 Wu Shan Road, Tianhe District, Guangzhou, Guangdong 510640, China. E-mail: feyshen@scut.edu.cn
bOverseas Expertise Introduction Center for Discipline Innovation of Food Nutrition and Human Health (111 Center), Guangzhou, 510640, China
cAdvanced Materials Research Group, Faculty of Engineering, University of Nottingham, Nottingham, NG7 2RD, UK
dGuangdong Provincial Key Laboratory of Nutraceuticals and Functional Foods, College of Food Science, South China Agricultural University, Guangzhou, 510642, China
First published on 23rd June 2020
Abstract
A series of platinum–palladium–silver nanoparticles with tunable structures were synthesized for glycerol electro-oxidation in both alkaline and acidic solutions. Electrochemical results indicate that the catalysts show superior activity in alkaline solutions relative to acidic solutions. In alkaline solutions, the peak current densities of ammonia-etched samples are approximately twice those of saturated-NaCl-etched samples. Ammonia-etched platinum–palladium–silver (PtPd@Ag-NH3) exhibits a peak current density of 9.16 mA cm−2, which is 18.7 and 10 times those of the Pt/C and Pd/C, respectively. The product distribution was analyzed by high performance liquid chromatography. Seven products including oxalic acid, tartronic acid, glyoxylic acid, glyceric acid (GLA), glyceraldehyde (GALD), glycolic acid, and dihydroxyacetone (DHA) were detected. The NH3·H2O etched samples tend to generate more GALD, while the NaCl etched samples have a great potential to produce DHA. The addition of Pd atoms can facilitate glycerol oxidation pathway towards the direction of GALD generation. The Pt@Ag-NaCl possesses the largest DHA selectivity of 79.09% at 1.3 V, while the Pt@Ag-NH3 exhibits the largest GLA selectivity of 45.01% at 0.5 V. The PtPd@Ag-NH3 exhibits the largest C3/C2 ratio of 17.45. The selectivity and product distribution of glycerol electro-oxidation can be tuned by engineering the surface atoms of the as-synthesized catalysts.
Introduction
In recent decades, the development of biodiesel and fatty acid industries has greatly increased the production of glycerol (GLY). According to statistics, for every 10 kg of biodiesel produced, about 1 kg of GLY is obtained.1 Being a large-quantity byproduct, GLY exhibits a great potential to be converted into many value-added chemicals and intermediates, such as dihydroxyacetone (DHA), glyceraldehyde (GALD), glyceric acid (GLA), tartronic acid (TA), glycolic acid (GA), lactic acid, oxalic acid (OA), and glyoxylic acid (GLOA).2–6 Unfortunately, most of the GLY produced in biodiesel production is burned by factories. There is an urgent need to explore methods for the rational utilization of GLY. Electrochemical oxidation is considered to be a promising approach for GLY conversion.7–10 It offers a totally green route to produce valuable chemicals from GLY. Electrocatalysts play a critical role in GLY electro-oxidation.11–14 However, the process of GLY electro-oxidation is quite complex.15 Many products and intermediates are involved in the process, giving rise to unsatisfactory selectivities toward desired products.So far, numerous strategies have been developed to improve the performance of GLY electro-oxidation. One approach is to optimize operating conditions. For example, Lee et al. obtained a remarkable DHA selectivity of 61.4% at 60 °C after 10 h using PtSb/C catalyst.16 Zhang et al. investigated GLY oxidation on Pt/C catalyst in an alkaline solution.17 They found that high solution pHs were favorable for enhancing output power density and selectivities of C3 acids, while low GLY concentrations could improve the selectivity of deeper-oxidized products. Kwon et al. observed that the main product of GLY oxidation on Pt was GLA in alkaline solutions while GLY was mainly converted into GALD in acidic solutions.18
Another approach is via the mediation of other molecules and/or adatoms. For example, Zalineeva et al. synthesized a Bi-modified Pd catalyst. The introduction of Bi led to a change in the oxidation mechanism with the formation of hydroxyacetone at low potentials.19 Garcia et al. studied the effects of Bi adatom irreversibly adsorbed on Pt single-crystal electrodes on GLY oxidation in 0.5 M HClO4.20 They found that the presence of Bi on Pt (111) electrode improves both the activity of the reaction and the selectivity to DHA. Kwon et al. applied several kinds of adatoms (Bi, Sb, Pb, In and Sn) on the surface of Pt and observed that GLY was fully converted into DHA when Bi was present in the solutions.21,22
Selectivity can also be improved by tuning the metal–support interaction. Wang et al. developed a carbon nitride/graphene support Pd-CNx/G catalyst, which showed an ability to promote the selectivity towards C3 products in alkaline solutions.23 Chen et al. designed a 2D-confined system consisting of intercalated Pt nanosheets within few-layered graphene, which exhibited an excellent selectivity towards C1 products.24 Wang et al. observed that the selectivity of C3 products was significantly enhanced over Au supported on extended poly(4-vinylpyridine) functionalized graphene as compared to carbon black.25
Herein, we demonstrated that the performance of GLY oxidation could be improved by engineering surface atoms of nanoparticles. It has been established that the active sites of heterogeneous catalysts lie on the surface and subsurface. Delicately engineering surface compositions and structures, such as defects and interface, could significantly improve the catalytic property.26,27 Inspired by our previous work,15 we fabricated Pt@Ag, Pd@Ag and PtPd@Ag nanoparticles (NPs) in this study, and further tuned their surface structures using concentrated NH3·H2O and saturated NaCl etchants. The concentrated NH3·H2O and saturated NaCl are common etchants used in the structural design of NPs as reported by Xia's groups.28 In this paper, the effects of these two etchants on the performance of GLY oxidation were investigated in detail.
Experimental
Nanocatalyst synthesis
Ag seed solutions were prepared via a previously reported hydrothermal process.15 The Pt@Ag, Pd@Ag and PtPd@Ag NPs were fabricated via a seed-mediated growth method, in which Ag seeds were selectively removed using concentrated NH3·H2O or saturated NaCl solutions.28 First, 100 mg of polyvinyl pyrrolidone (PVP) and 500 mg of citric acid were added into 24 mL of distilled water. After stirring for 10 min, 15 mL of Ag seed solutions were added by a syringe. Next, predetermined volumes of 10 mM H2PdCl4 and/or 10 mM H2PtCl6 were added slowly to the suspension in sequence. The reaction temperature was kept at 90 °C for 3 h. Subsequently, 30 mL of concentrated NH3·H2O or saturated NaCl solution was added to the mixture. The reaction was carried out at ambient temperature for 12 h. The samples were collected by centrifugation and washed by distilled water. Six samples treated with different etchants were prepared and the resulting samples are denoted as PtPd@Ag-NH3, Pt@Ag-NH3, Pd@Ag-NH3, PtPd@Ag-NaCl, Pt@Ag-NaCl, and Pd@Ag-NaCl, respectively.Physicochemical characterization
A transmission electron microscopy (TEM) equipped with an electron energy loss spectroscopy (EELS) analyzer was used to observe the morphology of the samples. A UV-vis spectrometer was used to examine the optical properties of the samples.Electrochemical characterization
The electrochemical measurements were performed in a typical three-electrode cell using a potentiostat (CHI 660E) at ambient temperature. A Pt plate, Hg/HgO electrode, and glassy carbon electrode were used as counter, reference, and working electrodes, respectively. The surface area of the glassy carbon electrode is 0.0706 cm−2, and the catalyst loading is 80 μg cm−2. The set-up for product analysis and the details of measurements were previously reported.29–31 All the potentials reported in this study were referenced to a reversible hydrogen electrode (RHE).Chromatographic study of products
The product of GLY oxidation was detected by high performance liquid chromatography (HPLC). The details of the measurements were previously reported.15,29,32Results and discussion
Structural characterizations
Fig. 1 shows the representative TEM images of the PtPd@Ag-NH3 NPs. As can be seen from Fig. 1a–c, the PtPd@Ag-NH3 NPs are of uniform size of 12 ± 2 nm. Fig. 1d shows the HR-TEM image. The magnified view of the spots marked with A, B and C in Fig. 1d are shown in Fig. 1e, f and g, respectively. Fig. 1e displays well-resolved steps, edges and corners, indicating that many low-coordination number atoms exist in the NPs.33Fig. 1f and g show abundant defects including disordered lattice, gap atoms, vacancies, and nanotwins. These defects have been confirmed to act as highly active sites, which can significantly enhance the catalytic performance of the catalysts.34Fig. 1h shows the high-angle annular dark-field scanning TEM (HAADF-STEM) image of the PtPd@Ag-NH3 NPs. The corresponding electron energy-loss spectroscopy (EELS) elemental mapping micrographs indicate the existence of Pt, Pd and Ag elements in the NPs. In addition, the signal of Ag is quite weak, indicating that the Ag seeds are almost completely etched by the etchants. The specific etching mechanism of each etchant has been studied by Xia and Kawazumi's groups.35–37 The EDX spectrum shown in Fig. 1i further confirms that the dominant elements of the NPs are Pt (49.9%) and Pd (48.6%), the content of Ag (1.5%) is quite limited. TEM images of other NH3·H2O and NaCl etched samples can be found in Fig. S1 and S2.† The average sizes of the NPs are similar to that of the PtPd@Ag-NH3 NPs, which reveals that the type of the etchants has no significant effects on the NPs size. Fig. S2† shows the HR-TEM images of the PtPd@Ag-NaCl NPs. Compared with the PtPd@Ag-NH3 NPs, the PtPd@Ag-NaCl NPs possess a relatively smooth surface with few defects. The different morphologies of the NH3·H2O and NaCl etched samples probably arose from the difference in etching kinetics. As NaCl is a much weaker enchant relative to NH3·H2O, Pt and Pd atoms could diffuse and passivate the remaining PtPd@Ag surface before the Ag atoms are completely removed with NaCl.37 Thus, NH3·H2O seems to be a better etchant than NaCl for the selective removal of Ag seeds in this work.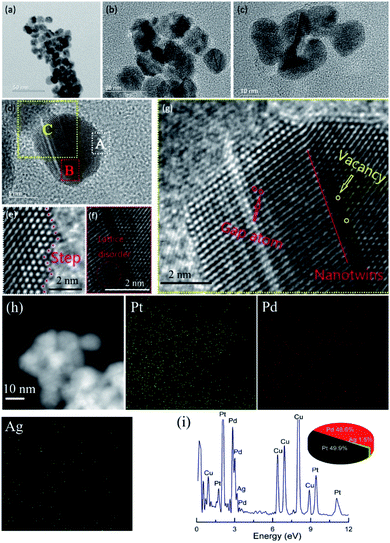 | ||
| Fig. 1 (a–c) Different magnification TEM images, (d–g) HR-TEM images, (h) HAADF-STEM image and EELS elemental mapping micrographs, and (i) EDX spectrum of PtPd@Ag-NH3 NPs. | ||
To further explore the structure of the NPs, UV-vis spectroscopy was performed as shown in Fig. S3.† The spectrum of the Ag NPs shows an absorption peak at 420 nm while those of the Pt and Pd NPs have no clear absorption in this region. With the addition of Pt and/or Pd atoms, the absorption of the Ag NPs disappears, which means that the Ag seeds are almost completely removed and dissolved into the solutions instead of adhering to the surface of the NPs.
Electrochemical characterization
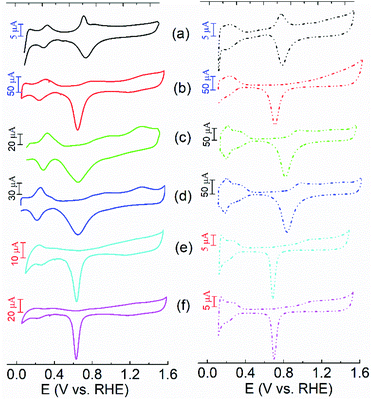
The electrochemical properties of the NH3·H2O and NaCl etched samples were first investigated using cyclic voltammogram (CV) measurements in alkaline and acidic solutions as shown in Fig. 2. The commercial Pt/C (40 wt%) and Pd/C (10 wt%) catalysts were purchased from the ETEK company, and their CV curves are shown in Fig S4 and S5.† In Fig. 2, the CV curves of the NPs are featured with two processes including hydrogen adsorption–desorption and redox of metal surfaces. Notably, compared with the CV curves of the Ag NPs shown in Fig. S6,† the peaks associated with the redox of Ag/Ag2O are not evidenced in the NH3·H2O and NaCl etched samples. It indicates that the Ag seeds were almost completely removed during the NPs growth process, which is consistent with the TEM results. In alkaline solutions, the peaks related to hydrogen adsorption–desorption for all the samples are present at 0.2–0.5 V while the reduction of Pt or Pd surface occurs at 0.6–0.9 V. In acidic solutions, the peaks associated with hydrogen adsorption–desorption are less defined when compared with those in alkaline solutions. In contrast, the peaks related to the reduction of metal surface are more pronounced. Compared to the polycrystalline Pt/C and Pd/C, the PtPd@Ag-NH3 shows a well-defined peak located at 0.8–0.9 V in the forward scan in both alkaline and acidic solutions, corresponding to the oxidation of Pt (111) facets.20 Notably, the CV profiles of the Pt@Ag-NH3 and Pt@Ag-NaCl are more similar to those of the Pt/C, which further confirms that the Ag seeds are almost completely removed. The CV curves of the Pt@Ag-NaCl and Pd@Ag-NaCl in alkaline and acidic solutions are similar to those of the Pt@Ag-NH3 and Pd@Ag-NH3, respectively. A pair of peaks associated with the oxidation and reduction of the Pt/Pd surface are noted from them. However, the CV curves of the PtPd@Ag-NaCl are significantly different from those of the PtPd@Ag-NH3. It has no peaks related to the oxidation of Pt (111) facets, manifesting that the Pt (111) facets are not dominant in the PtPd@Ag-NaCl NPs.Electrochemical activity
Fig. 3 shows linear sweep voltammetry (LSV) of the samples in alkaline solutions. The LSV results are summarized in Table S1.† The activity of the Pt/C, Pd/C and Ag was also measured for comparison as shown in Fig. S7.† In Fig. 3, the NH3·H2O and NaCl etched samples except the Pt@Ag-NH3 and Pt@Ag-NaCl exhibit a slower reaction kinetics than the commercial Pt/C, which can be evidenced from the positive shifts in onset potentials. It may be due to the addition of Pd atoms, because several studies have reported that the reaction kinetics of the Pd NPs is slightly slower than that of the Pt NPs in alkaline solutions.38 The onset potentials of the PtPd@Ag-NH3, PtPd@Ag-NaCl, Pt@Ag-NH3, Pt@Ag-NaCl, Pd@Ag-NH3, and Pd@Ag-NaCl are 0.68, 0.65, 0.53, 0.55, 0.75, and 0.75 V, respectively. The peak current densities of the PtPd@Ag-NH3, Pt@Ag-NH3, and Pd@Ag-NH3 are 6.05, 1.78, and 1.33 mA cm−2, respectively, which are larger than those of the corresponding NaCl etched samples. More interestingly, the peak current densities of the NH3·H2O etched samples are approximately twice those of the NaCl etched samples, which can be ascribed to the fact that the NH3·H2O etched samples possess more defects than the NaCl etched samples. These defects can significantly enhance the catalytic performance of the catalysts in catalytic reactions.34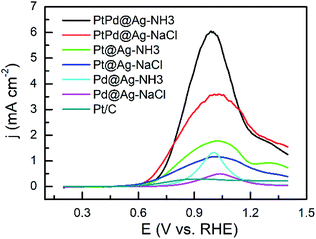 | ||
| Fig. 3 LSV curves of GLY oxidation recorded with a scan rate of 10 mV s−1 in a solution of 0.1 M KOH + 1 M GLY. | ||
In acidic solutions, the onset potentials of the trimetallic PtPd@Ag-NH3 (0.57 V) and PtPd@Ag-NaCl (0.56 V) catalysts are smaller than those the bimetallic Pt@Ag-NH3 (0.65 V) and Pt@Ag-NaCl (0.64 V) catalysts as shown in Fig. 4. Additionally, the PtPd@Ag-NH3 and PtPd@Ag-NaCl show a better reaction kinetics as compared with the Pt/C. Compared with the Pt/C, the Pd@Ag-NH3 and Pd@Ag-NaCl have limited activity on GLY oxidation, which is consistent with the results that Pd and Ag NPs are inactive in acidic solutions. The peak current densities of the PtPd@Ag-NH3, PtPd@Ag-NaCl, Pt@Ag-NH3, and Pt@Ag-NaCl are 0.59, 0.25, 0.26, and 0.19 mA cm−2, respectively, which are larger than that of the Pt/C. In addition, the NH3·H2O etched samples show better activities than the NaCl etched samples, which is consistent with the results obtained from alkaline solutions.
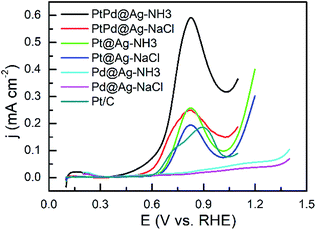 | ||
| Fig. 4 LSV curves of GLY oxidation recorded with a scan rate of 10 mV s−1 in a solution of 0.1 M HClO4 + 1 M GLY. | ||
As shown in Fig. 5 and 6, the activity of the samples was further examined by CVs in alkaline and acidic solutions, respectively. The results are listed in Table S2.† CVs of the Pd and Ag NPs were also recorded as shown in Fig. S5 and S6,† respectively. In alkaline solutions, the forward peak current densities (If) follow the sequence of PtPd@Ag-NH3 > PtPd@Ag-NaCl > Pt@Ag-NH3 > Pd@Ag-NH3 > Pt@Ag-NaCl > Pd@Ag-NaCl > Pt/C. Notably, If value of the PtPd@Ag-NH3 is 9.16 mA cm−2, which is 18.7 times that of the Pt/C. Moreover, the If values of the PtPd@Ag-NH3, Pt@Ag-NH3, and Pd@Ag-NH3 are approximately twice those of the PtPd@Ag-NaCl, Pt@Ag-NaCl, and Pd@Ag-NaCl, respectively, which is consistent with the LSV results. In acidic solutions, the If values of the PtPd@Ag-NH3, PtPd@Ag-NaCl, Pt@Ag-NH3, and Pt@Ag-NaCl are 0.74, 0.57, 0.44 and 0.36 mA cm−2, which are 2.3, 1.8, 1.4, and 1.1 times that of the Pt/C, respectively. The Pd@Ag-NH3 and Pd@Ag-NaCl catalysts appear inert to GLY oxidation. Of the catalysts, the If values in acidic solutions are much lower than those in alkaline solutions, which is consistent with our previous results.15 In particular, the PtPd@Ag-NH3 exhibits superior activity towards GLY oxidation in both alkaline and acidic solutions.
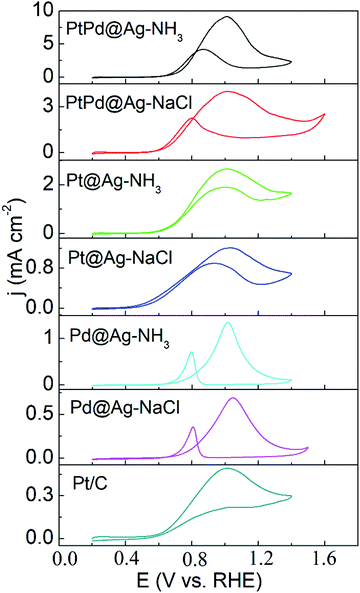 | ||
| Fig. 5 CV curves of GLY oxidation recorded with a scan rate of 50 mV s−1 in a solution of 0.1 M KOH + 1 M GLY. | ||
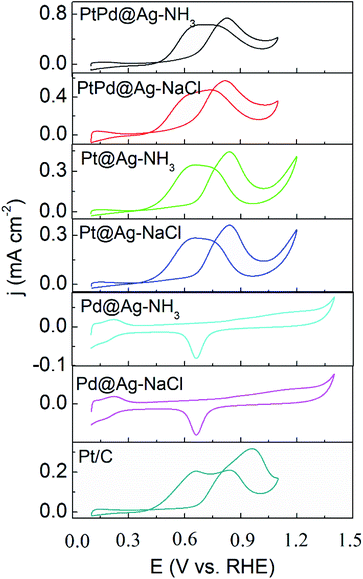 | ||
| Fig. 6 CV curves of GLY oxidation recorded with a scan rate of 50 mV s−1 in a solution of 0.1 M HClO4 + 1 M GLY. | ||
Fig. S8† shows the i–t curves of the NH3·H2O etched samples. It can be seen that the current densities of the PtPd@Ag-NH3, Pt@Ag-NH3 and Pd@Ag-NH3 are higher than those of the Pt/C catalyst, which is consistent with the LSV and CV results. Fig. S9† shows the i–t curves of the NaCl etched samples. Notably, the current densities of the PtPd@Ag-NaCl are higher than those of other catalysts when the applied potential is higher than 0.5 V, manifesting that the PtPd@Ag-NaCl displays a better activity at high applied potentials.
Product distribution
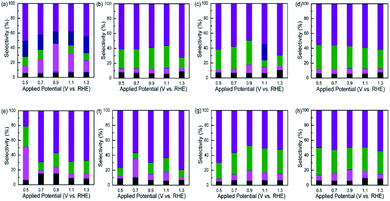
In order to separate and identify the products of GLY oxidation, bulk solutions after chronoamperometric tests were collected and used for HPLC detection. The concentrations of the products (shown in Tables S3–S7†) were determined based on the calibrated curves, which can be seen in the authors' previous work.15 The representative HPLC curves are shown in Fig. S10a and b.†Fig. 7 shows the product distribution of the samples at five applied potentials. The Pt/C yields seven products including DHA, GLA, GALD, GA, OA, TA, and GLOA as shown in Fig. 7a. The selectivity of DHA decreases with increasing applied potential from 50.45% at 0.5 V to 37.75% at 0.9 V, and then increases thereafter. Such a tread is contrary with GLA selectivity, which possesses a maximum value of 37.30% at 0.9 V. GA can be detected at the five applied potentials, but its selectivity has no significant change with increasing applied potential. No GALD is obtained at 0.9 V. Fig. 7b shows the product distribution of the Pd/C. DHA selectivity is highest at the five applied potentials, and a considerable GALD can be obtained at 1.1 V with a value of 29.91%. Fig. 7c shows the product distribution of the Pd@Ag-NH3. DHA selectivity decreases with increasing potential and then increases from 49.62% at 0.9 V to 69.44% at 1.3 V. A maximum GALD selectivity of 32.61% is obtained at 0.9 V. GA can only be detected at 1.1 V. Compared with the Pt/C, GLA selectivity is negligible. When the Pd@Ag-NaCl is used, DHA selectivity increases with increasing applied potential from 55.15% at 0.5 V to 61.82% at 1.3 V while GALD selectivity decreases with increasing applied potential, leading to a minimum value of 25.48% at 1.3 V as shown in Fig. 7d. Different from the Pd@Ag-NH3, the Pd@Ag-NaCl yields no GA at the five potentials. Among the catalysts, the Pt@Ag-NH3 yields the largest GLA selectivity of 45.01% at 0.5 V as shown in Fig. 7e. No GA is detected at the five applied potentials but the selectivity of OA is highest at 0.9 V. Compared with the Pt/C, the Pt@Ag-NH3 tends to produce more DHA when the applied potential is higher than 0.5 V. Compared with the Pt@Ag-NH3, the Pt@Ag-NaCl produces more DHA but less GLA at 0.5 V as shown in Fig. 7f. The Pt@Ag-NaCl possesses the largest DHA selectivity of 79.09% at 1.3 V while the Pt@Ag-NH3 possesses the least DHA selectivity of 20.91% at 0.5 V. When the PtPd@Ag-NH3 catalyst is used, considerable GALD can be obtained at the five potentials as compared with the Pt/C, Pt@Ag-NH3, and Pt@Ag-NaCl catalysts as shown in Fig. 7g. Similar to the Pd@Ag-NH3, the PtPd@Ag-NH3 yields the largest GALD selectivity at 0.9 V. It seems that the applied potential has limited effects on DHA and GALD selectivities of the PtPd@Ag-NaCl catalyst as shown in Fig. 7h. The largest GALD selectivity of 36.37% is obtained at 0.5 V. Of the catalysts, the PtPd@Ag-NH3, PtPd@Ag-NaCl, Pd@Ag-NH3, Pd@Ag-NaCl, and Pd/C exhibit a great potential to yield more GALD when compared with the Pt@Ag-NH3, Pt@Ag-NaCl, and Pt/C, which reveals that the addition of Pd atoms can facilitate the GLY oxidation pathway towards the direction of GALD generation. In addition, the Pt@Ag-NH3 and Pt@Ag-NaCl show enhanced DHA selectivities as compared with the Pt/C, manifesting that the presence of trace Ag atoms also plays a role in GLY oxidation.From discussion above, it uncovers a fact that the NH3·H2O etched samples show enhanced selectivity towards GALD while the NaCl etched samples exhibit superior selectivity towards DHA, which can be evidenced from the results that the Pt@Ag-NaCl yields more DHA (76.80%) while the Pt@Ag-NH3 generates more GALD (27.36%) at 0.5 V. It is likely that in the pathways of GLY oxidation, the NH3·H2O etched samples are more prone to undergo the primary alcohol oxidation while the NaCl etched samples are more conducive to undergo the secondary alcohol oxidation. For the NH3·H2O etched samples, the PtPd@Ag-NH3 and Pd@Ag-NH3 are likely to generate more DHA at 0.5 V, but the Pt@Ag-NH3 tends to produce more GLA. Significant GLA selectivity of the Pt@Ag-NH3 is obtained at 0.5 V may be due to the further oxidation of GALD. Additionally, at high applied potentials, GALD is prone to being produced by the PtPd@Ag-NH3, which is consistent with the results that the NH3·H2O etched samples are more likely to favor the path of primary alcohol oxidation. As to the NaCl etched samples, the Pt@Ag-NaCl yields more DHA while the Pd@Ag-NaCl and PtPd@Ag-NaCl yield more GALD. Notably, the largest DHA selectivity of 79.09% is obtained from the Pt@Ag-NaCl at 1.3 V. At 0.7 V, GLA selectivity of the Pt@Ag-NaCl is significantly enhanced as compared with the PtPd@Ag-NaCl and Pd@Ag-NaCl.
Since most C3 products have higher commercial value than C2 products, the products of GLY oxidation in this work are categorized into C3 (DHA, GALD, GLA, and TA) and C2 (OA, GLOA, and GA) products. Fig. 8 shows C3/C2 ratios of the NH3·H2O and NaCl etched samples. At the five applied potentials, all the catalysts except the Pd@Ag-NH3 exhibit larger C3/C2 ratios when compared with the Pt/C. The Pd@Ag-NH3 produces the least C3/C2 ratio of 2.56 at 1.1 V. The largest C3/C2 ratio of 17.45 is obtained from the PtPd@Ag-NH3 at 0.5 V, manifesting that the PtPd@Ag-NH3 tends to generate more C3 products. At the potentials of 0.5, 0.7, 0.9, and 1.3 V, the C3/C2 ratios of the PtPd@Ag-NaCl and Pd@Ag-NaCl are higher than those of the Pt/C and Pd/C. Compared with the PtPd@Ag-NaCl, the PtPd@Ag-NH3 possesses higher C3/C2 ratios at the potentials of 0.5, 0.9, 1.1, and 1.3 V. At the five potentials, the C3/C2 ratios of the Pd@Ag-NaCl are larger than those of the Pd@Ag-NH3.
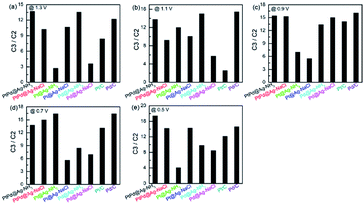 | ||
| Fig. 8 C3/C2 ratios of the catalysts at applied potentials of (a) 0.5, (b) 0.7, (c) 0.9, (d) 1.1, and (e) 1.3 V. | ||
For all the samples, the NH3·H2O etched samples exhibit better performance on GLY oxidation than the NaCl etched samples in both alkaline and acidic solutions. In particular, the PtPd@Ag-NH3 exhibits a superior peak current density of 9.16 mA cm−2 and a C3/C2 ratio of 17.45. Such outstanding activity and selectivity can be explained from the unique structure of the NPs. There are many lattice mismatches in the NPs, which may result in strong strains in the crystal lattice over the atomic layers around the interface, thus leading to a change of d-band center of the metals.15,39 The d-band center is closely related to the adsorption of the molecules, which could decrease the adsorption energy between Pt and O.40 Moreover, the PtPd@Ag-NH3 possesses abundant defects, which has a potential to enable unconventional adsorption behaviors and selectively enhance the stability of specific intermediates and corresponding GLY oxidation pathways.26 Defects in the NPs can also lead to the downshift of the d-band center. It has been reported that crystal defects in Pt (111) facets can lead to a decrease in the production of DHA,12 which may be the reason why the PtPd@Ag-NH3 generates less DHA compared with the PtPd@Ag-NaCl. In addition, the mechanical strain could decrease the binding energy of adsorbates on the NPs surfaces, thus facilitating the C3 products more easily desorbed from the active sites.41 Moreover, for Pt-based NPs, the possible synergistic effects between Pt and the doping atoms are another important factor to improve the catalytic activity. At low potentials, Pt binds GLY and intermediates strongly while the interaction of these species with Pd is relatively weak, thus the presence of Pd atoms could significantly reduce the toxic effects of CO. Meanwhile, the presence of Ag atoms assists in weakening the adsorption strength of the adsorbates and activating the catalytic surface.42 The synergistic effects between Pt, Pd and Ag could easily regulate the bonding energy of GLY and OH at the active sites.
Conclusions
The Pt@Ag, Pd@Ag and PtPd@Ag NPs were prepared via a seed-mediated growth method, in which Ag seeds were selectively removed based on the concentrated NH3·H2O and saturated NaCl solutions. Of the catalysts, the PtPd@Ag-NH3 possesses abundant defects including disordered lattice, gap atoms, vacancies, and nanotwins, manifesting that NH3·H2O seems to be a better etchant than NaCl for the selective removal of Ag seeds. Electrochemical results indicate that the peak current densities of the samples etched with NH3·H2O are approximately twice those of the samples etched with NaCl in alkaline solutions. The PtPd@Ag-NH3 exhibits a peak current density of 9.16 mA cm−2, which is 18.7 and 10 times those of the Pt/C and Pd/C, respectively. HPLC results show that all the catalysts tend to yield more C3 products as compared with the Pt/C. The NH3·H2O etched samples tend to generate more GALD, while the NaCl etched samples have a great potential to produce DHA. The addition of Pd atoms may facilitate GLY oxidation pathway towards the direction of GALD generation. The Pt@Ag-NaCl possesses the largest DHA selectivity of 79.09% at 1.3 V while the Pt@Ag-NH3 exhibits the largest GLA selectivity of 45.01% at 0.5 V. The superior activity and selectivity of the NH3·H2O etched samples can be ascribed to the abundant defects in their unique structures. This work demonstrates that both the activity and selectivity of GLY electro-oxidation can be tuned simultaneously by delicately engineering the surface atoms.Conflicts of interest
The authors declare no conflict of interest.Acknowledgements
The project was financially supported by the National Natural Science Foundation of China (21706081), 111 Project (B17018) and the Open Project Program of Guangdong Provincial Key Laboratory of Nutraceuticals and Functional Foods.Notes and references
- S. S. Yazdani and R. Gonzalez, Curr. Opin. Biotechnol., 2007, 18, 213–219 CrossRef CAS.
- D. Leea, Y. Kim, Y. Kwon, J. Lee, T. Kim, Y. Noh, W. B. Kim, M. H. Seo, K. Kim and H. J. Kim, Appl. Catal., B, 2019, 245, 555–568 CrossRef.
- B. Katryniok, H. Kimura, E. Skrzynska, J.-S. Girardon, P. Fongarland, M. Capron, R. Ducoulombier, N. Mimura, S. Paul and F. Dumeignil, Green Chem., 2011, 13, 1960–1979 RSC.
- D. Cespi, F. Passarini, G. Mastragostino, I. Vassura, S. Larocca, A. Iaconi, A. Chieregato, J.-L. Duboise and F. Cavani, Green Chem., 2015, 17, 343–355 RSC.
- M. Simões, S. Baranton and C. Coutanceau, ChemSusChem, 2012, 5, 2106–2124 CrossRef PubMed.
- Y. Zhang, S. Zheng, X. Zhou, Z. Min and F. Jin, Green Chem., 2012, 14, 3285–3288 RSC.
- L. Huang, J. Y. Sun, S. H. Cao, M. Zhan, Z. R. Ni, H. J. Sun, Z. Chen, Z. Y. Zhou, E. G. Sorte, Y. J. Tong and S. G. Sun, ACS Catal., 2016, 6, 7686–7695 CrossRef CAS.
- H. Du, K. Wang, P. Tsiakaras and P. Shen, Appl. Catal., B, 2019, 258, 117951 CrossRef CAS.
- L. Thia, M. Xie, D. Kim and X. Wang, Catal. Sci. Technol., 2017, 7, 874–881 RSC.
- J. F. Gomes, A. C. Garcia, L. H. S. Gasparotto, N. E. de Souza, E. B. Ferreira, C. Pires and G. Tremiliosi-Filho, Electrochim. Acta, 2014, 144, 361–368 CrossRef CAS.
- C. Dai, L. Sun, H. Liao, B. Khezri, R. D. Webster, A. C. Fisher and Z. J. Xu, J. Catal., 2017, 356, 14–21 CrossRef CAS.
- P. S. Fernandez, P. Tereshchuk, C. A. Angelucci, J. F. Gomes, A. C. Garcia, C. A. Martins, G. A. Camara, M. E. Martins, J. L. F. Da Silva and G. Tremiliosi-Filho, Phys. Chem. Chem. Phys., 2016, 18, 25582–25591 RSC.
- Y. Holade, C. Morais, K. Servat, T. W. Napporn and K. B. Kokoh, ACS Catal., 2013, 3, 2403–2411 CrossRef CAS.
- A. C. Garcia, M. J. Kolb, C. V. Y. Sanchez, J. Vos, Y. Y. Birdja, Y. Kwon, G. Tremiliosi-Filho and M. T. M. Koper, ACS Catal., 2016, 6, 4491–4500 CrossRef CAS.
- Y. Zhou, Y. Shen and J. Xi, Appl. Catal., B, 2019, 245, 604–612 CrossRef CAS.
- S. Lee, H. J. Kim, E. J. Lim, Y. Kim, Y. Noh, G. W. Huber and W. B. Kim, Green Chem., 2016, 18, 2877–2887 RSC.
- Z. Zhang, L. Xin and W. Li, Appl. Catal., B, 2012, 119–120, 40–48 CrossRef CAS.
- Y. Kwon, K. J. P. Schouten and M. T. M. Koper, ChemCatChem, 2011, 3, 1176–1185 CrossRef CAS.
- A. Zalineeva, S. Baranton and C. Coutanceau, Electrochim. Acta, 2015, 176, 705–717 CrossRef CAS.
- A. C. Garcia, Y. Y. Birdja, G. Tremiliosi-Filho and M. T. M. Koper, J. Catal., 2017, 346, 117–124 CrossRef CAS.
- Y. Kwon, Y. Birdja, I. Spanos, P. Rodriguez and M. T. M. Koper, ACS Catal., 2012, 2, 759–764 CrossRef CAS.
- Y. Kwon, T. J. P. Hersbach and M. T. M. Koper, Top. Catal., 2014, 57, 1272–1276 CrossRef CAS.
- H. Wang, L. Thia, N. Li, X. Ge, Z. Liu and X. Wang, ACS Catal., 2015, 5, 3174–3180 CrossRef CAS.
- Z. Chen, C. Liu, X. Zhao, H. Yan, J. Li, P. Lyu, Y. Du, S. Xi, K. Chi, X. Chi, H. Xu, X. Li, W. Fu, K. Leng, S. J. Pennycook, S. Wang and K. P. Loh, Adv. Mater., 2019, 31, 1804763 CrossRef PubMed.
- H. Wang, L. Thia, N. Li, X. Ge, Z. Liu and X. Wang, Appl. Catal., B, 2015, 166–167, 25–31 CAS.
- Y. Wang, P. Han, X. Lv, L. Zhang and G. Zheng, Joule, 2018, 2, 2551–2582 CrossRef CAS.
- T. Sun, G. Zhang, D. Xu, X. Lian, H. Li, W. Chen and C. Su, Mater. Today Energy, 2019, 12, 215–238 CrossRef.
- K. D. Gilroy, X. Yang, S. Xie, M. Zhao, D. Qin and Y. Xia, Adv. Mater., 2018, 30, 1706312 CrossRef PubMed.
- Y. Zhou, Y. Shen and J. Piao, ChemElectroChem, 2018, 5, 1636–1643 CrossRef CAS.
- Y. Zhou, Z. Wang, Z. Pan, L. Liu, J. Xi, X. Luo and Y. Shen, Adv. Mater., 2019, 31, 1806769 CrossRef PubMed.
- Y. Shen, Y. Zhou, D. Wang, X. Wu, J. Li and J. Xi, Adv. Energy Mater., 2018, 8, 1701759 CrossRef.
- Y. Zhou and Y. Shen, Electrochem. Commun., 2018, 90, 106–110 CrossRef CAS.
- N. Zhang, L. Bu, S. Guo, J. Guo and X. Huang, Nano Lett., 2016, 16, 5037 CrossRef CAS PubMed.
- W. Zhao, B. Ni, Q. Yuan, P. He, Y. Gong, L. Gu and X. Wang, Adv. Energy Mater., 2017, 7, 1601593 CrossRef.
- M. Tsuji, M. Hamasaki, A. Yajima, M. Hattori, T. Tsuji and H. Kawazumi, Mater. Lett., 2014, 121, 113–117 CrossRef CAS.
- H. Wang, S. Zhou, K. D. Gilroy, Z. Cai and Y. Xia, Nano Today, 2017, 15, 121–144 CrossRef CAS.
- X. Lu, L. Au, J. McLellan, Z. Y. Li, M. Marquez and Y. Xia, Nano Lett., 2007, 7, 1764–1769 CrossRef CAS PubMed.
- Z. Zhang, L. Xin, J. Qi, D. J. Chadderdon and W. Li, Appl. Catal., B, 2013, 136–137, 29–39 CrossRef CAS.
- Y. Zhou, Y. Shen and X. Luo, J. Catal., 2020, 381, 130–138 CrossRef CAS.
- P. Strasser, S. Koh, T. Anniyev, J. Greeley, K. More, C. Yu, Z. Liu, S. Kaya, D. Nordlund and H. Ogasawara, Nat. Chem., 2010, 2, 454–460 CrossRef CAS.
- L. Bu, N. Zhang, S. Guo, X. Zhang, J. Li, J. Yao, T. Wu, G. Lu, J. Y. Ma and D. Su, Science, 2016, 354, 1410 CrossRef CAS.
- A. C. Garcia, J. Caliman, E. B. Ferreira, G. Tremiliosi-Filho and J. J. Linares, ChemElectroChem, 2015, 2, 1036–1041 CrossRef CAS.
Footnote |
| † Electronic supplementary information (ESI) available. See DOI: 10.1039/d0na00252f |
| This journal is © The Royal Society of Chemistry 2020 |

