 Open Access Article
Metal-enhancement study of dual functional photosensitizers with aggregation-induced emission and singlet oxygen generation†
Mohammad
Tavakkoli Yaraki‡
ab,
Fang
Hu‡
b,
Soroosh
Daqiqeh Rezaei
ac,
Bin
Liu
 *b and
Yen Nee
Tan
 *ad
*ad
aInstitute of Materials Research and Engineering, Agency for Science, Technology and Research (A*STAR), 138634, Singapore. E-mail: yennee.tan@ncl.ac.uk
bDepartment Chemical and Biomolecular Engineering, National University of Singapore, 4 Engineering Drive 4, Singapore 117585, Singapore. E-mail: cheliub@nus.edu.sg
cDepartment of Mechanical Engineering, National University of Singapore, 9 Engineering Drive 1, 117575, Singapore
dFaculty of Science, Agriculture & Engineering, Newcastle University, Newcastle Upon Tyne NE1 7RU, UK
First published on 10th June 2020
Abstract
Photosensitizers with aggregation-induced emission (AIE-PS) are attractive for image-guided photodynamic therapy due to their dual functional role in generating singlet oxygen and producing high fluorescent signal in the aggregated state. However, their brightness and treatment efficiency maybe limited in current practice. Herein we report the first systematic investigation on the metal-enhanced fluorescence (MEF) and singlet oxygen generation (ME-SOG) ability of our newly synthesized AIE-photosensitizers. The Ag@AIE-PS of varied sizes were prepared via layer-by-layer assembly with controlled distance between silver nanoparticles (AgNPs) and AIE-PS. A maximum of 6-fold enhancement in fluorescence and 2-fold increment in SOG were observed for the 85nmAg@AIE-PS. Comprehensive characterization and simulation were conducted to unravel the plasmon-enhancement mechanisms of Ag@AIE-PS. Results show that MEF of AIE-PS is determined by the enhanced electric field around AgNPs, while ME-SOG is dictated by the scattering efficiency of the metal core, where bigger AgNPs would result in larger enhancement factor. Furthermore, the optimum distance between AgNPs and AIE-PS to achieve maximum SOG enhancement is shorter than that required for the highest MEF. The correlation of MEF and ME-SOG found in this study is useful for designing new a generation of AIE-photosensitizers with high brightness and treatment efficiency towards practical theranostic application in the future.
1. Introduction
Aggregation-induced emission fluorogens (AIEgens) are a new class of fluorogens that do not emit light in the molecular state, but become highly emissive in the aggregated state due to the restriction of intramolecular motions. Unlike the traditional organic fluorophores, which often suffer from the aggregation-caused quenching (ACQ) effect, AIEgens possess numerous advantages such as good photostability, high brightness, and efficient light-harvesting properties in the aggregated state, which make them especially suitable for biological sensing and imaging applications.1–4 More recently, AIE-based photosensitizers (AIE-PSs) tailored with both AIE and singlet oxygen generation (SOG) properties have been successfully developed. The use of such AIE-PS for image-guided photodynamic therapy can greatly improve the treatment efficiency by overcoming the intrinsic ACQ effects faced by the traditional photosensitizers with reduced reactive oxygen species (ROS) generation rate in the aggregated state, especially when the loading of PS is high. To synthesize dual-functional AIE-PS, several molecular design strategies such as introducing electron donor (D) and electron acceptor (A) groups,5,6 tuning the distance between the donor and acceptor,5 and incorporating auxiliary acceptor groups5,7 to the AIEgens have been employed to decrease the singlet-triplet energy gap (ΔEST) and enhance the intersystem crossing (ISC) rate. However, it remains challenging to improve both the SOG efficiency and brightness of fluorescence concurrently by molecular design of AIEgens as both functions consume the excited state.Plasmonic nanoparticles (NPs) such as gold and silver NPs, have unprecedented ability to localize and enhance their surrounding electric field and confine it into subwavelength volumes due to the excitation of their surface plasmon resonance (SPR) by the incident electromagnetic field, leading to several applications from structural color printing,8,9 energy storage,10 and catalysis11–14 to metal NPs-based biosensors15–29 development. More recently, these localised SPR effects have been exploited to enhance the optoelectronic properties of functional materials, such as fluorophores and photosensitizers, leading to a new field of studying metal-enhanced fluorescence (MEF)30–41 and singlet oxygen generation (ME-SOG).42–48
To date, several works have been reported to tune the distance between the fluorophore and the metallic surface in controlling the plasmonic-enhancement effects.49–51 For example, Liang et al.49 employed the layer-by-layer (LBL) technique to control the distance between the conjugated polymeric fluorophore (PFVBT) and silver nanocubes (for up to three bilayers) by using oppositely charged polyelectrolytes for the assembly. In another study, silica-coated silver nanoparticles with varied shell thickness (up to 30 nm) have been used to investigate the interparticle distance-dependent fluorescence of the ultrasmall sized gold nanoclusters.50 Other than fluorescence, singlet oxygen generation is another interesting property of some fluorophores (also known as photosensitizer, PS), arising from the intersystem crossing in the excited fluorophore. Due to the interactions of the excited fluorophore and plasmonic NPs,42,48,52–54 photostability and SOG rate of the photosensitizers could be enhanced.43 For instance, Ke and coworkers55 have reported the simultaneous enhancement of fluorescence and SOG of the aluminium phthalocyanine on the surface of Au@silica nanorods. However, no correlation was found between the optimum distance for MEF and ME-SOG. To the best of our knowledge, metal-enhancement study of the AIE-based photosensitizer (AIE-PS) and the correlation of their intrinsic fluorescent and singlet oxygen generation properties have not been reported.
In this study, we have conducted a systematic investigation to unravel the correlation of the metal-enhanced fluorescence and metal-enhanced singlet oxygen generation of our newly synthesized dual-functional AIE-PS. Specifically, layer-by-layer technique is utilized to control the distance between the silver nanoparticles (AgNPs) and AIE-PS molecules using differently charged polyelectrolytes. Although the enhancement factors for either fluorescence or singlet oxygen generation is unique for each of the AIE-PSs nanohybrids, it was found that the maximum singlet oxygen occurs at a shorter distance between AgNPs and AIE-PS than that with the maximum fluorescence. The correlation found between the MEF and ME-SOG of Ag@AIE-PS nanohybrids in this study could be useful for designing brightly fluorescent photosensitizers. That will, in turn, open up new opportunities to enhance the unique properties of AIE-based photosensitizers for effective theranostic treatment in the future.
2. Results and discussion
2.1. Synthesis of yellow emissive AIE-PS and study of its photophysical properties
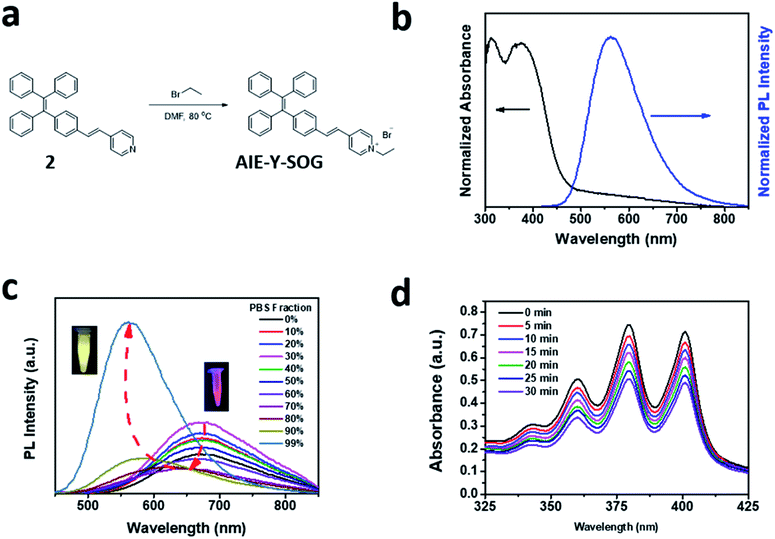
In this study, a new photosensitizer with aggregation-induced emission (AIE-Y-SOG) was synthesized as the model AIE-based photosensitizer (AIE-PS) to investigate the enhancement effects by the silver nanoparticles (AgNPs). Fig. 1a shows the synthetic route of AIE-Y-SOG formation. Simple heating the mixture of compound 2 with bromoethane in DMF resulted in the formation of yellow emissive AIE-Y-SOG in PBS buffer (inset of Fig. 1c). The chemical structure of the purified AIE-Y-SOG was confirmed by the nuclear magnetic resonance (NMR) spectroscopy (Fig. S1†). Fig. 1b shows the unique optical properties of the as-synthesized AIE-Y-SOG. By introducing an electron-withdrawing group (i.e., vinyl-pyridinium) to tetraphenylethylene (TPE), AIE-Y-SOG was obtained with intramolecular charge transfer character. AIE-Y-SOG has an absorption maximum at 385 nm with yellow emission at 595 nm.56 The presence of vinyl-pyridinium moiety renders AIE-Y-SOG with positive charges at neutral and acidic pH. Interestingly, the introduction of vinyl-pyridinium also reduces the singlet-triplet gap (ΔEST) of the AIE-Y-SOG,6 endowing it with the unique photosensitizing ability, which can be utilized for photodynamic therapy (PDT).57–59 The large Stokes shift (about 210 nm) in AIE-Y-SOG could be attributed to the strong intramolecular charge transfer as a result of the incorporation of the electron-donating and accepting groups to the TPE moiety.56The AIE behavior of AIE-Y-SOG was investigated in a mixture of dimethyl siloxane (DMSO) as good solvent and PBS as a poor solvent. As shown in Fig. 1c, the AIE-Y-SOG shows red emission (cantered at 680 nm, inset of Fig. 1c) in the DMSO solution. The emission intensity was decreased gradually as the PBS fraction was increased up to 80%, due to the twisted intramolecular charge transfer (TICT) effect.60,61 Then, the fluorescence intensity was recovered with blue-shifted emission peaked at 595 nm, showing yellow emission in PBS buffer (inset of Fig. 1c). This enhanced fluorescence effects (as compared with the diluted AIE-Y-SOG in DMSO) could be attributed to the restriction of intramolecular motions, which is activated by the formation of AIE-Y-SOG nanoparticles (NPs) in PBS solution. Fig. S2† shows that AIE-Y-SOG NPs in PBS have an average hydrodynamic diameter of 155 ± 4 nm as measured by dynamic light scattering (DLS). The fluorescence quantum yield of AIE-Y-SOG NPs was calculated to be 4.9%, measured against the 4-(dicyanomethylene)-2-methyl-6-(p-dimethylaminostyryl)-4H-pyran (DCM) as reference.
2.2. Investigation of the metal-enhanced fluorescence of AIE-PS
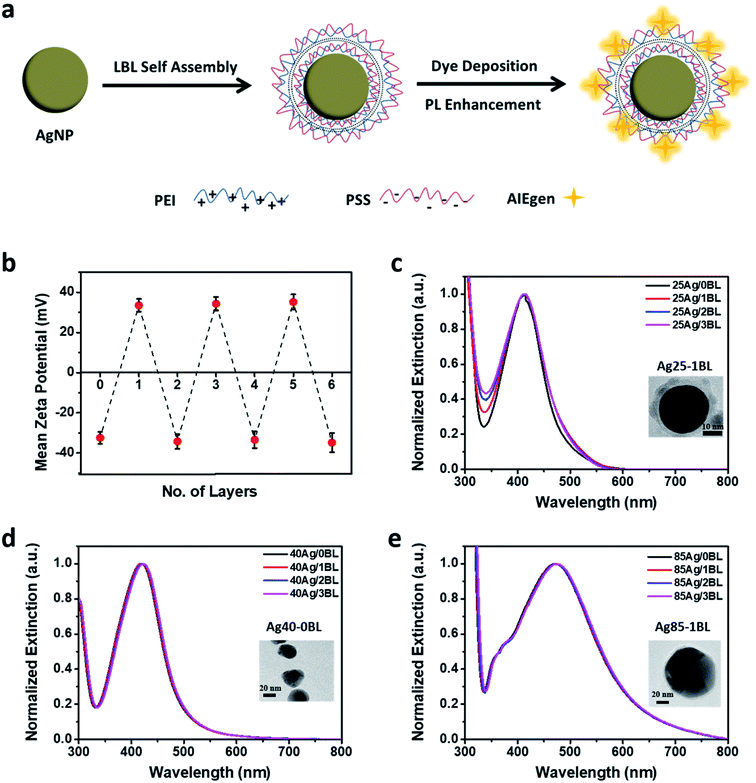
Upon successful synthesis of the well-dispersed AgNPs, a suitable pair of oppositely charged polyelectrolytes (PEs) were selected to enable the layer-by-layer (LBL) assembly onto the AgNPs surface. Based on the consideration of molecular weight and structure of PEs, polyethyleneimine (PEI, Mw = 2000) and poly(styrene sulfuric acid) sodium salt (PSS, Mw = 70![[thin space (1/6-em)]](https://www.rsc.org/images/entities/char_2009.gif) 000) were selected in this study (Fig. 2a) to form the bilayers of suitable thickness in controlling the distance between AgNPs and AIEgens for the metal-enhancement study. To obtain a thin bilayer of PEs, suitable solution pH (i.e., pH = 3) in consideration of the pKa and pKb of the two polyelectrolytes and NaCl concentration (10 mM)63–65 were selected for the LBL assembly of PEI and PSS onto AgNPs. The presence of tannic acid on the surface of AgNPs enables the adsorption of positively charged PEI on the negatively charged AgNPs. Fig. 2b shows the variation of the zeta potential for the 25 nm AgNPs after deposition of each layer of polyelectrolyte, indicating the successful assembly of PEI or PSS in each step. As shown in Fig. 2c–e, the as-formed PEs-coated AgNPs are stable throughout the LBL assembly process since no apparent redshift in the SPR peak or change in the intensity of extinction at the higher wavelengths (>600 nm) were observed. Based on the TEM images of PEs-coated AgNPs (see insets of Fig. 2c for 25Ag/1BL and Fig. 2e for 85Ag/1BL, respectively), the thickness of each PEI/PSS bilayer is estimated to be around 3.5 nm.
000) were selected in this study (Fig. 2a) to form the bilayers of suitable thickness in controlling the distance between AgNPs and AIEgens for the metal-enhancement study. To obtain a thin bilayer of PEs, suitable solution pH (i.e., pH = 3) in consideration of the pKa and pKb of the two polyelectrolytes and NaCl concentration (10 mM)63–65 were selected for the LBL assembly of PEI and PSS onto AgNPs. The presence of tannic acid on the surface of AgNPs enables the adsorption of positively charged PEI on the negatively charged AgNPs. Fig. 2b shows the variation of the zeta potential for the 25 nm AgNPs after deposition of each layer of polyelectrolyte, indicating the successful assembly of PEI or PSS in each step. As shown in Fig. 2c–e, the as-formed PEs-coated AgNPs are stable throughout the LBL assembly process since no apparent redshift in the SPR peak or change in the intensity of extinction at the higher wavelengths (>600 nm) were observed. Based on the TEM images of PEs-coated AgNPs (see insets of Fig. 2c for 25Ag/1BL and Fig. 2e for 85Ag/1BL, respectively), the thickness of each PEI/PSS bilayer is estimated to be around 3.5 nm.
 | (1) |
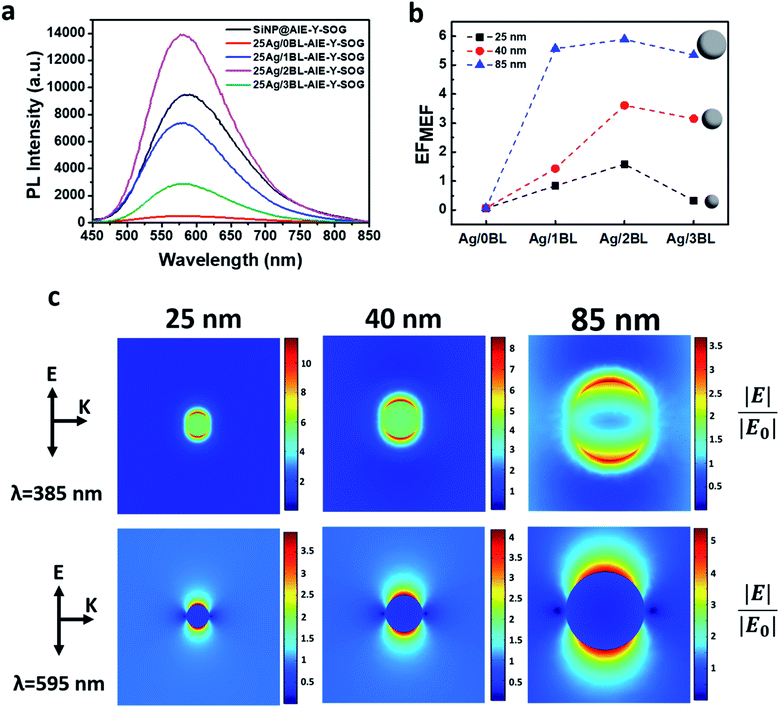
As can be seen in Fig. 3a, the fluorescence of AIE-Y-SOG was quenched at the close vicinity of AgNPs when no polyelectrolyte (0BL sample) was introduced. This phenomenon is due to the significant energy transfer rate from the excited AIE-Y-SOG to the AgNPs surface. It was found that the fluorescence enhancement factor increases with the increasing number of bilayers and reaches a maximum before decreasing with the increased distance. This trend indicates the distance-dependent nature of the MEF of Ag@AIE-Y-SOG in the nanohybrid system. The maximum MEF (∼1.4-fold enhancement) was obtained for the nanohybrids consisting of 25 nm AgNPs with 2 PEI/PSS bilayers, which is estimated to have a spacing of 7 nm between the AgNPs and AIE-Y-SOG.
To investigate the size-dependent MEF of AIE-Y-SOG, two other sizes of AgNPs (i.e., 40 nm and 85 nm) were synthesized. Similar LBL assembly conditions were used to form the Ag@AIE-Y-SOG nanohybrids with different number of PEI/PSS bilayers (BL). Fig. 3b shows the distance-dependent MEF effect for different sizes of AgNPs, where 2BL is the optimum distance for all the sizes of AgNPs tested in this study. It was also found that the fluorescence enhancement factor (EFMEF) increases with the increasing sizes of AgNPs. The highest enhancement of 6-fold was achieved for the 85 nm Ag@AIE-Y-SOG sample with 2 bilayers. Simulation has been conducted to better understand the plasmon-enhanced fluorescence. The enhanced electric field (|E|/|E0|) around the AgNPs of different sizes excited at the 385 nm wavelength (i.e., excitation wavelength of AIE-Y-SOG) are shown in Fig. 3c (top row). Although the enhanced electric field on the surface of 25 nm AgNPs is stronger than the 40 nm and 85 nm AgNPs, the quenching effect of a small AgNPs (e.g., 25 nm) is much higher than the large NPs (e.g.,85 nm) as reported in other literature.66,67 Hence, the EFMEF is higher when the fluorophore locates around a bigger AgNP. Another possible reason is the volumetric effect of the enhanced electric field around AgNPs, where bigger nanoparticles can enhance the electric field in a more prominent space/distance from the surface of metal NPs. Hence, more fluorophore molecules could be located there and subsequently be excited.68,69 To assess this volumetric effect, the surface average enhanced electric field around the AgNPs at different distances was calculated. As can be seen in Fig. S5,† the electric field at the surface of 25 nm AgNP is higher than the 40 nm and 85 nm AgNPs. The magnitude of the electric field is however, in a reverse order of AgNP (85 nm) > AgNP (40 nm) > AgNP (25 nm) for more than 6 nm from the surface of AgNP. These results are in good agreement with the experimental data presented in Fig. 3b where the MEF effect is highest for the AIE-Y-SOG on 85Ag/2BL as compared with the AgNPs of the smaller particle size and same number of bilayers. In addition, the enhanced electric field around the AgNPs at the 595 nm wavelength (i.e., emission wavelength of AIE-Y-SOG) was simulated (Fig. 3c, bottom row). The enhanced electric field at this wavelength shows that the electrons in AgNPs could be excited when AIE-Y-SOG is emitting fluorescence, leading to the plasmonic-coupling effect of AgNPs in MEF. Furthermore, it was found that the magnitude of the enhanced electric field is in order of AgNP (85 nm) > AgNP (40 nm) > AgNP (25 nm), which is aligned with the size-dependent fluorescence enhancement factor for AIE-Y-SOG as observed experimentally in Fig. 3b.
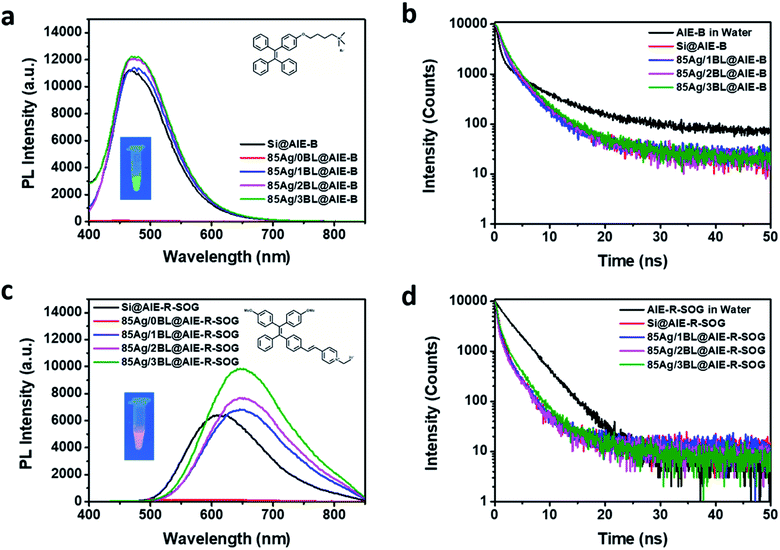
To better understand the MEF effects of the AIE-based photosensitizer, two other AIEgens were synthesized (see ESI, Page S2†). They are the blue emissive AIE-B without SOG ability (inset of Fig. 5a) and the red emissive AIE-R-SOG with SOG ability (inset of Fig. 5c). AIE-B is composed of an iconic AIE core, TPE74 and positively charged ammonium salt, which is linked by alkoxy. Similar to TPE,75 it has an ultraviolet-visible absorption, with a maximum absorbance peak at 321 nm, exhibiting blue emission at 485 nm. The AIE-B can neither generate singlet oxygen nor form AIE nanoparticles in PBS solution (Scheme S1, Fig. S6, and S7†). On the other hand, AIE-R-SOG is an improved AIE-PS from the AIE-Y-SOG by decorating two electron-donating methoxy groups. The donor–acceptor effect makes the absorption and emission of AIE-R-SOG further red-shifted to 405 nm and 625 nm, respectively. Meanwhile, the AIE-R-SOG also possesses the photosensitizing ability to generate singlet oxygen (Fig. S8†). It can also form the AIE nanoparticles in PBS solution with a twisted intramolecular charge transfer behavior, as reported previously.61
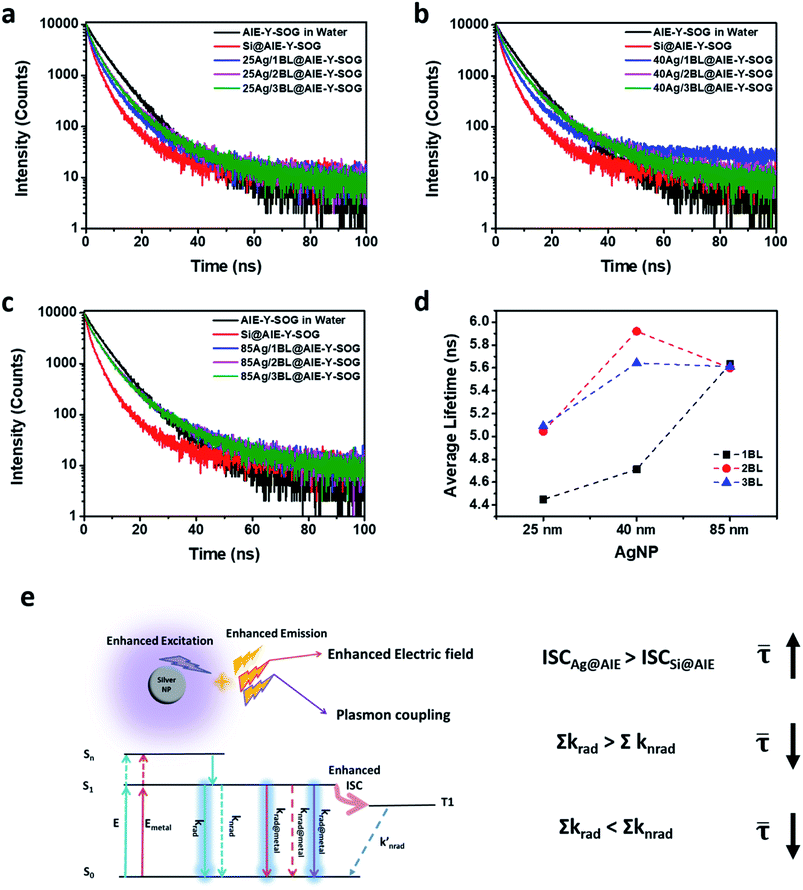
The Ag@AIE-B and Ag@AIE-R-SOG nanohybrids were then prepared using the same pairs of PEI/PSS polyelectrolytes and assembly conditions. Their MEF effects were studied and compared with the Ag@AIE-Y-SOG (Fig. 5). As can be seen in Fig. 5a and c, the maximum PL intensity for both AIE-B and AIE-R-SOG was observed at a distance of three bilayers. According to Table S2† (and Fig. 5b), the Ag@AIE-B samples has a longer fluorescence lifetime as compared to the control sample of AIE-B loaded on silica NPs. This result suggested that the fluorescence dynamic of AIE-B depended on its distance from the surface of AgNPs. Since AIE-B can neither generate singlet oxygen nor form AIE nanoparticles in PBS solution, its fluorescence behaviour should follow the classical model, i.e., fluorescence lifetime is a function of the radiative decay rate and non-radiative decay rate. These two decay rates are manipulated when the AIE-B is placed in the vicinity of AgNPs, resulting in changes in the fluorescence lifetime for the samples prepared with varied separation distances between the AIE-B and AgNPs. Although no change or a decrease in fluorescence lifetime is expected in MEF system, there are a few reports on the increase in the fluorescence lifetime of the fluorophore in the vicinity of metallic NPs.76 In addition, the lower fluorescence enhancement of AIE-B could be attributed to the smaller overlap between the absorbance of the AIE-B (centred at 321 nm) and the extinction spectra of AgNPs.77,78 Likewise, the fluorescence lifetime of Ag@AIE-R-SOG samples are slightly longer than the control sample loaded on silica NPs (Fig. 5d and Table S3†). This is because AIE-R-SOG is a photosensitizer molecule, which changes in the radiative decay rates, non-radiative decay rates and intersystem crossing rate determine the fluorescence lifetime of AIE-R-SOG when placing near to the AgNPs. The same phenomenon was observed in the Ag@AIE-Y-SOG nanohybrids with AgNPs of different sizes and number of PEI/PSS bilayers.
2.3. Investigation of the correlation between MEF and ME-SOG of AIE-PS
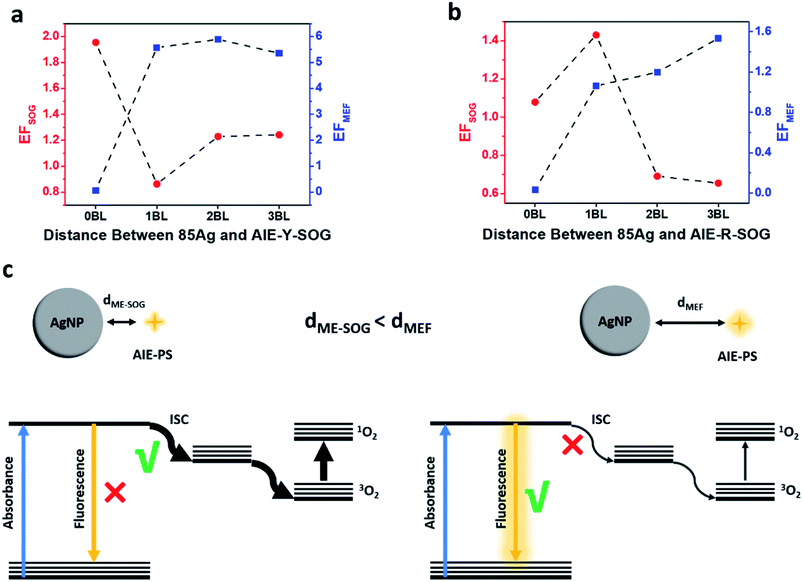
To understand the correlation between the metal-enhanced fluorescence (MEF) and metal-enhanced singlet oxygen generation (ME-SOG) of AIE-PSs, the SOG rate of different AIE-PSs (i.e., AIE-Y-SOG and AIE-R-SOG) in the presence of AgNPs core was measured using 9,10-anthracenediyl-bis(methylene)dimalonic acid (ABDA) as an indicator. ABDA is an anthracene derivative, which can trap the singlet oxygen molecule and convert to an endoperoxide product. The disappearance of the characteristic absorption peak of ABDA indicates the amount of consumed ABDA and correspondingly, the amount of produced singlet oxygen by the photosensitizer. Thus, the degradation of ABDA was monitored by its UV-vis spectra (Fig. S9†). Similar to MEF, the enhanced electric field around the silver nanoparticles results in the enhanced excitation rate, which in turn increases the population of electrons in the excited singlet state (S1). The excited electrons in the singlet state may go through the intersystem crossing process (S1 → T1) and produce excited electrons in the triplet state (T1). Finally, the increased population of electrons in T1 will result in a higher amount of singlet oxygen generation (see Fig. 4e).52,72 Fig. S10a† shows the ME-SOG effect of Ag@AIE-Y-SOG prepared using different size of AgNPs and numbers of bilayers similar to the MEF study. It was found that the singlet oxygen generation has an opposite trend as compared with the MEF of Ag@AIE-Y-SOG (Fig. 3b). The ME-SOG effect is maximum when AgNPs directly contacted with the AIE-Y-SOG (i.e., 0BL) and the observed enhancement effects decreased with increasing distance (number of bilayers) between them. The enhancement factor of singlet oxygen generation (EFSOG, see Page S4 in ESI† for detailed calculation) is a function of the AgNPs size (Fig. S10a†). The calculated EFSOG for the 85 nm Ag@AIE-Y-SOG is higher than the 25 nm Ag@AIE-Y-SOG. The simulated scattering efficiencies of AgNP samples indicate that 85 nm AgNP has a higher scattering efficiency when they exposed to the white light (Fig. S10b†). The correlation between ME-SOG and scattering efficiency in our study is in agreement with the literature,54,79 indicating the important role of the metal NP's scattering efficiency in enhancing singlet oxygen generation. The slight increase in EFSOG for the 2BL Ag@AIE-Y-SOG samples could be attributed to an increase in the intersystem crossing and the competition between different pathways for excited electrons. Planas et al.42 have reported the distance-dependent ME-SOG effects of the AgNPs@Rose Bengal nanohybrid where the maximum enhancement occurs at a distance of 20 nm between the 67 nm AgNPs and Rose Bengal as the photosensitizer. However, our results for the AIE-Y-SOG show a different trend where the maximum ME-SOG occurs at the surface of AgNPs (i.e., 0 bilayer), which is in agreement with the results reported by Zhang et al.52 We further studied the ME-SOG of AIE-R-SOG with 85 nm AgNPs at distance controlled by the similar number of bilayers as the 85 nm Ag@AIE-Y-SOG (Fig. S11†). Comparing the distance-dependent MEF and ME-SOG data for the two studied AIE-PSs (i.e., AIE-Y-SOG and AIE-R-SOG in Fig. 6a and b) reveals that the optimum distance of ME-SOG (dME-SOG) required to achieve the maximum enhancement factor is shorter than that required for the maximum fluorescence intensity (dMEF) in the Ag@AIE-PS nanohybrid system. In addition, these optimum distances (i.e., dME-SOG and dMEF) are unique for each Ag@AIE-PS nanohybrid system and should be obtained experimentally. According to the classical Jablonski diagrams as shown in Fig. 6c, either the intersystem crossing (ISC) rate or radiative decay rates could be enhanced in AIE-PS placed in a proximity of the silver nanoparticle. Since the ISC is a non-radiative process, it tends to be enhanced at a shorter distance (e.g., 1 bilayer thickness for the Ag@AIE-R-SOG with an estimated dME-SOG = 3.5 nm), where the non-radiative decay rates are enhanced dramatically as compared to the radiative decay rates. In contrast, radiative decay rates become dominant at a longer distance (e.g., 3 bilayer thickness for the Ag@AIE-R-SOG with estimated dMEF = 10.5 nm). The correlation as observed in study is important in designing the effective metal-enhanced AIE-based photosensitizer for effect theranostic treatment.3. Conclusion
In summary, we have systematically studied the metal-enhanced fluorescence (MEF) and singlet oxygen generation (ME-SOG) of the Ag@AIE-PS nanohybrids prepared via layer-by-layer assembly of PEI/PSS polyelectrolytes to control the distance between AgNPs and AIE-PS. Both sizes and distance-dependent effects of Ag@AIE-PS on the MEF and ME-SOG were carefully investigated. It was found that the 85 nm Ag NPs could lead to about 6-fold enhancement in fluorescence and 1.95-fold increment in singlet oxygen generation for the yellow emissive AIE-Y-SOG synthesized in this study. While the enhancement of singlet oxygen generation was mainly determined by the enhanced excitation due to a stronger scattering around the bigger AgNPs, the fluorescence enhancement of AIE-PS was determined by two competing processes, i.e., (1) enhanced excitation and plasmonic-coupling due to enhanced electric field around the AgNPs and (2) energy transfer to the metallic NPs. Time-resolved fluorescence study also indicates that the balance among radiative decay rate, non-radiative decay rate, and intersystem crossing rate in AIE-PSs could be changed in the vicinity of AgNPs. Nonetheless, the optimum distance of ME-SOG required to achieve the maximum enhancement factor (e.g., 0BL for AIE-Y-SOG) is usually shorter than that required for the highest MEF (e.g., 2BL for AIE-Y-SOG). This information is useful for the development of effective AIE-PS based theranostic agents with high brightness and improved efficacy for practical application of image-guided PDT treatment in the future.Conflicts of interest
There are no conflicts to declare.Acknowledgements
M. T. Y. would like to thank Dr Aarash Nemati for the discussion on simulations. M. T. Y. and S. D. R. acknowledge the scholarship provided by the Agency for Science, Technology and Research (A*STAR) through the Singapore International Graduate Award (SINGA). The authors also acknowledge the support from the Institute of Materials Research and Engineering, National University of Singapore and Newcastle University for the collaborative research.References
- J. Liang, B. Z. Tang and B. Liu, Chem. Soc. Rev., 2015, 44, 2798–2811 RSC.
- D. Ding, K. Li, B. Liu and B. Z. Tang, Acc. Chem. Res., 2013, 46, 2441–2453 CrossRef CAS PubMed.
- Z. Song, W. Zhang, M. Jiang, H. H. Sung, R. T. Kwok, H. Nie, I. D. Williams, B. Liu and B. Z. Tang, Adv. Funct. Mater., 2016, 26, 824–832 CrossRef CAS.
- J. Geng, W. L. Goh, C. Zhang, D. P. Lane, B. Liu, F. Ghadessy and Y. N. Tan, J. Mater. Chem. B, 2015, 3, 5933–5937 RSC.
- S. Xu, W. Wu, X. Cai, C.-J. Zhang, Y. Yuan, J. Liang, G. Feng, P. Manghnani and B. Liu, Chem. Commun., 2017, 53, 8727–8730 RSC.
- S. Xu, Y. Yuan, X. Cai, C.-J. Zhang, F. Hu, J. Liang, G. Zhang, D. Zhang and B. Liu, Chem. Sci., 2015, 6, 5824–5830 RSC.
- W. Wu, D. Mao, S. Xu, S. Ji, F. Hu, D. Ding, D. Kong and B. Liu, Mater. Horiz., 2017, 4, 1110–1114 RSC.
- S. Daqiqeh Rezaei, J. Ho, A. Naderi, M. Tavakkoli Yaraki, T. Wang, Z. Dong, S. Ramakrishna and J. K. W. Yang, Adv. Opt. Mater., 2019, 7, 1900735 CrossRef CAS.
- S. D. Rezaei, R. J. Hong Ng, Z. Dong, J. Ho, E. H. H. Koay, S. Ramakrishna and J. K. W. Yang, ACS Nano, 2019, 13, 3580–3588 CrossRef CAS PubMed.
- D. Singh, N. Singh, A. Garg and R. K. Gupta, Compos. Sci. Technol., 2019, 174, 158–168 CrossRef.
- M. Misra, N. Singh and R. K. Gupta, Catal. Sci. Technol., 2017, 7, 570–580 RSC.
- A. Lajevardi, M. Tavakkoli Yaraki, A. Masjedi, A. Nouri and M. Hossaini Sadr, J. Mol. Liq., 2019, 276, 371–378 CrossRef CAS.
- M. Mosaviniya, T. Kikhavani, M. Tanzifi, M. Tavakkoli Yaraki, P. Tajbakhsh and A. Lajevardi, Colloid Interface Sci. Commun., 2019, 33, 100211 CrossRef CAS.
- A. Nouri, M. Tavakkoli Yaraki, A. Lajevardi, Z. Rezaei, M. Ghorbanpour and M. Tanzifi, Colloid Interface Sci. Commun., 2020, 35, 100252 CrossRef CAS.
- H. V. Xu, Y. Zhao and Y. N. Tan, ACS Appl. Mater. Inter., 2019, 11, 27233–27242 CrossRef CAS PubMed.
- E. Assah, W. Goh, X. T. Zheng, T. X. Lim, J. Li, D. Lane, F. Ghadessy and Y. N. Tan, Colloids Surf., B, 2018, 169, 214–221 CrossRef CAS PubMed.
- J. Song, Y. N. Tan, D. Jańczewski, M. A. Hempenius, J. W. Xu, H. R. Tan and G. J. Vancso, Nanoscale, 2017, 9, 19255–19262 RSC.
- P. Chandra, Y. N. Tan and S. P. Singh, Next generation point-of-care biomedical sensors technologies for cancer diagnosis, Springer, 2017 Search PubMed.
- N. Seow, Y. N. Tan, L.-Y. L. Yung and X. Su, Sci. Rep., 2015, 5, 18293 CrossRef CAS PubMed.
- Y. N. Tan, A. Lai and X. Su, Sci. Adv. Mater., 2014, 6, 1460–1466 CrossRef CAS.
- N. Seow, Y. N. Tan and L. Y. L. Yung, Part. Part. Syst. Charact., 2014, 31, 1260–1268 CrossRef CAS.
- Y. N. Tan, K. H. Lee and X. Su, RSC Adv., 2013, 3, 21604–21612 RSC.
- Y. N. Tan, K. H. Lee and X. Su, Anal. Chem., 2011, 83, 4251–4257 CrossRef CAS PubMed.
- K. M. M. Aung, Y. N. Tan, K. V. Desai and X. Su, Aust. J. Chem., 2011, 64, 1288–1294 CrossRef.
- Y. N. Tan, X. Su, Y. Zhu and J. Y. Lee, ACS Nano, 2010, 4, 5101–5110 CrossRef CAS PubMed.
- Y. N. Tan, X. Su, E. T. Liu and J. S. Thomsen, Anal. Chem., 2010, 82, 2759–2765 CrossRef CAS PubMed.
- S. Dinda, F. L. Yap, V. Suresh, R. K. Gupta, D. Das and S. Krishnamoorthy, Aust. J. Chem., 2013, 66, 1034–1038 CrossRef CAS.
- M. Tavakkoli Yaraki, S. Daqiqeh Rezaei and Y. N. Tan, Phys. Chem. Chem. Phys., 2020, 22, 5673–5687 RSC.
- M. Tavakkoli Yaraki, S. Daqiqeh Rezaei, E. Middha and Y. N. Tan, Part. Part. Syst. Charact., 2020, 2000027, DOI:10.1002/ppsc.202000027.
- Y. Fu, J. Zhang and J. R. Lakowicz, J. Am. Chem. Soc., 2010, 132, 5540–5541 CrossRef CAS PubMed.
- Z. Zhu, P. Yuan, S. Li, M. Garai, M. Hong and Q.-H. Xu, ACS Appl. Bio Mater., 2018, 1, 118–124 CrossRef CAS.
- I. G. Theodorou, Z. A. Jawad, Q. Jiang, E. O. Aboagye, A. E. Porter, M. P. Ryan and F. Xie, Chem. Mater., 2017, 29, 6916–6926 CrossRef CAS.
- B. Della Ventura, M. Gelzo, E. Battista, A. Alabastri, A. Schirato, G. Castaldo, G. Corso, F. Gentile and R. Velotta, ACS Appl. Mater. Inter., 2019, 11, 3753–3762 CrossRef CAS PubMed.
- A. K. Tobias and M. Jones, J. Phys. Chem. C, 2019, 123, 1389–1397 CrossRef CAS.
- S. Pawar, A. Bhattacharya and A. Nag, ACS Omega, 2019, 4, 5983–5990 CrossRef CAS PubMed.
- S. M. Fothergill, C. Joyce and F. Xie, Nanoscale, 2018, 10, 20914–20929 RSC.
- R. Knoblauch and C. D. Geddes, Nanoscale, 2019, 11, 4337–4344 RSC.
- Z. Qu, P. Duan, J. Zhou, Y. Wang and M. Liu, Nanoscale, 2018, 10, 985–991 RSC.
- I. G. Theodorou, Z. A. R. Jawad, H. Qin, E. O. Aboagye, A. E. Porter, M. P. Ryan and F. Xie, Nanoscale, 2016, 8, 12869–12873 RSC.
- I. G. Theodorou, Q. Jiang, L. Malms, X. Xie, R. C. Coombes, E. O. Aboagye, A. E. Porter, M. P. Ryan and F. Xie, Nanoscale, 2018, 10, 15854–15864 RSC.
- T. Chung, Y. Lee, M.-S. Ahn, W. Lee, S.-I. Bae, C. S. H. Hwang and K.-H. Jeong, Nanoscale, 2019, 11, 8651–8664 RSC.
- O. Planas, N. Macia, M. Agut, S. Nonell and B. Heyne, J. Am. Chem. Soc., 2016, 138, 2762–2768 CrossRef CAS PubMed.
- L. Bekale, S. Barazzouk and S. Hotchandani, Part. Part. Syst. Charact., 2014, 31, 843–850 CrossRef CAS.
- Y. Yu, W. D. Lee and Y. N. Tan, Mater. Sci. Eng., C, 2020, 109, 110525 CrossRef CAS PubMed.
- M. B. Rivas Aiello, J. J. Romero, S. G. Bertolotti, M. C. Gonzalez and D. O. Mártire, J. Phys. Chem. C, 2016, 120, 21967–21975 CrossRef CAS.
- N. Macia, V. Kabanov, M. Côté-Cyr and B. Heyne, J. Phys. Chem. Lett., 2019, 10, 3654–3660 CrossRef CAS PubMed.
- N. Macia, R. Bresoli-Obach, S. Nonell and B. Heyne, J. Am. Chem. Soc., 2019, 141, 684–692 CrossRef CAS PubMed.
- S. M. Mooi and B. Heyne, Photochem. Photobiol., 2014, 90, 85–91 CrossRef CAS PubMed.
- J. Liang, K. Li, G. G. Gurzadyan, X. Lu and B. Liu, Langmuir, 2012, 28, 11302–11309 CrossRef CAS PubMed.
- J. K. Kim and D.-J. Jang, J. Mater. Chem. C, 2017, 5, 6037–6046 RSC.
- P. Pompa, L. Martiradonna, A. Della Torre, F. Della Sala, L. Manna, M. De Vittorio, F. Calabi, R. Cingolani and R. Rinaldi, Nat. Nanotech., 2006, 1, 126 CrossRef CAS PubMed.
- Y. Zhang, K. Aslan, M. J. Previte and C. D. Geddes, Proc. Natl. Acad. Sci. U. S. A., 2008, 105, 1798–1802 CrossRef CAS PubMed.
- N. Macia, R. Bresoli-Obach, S. Nonell and B. J. Heyne, J. Am. Chem. Soc., 2019, 141, 684–692 CrossRef CAS PubMed.
- N. Macia, V. Kabanov, M. Côté-Cyr and B. Heyne, J. Phys. Chem. Lett., 2019, 10, 3654–3660 CrossRef CAS PubMed.
- X. Ke, D. Wang, C. Chen, A. Yang, Y. Han, L. Ren, D. Li and H. Wang, Nanoscale Res. Lett., 2014, 9, 666 CrossRef PubMed.
- X. Gu, J. Yao, G. Zhang, C. Zhang, Y. Yan, Y. Zhao and D. Zhang, Chem.–Asian J., 2013, 8, 2362–2369 CrossRef CAS PubMed.
- F. Hu, S. Xu and B. Liu, Adv. Mater., 2018, 30, 1801350 CrossRef PubMed.
- S. D. Xu, Y. Y. Yuan, X. L. Cai, C. J. Zhang, F. Hu, J. Liang, G. X. Zhang, D. Q. Zhang and B. Liu, Chem. Sci., 2015, 6, 5824–5830 RSC.
- W. Wu, D. Mao, F. Hu, S. Xu, C. Chen, C. J. Zhang, X. Cheng, Y. Yuan, D. Ding and D. Kong, Adv. Mater., 2017, 29, 1700548 CrossRef PubMed.
- R. Hu, E. Lager, A. Aguilar-Aguilar, J. Liu, J. W. Lam, H. H. Sung, I. D. Williams, Y. Zhong, K. S. Wong and E. Pena-Cabrera, J. Phys. Chem. C, 2009, 113, 15845–15853 CrossRef CAS.
- F. Hu, X. Cai, P. N. Manghnani, W. Wu and B. Liu, Chem. Sci., 2018, 9, 2756–2761 RSC.
- Y. Cao, R. Zheng, X. Ji, H. Liu, R. Xie and W. Yang, Langmuir, 2014, 30, 3876–3882 CrossRef CAS PubMed.
- S. R. Lewis, S. Datta, M. Gui, E. L. Coker, F. E. Huggins, S. Daunert, L. Bachas and D. Bhattacharyya, Proc. Natl. Acad. Sci. U. S. A., 2011, 108, 8577–8582 CrossRef PubMed.
- C. Tedeschi, L. Li, H. Möhwald, C. Spitz, D. von Seggern, R. Menzel and S. Kirstein, J. Am. Chem. Soc., 2004, 126, 3218–3227 CrossRef CAS PubMed.
- C. Jiang, X. Liu, C. Luo, Y. Zhang, L. Shao and F. Shi, J. Mater. Chem. A, 2014, 2, 14048–14053 RSC.
- U. Raghavendra, M. Basanagouda, R. Melavanki and J. Thipperudrappa, Plasmonics, 2018, 13, 315–325 CrossRef CAS.
- A. Queiroz, A. Mezacasa, D. Graciano, W. Falco, J.-C. M'Peko, F. Guimarães, T. Lawson, I. Colbeck, S. Oliveira and A. Caires, Spectrochim. Acta, Part A, 2016, 168, 73–77 CrossRef CAS PubMed.
- A. Dragan and C. Geddes, Phys. Chem. Chem. Phys., 2011, 13, 3831–3838 RSC.
- J. Zhang, Y. Fu, M. H. Chowdhury and J. R. Lakowicz, J. Phys. Chem. C, 2008, 112, 18–26 CrossRef CAS PubMed.
- K. Aslan, I. Gryczynski, J. Malicka, E. Matveeva, J. R. Lakowicz and C. D. Geddes, Curr. Opin. Biotechnol., 2005, 16, 55–62 CrossRef CAS PubMed.
- A. I. Dragan, E. S. Bishop, J. R. Casas-Finet, R. J. Strouse, J. McGivney, M. A. Schenerman and C. D. Geddes, Plasmonics, 2012, 7, 739–744 CrossRef CAS.
- Y. Zhang, K. Aslan, M. J. Previte and C. D. Geddes, J. Fluoresc., 2007, 17, 345–349 CrossRef CAS PubMed.
- B. Choi, M. Iwanaga, H. T. Miyazaki, Y. Sugimoto, A. Ohtake and K. Sakoda, Chem. Commun., 2015, 51, 11470–11473 RSC.
- R. Hu, N. L. Leung and B. Z. Tang, Chem. Soc. Rev., 2014, 43, 4494–4562 RSC.
- Y. Huang, F. Hu, R. Zhao, G. Zhang, H. Yang and D. Zhang, Chem. - Eur. J., 2014, 20, 158–164 CrossRef CAS PubMed.
- F. E. Hernández, S. Yu, M. García and A. D. Campiglia, J. Phys. Chem. B, 2005, 109, 9499–9504 CrossRef PubMed.
- K. Munechika, Y. Chen, J. M. Smith and D. S. Ginger, Chapter4 in Importance of Spectral Overlap: Fluorescence Enhancement by Single Metal Nanoparticles, ed. K. Munechika, et al., 2010, pp. 91–118 Search PubMed.
- Y. Chen, K. Munechika and D. S. Ginger, Nano Lett., 2007, 7, 690–696 CrossRef CAS PubMed.
- M. Bregnhøj, S. Rodal-Cedeira, I. Pastoriza-Santos and P. R. Ogilby, J. Phys. Chem. C, 2018, 122, 15625–15634 CrossRef.
Footnotes |
| † Electronic supplementary information (ESI) available: Details of synthesis procedures and characterization. See DOI: 10.1039/d0na00182a |
| ‡ M. Tavakkoli Yaraki and F. Hu contributed equally to this work. |
| This journal is © The Royal Society of Chemistry 2020 |

![[small tau, Greek, macron]](https://www.rsc.org/images/entities/i_char_e0d4.gif)
