
 Open Access Article
 This Open Access Article is licensed under a Creative Commons Attribution-Non Commercial 3.0 Unported Licence
In-depth understanding of a nano-bio interface between lysozyme and Au NP-immobilized N-doped reduced graphene oxide 2-D scaffolds†
Karan
Chaudhary‡
,
Krishan
Kumar‡
,
Pannuru
Venkatesu
 * and
Dhanraj T.
Masram
*
* and
Dhanraj T.
Masram
*
Department of Chemistry, University of Delhi, Delhi, 110 007, India. E-mail: dhanraj_masram27@rediffmail.com; venkatesup@hotmail.com; pvenkatesu@chemistry.du.ac.in; Fax: +91-11-2766 6605; Tel: +91-11-27666646-142
First published on 8th April 2020
Abstract
In the present work, nitrogen-doped reduced graphene oxide (NrGO) was synthesized via a hydrothermal treatment of graphene oxide (GO) in the presence of urea. Gold nanoparticles (Au(0) NPs) were immobilized over the surface of NrGO (Au(0)-NrGO). Characterization of the Au(0)-NrGO nanocomposite via FT-IR spectroscopy, Raman spectroscopy, elemental mapping and XPS revealed the doping of N atoms during the reduction of GO. XRD and XPS studies confirmed the presence of Au(0) NPs and EDS analysis showed a 4.51 wt% loading of Au NPs in the Au(0)-NrGO nanocomposite. The morphology of Au(0)-NrGO was explored by SEM and TEM, which showed the presence of spherical Au metal NPs uniformly immobilized on the surface of NrGO. Further, studies on lysozyme (Lys) in the presence of Au(0)-NrGO by UV-visible, fluorescence, and circular dichroism spectroscopy revealed a conformational change in Lys and electrostatic interaction between Lys and Au(0)-NrGO. The DLS result showed an enhancement in the size of the Au(0)-NrGO and Lys conjugates. The Au(0)-NrGO-induced conformational changes in the structure of Lys resulted in a significant decrease in its activity at a certain concentration of Au(0)-NrGO. Moreover, the results showed that Lys favorably binds with the surface of Au(0)-NrGO, resulting in the formation of 2-D scaffolds possibly due to electrostatic and hydrophobic interactions, H-bonding, and interactions between the AuNPs and sulfur-containing amino acid residues of Lys. SEM exhibited the formation of conjugates in the form of 2-D scaffolds due to the biomolecular interactions between Lys and Au(0)-NrGO. The TEM studies revealed that Lys agglomerated around the Au(0) NPs immobilized on the surface of NrGO, which suggests the formation of a protein corona (PC) around the AuNPs. Furthermore, the favorable Au(0) NP-sulphur (PC) interaction was confirmed by the disappearance of the S–S stretching band in the Raman spectra. Overall, the results obtained provide insight into the nano-bio interface and formation of Au(0) NP-PC, which can be used for bioinspired applications, such as biosensing and imaging and the development of advanced functional Au NPs.
1. Introduction
Nowadays, nanomaterials have attracted significant attention due to their use in biomedical applications. The adsorption of protein on nanoparticles (NPs) prevents protein interaction with the environment, avoids its premature degradation and enhances its bioavailability.1 Accordingly, numerous studies have been reported on the conjugation of enzymes with various NPs.1–10 The change in the structure and function of the adsorbed protein on NPs strongly relies on the shape and size of the NPs.11 Some studies have revealed a disturbance in the structural integrity of protein, resulting in a loss of activity upon interaction with NPs.12–14 Therefore, it is vital to understand protein interactions with NPs at the molecular level.15 In the modern era, the potential of carbon-based nanomaterials has been demonstrated in numerous applications, especially in the biomedical field. Graphene and its derivative graphene oxide (GO) have gained increasing attention due to their remarkable physicochemical properties, and have various applications in the fields of drug delivery, biomedical application, therapy, and sensing.16–21 GO, which is prepared via the oxidation of graphene, is a 2-D planar sheet-like structure of atomic thickness having unique physicochemical properties. GO has an extremely large specific surface area, rich in oxygen-containing functional groups, which are responsible for its interaction with various proteins without further modification.15,22Many studies have addressed the interactions of proteins with GO, and results have shown a problem related to the significant loss of protein structure and/or activity23–28 due to the electrostatic interaction between the protein functional groups and GO or functionalized GO. On the other hand, in comparison to GO, when reduced graphene oxide (rGO) is used to conjugate proteins, a higher protein loading, higher activity and stability is observed.24 This is attributed to the less structural disturbance in the protein structure due to the removal of the surface functional groups in rGO. The higher stability and activity of the protein has been found to be dependent on the extent to which GO has been reduced. Furthermore, this enhanced stability and activity for protein and rGO conjugates has been ascribed to hydrophobic interactions.24,29 Guo and coworkers22 demonstrated enzyme immobilization on the surface of GO without a cross linking agent and surface modifications. Jiang et al.30 reported the immobilization of chloroperoxidase (CPO) on GO nanosheets via site-specific interactions with concanavalin (ConA) and studied the catalytic performance of GO-ConA-CPO. Zhang et al.31 demonstrated the immobilization of cellulose on functional GO grafted with a hydrophobic spacer of P-β-sulfuric acid ester ethyl sulfone aniline (SESA).
Presumably, a great deal of information is available on the interactions of gold NPs with various proteins.32 As mentioned previously, there have been extensive efforts to obtain data regarding the interactions of graphene materials with proteins. Gold and N-doped graphene nanocomposites have been explored in various applications such as sensors and biosensors.33–35 Moreover, nitrogen was doped while reducing GO because NrGO has been found to be a promising platform to achieve excellent metal NP loading on the surface of rGO.36,37 However, with regard to the study of the biomolecular interactions of gold and graphene nanocomposites with proteins is relatively lacking in the literature. Therefore, our focus was to synthesize an Au(0)-NrGO nanocomposite and study its interactions with lysozyme (Lys).
Lys is a single polypeptide chain of 129 amino acids having four disulfide bonds with a molecular mass of 14.6 kDa. Lys is an enzyme that prevents bacterial infection. Lys cleaves the β-(1,4)-glycosidic bond between N-acetylglucosamine (NAG) and N-acetylmuramic acid (NAM), which are bacterial cell wall components.4,5,38 Lys is found in the saliva, mucus, milk, tears, other fluids, and egg white.39 Purified Lys from hen egg white has been extensively used for understanding its protein structure, protein–nanomaterial conjugates, and function. This is due to its high natural abundance, thermal stability, and ability to bind drugs.38,40–42 Lys from hen egg white has great importance in the food industry also. It is used as a food preservative and for extending the shelf life of meat and shrimp.38,40,41
It is well known that rGO can be obtained by reducing GO either chemically or thermally. Herein, we describe a hydrothermal synthetic route for the synthesis of nitrogen-doped reduced graphene oxide (NrGO) using graphene oxide (GO) in the presence of urea. Furthermore, Au NPs were immobilized on the surface of NrGO by the action of trisodium citrate and sodium borohydride to obtain Au(0)-NrGO. Subsequently, Lys protein was selected to study the conformational changes induced in the Lys structure by Au(0)-NrGO and also to study the various types of biomolecular interactions between the protein and nanomaterial. UV-visible spectroscopy, steady-state fluorescence spectroscopy, dynamic light scattering (DLS), circular dichroism (CD) spectroscopy, Raman spectroscopy, transmission electron microscopy (TEM) and scanning electron microscopy (SEM) were employed to study the conformational changes and biomolecular interactions. This study provides insight into the nano-bio interface and formation of a NP-protein corona (PC), which can be used for bioinspired applications, such as biosensing and imaging, and the development of advanced functional Au NPs.
2. Experimental
2.1 Materials
Graphite powder (∼200 mesh, 99.9%) was obtained from Alfa Aesar, India. Lysozyme from chicken egg white (dialyzed, lyophilized, powder, ∼100![[thin space (1/6-em)]](https://www.rsc.org/images/entities/char_2009.gif) 000 U mg−1), Micrococcus lysodeikticus (ATCC No. 4698), and HAuCl4·3H2O were obtained from Sigma-Aldrich. H2SO4, HCl, and tri-sodium citrate were purchased from Thomas Baker (Chemicals) Pvt. Ltd. H2O2 and urea were obtained from Merck, India. All other materials used in this work were of AR grade. Double distilled water was used for washing and preparation of solutions.
000 U mg−1), Micrococcus lysodeikticus (ATCC No. 4698), and HAuCl4·3H2O were obtained from Sigma-Aldrich. H2SO4, HCl, and tri-sodium citrate were purchased from Thomas Baker (Chemicals) Pvt. Ltd. H2O2 and urea were obtained from Merck, India. All other materials used in this work were of AR grade. Double distilled water was used for washing and preparation of solutions.
2.2 Instrumentation and measurement
Fourier-transform infrared (FT-IR) spectroscopy (Thermo Fisher, NICOLET iS50 FT-IR spectrometer) was performed to obtain information regarding structure and functional groups. Structural characterization was performed using X-ray diffraction (Bruker, D8 DISCOVER X-ray diffractometer) and Raman spectroscopy (Renishaw inVia™ Reflex Micro-Raman spectrometer) using a wavelength of 514 nm. The morphology of the nanomaterials was determined via scanning electron microscopy (SEM) (JEOL Japan, JSM 6610LV), transmission electron microscopy (TEM) (Thermo Scientific, Talos) and field-emission scanning electron microscopy (FESEM) (Zeiss GeminiSEM 500). X-Ray photoelectron spectroscopy (XPS) (Physical Electronics, PHI 5000 VersaProbe) was employed to identify the electronic state of the elements present in the nanomaterial.Ultraviolet-visible (UV-vis) absorption spectra were recorded using a double beam UV-visible spectrophotometer (UV-1800, Shimadzu Co., Japan) at room temperature. An aliquot of sample solution was transferred uniformly to a quartz cell with a path length of 1 cm. The spectrophotometer had matching quartz cells, with a spectral bandwidth of 1 nm and wavelength accuracy of ±0.3 nm with automatic wavelength correction. Fluorescence measurements were carried out using a Cary Eclipse fluorescence spectrophotometer (Varian Optical Spectroscopy Instruments, Mulgrave, Victoria, Australia) with an intense Xenon flash lamp as the light source. Emission spectra were recorded with a PMT voltage of 720 V and the scan speed was maintained at 1200 nm min−1. The quartz cuvette (QC) containing the sample was placed in a multi-cell holder, which was electro-thermally controlled at a precise temperature by a Peltier device. The temperature control of the Peltier thermostatted cell holders was extremely stable over time, with a typical precision of ±0.05 K. Prior to the measurements, each sample solution was left undisturbed for 30 min at different temperatures to attain thermodynamic equilibrium. Hydrodynamic diameter (dH) was measured by dynamic light scattering (DLS) using a Zetasizer Nano ZS90 (Malvern Instruments Ltd., UK), equipped with an He–Ne laser (4 mW, 632.8 nm). CD spectra were recorded using a Jasco-185 spectrophotometer (USA) equipped with a Peltier system with an accuracy of ±0.1 °C in the range of 200–250 nm and 250–350 nm, respectively. All spectra were obtained after subtracting the respective blank solution and three scans averaged with a response time of 1 s and bandwidth of 1 nm.
2.3 Synthesis of GO and NrGO
GO was synthesized from pure graphite powder by using a modified Hummers' method.43,44 Firstly, a mixture having a volume ratio of 9:1, 180 mL conc. sulfuric acid and 20 mL phosphoric acid was added to a round bottom flask. Then, 1.5 g of graphite powder was added to the mixture under stirring. Subsequently, 9.0 g of potassium permanganate was added very slowly to the mixture. Then this mixture was stirred at 55 °C for 12 h. Further, the so-obtained brown paste was transferred to a beaker containing ice and the solution was treated with 4 mL of H2O2 (30%), which terminated the oxidation reaction, and its color changed to yellow color. The above mixture was centrifuged and the obtained solid was washed thrice by rinsing and centrifugation with deionized water and then 30% HCl three times. Then, the solid was purified by washing and centrifugation with ethanol five times. Then GO powder was obtained by drying the solid at room temperature under vacuum.
NrGO was synthesized from GO powder by using the hydrothermal method. Initially, in a 250 mL beaker, 100 mg GO powder was added to 70 mL of 1 M KOH solution. Then 1.0 g of urea was added to the mixture under stirring. After 30 min of vigorous stirring, the mixture was sealed in a 100 mL Teflon-lined stainless steel autoclave, which was placed in an oven for 24 h at 180 °C. Upon cooling, the solid was filtered using a G-4 sintered glass crucible and thoroughly washed with water. NrGO powder was obtained by drying the solid at 80 °C for 12 h.
2.4 Synthesis of Au(0)-NrGO
In a 250 mL round bottom flask, 100 mg NrGO powder was dispersed in 90 mL deionized water by sonication for 30 min. To this dispersion, a solution of 10 mg of HAuCl4·3H2O dissolved in 10 mL of deionized water was added while stirring. Then 100 mg trisodium citrate dissolved in 5 mL of deionized water was added to the mixture under stirring. Subsequently, 5 mL solution of 50 mg NaBH4 in deionized water was added to the mixture very slowly. Then this mixture was stirred for 2 h. Afterwards, the mixture was filtered using a G-4 sintered glass crucible and thoroughly washed with. The solid was dried under vacuum and labeled as Au(0)-NrGO. The detailed procedure for the synthesis of Au(0)-NrGO is schematically depicted in Scheme 1. | ||
| Scheme 1 Schematic showing the synthesis of Au(0)-NrGO. | ||
2.5 Sample preparation
A stock solution of Au(0)-NrGO was prepared by dissolving 1000 μg of material in 1000 μL of 10 mM phosphate buffer with pH 7. The protein concentration was fixed at 0.5 mg mL−1 for all experiments except the activity measurements. Enzymatic activity was studied using Micrococcus lysodeikticus (M. lysodeikticus) bacteria as the substrate. To determine the enzymatic activity, 100 μL of Lys (2 mg mL−1) was added to 2500 μL of M. lysodeikticus (0.3 mg mL−1) and the absorbance was measured at 450 nm for 300 s at room temperature (25 °C). The protein concentration used in the activity measurements was 2 mg mL−1 in 0.3 mg mL−1 solution of M. lysodeikticus cell suspension. Phosphate buffer with pH 7 was prepared using distilled deionized water with a resistivity of 18.3 MΩ cm.3. Results and discussion
3.1 Characterization of Au(0)-NrGO material
FT-IR spectroscopy was used to characterize the as-synthesized materials. The FT-IR spectra for the GO, NrGO, and Au(0)-NrGO samples are shown in Fig. S1.† The FT-IR spectrum shown in Fig. S1(i)† clearly reveals that GO consists of characteristic peaks at ∼3300, 1733, 1621, 1221 and 1056 cm−1, which are associated with the stretching vibrations of the O–H groups, C![[double bond, length as m-dash]](https://www.rsc.org/images/entities/char_e001.gif) O, CC, C–O, and C–O–C groups, respectively.45 Fig. S1(ii)† shows the FT-IR spectrum of NrGO, which clearly shows that the peak intensities corresponding to the oxygen-containing functional groups decreased and some disappeared compared to that in GO. This indicates the successful reduction of GO, but the presence of some peaks shows that GO was not completely reduced. In addition, the new peaks at 1530 and 1370 cm−1 correspond to the stretching vibrations of the CN and C–N bonds, respectively, which show that N atoms were doped during the reduction of GO.46,47 Furthermore, the FT-IR spectrum of Au(0)-NrGO shows (Fig. S1(iii)†) peaks for CN and C–N bonds, but due to the action of NaBH4, the peaks corresponding to CO and C–O disappeared or became weaker.
O, CC, C–O, and C–O–C groups, respectively.45 Fig. S1(ii)† shows the FT-IR spectrum of NrGO, which clearly shows that the peak intensities corresponding to the oxygen-containing functional groups decreased and some disappeared compared to that in GO. This indicates the successful reduction of GO, but the presence of some peaks shows that GO was not completely reduced. In addition, the new peaks at 1530 and 1370 cm−1 correspond to the stretching vibrations of the CN and C–N bonds, respectively, which show that N atoms were doped during the reduction of GO.46,47 Furthermore, the FT-IR spectrum of Au(0)-NrGO shows (Fig. S1(iii)†) peaks for CN and C–N bonds, but due to the action of NaBH4, the peaks corresponding to CO and C–O disappeared or became weaker.
To study the structure of the GO, NrGO, and Au(0)-NrGO samples, XRD analysis was performed, and the XRD patterns are illustrated in Fig. 1a. The XRD pattern of GO (Fig. 1a(i)) shows two characteristics peaks at around 2θ = 9.7° and 42.2° due to the {001}and {100} crystal planes of GO, respectively.48,49Fig. 1a(ii) shows the XRD pattern of NrGO, where the peaks at around 2θ value of ∼25.5° and ∼43° may be attributed to the {002} and {100}graphitic planes of NrGO, respectively. Moreover, the peak at 2θ = 9.7° completely disappeared, indicating the reduction of GO to NrGO.50,51 Furthermore, the XRD pattern of Au(0)-NrGO shown in Fig. 1a(iii) has five peaks at 2θ = 25.5°, which are associated with the {002} graphitic plane of NrGO, whereas the peaks at 2θ = 38.1°, 44.2°, 64.5° and 77.5° can be ascribed to the {111}, {200}, {220} and {311} planes of Au NPs, respectively, revealing the presence of metallic gold in Au(0)-NrGO.48
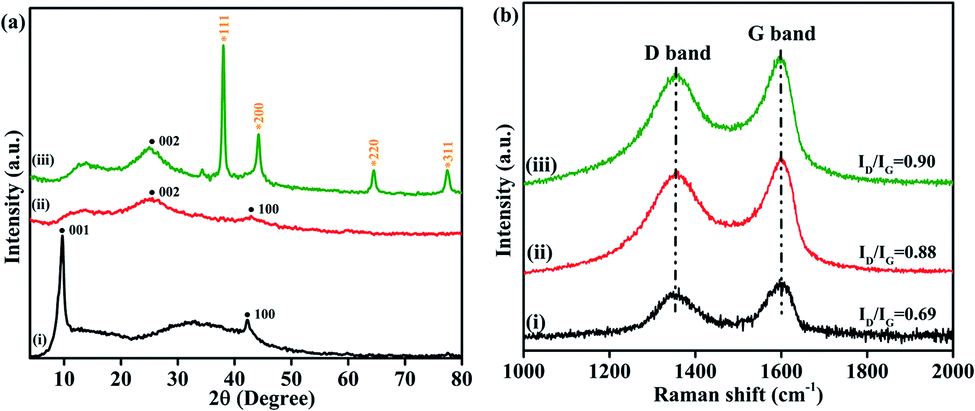 | ||
| Fig. 1 XRD patterns (a) and Raman spectra (b) of (i) GO, (ii) NrGO and (iii) Au(0)-NrGO. | ||
Furthermore, the prepared GO, NrGO, and Au(0)-NrGO were studied by Raman spectroscopy and the obtained spectra are shown in Fig. 1b. The characteristic features of carbon materials in Raman spectra are the D band (due to disordered graphene structure) at ∼1350 cm−1 and G band (1st order scattering of the E2g phonons of sp2 carbon) at ∼1597 cm−1.48,52 The observed ID/IG ratios are 0.69 and 0.88 for GO and NrGO, respectively. This increment in the ID/IG ratio indicates increased defects in the structure by N-doping and the removal of O-containing functional groups, which resulted in the reduction of GO to NrGO by the hydrothermal method.51 Moreover, the increase in the ID/IG ratio to 0.90 for Au(0)NrGO compared to 0.88 of NrGO is associated with further disorder in the graphitic structure, which is associated with the immobilization of metallic Au NPs on the surface of NrGO due to the use of NaBH4.48
Moreover, XPS was performed to investigate the chemical state of Au(0)-NrGO, and the spectra are displayed in Fig. 2. Fig. 2a shows the XPS survey spectrum of Au(0)-NrGO, which comprises four main peaks at around 84.2 eV, 284.8 eV, 400.6 eV and 533.0 eV, corresponding to Au4f, C1s, N1s, and O1s, respectively, and indicating that Au, C, N, and O are the main elements present in Au(0)-NrGO. The deconvoluted C1s spectrum (Fig. 2b) contains the most prominent peak at 284.79 eV for graphite-like carbon (C–C) and other peaks centered at about 285.75 eV, 286.87 eV, 288.19 eV and 289.44 eV, which are associated with the C–O/C–N, C–O–C, CO, and O–CO functional groups, respectively.53,54 Accordingly, the deconvoluted O1s spectrum (Fig. 2d) has three peaks centered at about 531.40 eV and 533.04 eV, which are associated with CO/O–CO and C–O, respectively.55 In addition, Fig. 2c reveals the deconvoluted N1s spectrum, showing four components assigned to pyridinic-N (398.69 eV), pyrrolic-N (399.75 eV), quaternary-N (400.60 eV) and pyridine N-oxide (402.25 eV), respectively.56,57 Moreover, the XPS spectrum shown in Fig. 2e reveals the presence of metallic gold in Au(0)-NrGO, as confirmed by the doublet peak obtained at 84.24 eV and 87.92 eV, which corresponds to Au4f7/2 and Au4f5/2 of Au(0), respectively.58
 | ||
| Fig. 2 XPS (a) survey spectrum, and core level spectra for (b) C1s, (c) N1s, (d) O1s and (e) Au4f of Au(0)-NrGO. | ||
The surface morphology of GO was characterized via SEM and the images of GO are shown in Fig. 3(a and b), which reveal the characteristic morphology of a wrinkled sheet-like structure. Moreover, FESEM was used to characterize NrGO obtained after treating GO with KOH and urea via the hydrothermal method. The images of the NrGO surface morphology are presented in Fig. 3(c and d). The micrographs clearly show that NrGO has a rough, more wrinkled and exfoliated flake-like structure. Furthermore, the FESEM images for Au(0)-NrGO are shown in Fig. 3(e and f) at different magnifications, which clearly show that the Au metal NPs were immobilized on the surface of NrGO. As shown in Fig. 3f, the higher magnification image clearly reveals that the Au NPs are spherical in shape and are uniformly distributed throughout the surface of NrGO. The uniform distribution of Au NPs loaded on the surface of NrGO can be attributed to the N atoms that were doped in the structure of reduced graphene oxide.
 | ||
| Fig. 3 (a and b) SEM images of GO. FESEM images of (c and d) NrGO, and (e and f) Au(0)-NrGO. | ||
The FESEM image of Au(0)-NrGO is shown in Fig. 4a. To obtain the elemental composition of the Au(0)-NrGO composite, energy-dispersive spectroscopy (EDS) elemental mapping was carried out (Fig. 4b–e) for the same area and the corresponding EDS pattern and data are shown in Fig. S2.† The images with different colors in Fig. 4b–e indicate the presence of C, N, O, and Au elements, respectively. The result reveals the uniform distribution of doped N atoms in the rGO structure and the Au atoms are also uniformly distributed on the surface of Au(0)-NrGO. Fig. 4f shows the elemental composition of Au(0)-NrGO from EDS, which confirms the presence of Au (4.51 wt%) in Au(0)-NrGO.
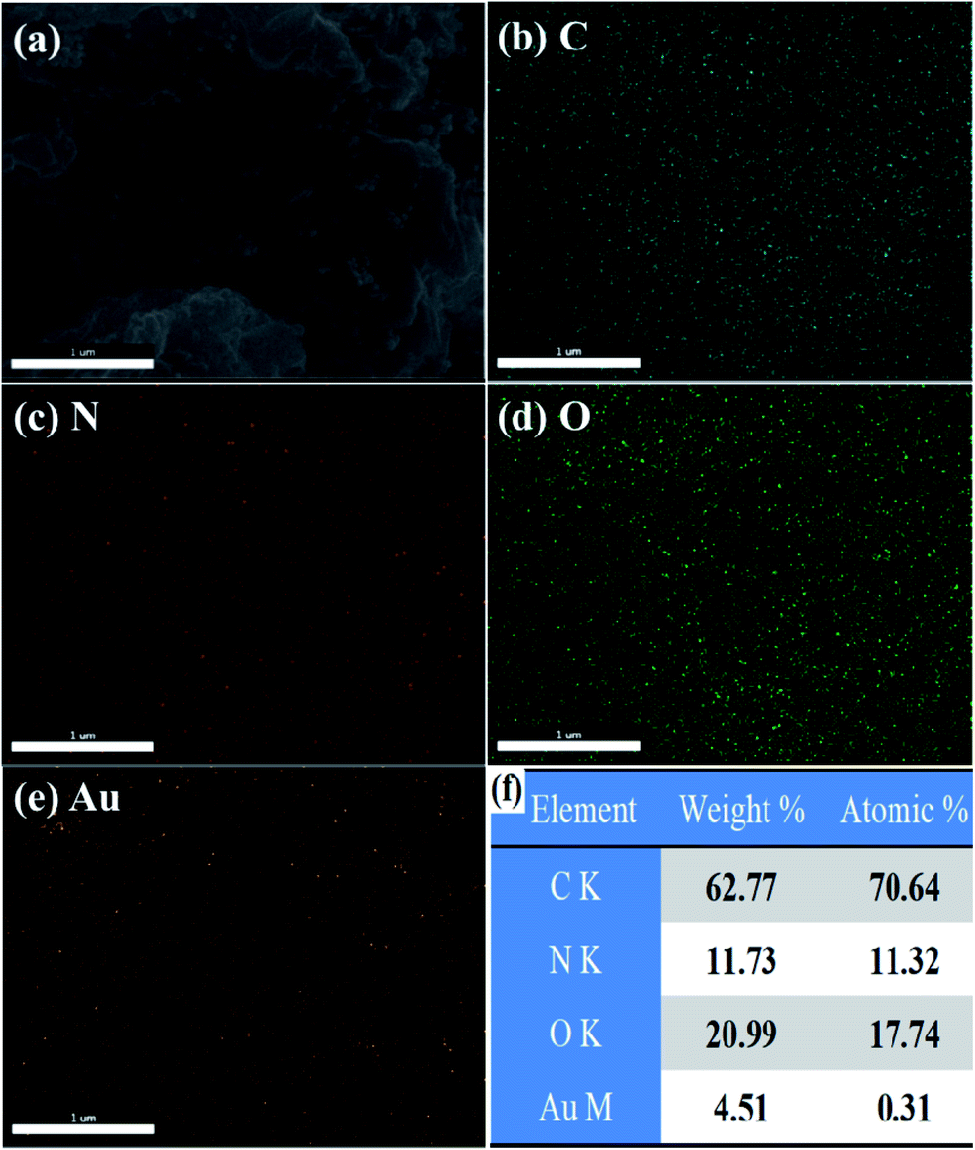 | ||
| Fig. 4 FESEM image of (a) Au(0)-NrGO. FESEM combined with EDS elemental mapping of (b) C, (c) N, (d) O, and (e) Au. (f) Elemental composition of Au(0)-NrGO by EDS. | ||
The presence of Au NPs (4.51 wt%) and their uniform distribution on the surface of NrGO in Au(0)-NrGO can be attributed to the uniformly doped N atoms in the structure of rGO. Earlier studies have reported that the nitrogen heteroatoms in the graphene lattice act as sites for anchoring Au seeds due to the strong N–Au interactions, and these nitrogen heteroatoms also act as stabilizers for Au NPs.59,60
Additionally, the morphology and structure of GO, NrGO, and Au(0)-NrGO were further studied by TEM and the micrographs are shown in Fig. 5. It can be clearly seen in Fig. 5a and b that GO has the characteristic morphology of a wrinkled sheet-like structure. However, in the TEM images for NrGO (Fig. 5c and d), an exfoliated flake-like structure can be observed in comparison to that of the GO sheets. Fig. 5e and f show the TEM images of Au(0)-NrGO at different magnifications. It can be seen that the Au metal NPs are uniformly immobilized over the surface of NrGO. In Fig. 5f, the higher magnification image of Au(0)-NrGO clearly reveals that the uniformly distributed Au NPs are spherical in shape. Thus, these results explicitly corroborate the results obtained from the SEM images.
 | ||
| Fig. 5 TEM images of (a and b) GO, (c and d) NrGO and (e and f) Au(0)-NrGO. | ||
Overall, the characterization of the Au(0)-NrGO nanocomposite by FT-IR and Raman spectroscopy, elemental mapping and XPS revealed the successful doping of N atoms during the reduction of GO. EDS analysis showed 4.51 wt% loading of Au NPs. Furthermore, the XRD and XPS studies confirmed the presence of Au(0) NPs in the Au(0)-NrGO nanocomposite. The morphology of Au(0)-NrGO was studied by SEM and TEM, which showed presence of spherical Au metal NPs uniformly immobilized on the surface of NrGO.
3.2 Probing the biomolecular interactions of Lys and the Au(0)-NrGO biocomposite
To observe the conformational changes in the structure of Lys and study various types of biomolecular interactions in the presence of Au(0)-NrGO, we exploited UV-visible spectroscopy to study Lys in phosphate buffer of pH 7 with various concentrations of Au(0)-NrGO. Fig. 6a shows the clear solution of pure Lys in buffer. | ||
| Fig. 6 Photograph of the samples of Lys in phosphate buffer of pH 7 with different concentrations of Au(0)-NrGO of (a) 0 (b) 50, (c) 200, (d) 400, (e) 600, (f) 800 μg mL−1 and (g) pure Au(0)-NrGO (1 mg mL−1). | ||
The addition of a sonicated solution of Au(0)-NrGO to the protein sample resulted in the appearance of a black turbid solution, as presented in Fig. 6b. An increase in the concentration of Au(0)-NrGO in the Lys buffer solution resulted in an increase in black mass in the mixture and the mixture looked similar to the pure Au(0)-NrGO solution, as displayed in Fig. 6(f and g).
Lys contains aromatic amino acid residues, which shows a peak corresponding to the n–Π* transition at ∼280 nm when irradiated with UV-visible light. As presented in Fig. 7a, the addition of Au(0)-NrGO to the protein led to an increase in the intensity of the characteristic absorbance band (Amax) at 280 nm, indicating a conformational change in Lys, which aides the greater exposure of aromatic amino acid towards the solvent medium.61 The increase in absorbance (A280) with an increase in the Au(0)-NrGO concentration reveals that at a lower concentration of material, the aromatic residues are less exposed, and thus the protein is presumed to be in a more compact conformation. Lys is a globular protein, which is a folded conformation of 129 amino acids with two domains. In the native state of this protein, Trp62 and Trp108 are partially exposed to the solvent.62 In contrast, in the presence of Au(0)-NrGO, the increase in absorbance (A280) signifies that the protein interacts with the material surface through buried aromatic acid residues or the hydrophobic groups buried in the pocket of the protein. Moreover, the addition of Au(0)-NrGO did not result in any appreciable shift in the wavelength of the native protein, which suggests there is no covalent interaction between the aromatic residues and surface of Au(0)-NrGO. However, the adsorption of the protein on the nanomaterial surface was strongly favored through hydrophobic interactions.
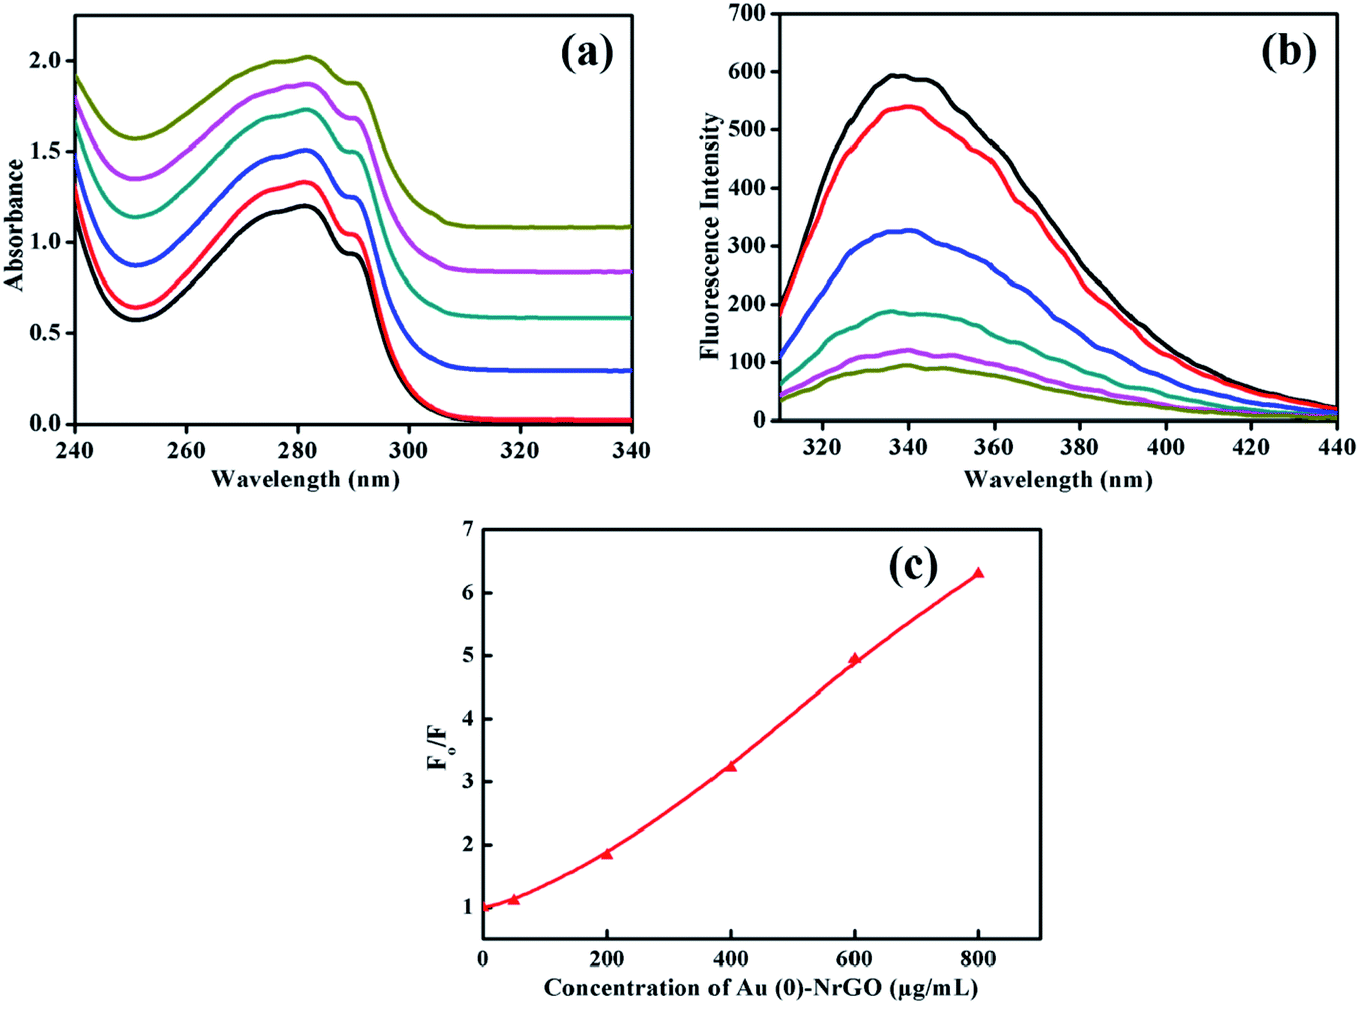 | ||
| Fig. 7 (a) UV-visible spectroscopy and (b) steady-state fluorescence spectroscopy of Lys in phosphate buffer of pH 7 with various concentrations of Au(0)-NrGO, 0 (black line), 50 (red line), 200 (blue line), 400 (cyan line), 600 (pink line) and 800 μg mL−1 (dark yellow line). (c) Stern–Volmer plot for fluorescence quenching in the presence of varying concentrations of Au(0)-NrGO. | ||
Fig. 7b portrays the emission spectra of Lys in the presence of an increasing concentration of Au(0)-NrGO to detect the microenvironment changes taking place in the tryptophan (Trp) residues. In buffer (pH 7.0), the wavelength maximum (λmax) for the native protein was observed at 338 nm, which is consistent with the literature.61,62 The intrinsic fluorescence of the native Lys protein was dominated by Trp residues, in which Trp62 and Trp108 largely contribute towards its fluorescence property since these residues are exposed to the aqueous environment and also important for substrate binding since they are located near the active site.63 Upon the addition of an increasing concentration of Au(0)-NrGO, a constant decrease in the fluorescence intensity of the emission spectrum was observed, which may be due to the various types of interactions such as energy transfer, ground-state complex formation and electrostatic interaction between the positively charged Lys surface61 and negative charge-bearing Au(0)-NrGO surface. The quenching efficiency of Au(0)-NrGO depends on its electronic physical property and the physical accessibility of this quencher towards the protein. Bisht et al.63 also observed a decrease in the fluorescence intensity of Trp for Lys in the presence of an ionic liquid and studied the quenching effect for understanding the packing of Trp in the protein in the presence of co-solvents. The quenching of fluorescence does not signify the unfolding of protein since it can also be due to different extents of interactions between the material surface and protein.
For a better understanding of the extent of quenching, fluorescence intensity (Fo/F) vs. [Au(0)-NrGO] was plotted, and as shown in Fig. 7c, a deviation from the Stern–Volmer relation was observed. Fig. 7c reveals the upward curvature of the fluorescence intensity, signifying the contribution of both static and dynamic factors. Bera et al.15 also observed similar results for the fluorescence quenching of Lys in the presence of graphene oxide (GO) and deviation from the Stern–Volmer relation. It is also interesting to note that upon increasing the Au(0)-NrGO concentration from 50 to 200 μg mL−1 and 200 to 400 μg mL−1, a two-fold decrease in quenching intensity was observed, while there was a much smaller decrease after this concentration. The fluorescence quenching can be attributed to the H-bonding between the O and N groups present in the Au(0)-NrGO sheet with the protein and the interactions between the Au NPs and sulfur-containing amino acid residues of Lys, which alter the microenvironment around the Trp residue of the protein.
Subsequently, DLS was performed to determine the variation in the hydrodynamic size (dH) of the Lys protein in the presence of Au(0)-NrGO, and the data is presented in Fig. 8a. The dH for the Au(0)-NrGO sheets was found to be 800 nm at 25.0 °C. The addition of Lys to the Au(0)-NrGO solution led to a rapid increase in hydrodynamic size. As evident from the literature, the dH value for pure Lys in buffer at 25.0 °C is ∼3–4 nm;61,62 however, the addition of the protein to the Au(0)-NrGO solution led to an increase in the size of the sheets from ∼800 nm to ∼1900 nm. This sudden increase in the size of the Au(0)-NrGO and Lys conjugate can be explained by the 2-D binding of a single Lys molecule between two sheets of Au(0)-NrGO.
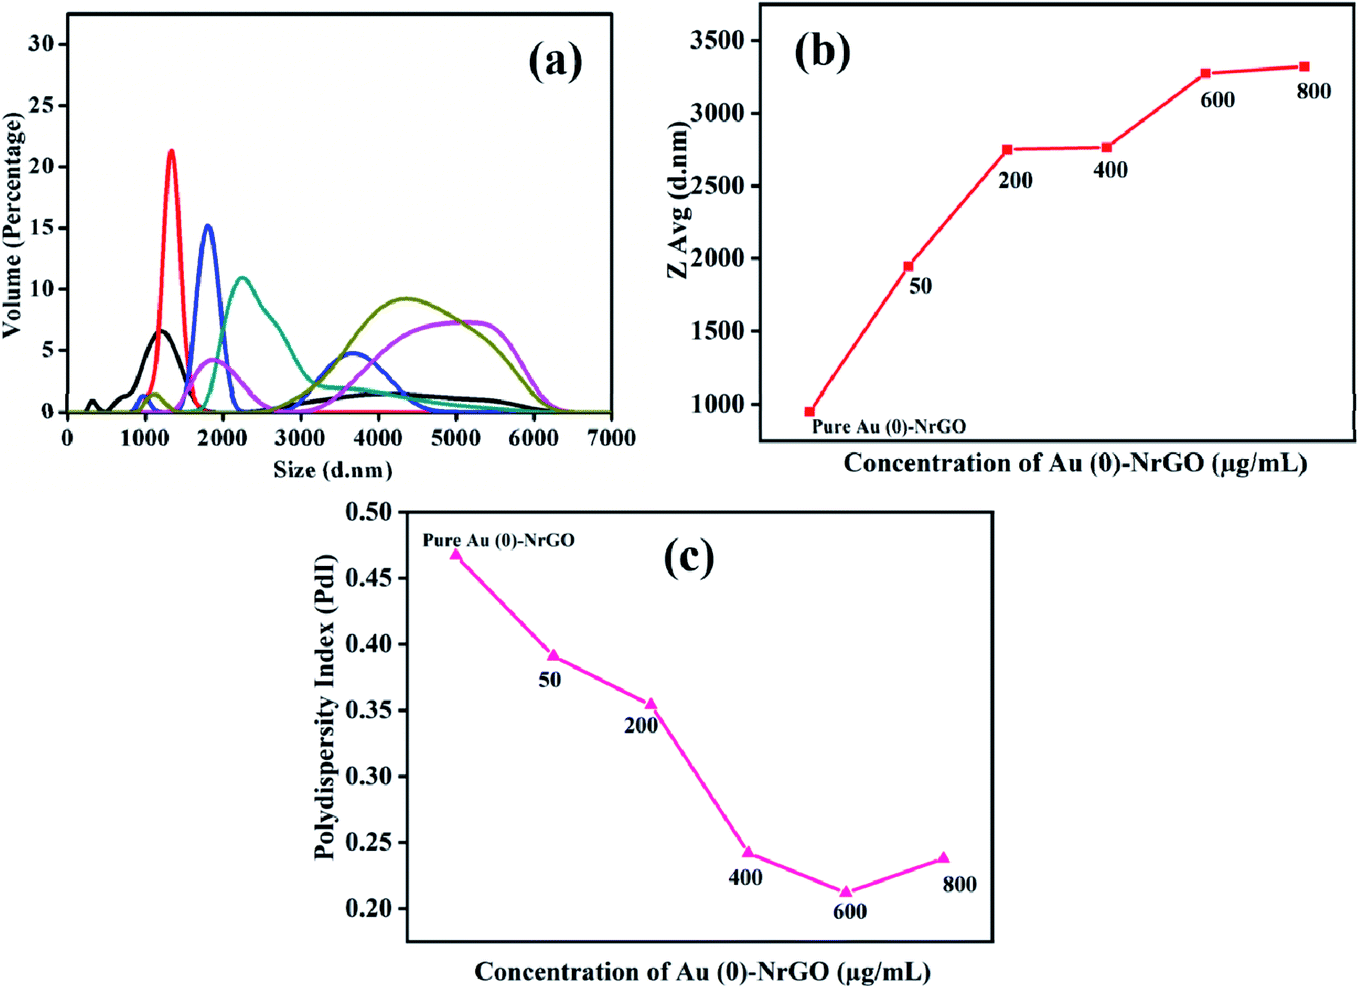 | ||
| Fig. 8 (a) Hydrodynamic diameter (dH) of different concentrations of Au(0)-NrGO with and without Lys at 25 °C. Pure Au(0)-NrGO (black line); 50 (red line), 200 (blue line), 400 (cyan line), 600 (pink line) and 800 μg mL−1 (dark yellow line). (b) Variation in the Z Avg size (d. nm), and (c) variation in the polydispersity index (PdI) at different concentrations of Au(0)-NrGO with and without Lys. | ||
This can also be justified by the fact that on increasing the concentration of Au(0)-NrGO, we observed a sudden increase in dH at a lower concentration of material, but after a particular concentration (i.e. 200 μg mL−1), the increase in dH much lower (Fig. 8b). At a higher Au(0)-NrGO concentration there are not enough protein molecules available for adsorption with the Au(0)-NrGO sheets. Further, the polydispersity index (PDI) shown in Fig. 8c for the pure Au(0)-NrGO solution was ∼0.45, which shows a polydisperse medium. In the presence of the protein, the PDI decreased, which signifies that the solution was becoming increasingly monodisperse. The PDI results are consistent with the dH values since in presence of protein the formation of a 2-D scaffold network occurred because of the Lys–Au(0)-NrGO interaction; therefore, the solution contained larger size monodisperse particles/composites. Consequently, together with the results of UV-visible and steady-state fluorescence spectroscopy, Lys interacted with the material; however, the exact mode of interaction is unclear.
To ascertain the changes taking place in the secondary and tertiary structure of Lys, far and near UV-CD spectroscopy were performed in the presence of Au(0)-NrGO. Fig. 9a represents the near UV-CD spectra, where the interaction between Lys–Au(0)-NrGO is reflected in the structural changes of the native Lys. For the pure protein, near the UV-CD spectrum shows a positive peak in range of 280–300 nm, which is consistent with the literature, originating from the tyrosyl and tryptophan (Trp62 and Trp108, respectively) residues.61–63 The disruption of the protein conformation in the region of the residues (Tyr and Trp) may result in changes in the bands. The addition of Au(0)-NrGO changed the shape of these bands, which can be ascribed to the protein-material interaction or solvent perturbation effect.63 In the presence of 50 and 200 μg mL−1 of Au(0)-NrGO, a red shift in the peak was observed, and the line shape of the spectrum was slightly altered, which reveals a change in the tertiary structure of Lys in the presence of Au(0)-NrGO and the residual Lys present in medium is less organized compared to the native Lys structure. Further, upon increasing the concentration of Au(0)-NrGO (i.e. 400, 600 and 800 μg mL−1), the characteristics of the near UV-CD band for the native Lys were completely destroyed, which can be due to complete binding of Lys with surface of Au(0)-NrGO and non-availability of organized Lys in solution. These results are in excellent agreement with the spectroscopic results from other techniques, where we observed much less quenching in steady-state fluorescence, loss in enzymatic activity (Fig. 9c) and slight change in hydrodynamic size from dynamic light scattering after the addition of 200 μg mL−1 of Au(0)-NrGO.
 | ||
| Fig. 9 (a) Near UV-CD and (b) far UV-CD spectra, (c) percentage relative activity, and (d) change in the % secondary structure of Lys in phosphate buffer of pH 7 with various concentrations of Au(0)-NrGO. 0 (black line), 50 (red line), 200 (blue line), 400 (cyan line), 600 (pink line) and 800 μg mL−1 (dark yellow line). | ||
Fig. 9b presents the secondary structure changes in the Lys protein in the presence of Au(0)-NrGO. The far UV-CD spectra of proteins are dominated by Π–Π* and n–Π* transitions due to the amide group present in the protein backbone. Native Lys showed negative ellipticity with an intense peak (208 nm) and shallow peak (222 nm), which are the characteristic peaks of the α + β protein.63,64 These peaks are influenced by the geometries of the polypeptide backbone, which reflect changes in the secondary structure of the protein. In the presence of Au(0)-NrGO, more negative ellipticity was observed with a slight shift in wavelength for the peak at 208 nm. The more negative ellipticity in the presence of Au(0)-NrGO reflects an increase in the α helix content of the protein, which can be justified by the near UV-CD results, where the tertiary structure of the protein was perturbed in presence of Au(0)-NrGO. There is the possibility of intermolecular interaction between the disrupted tertiary structure or increased Π–Π* transitions in the Lys-Au(0)-NrGO conjugate due to the presence of residual unsaturated bonds in the sheets. Overall, it can be concluded that the secondary structure of Lys was maintained in the presence of Au(0)-NrGO, and even at the higher concentrations of Au(0)-NrGO, the native protein structure was not modified or denatured. However, Au(0)-NrGO disrupted the tertiary structure of the protein, which represents a loss in H-bonding and van der Waal interactions among protein residues.
Fig. 9c depicts the biological activity of Lys in different concentrations of Au(0)-NrGO material using an M. lysodeikticus bacterium cell suspension. The slope for the measured A450 of the Lys cell suspension for 300 s was calculated using the Origin Pro 2019b software. Enzymatic activity was calculated by subtracting the slope obtained for the solution from that of the blank using the procedure reported in the literature.62,63 The activity measured for pure Lys was taken as the control and the percentage relative activity in the presence of Au(0)-NrGO was calculated taking the activity for pure Lys as 100%. The lytic activity of free Lys was compared with that of Lys bound on the surface of Au(0)-NrGO. The enzyme Lys contains two domains, the α-domain and β-domain,61 and its active site exists inside a deep fissure, where a proton is donated by the side chain of Glu35 present in the α-helical domain to the glycosidic oxygen of the anomeric carbon in the sugar of the bacterium cell wall.65,66 During hydrolysis, Asp52 plays a crucial role by stabilizing the intermediate formed in the process.65–67 The loading of Lys on Au(0)-NrGO led to a decline in its activity at all concentrations of Au(0)-NrGO. However, it is interesting to note that after the addition of 200 μg mL−1 of Au(0)-NrGO, the protein completely lost its enzymatic activity. These activity results are consistent with the DLS and steady-state fluorescence data, where we observed much less fluorescence quenching and hydrodynamic size changes beyond a particular concentration of Au(0)-NrGO (i.e. 200 μg mL−1), which indirectly indicates the absence of free Lys in the medium. The loss in activity suggests the interaction of Au(0)-NrGO with the catalytic sites of Lys, which results in a disruption in its active site and unfavorable binding with the sugars of the M. lysodeikticus bacterium cells.65,67 Bera et al.15 also observed a deterioration in enzymatic activity by 15.2% when Lys was bound with graphene oxide (GO) sheets. The variation in the secondary structure content of Lys in the presence of Au(0)-NrGO was further analyzed using DICHROWEB,68 as presented in Fig. 9d. The secondary structure of Lys was maintained upon the addition of Au(0)-NrGO sheets, which is reflected in the α-helical content in Fig. 9d. This observation is in accordance with the far CD results, which also showed that there was no disturbance in the secondary structure of the protein.
To obtain a more detailed depiction of the nano-bio interface between the Lys–Au(0) NrGO bioconjugates, we performed Raman spectroscopy for the studied systems to explore the bio-conjugates of Lys–Au(0)-NrGO. The Raman spectrum of Lys, as shown in Fig. 10g, contains peaks at 507, 758.6, 1004.1, 1010.5, 1258, 1341, 1552.8, 1617.1, 1658.2, and 3059.2 cm−1, which correspond to the stretching of Cys (S–S stretching), Trp (W18 mode), Phe (F1 mode), Trp (W16 mode), amide III, Trp (Fermi doublet), Trp, Tyr, amide I and C–H functional groups, respectively. The most prominent peak ca. 2933 cm−1 is attributed to the symmetric and asymmetric stretching of the CH2 and CH3 groups.69 The characteristic peaks for the pure carbon material appear at ∼1355 (D band) and ∼1602 cm−1 (Fig. 10f). The Raman spectra for various concentrations of Au(0)-NrGO including 50, 200, 400, 600 and 800 μg mL−1 in the presence of Lys protein are shown in Fig. 10a-e, respectively. All the spectra contain the peak ca. 2933 cm−1, which is initially absent in the pure Au(0)-NrGO material and confirms the presence of Lys protein and the formation of 2-D scaffolds network because of the Lys–Au(0)-NrGO bio-conjugate interactions. It also signifies that in the Lys protein structure, the CH2 and CH3 functional groups of the protein are unaffected by the presence of Au(0)-NrGO since no shift in the corresponding peaks for these functional groups was observed; however, the intensity of the sharp peaks decreased, which represents environmental changes around these functional groups.
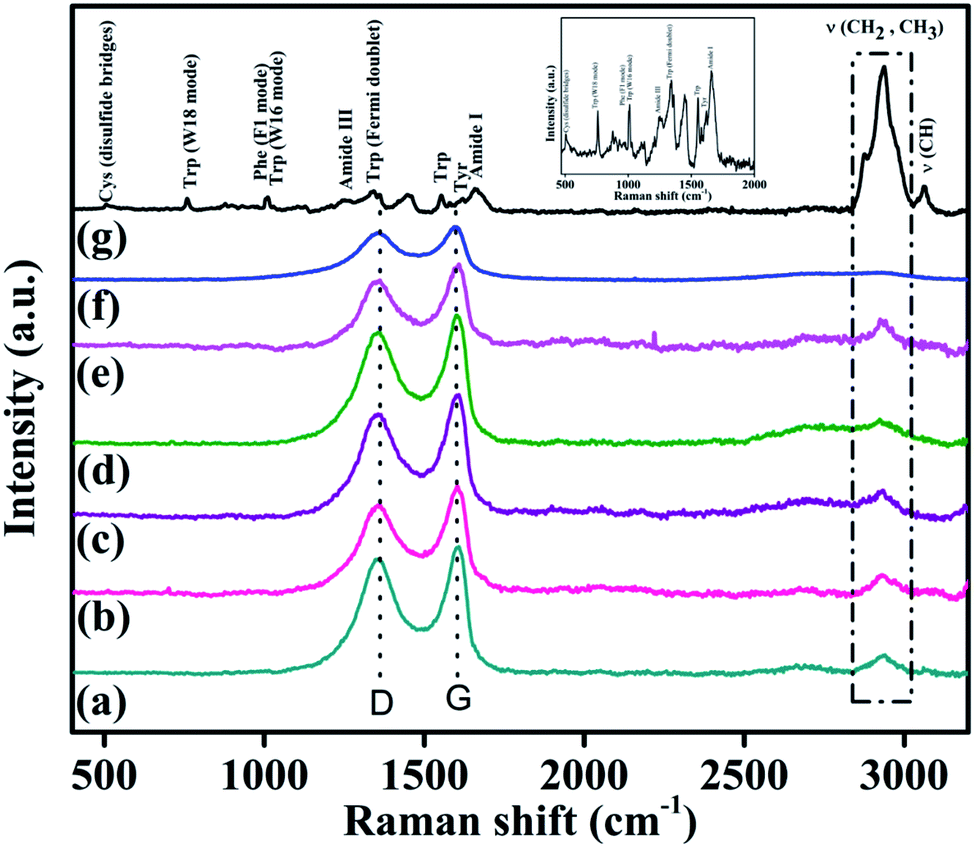 | ||
| Fig. 10 Raman spectra for the conjugates of Lys with different Au(0)-NrGO concentrations: (a) 50, (b) 200, (c) 400, (d) 600, and (e) 800 μg mL−1. Raman spectra for (f) pure Au(0)-NrGO and (g) pure Lys. Inset Raman spectrum of Lys in range of 500–2000 cm−1. | ||
The addition of Au(0)-NrGO caused the characteristic protein peaks at 507, 758.6, 1004.1, and 1010.5 cm−1 to disappear, which signifies microenvironment changes (due to structural rearrangement) around the Cys, Trp and Phe amino acid residues. The other peaks of Lys were masked, which can be attributed to the overlap with the D and G band of Au(0)-NrGO in the 2D scaffolds network or due to the conformational changes caused by several probable interactions (such as H-bonding, intermolecular interaction, van der Waals interactions, and change in hydrophobicity) of Lys in the presence of Au(0)-NrGO. Gold nanoparticles are immobilized on the Au(0)-NrGO sheets; therefore, favorable interactions (soft–soft interaction) between the NPs and S moiety present in the Cys residue are possible. This fact was also confirmed by the disappearance of the S–S stretching bond (Cys residue) at ∼507 cm−1 in the presence of Au(0)-NrGO. The characteristic D and G bands of the carbon material in Lys-Au(0)-NrGO (Fig. 10a–e) appear at ∼1355 cm−1 and ∼1602 cm−1 in its Raman spectrum. In comparison to the Raman spectrum of pure Au(0)-NrGO and Lys with Au(0)-NrGO (Fig. 10f and a–e), a small shift of 5 cm−1 toward a higher wavenumber was observed for the D and G bands of the 2-D scaffold network of Lys–Au(0)-NrGO. This shift may be attributed to the structural changes in the Au(0)-NrGO sheet resulting from the interaction between Lys and Au(0)-NrGO to form a 2-D scaffold network.
In addition to Raman spectroscopy, TEM and SEM studies were performed for the conjugates of Lys with different Au(0)-NrGO concentrations (Fig. 11 and 12, respectively). Fig. 11a and 12a show the formation of the bioconjugate and Fig. clearly depicts the covering of the Au(0)-NrGO sheets with Lys molecules. The TEM micrographs clearly reveal that the Lys molecules interact with the gold NPs immobilized on the surface of NrGO, forming large-size agglomerates. Lys contains sulphur-containing amino acid residues, which may be the reason for the favorable interaction between the protein and gold nanoparticles. The aggregated Lys also interacts with the gold particles present in another Au(0)-NrGO sheet, which leads to the formation of a 2D geometry, in which many sheets are stacked together with the binding moiety as Lys. This result is also supported by Raman spectroscopy, where the corresponding Cys peaks disappeared in presence of Au(0)-NrGO.
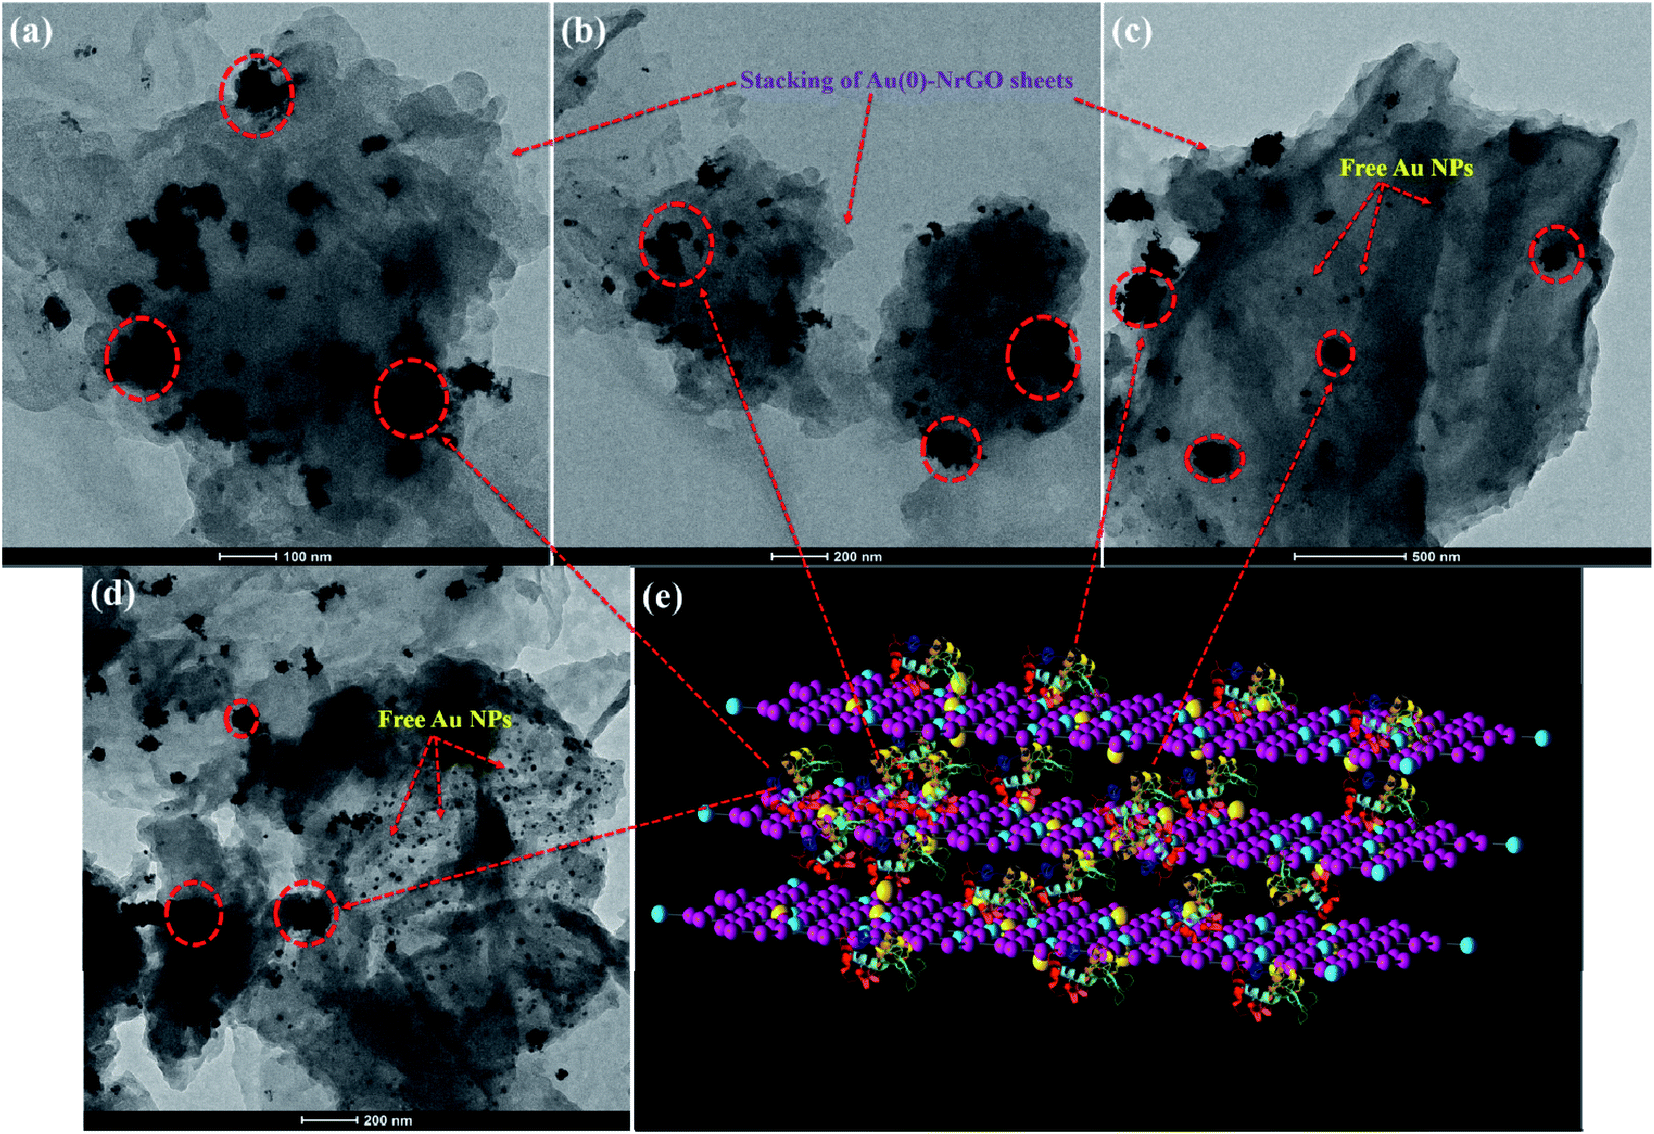 | ||
| Fig. 11 TEM images for the samples of Lys with various concentrations of Au(0)-NrGO (a) and (b) 50, (c) 200 and (d) 800 μg mL−1. (e) Model of the possible 2-D structure due to the interaction of Lys molecules with the sheets of Au(0)-NrGO. | ||
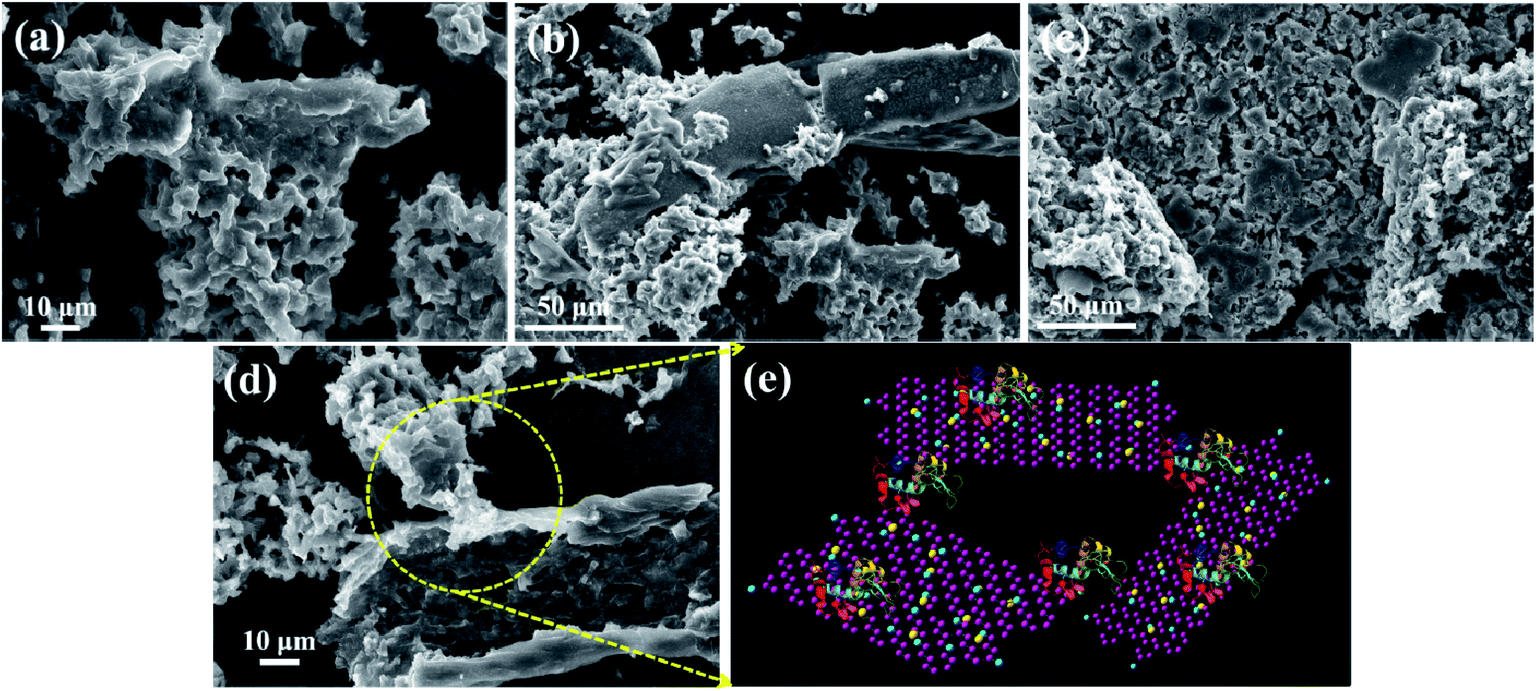 | ||
| Fig. 12 SEM images of lyophilized powder samples of Lys with various concentrations of Au(0)-NrGO (a) and (b) 50, (c) 200 and (d) 800 μg mL−1. (e) Model for interaction of Lys molecules and binding between the sheets of Au(0)-NrGO. | ||
Similarly, the binding of Lys molecules between two sheets of Au(0)-NrGO can be seen in the images in Fig. 11b and 12b. The formation of Lys aggregates on the sheets and larger 2-D structure was observed at an Au(0)-NrGO concentration of 200 μg mL−1 with Lys, as can be seen in Fig. 11c and 12c, due to the binding of Lys with the sheets of Au(0)-NrGO. However, at higher concentration of sheets, the covering of the sheet surface with Lys molecules is less likely to occur, and thus aggregates of Lys molecules around the gold NPs can be clearly seen in Fig. 11c and S3b.† At concentrations of 400 and 600 μg mL−1 of Au(0)-NrGO with Lys, as shown in Fig. S4(a and b),† the formation of a larger 2-D structure was observed due to the stacking of the sheets by the binding of the functional groups of Lys with the sheets of Au(0)-NrGO. Moreover, at a higher concentration of Au(0)-NrGO, i.e. 800 μg mL−1, there are not enough protein molecules available to bind the whole surface of the sheet (Fig. 11d and 12d), which shows the concentration dependence of the formation of the Lys–Au(0)-NrGO 2D matrix. At a higher concentration of material, free Au(0) NPs immobilized on NrGO are also visible in the images in Fig. 11d and S3c.† Additionally, Lys aggregates on the surface and in between the stacked sheets of Au(0)-NrGO can been seen in Fig. 11d and S3c.† Furthermore, protein can also be seen between the sheets forming the 2-D structural network (Fig. 11d, 12d and S4c†).
Obviously, the addition of Lys to Au(0)-NrGO solution led to an increase in the size of the sheets due to formation of Au(0)-NrGO and Lys conjugates, which can be explained by the interaction of the Lys molecule and its binding between the sheets of Au(0)-NrGO, as shown in Fig. 11e and 12e. The DLS results revealed an increase in the size of the Lys–Au(0)-NrGO bioconjugates and this observation was also supported by the TEM and SEM micrographs, showing the formation of a bioconjugate between the protein and nanomaterial, which led to the stacking of Au(0)-NrGO sheets, resulting in an increase in the size of the bioconjugates.
Consequently, the results from UV-visible and steady-state fluorescence spectroscopy reveal certain probable interactions between the positively charged Lys and Au(0)-NrGO surface. The decrease in the activity of Lys can be justified as a result of the variation in the native tertiary structure and change in the environment around the binding site of the protein in the presence of Au(0)-NrGO. The enzymatic activity of Lys was completely lost after a particular concentration (i.e. 200 μg mL−1) of Au(0)-NrGO, which also suggests no free Lys molecules were present in the solution. The loss in enzymatic activity can be justified by the non-availability of binding sites in the protein for the glycosidic oxygen of the anomeric carbon in the complex sugar of the bacterium cell wall. Thus, collectively, all the results illustrate that Lys favorably binds with the surface of Au(0)-NrGO, forming 2-D scaffolds, which results in an increase in the dH value. The surface of the native Lys contains a net positive charge15,61 and Au(0)-NrGO is negatively charged, which provides the possibility of electrostatic interactions between them. Furthermore, other various interactions are possible, such as hydrophobic interactions, H-bonding between the O and N groups present in the Au(0)-NrGO sheet with the protein, and interactions between the gold molecules immobilized on the NrGO sheets and sulphur-containing amino acid residues present inside the Lys protein. Lys interacts favorably with Au(0) NPs through the sulphur moieties of its Cys amino acid residue, which is confirmed by the disappearance of the peak at ∼507 cm−1 in the Raman spectra. Scheme 2 depicts the formation of the Lys–Au(0)-NrGO bioconjugate 2-D scaffolds via various biomolecular interactions between the surface of Lys and various sheets of Au(0)-NrGO.
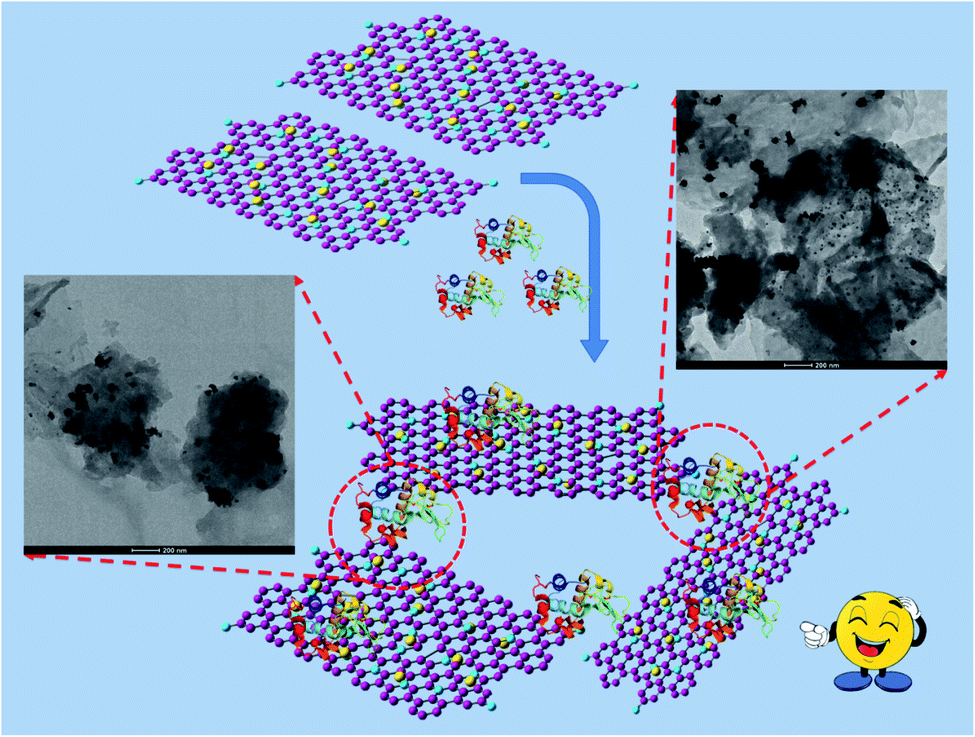 | ||
| Scheme 2 Pictorial representation of the formation of the 2-D scaffolds of the Lys–Au(0)-NrGO bioconjugate. | ||
It has been demonstrated that the protein-gold nanoparticle interactions and protein corona (PC) formed in the presence of Au NPs alter the physiological properties and provides “biological identity” to the newly formed AuNP-PC complex.70–73 Renault et al.70 reported the protein adsorption (myoglobin and hemoglobin) on the surface of silica nanoparticles (SNPs) and formation of an organized but discontinuous monolayer of proteins around the SNPs. Monticelli and colleagues71 reported the importance of the ligand conformation on the NP–protein interaction. These authors reported the masking of the NP surface functionality due to the formation of a protein corona and adsorption of protein around the NPs, which hampers the delivery of NPs to their biological target. Chakraborty et al.72 provided spectroscopic date for differently functionalized AuNPs with the lipid bilayer. Latterini and co-workers73 reported the surface functionalization effect of SNPs on the peroxidase activity of cytochrome c (cyt c). They reported the linear behavior of increasing peroxidase activity of cyt c upon its adsorption on the surface of SNPs, while the functionalization of SNPs with different concentrations of amino groups did not follow these trends, and also reported a change in the catalytic process upon adsorption. Herein, we observed conformational changes in the structure of Lys and formation of conjugates in the form of 2-D scaffolds due to the biomolecular interactions between Lys and Au(0) NPs immobilized over the surface of NrGO (Au(0)-NrGO).
4. Conclusion
In summary, herein, nitrogen-doped reduced graphene oxide (NrGO) was synthesized hydrothermally and spherical Au NPs (4.51 wt% loading) were immobilized uniformly over the surface of NrGO to obtain Au(0)-NrGO. The conformational changes in the structure of Lys and the electrostatic interactions, H-bonding and van der Waals interactions between Lys and Au(0)-NrGO were confirmed by UV-visible, fluorescence, and circular dichroism spectroscopy. The decrease in the activity of Lys was ascribed to the Au(0)-NrGO-induced conformational changes in the native structure of Lys. Collectively, all the results illustrate that Lys favorably binds with the surface Au(0)-NrGO, forming 2-D scaffolds. The DLS results also showed an enhancement in the size of the Au(0)-NrGO and Lys conjugates. The formation of 2-D scaffolds can be attributed to the electrostatic and hydrophobic interactions, H-bonding, and interactions between the Au NPs and sulfur-containing amino acid residues of Lys. SEM exhibited the formation of conjugates in the form of 2-D scaffolds due to the biomolecular interactions between Lys and Au(0)-NrGO. The TEM studies revealed Lys agglomerates around the Au(0) NPs immobilized on the surface of NrGO, indicating the formation of a protein corona (PC) around the Au(0) NPs. The favorable interaction between gold (NP)-sulphur (PC) was confirmed by the disappearance of the S–S stretching band in the Raman spectra. Thus, overall, the results obtained provide insight about the nano-bio interface and formation of NP-PC, which can be used for bioinspired applications, such as biosensing and imaging, and the development of advanced functional Au NPs.Conflicts of interest
All authors do not have any conflicts of interest to declare.Acknowledgements
KC is grateful to UGC, India for providing Junior Research Fellowship. We are gratefully thankful to the Council of Scientific & Industrial Research (CSIR), New Delhi, India through the Grant No. 01/2871/17/EMR-II for their financial support. Authors gratefully acknowledge IIC-IIT Roorkee for XPS facility, SAIF-AIIMS New Delhi for TEM facility.References
- R. Ahmad and M. Sardar, Biochem. Anal. Biochem., 2015, 04, 178 Search PubMed.
- R. Konwarh, N. Karak, S. K. Rai and A. K. Mukherjee, Nanotechnology, 2009, 20, 225107 CrossRef PubMed.
- M. Lv, E. Zhu, Y. Su, Q. Li, W. Li, Y. Zhao and Q. Huang, Prep. Biochem. Biotechnol., 2009, 39, 429–438 CrossRef CAS PubMed.
- Z. Aghili, S. Taheri, H. A. Zeinabad, L. Pishkar, A. A. Saboury, A. Rahimi and M. Falahati, PLoS One, 2016, 11, e0164878 CrossRef PubMed.
- S. Chakraborti, T. Chatterjee, P. Joshi, A. Poddar, B. Bhattacharyya, S. P. Singh, V. Gupta and P. Chakrabarti, Langmuir, 2010, 26, 3506–3513 CrossRef CAS PubMed.
- C. Lei, Y. Shin, J. Liu and E. J. Ackerman, J. Am. Chem. Soc., 2002, 124, 11242–11243 CrossRef CAS PubMed.
- Z. Yang, S. Si and C. Zhang, Microporous Mesoporous Mater., 2008, 111, 359–366 CrossRef CAS.
- J. Li, J. Wang, V. G. Gavalas, D. A. Atwood and L. G. Bachas, Nano Lett., 2003, 3, 55–58 CrossRef CAS.
- S. Phadtare, A. Kumar, V. P. Vinod, C. Dash, D. V. Palaskar, M. Rao, P. G. Shukla, S. Sivaram and M. Sastry, Chem. Mater., 2003, 15, 1944–1949 CrossRef CAS.
- C. C. You, S. S. Agasti, M. De, M. J. Knapp and V. M. Rotello, J. Am. Chem. Soc., 2006, 128, 14612–14618 CrossRef CAS PubMed.
- W. Shang, J. H. Nuffer, V. A. Muñiz-Papandrea, W. Colón, R. W. Siegel and J. S. Dordick, Small, 2009, 5, 470–476 CrossRef CAS PubMed.
- A. A. Vertegel, R. W. Siegel and J. S. Dordick, Langmuir, 2004, 20, 6800–6807 CrossRef CAS PubMed.
- S. Chakraborty, P. Joshi, V. Shanker, Z. A. Ansari, S. P. Singh and P. Chakrabarti, Langmuir, 2011, 27, 7722–7731 CrossRef CAS PubMed.
- T. Chatterjee, B. K. Chatterjee, T. Saha, K. M. Hoque and P. Chakrabarti, Biochim. Biophys. Acta, Gen. Subj., 2017, 1861, 977–986 CrossRef CAS PubMed.
- S. Bera, J. Dhar, R. Dasgupta, G. Basu, S. Chakraborti and P. Chakrabarti, Int. J. Biol. Macromol., 2018, 120, 2390–2398 CrossRef CAS PubMed.
- C. Cha, S. R. Shin, N. Annabi, M. R. Dokmeci and A. Khademhosseini, ACS Nano, 2013, 7, 2891–2897 CrossRef CAS PubMed.
- C. Chung, Y. K. Kim, D. Shin, S. R. Ryoo, B. H. Hong and D. H. Min, Acc. Chem. Res., 2013, 46, 2211–2224 CrossRef CAS PubMed.
- T. Jiang, W. Sun, Q. Zhu, N. A. Burns, S. A. Khan, R. Mo and Z. Gu, Adv. Mater., 2015, 27, 1021–1028 CrossRef CAS PubMed.
- C. McCallion, J. Burthem, K. Rees-Unwin, A. Golovanov and A. Pluen, Eur. J. Pharm. Biopharm., 2016, 104, 235–250 CrossRef CAS PubMed.
- J. Kim, S. J. Park and D. H. Min, Anal. Chem., 2017, 89, 232–248 CrossRef CAS PubMed.
- M. Orecchioni, R. Cabizza, A. Bianco and L. G. Delogu, Theranostics, 2015, 5, 710–723 CrossRef CAS PubMed.
- J. Zhang, J. Zhang, F. Zhang, H. Yang, X. Huang, H. Liu and S. Guo, Langmuir, 2010, 26, 6083–6085 CrossRef CAS PubMed.
- Y. Zhang, C. Wu and J. Zhang, Nanotechnol. Rev., 2013, 2, 27–45 CAS.
- Y. Zhang, J. Zhang, X. Huang, X. Zhou, H. Wu and S. Guo, Small, 2012, 8, 154–159 CrossRef CAS PubMed.
- L. Zhou, Y. Jiang, J. Gao, X. Zhao and L. Ma, Appl. Biochem. Biotechnol., 2012, 168, 1635–1642 CrossRef CAS PubMed.
- Z. Ding, H. Ma and Y. Chen, RSC Adv., 2014, 4, 55290–55295 RSC.
- M. De, S. S. Chou and V. P. Dravid, J. Am. Chem. Soc., 2011, 133, 17524–17527 CrossRef CAS PubMed.
- K. Yao, P. Tan, Y. Luo, L. Feng, L. Xu, Z. Liu, Y. Li and R. Peng, ACS Appl. Mater. Interfaces, 2015, 7, 12270–12277 CrossRef CAS PubMed.
- D. Y. Lee, Z. Khatun, J. H. Lee, Y. K. Lee and I. In, Biomacromolecules, 2011, 12, 336–341 CrossRef CAS PubMed.
- Y. Ding, R. Cui, M. Hu, S. Li, Q. Zhai and Y. Jiang, J. Mater. Sci., 2017, 52, 10001–10012 CrossRef CAS.
- J. Gao, C. L. Lu, Y. Wang, S. S. Wang, J. J. Shen, J. X. Zhang and Y. W. Zhang, Catalysts, 2018, 8, 180 CrossRef.
- J. Liu and Q. Peng, Acta Biomater., 2017, 55, 13–27 CrossRef CAS PubMed.
- J. Borowiec, R. Wang, L. Zhu and J. Zhang, Electrochim. Acta, 2013, 99, 138–144 CrossRef CAS.
- M. Chen, C. Hou, D. Huo, J. Bao, H. Fa and C. Shen, Biosens. Bioelectron., 2016, 85, 684–691 CrossRef CAS PubMed.
- D. Minta, P. Wiench and G. Gryglewicz, Proceedings, 2019, 15, 41 CrossRef.
- P. Chen, T. Y. Xiao, H. H. Li, J. J. Yang, Z. Wang, H. Bin Yao and S. H. Yu, ACS Nano, 2012, 6, 712–719 CrossRef CAS PubMed.
- G. Wu, R. Swaidan, D. Li and N. Li, Electrochim. Acta, 2008, 53, 7622–7629 CrossRef CAS.
- T. Wu, Q. Jiang, D. Wu, Y. Hu, S. Chen, T. Ding, X. Ye, D. Liu and J. Chen, Food Chem., 2019, 274, 698–709 CrossRef CAS PubMed.
- N. S. Jeyashekar, A. Sadana and T. Vo-Dinh, Methods Mol. Biol., 2005, 300, 417–435 Search PubMed.
- T. Silvetti, S. Morandi, M. Hintersteiner and M. Brasca, in Egg Innovations and Strategies for Improvements, Elsevier Inc., 2017, pp. 233–242 Search PubMed.
- V. A. Proctor and F. E. Cunningham, CRC Crit. Rev. Food Sci. Nutr., 1988, 26, 359–395 CrossRef CAS PubMed.
- S. Venkataramani, J. Truntzer and D. R. Coleman, J. Pharm. Bioallied Sci., 2013, 5, 148–153 CrossRef PubMed.
- N. I. Zaaba, K. L. Foo, U. Hashim, S. J. Tan, W. W. Liu and C. H. Voon, in Procedia Engineering, Elsevier Ltd, 2017, vol. 184, pp. 469–477 Search PubMed.
- Subodh, N. K. Mogha, K. Chaudhary, G. Kumar and D. T. Masram, ACS Omega, 2018, 3, 16377–16385 CrossRef CAS PubMed.
- Y. Gong, D. Li, Q. Fu and C. Pan, Prog. Nat. Sci. Mater. Int., 2015, 25, 379–385 CrossRef CAS.
- K. Tian, Z. Su, H. Wang, X. Tian, W. Huang and C. Xiao, Compos. Part A Appl. Sci. Manuf., 2017, 94, 41–49 CrossRef CAS.
- Y. Shang, H. Xu, M. Li and G. Zhang, Nano, 2017, 12, 1750018 CrossRef CAS.
- N. K. Mogha, V. Sahu, R. K. Sharma and D. T. Masram, J. Mater. Chem. B, 2018, 6, 5181–5187 RSC.
- H. Yu, P. Xu, D. W. Lee and X. Li, J. Mater. Chem. A, 2013, 1, 4444–4450 RSC.
- V. Sahu, S. Grover, B. Tulachan, M. Sharma, G. Srivastava, M. Roy, M. Saxena, N. Sethy, K. Bhargava, D. Philip, H. Kim, G. Singh, S. K. Singh, M. Das and R. K. Sharma, Electrochim. Acta, 2015, 160, 244–253 CrossRef CAS.
- M. Ghorbani, H. Abdizadeh and M. R. Golobostanfard, Procedia Mater. Sci., 2015, 11, 326–330 CrossRef CAS.
- S. K. Chaudhary, K. Prakash and D. T. Masram, Appl. Surf. Sci., 2019, 144902 Search PubMed.
- R. Wang, Y. Wang, C. Xu, J. Sun and L. Gao, RSC Adv., 2013, 3, 1194–1200 RSC.
- H. L. Guo, P. Su, X. Kang and S. K. Ning, J. Mater. Chem. A, 2013, 1, 2248–2255 RSC.
- D. H. Wang, Y. Hu, J. J. Zhao, L. L. Zeng, X. M. Tao and W. Chen, J. Mater. Chem. A, 2014, 2, 17415–17420 RSC.
- K. Chaudhary, Subodh, K. Prakash, N. K. Mogha and D. T. Masram, Arabian J. Chem., 2020, 13, 4869–4881 CrossRef CAS.
- M. Vikkisk, I. Kruusenberg, U. Joost, E. Shulga, I. Kink and K. Tammeveski, Appl. Catal., B, 2014, 147, 369–376 CrossRef CAS.
- C. Yang, Y. Yu, Y. Xie, D. Zhang, P. Zeng, Y. Dong, B. Yang, R. Liang, Q. Ou and S. Zhang, Appl. Surf. Sci., 2019, 473, 83–90 CrossRef CAS.
- X. Xie, J. Long, J. Xu, L. Chen, Y. Wang, Z. Zhang and X. Wang, RSC Adv., 2012, 2, 12438–12446 RSC.
- G. Yang, L. Li, R. K. Rana and J. J. Zhu, Carbon, 2013, 61, 357–366 CrossRef CAS.
- I. Jha, A. Rani and P. Venkatesu, ACS Sustain. Chem. Eng., 2017, 5, 8344–8355 CrossRef CAS.
- M. Bisht, A. Kumar and P. Venkatesu, Phys. Chem. Chem. Phys., 2016, 18, 12419–12422 RSC.
- M. Bisht, A. Kumar and P. Venkatesu, Int. J. Biol. Macromol., 2015, 81, 1074–1081 CrossRef CAS PubMed.
- S. M. Kelly, T. J. Jess and N. C. Price, Biochim. Biophys. Acta - Proteins Proteomics, 2005, 1751, 119–139 CrossRef CAS PubMed.
- J. Held and S. Van Smaalen, Acta Crystallogr., Sect. D: Biol. Crystallogr., 2014, 70, 1136–1146 CrossRef CAS PubMed.
- R. Kuroki, L. H. Weaver and B. W. Matthews, Proc. Natl. Acad. Sci. U. S. A., 1999, 96, 8949–8954 CrossRef CAS PubMed.
- N. C. J. Strynadka and M. N. G. James, J. Mol. Biol., 1991, 220, 401–424 CrossRef CAS PubMed.
- N. Sreerama and R. W. Woody, Anal. Biochem., 2000, 287, 252–260 CrossRef CAS PubMed.
- A. V. Frontzek, L. Paccou, Y. Guinet and A. Hédoux, Biochim. Biophys. Acta, Gen. Subj., 2016, 1860, 412–423 CrossRef CAS PubMed.
- L. Marichal, G. Giraudon-Colas, F. Cousin, A. Thill, J. Labarre, Y. Boulard, J. C. Aude, S. Pin and J. P. Renault, Langmuir, 2019, 35, 10831–10837 CrossRef CAS PubMed.
- F. Simonelli, G. Rossi and L. Monticelli, J. Phys. Chem. B, 2019, 123, 1764–1769 CrossRef CAS PubMed.
- N. Kanwa, A. Patnaik, S. K. De, M. Ahamed and A. Chakraborty, Langmuir, 2019, 35, 1008–1020 CrossRef CAS PubMed.
- L. Tarpani, F. Bellezza, P. Sassi, M. Gambucci, A. Cipiciani and L. Latterini, J. Phys. Chem. B, 2019, 123, 2567–2575 CrossRef CAS PubMed.
Footnotes |
| † Electronic supplementary information (ESI) available. See DOI: 10.1039/d0na00155d |
| ‡ Both authors have equal contribution. |
| This journal is © The Royal Society of Chemistry 2020 |