 Open Access Article
A hyper-branched polymer tunes the size and enhances the fluorescent properties of aggregation-induced emission nanoparticles†
Javad
Tavakoli
ab,
Nikita
Joseph
a,
Colin L.
Raston
 a and
Youhong
Tang
 *a
*a
aInstitute for NanoScale Science and Technology, College of Science and Engineering, Flinders University, South Australia, Australia. E-mail: youhong.tang@flinders.edu.au; Tel: +61-8-82012138
bCentre for Health Technologies, School of Biomedical Engineering, Faculty of Engineering and Information Technology, University of Technology Sydney, Sydney, Australia
First published on 30th January 2020
Abstract
The host–guest interaction approach, specifically via the formation of hydrogen bonds, is an effective strategy for preparing luminescent hyper-branched polymers. The challenge here is how to optimize the binding strength and particle size to tune fluorescence properties. The aim of the current study was to optimize the guest (aggregation-induced emission molecule, AIE)–host (hyper-branched polymer, HBP) interaction in the development of an HBP/AIE complex (AIE–HBP) with tunable luminescence properties via the formation of strong hydrogen bonds. Overall, a simple one-step method for the preparation of AIE–HBP was demonstrated. The method was based on the formation of hydrogen bonds among AIE molecules and HBP molecules, resulting in the development of a stable AIE–polymer complex. Compared to other techniques (direct polymerization or post-functionalization), the proposed technique was much simpler. The fluorescence properties of AIE–HBP were significantly enhanced compared to AIE alone and could be tuned during the formation of AIE–HBP by using a novel vortex fluidic device (VFD). The as-prepared AIE–HBP can be used to simultaneously enhance the mechanical properties of hydrogels while increasing the fluorescence properties.
Introduction
Luminogens with aggregation-induced emission (AIE) features demonstrate enhanced emission during aggregation and provide notable opportunities for the development of highly efficient luminophores with potential applications in biological and engineering fields.1,2 Following recent progress in the preparation of efficient luminescent materials with AIE characteristics, much research has been undertaken to introduce their applications, leading to innovative findings.3–5 Early efforts to identify AIE systems resulted in the development of small molecules or low molecular weight molecules that were highly efficient for different applications.6–8 However, for practical applications at the macroscale, e.g., fabrication of solid-state thin films, small AIE molecules or low molecular weight AIE molecules is unlikely to be efficient. The physical blending of small or low molecular weight AIE molecules with polymeric components seemed to be an inefficient approach to obtain AIE active complex systems.9 The preparation of AIE active luminogens with high molecular weight and functionality (>2) might help to address this drawback, meanwhile contributing to the development of polymeric components with new properties.10,11 Compared to small or low molecular weight AIE molecules, AIE–HBP displays more prominent advantages, including variation in structure and properties and simplicity of fabrication of polymeric components (film and fibres) with luminescence characteristics and tunable mechanical properties.9,10 Classic strategies for the preparation of AIE–HBP use either direct polymerization or post-functionalization.11–13 Unlike direct polymerization, where AIE molecules incorporate the polymer structure as monomers, post-functionalization mainly involves modification into polymers as pendant groups or grafted side chains. Even if effective, these synthetic strategies for the construction of AIE–HBP are time-consuming, relatively expensive, and require different polymerization reactions and catalysts.13,14Of particular interest, control of gelation during the direct polymerization process as well as the solubility of conjugated polymers with hyper-branched architecture remains challenging.9,10 On the other hand, the post-functionalization of HBPs via the formation of side chains or pendant groups may result in a greater particle size. It appears that the host–guest interaction approach specifically via the formation of hydrogen bonds is an effective strategy for preparing luminescent HBPs. The challenge here is how to optimize the binding strength and particle size to tune fluorescence properties. Such a strategic approach would have potential for the creation of mechanically strong hydrogels with luminescence properties since the AIE–HBP complexes would serve as physical crosslinking agents. Moreover, AIE–HBP complexes provide superior fluorescence sensitivity for bio-sensing applications compared to their small-molecule counterparts.15
The aim of the current study was to optimize the guest (AIE)–host (HBP) interaction in the development of AIE–HBPs with tunable luminescence properties via the formation of strong hydrogen bonds.
Results and discussion
HBPs boost the fluorescence intensities of AIE nanoparticles
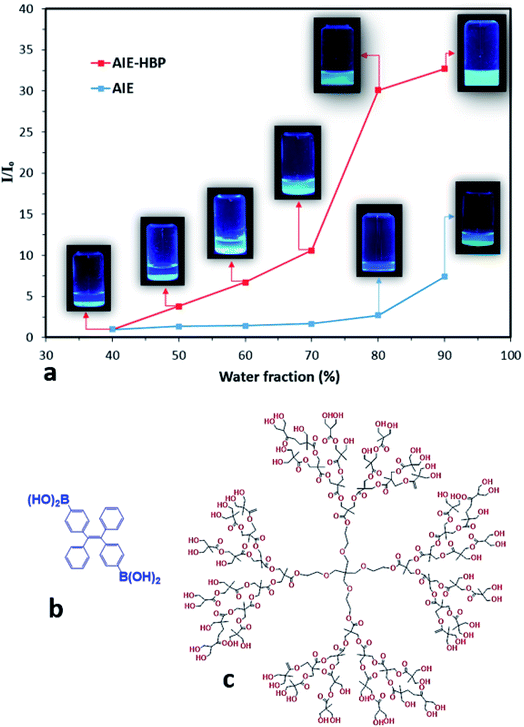
In this study, the AIE luminogen (AIEgen), i.e., TPE-2BA, a derivative of tetraphenylethylene with 2 boronic acid groups, was used as the guest. TPE-2BA is not soluble in water at neutral pH but is fully miscible in dimethyl sulphoxide (DMSO).16,17 The preparation of TPE-2BA aggregates involves adding water (anti-solvent) to the vigorously shaken TPE-2BA/DMSO solution. The brightness of the TPE-2BA particles depends on the final ratio of water to DMSO, with fluorescence (FL) intensity negligible for water fractions (WFs) <70%, then increasing in tracking towards WF = 90% (Fig. 1). A commercially available HBP, i.e., bis-MPA polyester-64-hydroxyl (generation 4), was employed as the host. Briefly, to prepare AIE–HBP, the TPE-2BA/DMSO solution was added to the HBP/DMSO solution under constant stirring. Then water was added to the vigorously shaken final solution at different pre-set WFs, while the concentration of TPE-2BA (50 μM) remained constant (ESI S1†). Significant differences in FL intensity were found for the AIE–HBP (HBP concentration = 1 mM) at different WFs (Fig. 1a). The FL intensity increased 32-fold when WF = 90% compared to WF = 40%. Also, we found that the associated maximum FL intensity at WF = 90% for AIE–HBP was approximately 5 times greater than that of TPE-2BA alone. This observation was consistent with other studies, where enhancement of fluorescence properties via the formation of hydrogen bonds was reported.4,10,12 The chemical structures of AIE and the HBP are presented in Fig. 1b and c, respectively.Tuning AIE nanoparticle fluorescence properties by changing HBP concentrations
We also found that changing the HBP concentration altered the FL properties of AIE–HBP. We observed that at a constant WF, an increase in HBP concentration enhanced the FL properties of the AIE–HBP. With a high WF (>80%), increasing the HBP concentration from 0.01 mM to 1 mM resulted in a significant change in FL properties. When the WF was set at 90%, a 180% increase in FL maxima was seen for AIE–HBP containing 1 mM HBP compared to that containing 0.01 mM HBP (Fig. 2a). Consequently, the associated enhancement of relative intensity was approximately 140%. In contrast, with a lower WF (<70%), changes in the FL intensity for a lower concentration of HBP (Fig. 2b) and the relative intensity were almost negligible (Fig. 2b; inset). We found that at a constant WF, the FL maxima of AIE–HBP containing 1 mM concentration of HBP increased significantly compared with complexes containing lower concentrations of HBP. For instance, at WF = 70%, the FL maximum for AIE–HBP (1 mM) was enhanced by approximately 70% compared to those of AIE–HBP containing lower concentrations of HBP (0.01, 0.1, 0.25 and 0.5 mM). At a constant HBP concentration, as with AIE alone, we observed that the brightness of AIE–HBP aggregates depended on the final ratio of water to DMSO, with an increase in tracking towards 90% (Fig. 2b; inset). In general, we found that at different WFs, the addition of HBP resulted in higher relative intensities of AIE–HBP compared to that of AIE alone. Brighter aggregates were seen in AIE–HBP (Fig. 2b: inset 1 mM 2b-A and 0.01 mM 2b-B) compared to that in AIE alone (Fig. 2b–C) at WF = 90%.Subsequently, we found that the fluorescence quantum yield of AIE–HBP aggregates depended on the final concentration of the HBP, with an increase in tracking towards 1 mM. At a constant WF = 90%, the FL quantum yields were 56% and 27% for AIE–HBP with 1 and 0.01 mM concentrations of HBP, respectively indicating a 107.4% enhancement. We also observed that the quantum yield dropped by 27% when the HBP concentration was decreased to 0.5 mM, compared to that with 1 mM.
The quantum yield remained constant (approximately 41%) for AIE–HBP containing 0.5, 0.25 and 0.1 mM of HBP. Our results revealed that for a constant HBP concentration, an increase in WF significantly enhanced the associated quantum yield. With HBP concentration = 1 mM, the quantum yield was measured at 11.2, 30 and 56% for WF = 70, 80 and 90%, respectively (ESI S2†). We also found acceptable fluorescence stability of AIE–HBP with 1 mM concentration of HBP, with a negligible decrease over one week at WF = 90% (ESI S3†). With lower concentrations of HBP (0.5, 0.25 and 0.1 mM), less stable AIE–HBP aggregates were found and none was stable for more than approximately 24 h. This finding was consistent with the results obtained from zeta potential measurements. At WF = 90%, zeta potentials were equal to −38.7 and −33.2 mV for AIE–HBP and TPE-2BA respectively, indicating moderate stability of both systems. However, an increase of approximately 15% in zeta potential was found for AIE–HBP compared to that of TPE-2BA. Therefore, there was the possibility of the creation of a secondary minimum, where adhesion between TPE-2BA and HBP was formed via an aggregation (flocculation) process during the formation of hydrogen bonds (ESI S4†). Based on the measured zeta potential (zeta potential > −30 mV), TPE-2BA and HBP aggregates were sufficiently stable at WF = 90% not to be broken by internal repulsion/attraction forces or Brownian motion. Low stability was found in AIE–HBP when WFs and HBP concentrations were <90% and <1 mM, respectively. In TPE-2BA alone, a decrease in WF (<90%) resulted in the reduction of stability (Table 1).
| WF (%) | Hyper-branched polymer concentration (mM) | |||||
|---|---|---|---|---|---|---|
| 1 | 0.5 | 0.25 | 0.1 | 0.01 | 0.0 | |
| 70 | −14.1 | −12 | −11.4 | −9.3 | −8.3 | −14.9 |
| 80 | −25 | −19.4 | −18 | −17.1 | −15.1 | −25.1 |
| 90 | −38.7 | −27.2 | −20.3 | −18.9 | −18.2 | −33.2 |
As can be seen, increasing the concentration of HBP (0.01–1 mM) at a specific water fraction between 70 and 90% will increase its zeta potential values. The change in the structure of the AIE–HBP complex is likely to be considered for this observation. It was revealed that the particle sizes for the AIE–HBP complexes were different (Fig. 4b) across various HBP concentrations, leading to the formation of more stable complexes at higher concentrations of HBP (Fig. 3d).
Mechanistic study on AIE–HBP interactions and particle size manipulation
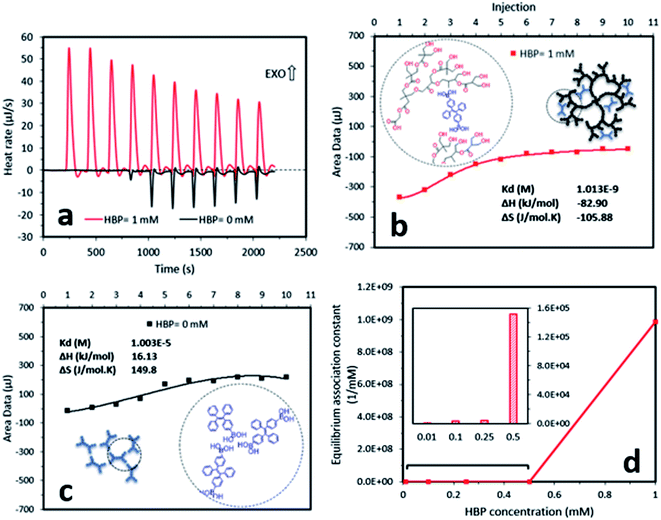
To understand the mechanism of the formation of AIE–HBP, we performed two further experiments, which involved hydrogen bond strength and nanoparticle size measurement. Measurement of hydrogen bond strength using isothermal titration calorimetry revealed the formation of a strong hydrogen bond between TPE-2BA and the HBP (Fig. 3). The addition of the TPE-2BA/DMSO solution to the HBP/DMSO solution resulted in an exothermic reaction (Fig. 3a) with an equilibrium association constant equal to 9.9 × 10⁸ mM−1. However, the formation of TPE-2BA aggregates in DMSO was almost endothermic (Fig. 3a), with an equilibrium association constant equal to 0.99 × 10⁵ mM−1 (Fig. 3b and c). Clearly, the formation of hydrogen bonds between TPE-2BA and the HBP was 10![[thin space (1/6-em)]](https://www.rsc.org/images/entities/char_2009.gif) 000 times stronger than that among TPE-2BA molecules when the HBP concentration was 1 mM. Lower equilibrium association constants were seen when the HBP concentration decreased from 1 mM to 0.01 mM (Fig. 3d).
000 times stronger than that among TPE-2BA molecules when the HBP concentration was 1 mM. Lower equilibrium association constants were seen when the HBP concentration decreased from 1 mM to 0.01 mM (Fig. 3d).
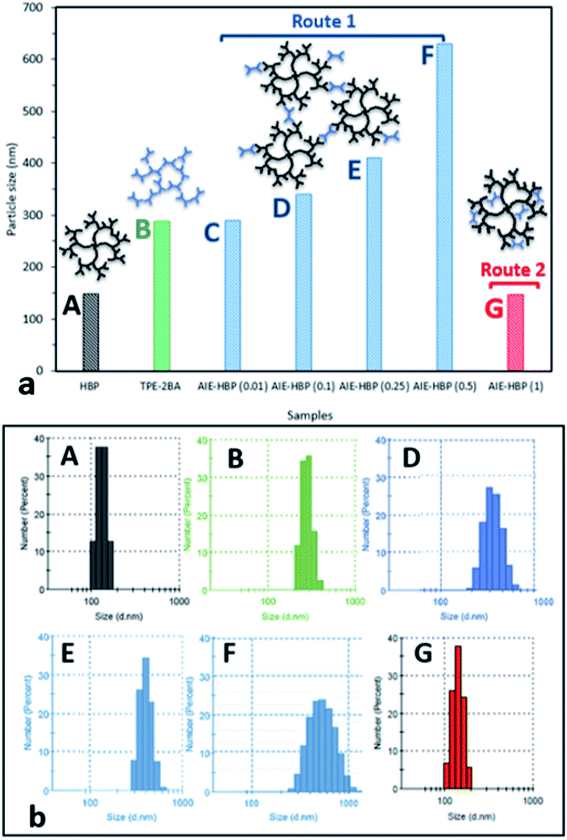
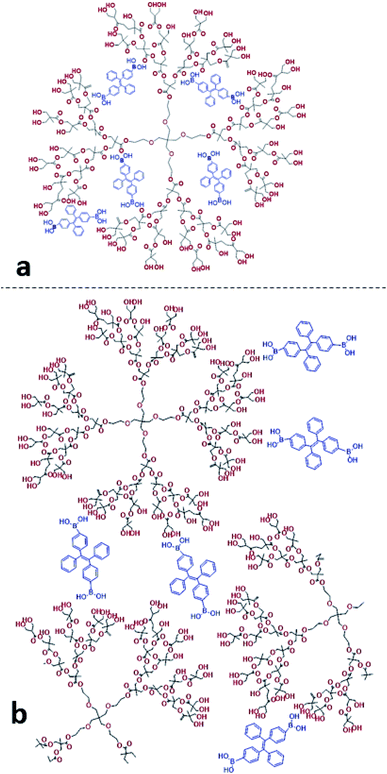
We found that in the absence of TPE-2BA, the size of HBP particles was 144 nm at concentration = 1 mM. We further realized that the impact of HBP concentration (0.01–1 mM) on the particle size was negligible (ESI S5†). Also, we observed that in the absence of the HBP and when WF = 90%, the average particle size of TPE-2BA aggregates was approximately 280 nm, which was larger than that of HBP particles. During the formation of AIE–HBP at WF = 90%, we found that the size of AIE–HBP increased from 280 nm to 630 nm when the HBP concentration was increased from 0 to 0.5 mM. Interestingly, the size of AIE–HBP particles decreased dramatically to 147 nm when the HBP concentration was 1 mM. It was notable that the AIE–HBP (WF = 90%) and HBP particles were identical in size (Fig. 4). These observations were consistent with AFM images captured from the HBP and AIE–HBP at WF = 90% with different concentrations of HBP (ESI S6†). These findings were of particular importance for investigating the mechanism of the formation of AIE–HBP. In fact, with the addition of the HBP to the TPE-2BA solution, two routes for the formation of hydrogen bonds are likely to occur. At low concentrations of HBP (0.01–0.5 mM), it is more likely that TPE-2BA molecules link HBP molecules, resulting in the formation of larger AIE–HBP particles (Route 1). The second possibility is the formation of hydrogen bonds between TPE-2BA and HBP, leading to aggregation of TPE-2BA molecules within the HBP particles (Route 2). Our results revealed that when WF = 90%, the second route was more likely to occur during the formation of AIE–HBP where TPE-2BA molecules fitted within the HBP structure (Fig. 4a: insets). The associated chemical structures indicating the proposed routes are presented in Fig. 5.
Vortex fluidic device technologies further boost the fluorescence properties of AIE–HBP
As already explained, the FL intensity of AIE–HBP (1 mM) increased 5 fold compared to that of the TPE-2BA alone when WF = 90%. In our previous study,18 we proved that the preparation of AIE particles under thin films significantly enhanced the associated FL properties when a vortex fluidic device (VFD) was used. The recently developed VFD is a relatively inexpensive research tool for controlling chemical reactivity and selectivity and material synthesis, and for probing the structure of self-organized systems, providing a range of benefits over conventional processing.19 The dynamic thin film within the VFD microfluidic platform is generated on a rapidly rotating surface, imparting high shear stress and micro-mixing. Typically, a glass tube closed at one end is rotated rapidly at a 45° tilt angle with a finite amount of liquid in the tube, either in the confined mode of the VFD or where liquids are constantly fed into the tube, exiting at the top, in the continuous flow mode of operation. We have successfully employed VFDs in a number of diverse applications, including the fabrication of various nanocarbon materials,20 intensified aqueous two-phase separation for protein purification,21 manipulation of polymer networks22 and size,18 exfoliation of graphite and boron nitride,23 and protein folding.24 Of particular interest, we found that the VFD is effective in controlling the size and shape of nanoparticles, for both top-down and bottom-up processing. Therefore, we hypothesized that the VFD is capable of increasing the FL properties of AIE–HBP particles while retaining approximately the associated size. To explore this hypothesis, TPE-2BA was added to a strongly rotating tube containing HBP (1 mM) using a VFD and the effect of different rotation speeds on the FL intensity of the AIE–HBP was examined. As shown in Fig. 6, we found that AIE–HBP particles prepared under thin films in the VFD tube were significantly brighter than TPE-2BA particles. We observed that increasing the rotation speed from 1000 to 3000 rpm resulted in an increase in the relative fluorescence intensity. However, the relative fluorescent intensity remained intact with rotation speeds >3000 rpm. Interestingly, we found negligible changes in particle size for VFD-driven AIE–HBP particles compared to those prepared without the VFD (Fig. 6b and c). Clearly, the formation of AIE–HBP under shear stress resulted in increased penetration of AIE molecules within the HBP structure, leading to significantly brighter AIE–HBP particles, i.e., 70 times brighter than TPE-2BA alone.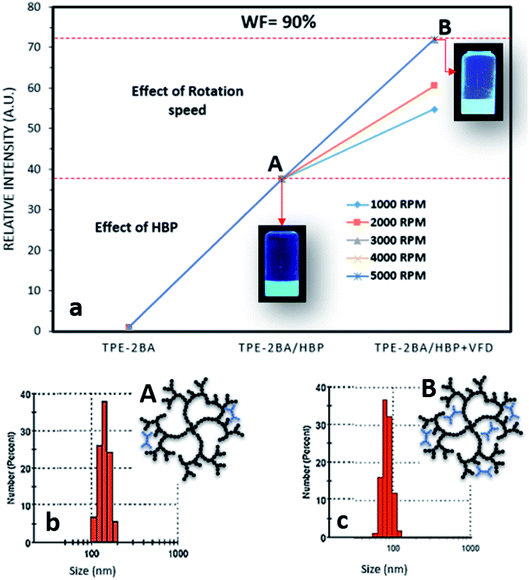 | ||
| Fig. 6 (a) The effect of rotation speed on the relative intensity of AIE–HBP (1 mM) and (b) and (c) size distribution and schematic drawing of AIE–HBP particles (A) before and (B) after VFD. | ||
Based on a previous study, the size of AIE aggregates can be tuned using a VFD, with smaller and brighter particles being fabricated at higher rotation speeds.18 One of the main reasons was the control of shear forces that were applied to the AIE aggregates during rotation, a phenomenon called “AIE aggregation under thin film formation”. Therefore, the smaller AIE particles were more likely to penetrate deep inside the structure of HBP molecules, when a VFD was employed. This resulted in more restriction of the inter-molecular rotation leading to higher fluorescence properties. In contrast, when AIE–HBP is formed by a traditional mixing method, AIE molecules might not diffuse deeply into an HBP structure and be formed mainly in the outer region (still inside) of the HBP molecule. This was confirmed by the measurement of the particle size of the AIE–HBP complex before and after using the VFD. At WF = 90%, the average particle size for the traditionally prepared AIE–HBP was approximately 150 nm (Fig. 6b), with the relative FL intensity 38 times greater than that of TPE-2BA alone (Fig. 6a). When the VFD was employed, the particle size for AIE–HBP reduced to 80 nm, approximately, while the relative FL intensity became 73 times greater than that of TPE-2BA (Fig. 6a and c). The formation of a smaller AIE–HBP complex containing more AIE molecules (formed inside the HBP molecule structure) might be the reason behind our observation. By employment of a VFD, it is possible to form AIE–HBP complexes with particle size less than 100 nm under optimized conditions.
AIE–HBP for biomedical applications
To further reveal the feasibility of the application of AIE–HBP in the biomedical field, a case study was undertaken here. The study featured fabrication of a highly elastic hydrogel based on polyvinyl alcohol (PVA) having fluorescence properties. Two different hydrogels (with the same dimensions of 1 mm × 5 mm × 20 mm; t × W × L) were prepared using the thin film formation process. The control sample contained PVA alone and the other sample included AIE–HBP at a concentration of 1 mM. Hydrogels were attached securely to the grippers of highly precise custom-made tension devices (ESI S7†) and stretched manually. The magnitude of stretch was controlled by a rotating handle at the micro-level. At different stretch magnitudes, camera images were captured under UV light and without UV radiation (Fig. 7). We found that failure occurred in the PVA hydrogel at strains lower than = 472%, whereas the PVA hydrogel with AIE–HBP was significantly more elastic. No sign of failure was observed in the hydrogel containing AIE–HBP (1 mM) over 800% strain. The hydrogel containing AIE–HBP exhibited fluorescence properties under different magnitudes of strain.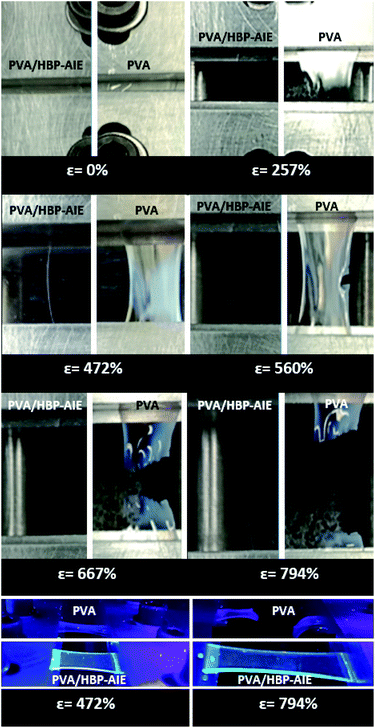 | ||
| Fig. 7 Camera images of PVA and PVA + AIE–HBP hydrogels with and without UV (365 nm) radiation. The concentration of HBP in PVA + AIE–HBP was 1 mM. | ||
Our previous study revealed that TPE-2BA at a high volumetric water fraction (90%) has acceptable stability just for the short term (60 min), and upon addition of TPE-2BA (without HBP) to the structure of PVA, sparse and irregular distribution of low emitting light regions with very small sizes (<5 μm) appeared under microscopic observation. The emission of blue light for PVA/TPE-2BA under the UV lamp was negligible.24 In contrast, the TPE-2BA/HBP complex resulted in more stability for both the TPE-2BA molecule and hydrogel and led to the fabrication of a more light-emitting PVA hydrogel. The mechanical properties of the PVA + AIE–HBP hydrogel are dominant by the formation of hydrogen bonds between the OH groups of PVA and HBP. Therefore, it is very likely that a decrease in HBP concentration for the PVA + AIE–HBP hydrogel, compared to the PVA hydrogel containing 1 mM of HBP–AIE, results in a decrease in the mechanical properties. Since the current study was aimed at creating a high fluorescence hydrogel for biomedical applications, the study of mechanical properties of hydrogels with a lower concentration of HBP and different sizes of particles was excluded.
Conclusions
Overall, a simple method for the one-step preparation of an AIE–HBP complex was presented. The method was based on the formation of hydrogen bonds between a specific AIE molecule and a HBP, resulting in the development of a stable AIE–polymer complex. Compared to other techniques (direct polymerization or post-functionalization), the proposed technique was much simpler. The FL properties of the final AIE–polymer complex were significantly enhanced compared to those of the AIE alone and could be tuned during the formation of AIE–HBP by using a VFD. The as-prepared AIE–HBP could be used to simultaneously enhance the mechanical properties of hydrogels while enhancing fluorescence properties.Conflicts of interest
There are no conflicts to declare.Acknowledgements
J. T. and Y. T. acknowledge an International Research Grant (International Laboratory for Health Technologies) of South Australia and the Australia-China Science and Research Fund-Joint Research Centre on Personal Health Technologies for support. The expertise, equipment and support provided by Microscopy Australia and the Australian National Fabrication Facility at the South Australian nodes under the National Collaborative Research Infrastructure Strategy are acknowledged.References
- Q. Wang, S. Zhang, B. Wang, X. Yang, B. Zou, B. Yang and S. Lu, Nanoscale Horiz., 2019, 4, 1227–1231 RSC.
- J. Mei, Y. Hong, J. W. Lam, A. Qin, Y. Tang and B. Z. Tang, Adv. Mater., 2014, 26(31), 5429–5479 CrossRef PubMed.
- B. Liu, A. Pucci and T. Baumgartner, Mater. Chem. Front., 2017, 1, 1689–1690 RSC.
- J. Tavakoli, H. P. Zhang, B. Z. Tang and Y. Tang, Mater. Chem. Front., 2019, 3(4), 664–667 RSC.
- J. Tavakoli, E. Laisak, M. Gao and Y. Tang, Mater. Sci. Eng., C, 2019, 104, 109951 CrossRef.
- F. Guo, W. P. Gai, Y. Hong, B. Z. Tang, J. Qin and Y. Tang, Chem. Commun., 2015, 51(97), 17257–17260 RSC.
- W. Qin, D. Ding, J. Liu, W. Z. Yuan, Y. Hu, B. Liu and B. Z. Tang, Adv. Funct. Mater., 2012, 22(4), 771–779 CrossRef CAS.
- J. Liang, B. Z. Tang and B. Liu, Chem. Soc. Rev., 2015, 44(10), 2798–2811 RSC.
- A. Qin, J. W. Lam and B. Z. Tang, Prog. Polym. Sci., 2012, 37(1), 182–209 CrossRef CAS.
- Z. Qiu, X. Liu, J. W. Lam and B. Z. Tang, Macromol. Rapid Commun., 2019, 40(1), 1800568 CrossRef.
- N. Dehbari, J. Tavakoli, S. S. Khatrao and Y. Tang, Mater. Chem. Front., 2017, 1(10), 1995–2004 RSC.
- R. Hu, N. L. Leung and B. Z. Tang, Chem. Soc. Rev., 2014, 43(13), 4494–4562 RSC.
- W. Zheng, G. Yang, S. T. Jiang, N. Shao, G. Q. Yin, L. Xu and H. B. Yang, Mater. Chem. Front., 2017, 1(9), 1823–1828 RSC.
- T. Sakurai, N. Orito, S. Nagano, K. Kato, M. Takata and S. Seki, Mater. Chem. Front., 2018, 2(4), 718–729 RSC.
- S. Jhulki, M. W. Cooper, S. Barlow and S. R. Marder, Mater. Chem. Front., 2019, 3, 1699–1721 RSC.
- E. Zhao, Y. Hong, S. Chen, C. W. Leung, C. Y. Chan, R. T. Kwok and B. Z. Tang, Adv. Healthcare Mater., 2014, 3(1), 88–96 CrossRef CAS.
- Y. Liu, C. Deng, L. Tang, A. Qin, R. Hu, J. Z. Sun and B. Z. Tang, J. Am. Chem. Soc., 2010, 133(4), 660–663 CrossRef.
- J. Tavakoli, S. Pye, A. M. Reza, N. Xie, J. Qin, C. L. Raston, B. Z. Tang and Y. Tang, Mater. Chem. Front., 2020 10.1039/C9QM00585D.
- J. Britton, K. A. Stubbs, G. A. Weiss and C. L. Raston, Chem.–Eur. J., 2017, 23(54), 13270–13278 CrossRef CAS.
- K. Vimalanathan, J. R. Gascooke, I. Suarez-Martinez, N. A. Marks, H. Kumari, C. J. Garvey and C. L. Raston, Sci. Rep., 2016, 6, 22865 CrossRef CAS.
- X. Luo, A. H. M. Al-Antaki, K. Vimalanathan, J. Moffatt, K. Zheng, Y. Zou and Q. Li, React. Chem. Eng., 2018, 3(2), 164–170 RSC.
- X. Luo, P. Smith, C. L. Raston and W. Zhang, ACS Sustainable Chem. Eng., 2016, 4(7), 3905–3911 CrossRef CAS.
- T. Z. Yuan, C. F. Ormonde, S. T. Kudlacek, S. Kunche, J. N. Smith, W. A. Brown and G. A. Weiss, ChemBioChem, 2015, 16(3), 393–396 CrossRef CAS.
- J. Tavakoli, J. Gascooke, N. Xie, B. Z. Tang and Y. Tang, ACS Appl. Polym. Mater., 2019, 1(6), 1390–1398 CrossRef CAS.
Footnote |
| † Electronic supplementary information (ESI) available. See DOI: 10.1039/d0na00044b |
| This journal is © The Royal Society of Chemistry 2020 |

