DOI:
10.1039/C9MT00196D
(Paper)
Metallomics, 2020,
12, 114-132
Characterising the brain metalloproteome in Down syndrome patients with concomitant Alzheimer's pathology
Received
1st August 2019
, Accepted 18th November 2019
First published on 18th November 2019
Abstract
Down syndrome (DS) is a common intellectual disability, with an incidence of 1 in 700 and is caused by trisomy 21. People with DS develop Alzheimer's disease (AD)-like neuropathology by the age of 40. As metal ion dyshomeostasis (particularly zinc, iron and copper) is one of the characteristics of AD and is believed to be involved in the pathogenesis of disease, we reasoned that it may also be altered in DS. Thus, we used inductively coupled plasma mass spectrometry to examine metal levels in post-mortem brain tissue from DS individuals with concomitant AD pathology. Size exclusion-ICPMS was also utilised to characterise the metalloproteome in these cases. We report here for the first time that iron levels were higher in a number of regions in the DS brain, including the hippocampus (40%), frontal cortex (100%) and temporal cortex (34%), compared to controls. Zinc and copper were also elevated (both 29%) in the DS frontal cortex, but zinc was decreased (23%) in the DS temporal cortex. Other elements were also examined, a number of which also showed disease-specific changes. The metalloproteomic profile in the DS brain was also different to that in the controls. These data suggest that metals and metal:protein interactions are dysregulated in the DS brain which, given the known role of metals in neurodegeneration and AD, is likely to contribute to the pathogenesis of disease. Interrogation of the underlying cellular mechanisms and consequences of this failure in metal ion homeostasis, and the specific contributions of the individual DS and AD phenotypes to these changes, should be explored.
Significance to metallomics
Whilst much is known about the common genetic disorder of Down syndrome (DS) there has been little research performed on the involvement of metals (such as zinc, iron and copper) in the disease. Given the reported role of such metals in neurodegeneration, then it is possible that there may be a similar involvement in DS. Indeed, we demonstrate here that there are alterations in metals and the metalloproteome that are suggestive of altered metal dyshomeostasis in the DS brain, although this may be impacted by the concomitant Alzheimer's disease pathology in these cases. The pharmacological targeting of metals, however, may represent a new strategy to improve brain health and function in DS.
|
Introduction
The life expectancy of Down syndrome (DS) individuals has increased significantly from 12 years in the 1940s to 60 years of age at present, and is expected to continue to rise.1 As a result of this longer average life span, it has become evident that people with DS age prematurely. They have cognitive decline earlier than the general population and typically develop Alzheimer's disease (AD) neuropathology by the age of 40.2,3
It has been proposed that changes in metals such as iron, zinc, copper and calcium contribute to the neuropathogenesis of AD.4–6 In a recent study, X-ray fluorescence microscopy of APP/PS1 mouse (a transgenic model of AD) hippocampi revealed that iron, copper and zinc levels are elevated in senile plaques when compared to the surrounding neuropil.7 In AD patients there is also a reported inverse correlation of copper and zinc with cerebrospinal fluid Aβ42; where the CSF Aβ42 was high, the CSF copper and zinc levels were low and where the CSF Aβ42 was low, the CSF copper and zinc levels were high.8 In the AD brain Cu levels are consistently decreased9 and other metals have also been reported to be altered. For example, there is a lower level of selenium in the AD temporal cortex compared with controls10 and calcium levels are reported to be elevated in the AD brain.11 Changes in metals are also evident as part of normal aging. Using a non-invasive magnetic resonance (MR) technique, for example, has shown that iron levels increase with age in the brains of adult human males (aged 21–77).12 Similarly, the levels of iron and copper increase with age in female B10BR mice.13 Furthermore, in wild type C57BL/6J mice, the level of copper in the brain is increased by forty five percent between 600 and 900 days of age compared with younger mice.14 Interestingly, the prevalence of AD in females at all ages is higher than in males which might be due to the differences in natural levels of copper in their brains.15
While there is strong evidence for the role of metals in aging and neurodegeneration, it is not known whether this also translates to conditions such as DS. Indeed, there is very little data in the literature about alterations in metal homeostasis in either the brain or other tissues from people with DS. It is therefore of relevance to also study metals in the DS brain as a potential mechanism underlying the onset/progression of disease.
It has been established that iron deficiency in the early stages of life adversely affects brain development.16 It has also been reported that children with DS are deficient in iron and have a low serum transferrin (Tf) saturation.17 However, there are no reports on DS brain iron levels in the literature. Similarly, there is no information on zinc levels in the DS brain, though, it has been shown that DS individuals have low peripheral levels of zinc.18 The levels of copper in the DS brain have similarly never been measured. The copper/zinc-containing superoxide dismutase (SOD1) enzyme, however, is over-expressed in DS, which may result in some alteration in the levels of the associated metals. By the same token, nothing is known about the level of calcium in the DS brain. However, decreased levels of calcium have been reported in both hair19 and platelets20 derived from DS patients.
Due to the presence of AD-like pathology in the DS brain, there is a strong possibility that metal dyshomeostasis exists in the DS brain as well. Therefore, we examined the levels of metals in the DS brain in which there was AD pathology present, using inductively coupled plasma mass spectrometry (ICPMS), with particular attention to iron, zinc, copper, calcium and selenium. We also examined the metalloproteomic profile using liquid chromatography-ICPMS (LC-ICPMS). Future studies should focus on characterising the specific contributions of the DS and AD phenotypes to the metalloproteomic profile in these individuals to determine whether there are synergistic interactions or whether the AD phenotype is the primary driver of any observed changes in metals and associated metalloproteins in the DS cases.
Methods
Human post-mortem brain samples
Samples from DS brains with signs of AD neuropathology (n = 17–19, 55.9 ± 7.2 years of age with average post-mortem (PMI) of 4.3 ± 1.7 hours; referred to throughout as just “DS” for simplicity) and age-matched controls with no neurological disorders (n = 6–9, 54 ± 3.07 years of age and average PMI of 41 ± 14.65 hours) were obtained from the University of California, Irvine and the Victorian Brain Bank, ethics ID 1136882, (Table 1).
Table 1 This table shows clinicopathological information for human cases. AD = Alzheimer's disease, DS = Down syndrome, C = controls
| Case no. |
Age |
Sex |
Post-mortem (h) |
Diagnosis |
Cause of death |
| 2002/13 |
46 |
M |
6.37 |
DS with AD |
Unknown |
| 2004/23 |
58 |
M |
3.42 |
DS with AD |
Stated AD |
| 2004/33 |
50 |
F |
5 |
DS with AD |
Unknown |
| 2005/7 |
54 |
M |
4.5 |
DS with AD |
Stated AD |
| 2005/30 |
57 |
F |
3 |
DS with AD |
Stated AD |
| 2006/29 |
45 |
F |
2.75 |
DS with AD |
Unknown |
| 2007/31 |
52 |
F |
4.37 |
DS with AD |
Renal failure |
| 2008/8 |
57 |
F |
5.28 |
DS with AD |
Other |
| 2008/31 |
49 |
M |
2.2 |
DS with AD |
Pneumonia |
| 2008/38 |
63 |
F |
3 |
DS with AD |
Respiratory failure |
| 2008/42 |
55 |
M |
4.5 |
DS with AD |
Pneumonia |
| 2009/8 |
70 |
M |
4.75 |
DS with AD |
Respiratory failure |
| 2009/35 |
66 |
F |
2.83 |
DS with AD |
Respiratory failure |
| 2010/31 |
62 |
F |
2.42 |
DS with AD |
Sepsis |
| 2011/1 |
45 |
F |
9.3 |
DS with AD |
Sepsis |
| 2011/30 |
66 |
M |
4.08 |
DS with AD |
Stated AD |
| 2012/33 |
56 |
M |
4.5 |
DS with AD |
Sepsis |
| 2012/36 |
56 |
F |
4.08 |
DS with AD |
Respiratory failure |
| 2013/10 |
56 |
M |
4.37 |
DS with AD |
Respiratory failure |
| 98/191 |
51 |
M |
21 |
C |
Pulmonary embolism, pancreatitis, coagulatory pathology |
| 05/975 |
51 |
M |
64 |
C |
Asthma in a man with cardiac sarcoid |
| 04/273 |
52 |
M |
33 |
C |
Haemorrhagic shock, aortic perforation |
| 07/104 |
52 |
M |
52 |
C |
Hypertrophic cardiomyopathy, ischaemic heart disease |
| 09/005 |
56 |
M |
39 |
C |
Acute myocardial infarction, coronary artery atherosclerosis |
| 08/012 |
57 |
M |
48 |
C |
Ischaemic heart disease, coronary artery atherosclerosis |
| 03/965 |
59 |
F |
30 |
C |
Asthma |
Inductively coupled plasma mass spectrometry (ICPMS)
To measure the level of metals in DS and control brains, ICPMS was conducted.21 Samples from post-mortem brains of DS and age-matched controls were weighed (∼25 mg of the hippocampus, frontal cortex and temporal cortex in triplicate) and processed as described previously.21
Liquid chromatography inductively coupled plasma mass spectrometry (LC-ICPMS)
To determine if the distribution of iron, zinc, and copper and bound to metal-containing proteins had changed in the DS brain, size exclusion chromatography coupled to ICPMS was performed on DS and control homogenates from hippocampus and frontal and temporal cortices as previously described.22–24 Briefly, brain samples were weighed and homogenized (4× w/v) in tris buffer (TB) using a pellet pestle (Sigma-Aldrich, St. Louis). The supernatant and pellet were separated by centrifugation, 10 min 13 × g. The protein content of the supernatant was estimated by Nanodrop 2000c spectrophotometer (Thermo Scientific, Waltham, MA) at A280. Soluble protein (50 μg) was loaded onto an Advanace Bio SEC column (300 Å pore size, 4.6 × 300 mm, Agilent) developed with 200 mM ammonium nitrate (pH 7.2–7.75) with Cs (20 ppb) added as internal standard. The eluent from the column was directly interfaced with nebuliser through polyether ether ketone tubing (PEEK). The metal content was monitored using an Agilent 7700x ICP-MS (Agilent Technologies) with helium used to remove polyatomic interferences. Molecular standards included ferritin (Fe; eluted at 300 seconds), ceruloplasmin (Cp; eluted at 325 seconds), and SOD1 (Cu, Zn; eluted at 400 seconds).
Statistical analysis
Data are presented as box and whisker plots and were statistically compared by two-tailed Student t-tests. All statistical analyses were performed using GraphPad Prism 6 software (GraphPad Software, La Jolla, CA, USA).
Results
Iron, zinc, copper, calcium and selenium levels are altered in the DS brain
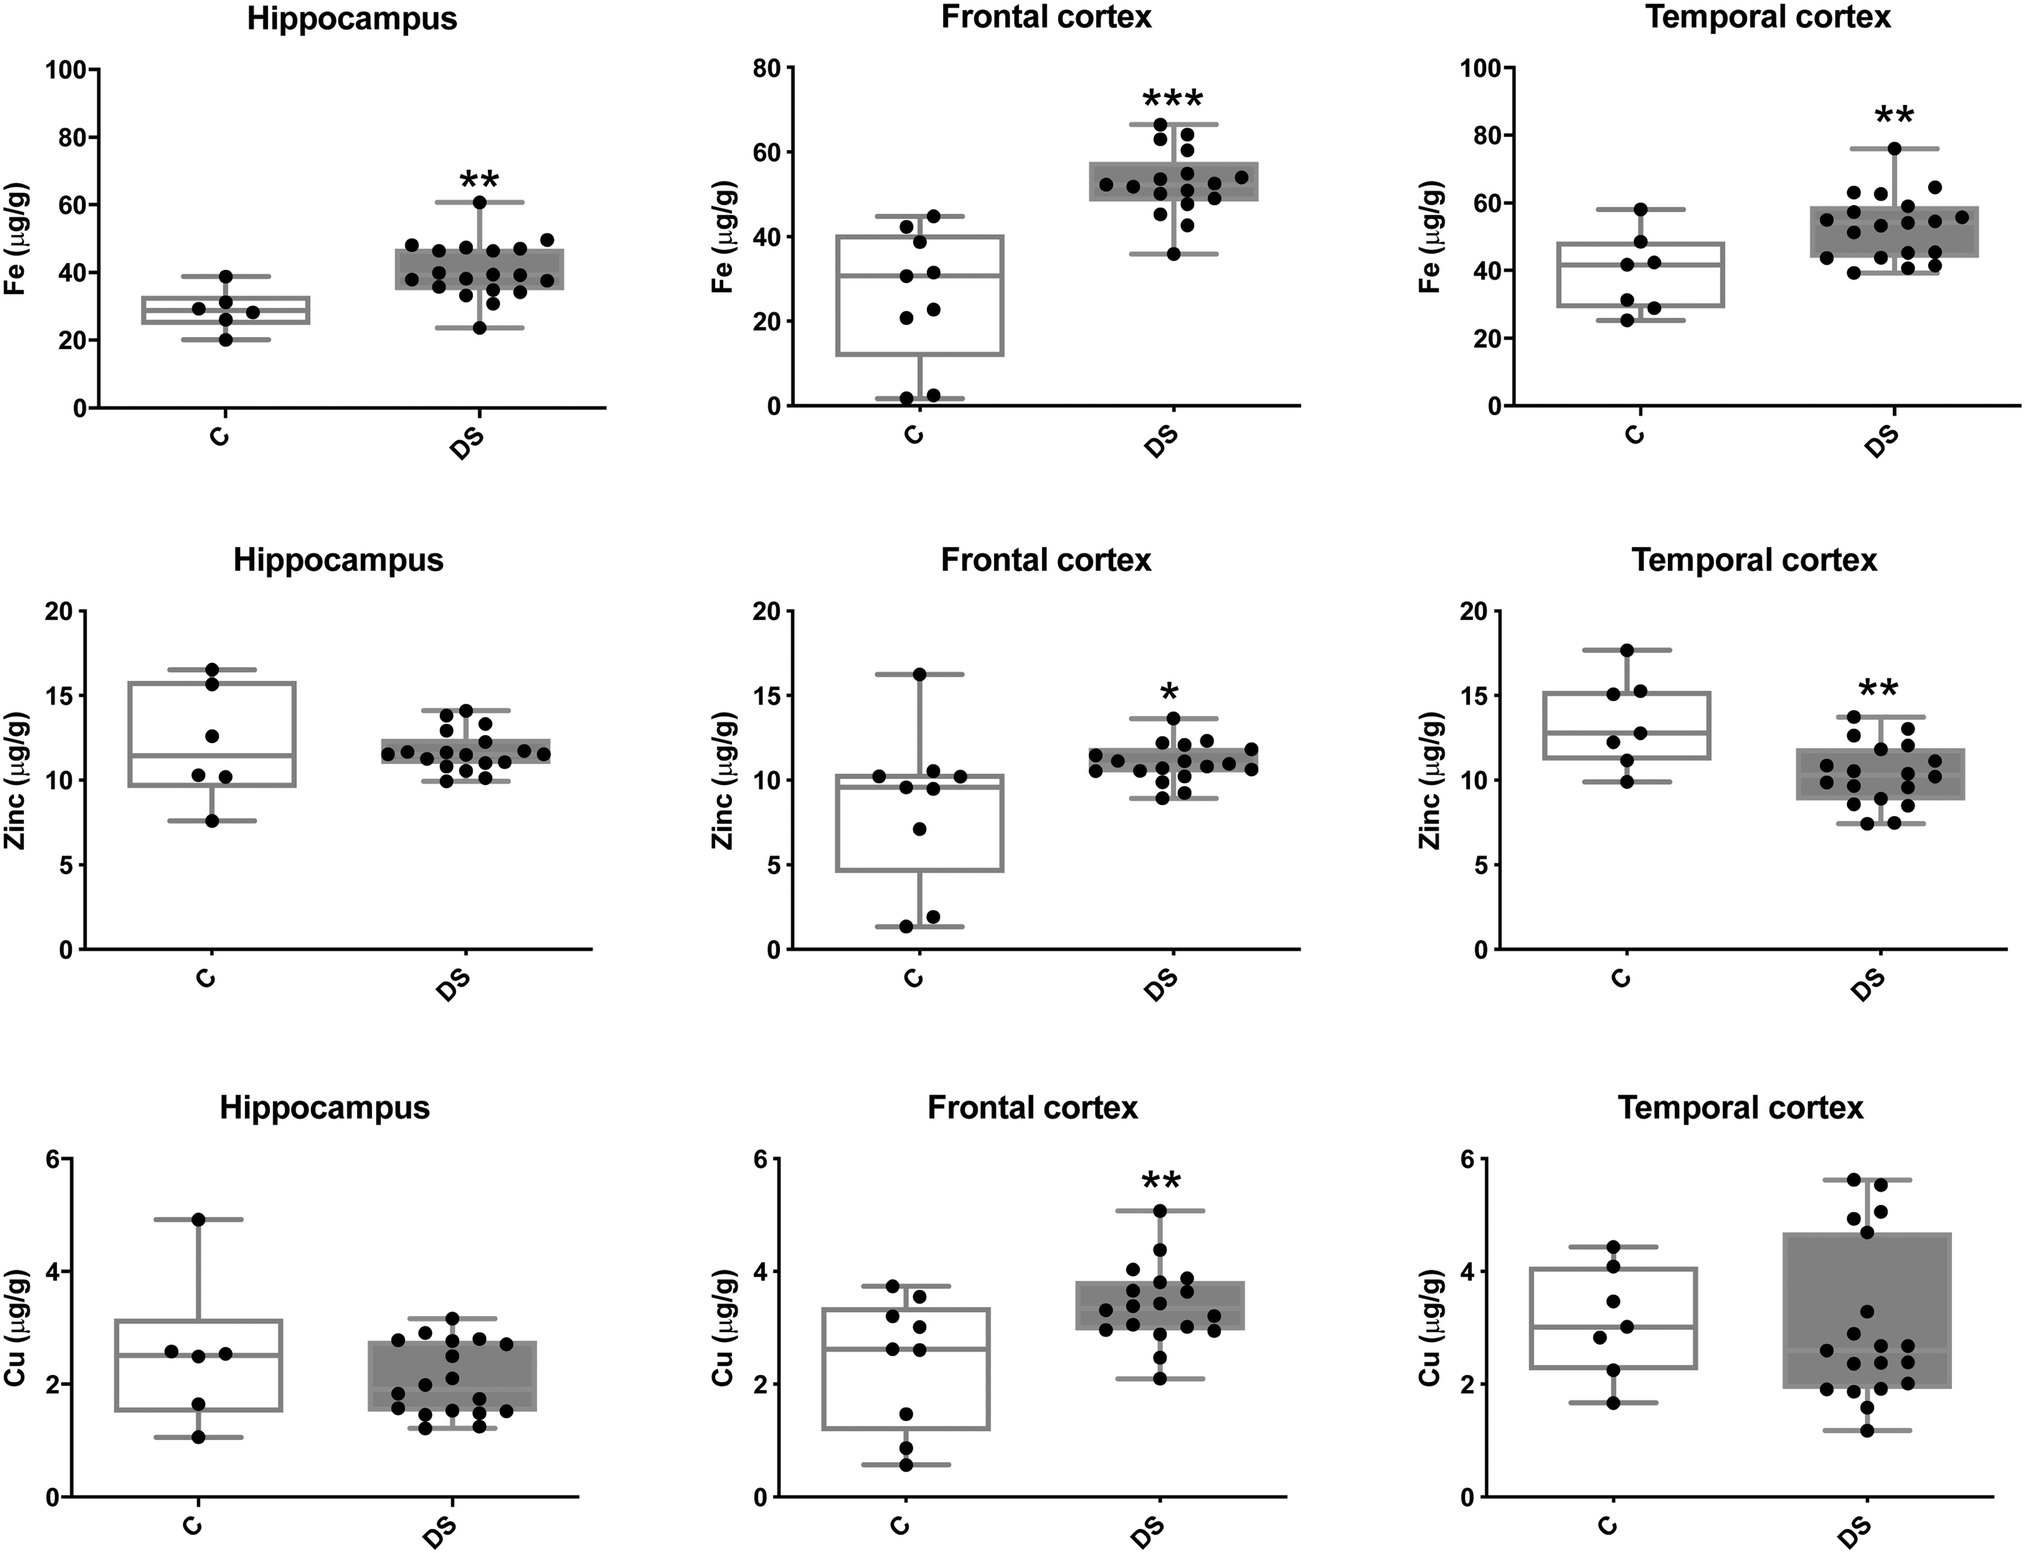
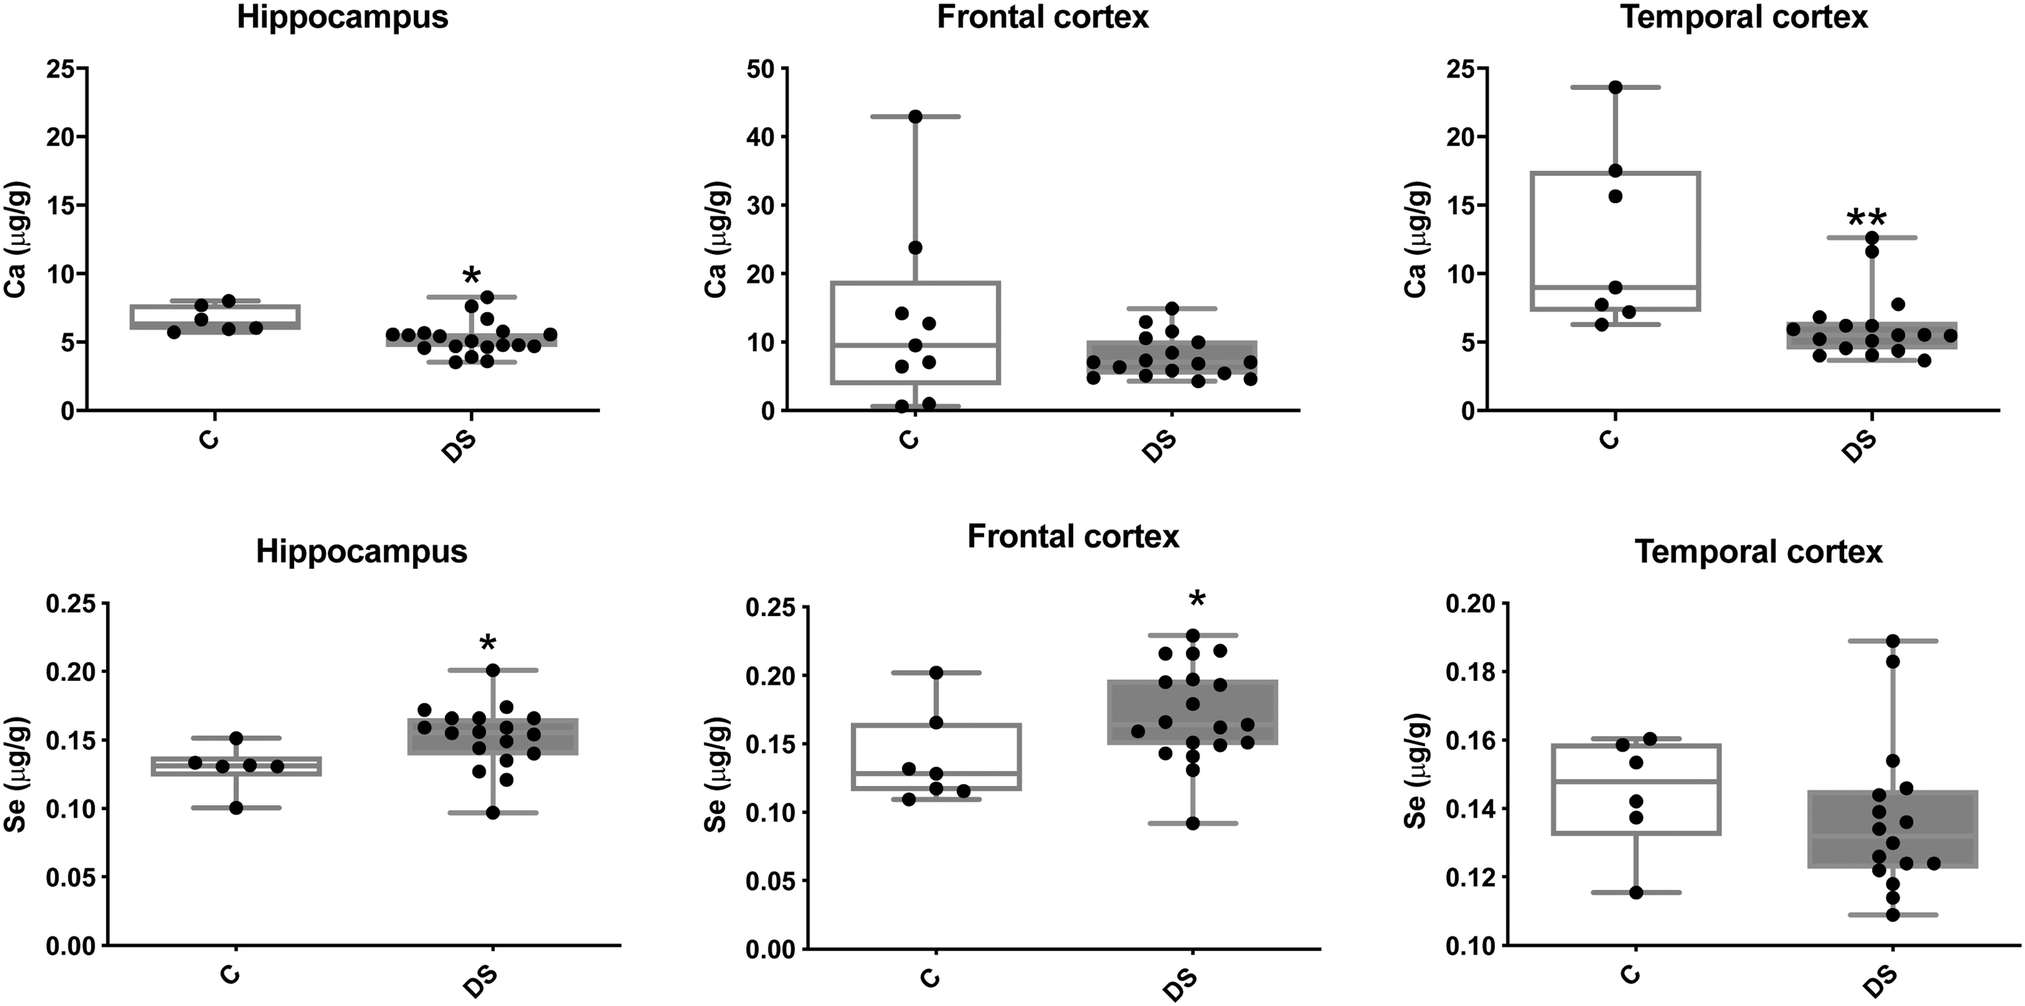
Our ICPMS results revealed that iron levels in the hippocampus and both the frontal and temporal cortices of post-mortem DS brains were significantly higher than the controls (40% increase and p = 0.0049 for hippocampus; 100.8% increase and p = 0.0002 for frontal cortex; and 34.2% increase and p = 0.006 for temporal cortex, Fig. 1). There were no differences in zinc levels between DS and controls in the hippocampus. However, the level of zinc was significantly higher in the DS frontal cortex, and was significantly lower in the DS temporal cortex compared with controls (29.3% increase and p = 0.0361 for frontal cortex, and 23% decrease and p = 0.0029 for temporal cortex, Fig. 1). There were no differences in copper levels between DS and controls in the hippocampus or temporal cortex, but the level of copper was higher in the DS frontal cortex compared with the controls (29.4% increase and p = 0.01, Fig. 1). Calcium levels were significantly lower in the hippocampus and temporal cortex of DS patients (20.8% decrease and p = 0.0188 for hippocampus; and 50.5% decrease and p = 0.0023 for temporal cortex) while no difference was evident in the frontal cortex between the groups (Fig. 2). Selenium levels were higher in the hippocampus and frontal cortex of DS compared with the controls (15.4% increase and p = 0.0454 for hippocampus; and 21.4% increase and p = 0.0391 for frontal cortex). However, there was no difference in selenium levels between DS and controls in the temporal cortex (Fig. 2).
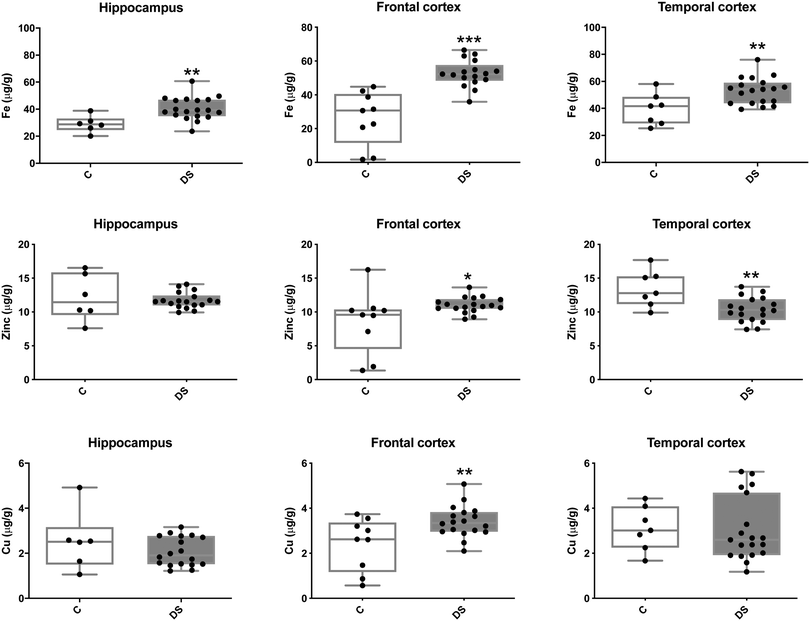 |
| | Fig. 1 Iron, zinc and copper levels in select regions of the DS brain, box and whisker plots (median, minimum and maximum values) show the level of each metal measured by ICPMS in the hippocampus, frontal and temporal cortex of post-mortem brains of Down syndrome (n = 17–19) compared with age-matched controls (C) (n = 6–9). The levels of iron were higher in all the brain regions that were examined: p = 0.0049 for the hippocampus; p = 0.0002 for the frontal cortex and p = 0.0064 for the temporal cortex. For zinc, p = 0.0361 for the frontal cortex and p = 0.0436 for the temporal cortex. For copper, p = 0.01 for the frontal cortex. A two-tailed t-test was used for statistical analysis. C = control. DS = Down syndrome. | |
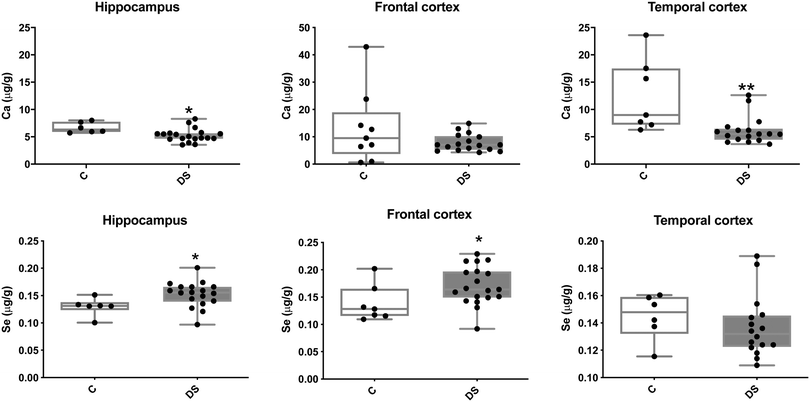 |
| | Fig. 2 Calcium and selenium levels in select brain regions of the DS brain, box and whisker plots (median, minimum and maximum values) show the levels of calcium and selenium measured by ICPMS in the hippocampus, frontal and temporal cortex of post-mortem brains of DS (n = 16–19) compared with age-matched C (n = 6–9). For calcium, p = 0.018 for the hippocampus and p = 0.0064 for the temporal cortex. For selenium, p = 0.0391 for the hippocampus and p = 0.0454 for the frontal cortex. A two-tailed t-test was used for statistical analysis. C = control. DS = Down syndrome. | |
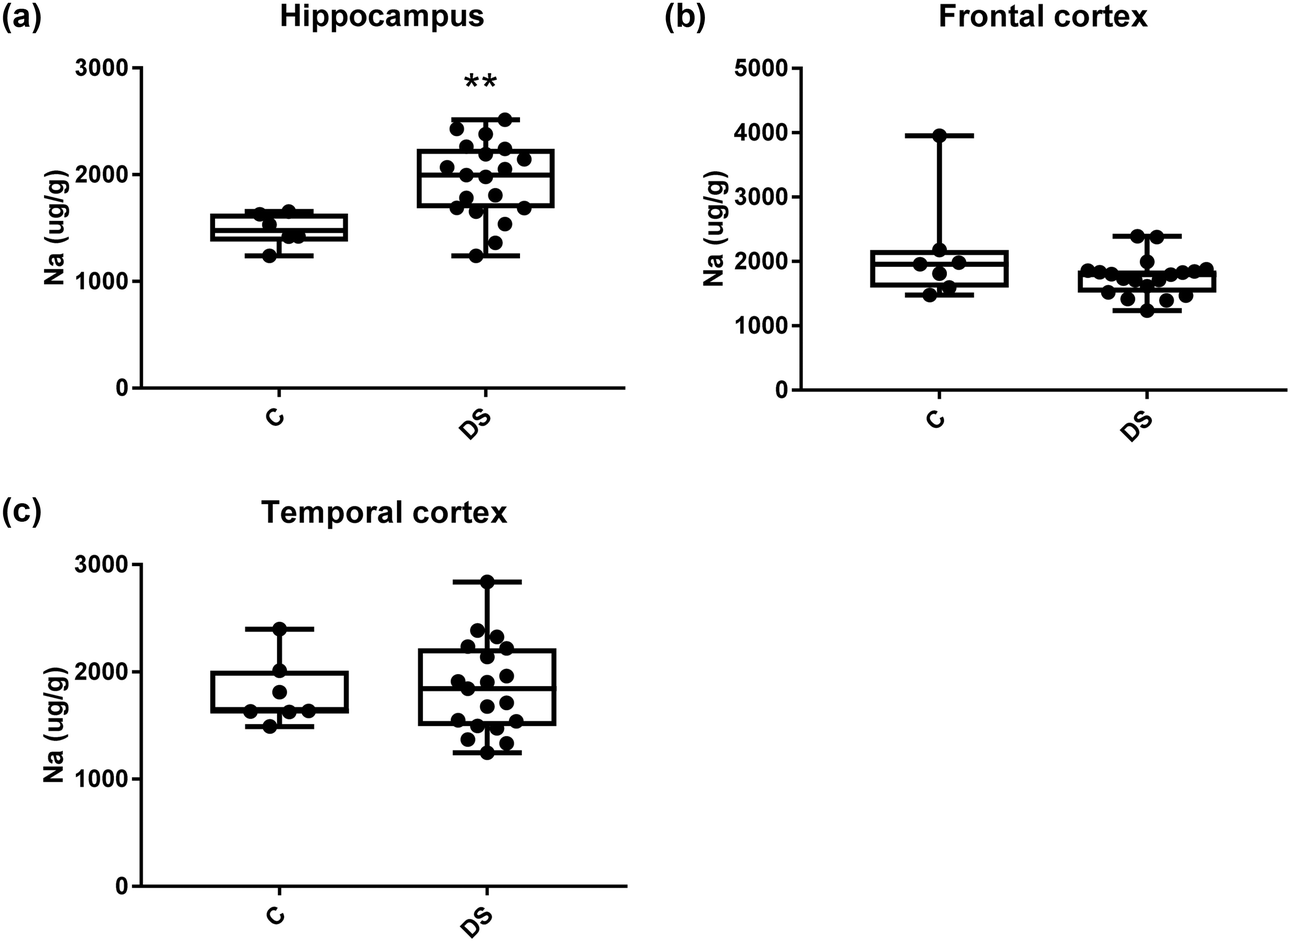
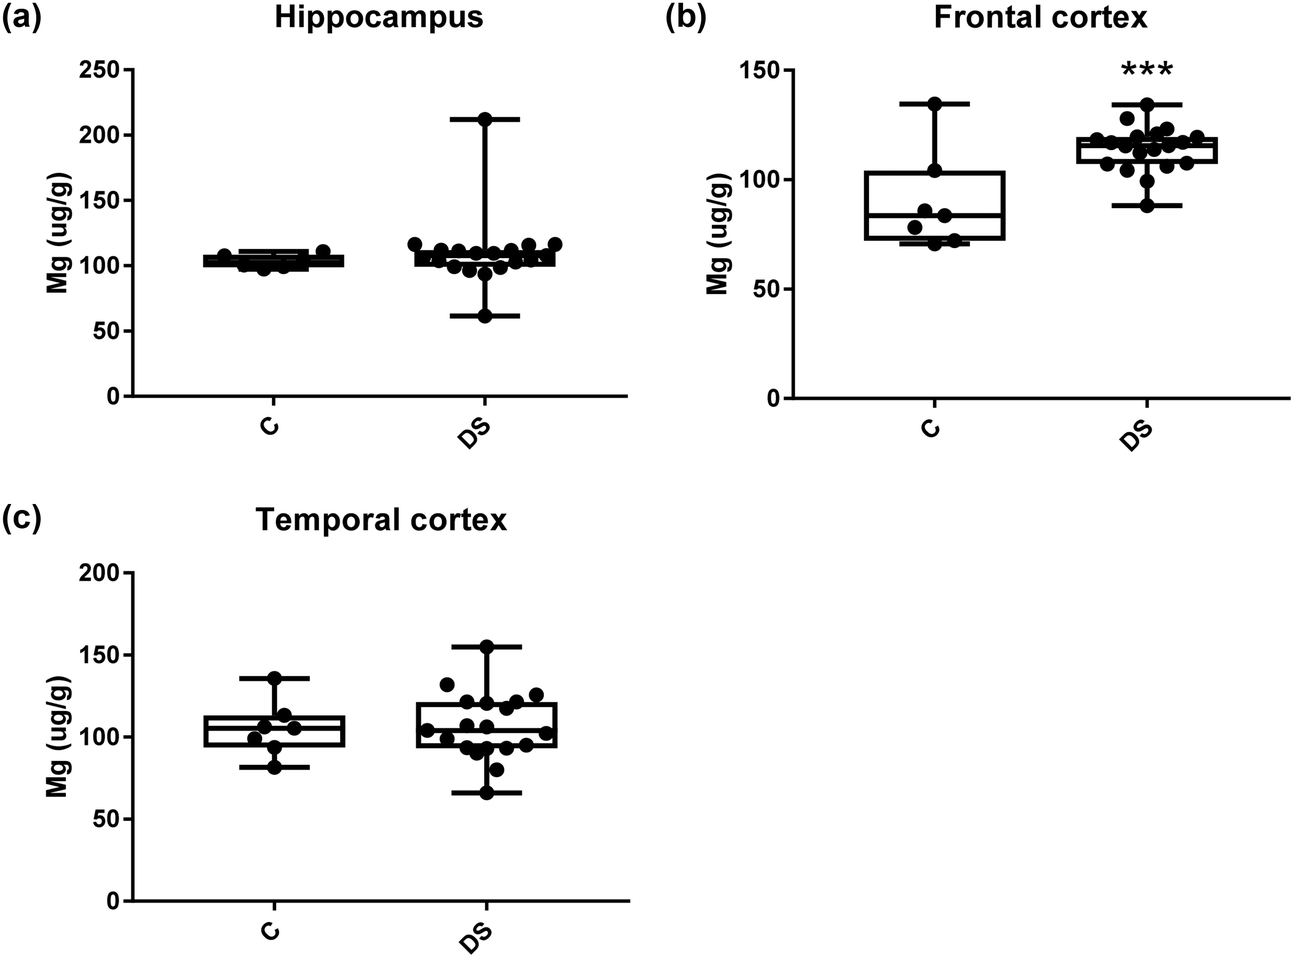
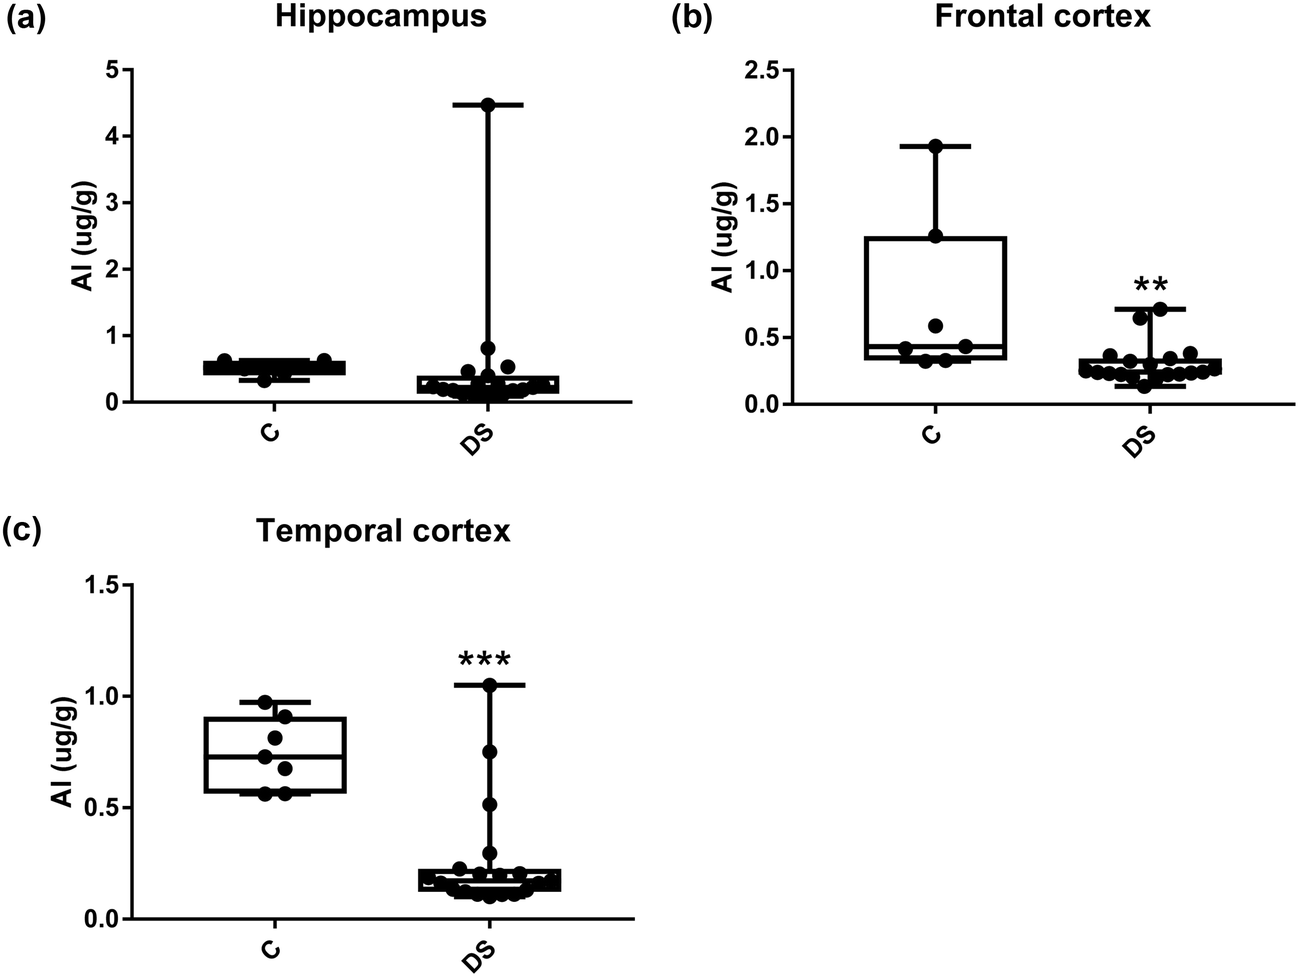
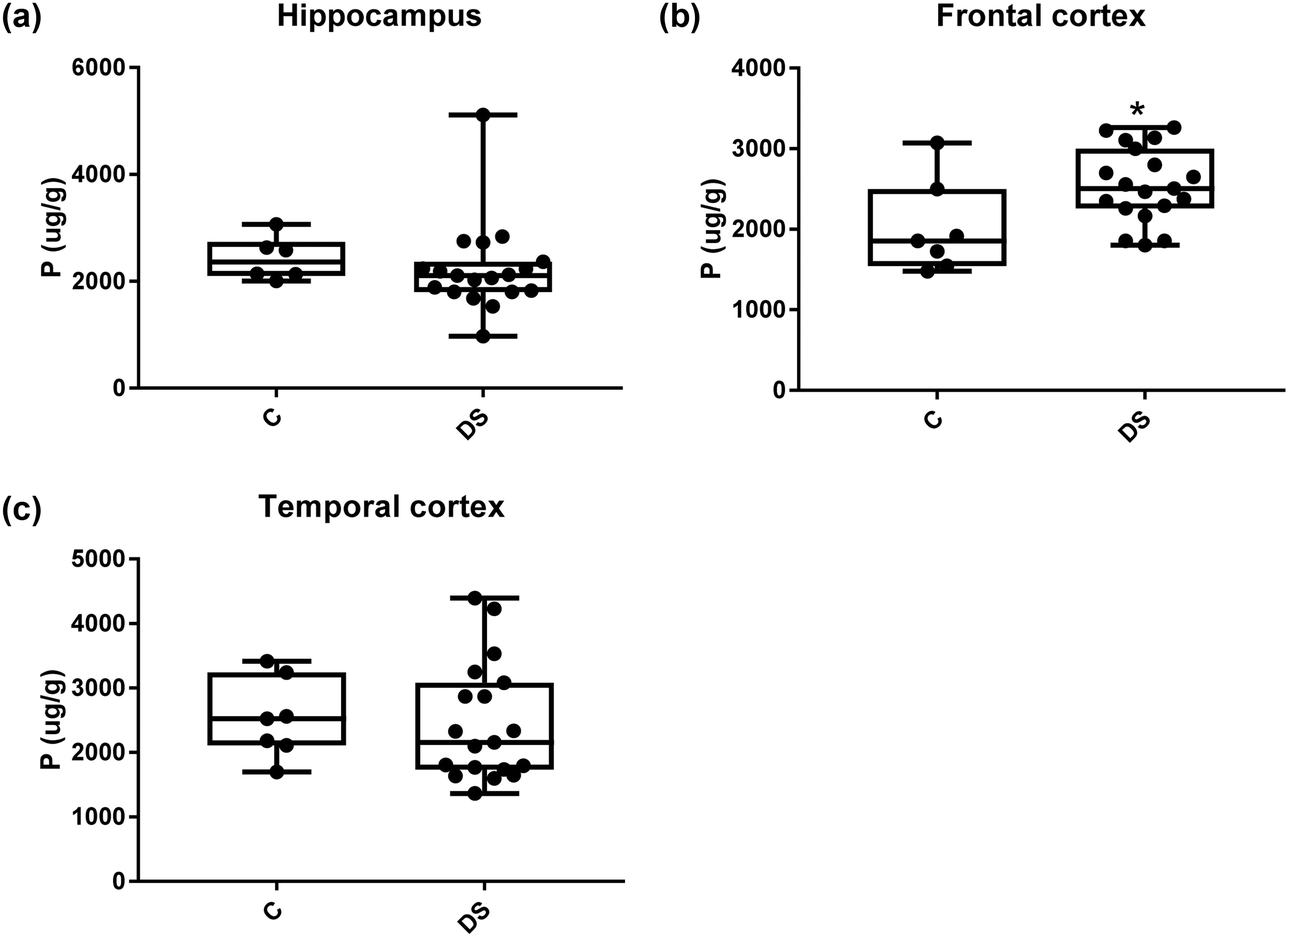
All other ICPMS metal data is shown in Table 2 (refer to the supplementary material for the figures). The data demonstrate the following. As compared to control brains, there is an increase (31.4%; p = 0.006) in the level of sodium in the hippocampus; an increase in the level of magnesium in the frontal cortex (27%, p < 0.001); decrease in the levels of aluminium in the frontal (60%; p = 0.005) and temporal (64.9%; p ≤ 0.001) cortices; an increase in the level of titanium in the frontal cortex (52.9%, p < 0.001); decrease in the levels of chromium in the hippocampus (77%; p = 0.025), frontal (78.8%, p < 0.001) and temporal (79.5%; p = 0.04) cortices; a decrease in the level of nickel (80.8%, p < 0.001) in the temporal cortex; decrease in the levels of rubidium in the hippocampus (62.8%; p < 0.001), frontal (53.6%; p < 0.001) and temporal (60.9%; p < 0.001) cortices; increase in the levels of ruthenium in the hippocampus (223%; p < 0.001), frontal (34.9%; p = 0.022) and temporal (69.5%; p < 0.001) cortices; an increase in the level of phosphorous in the frontal cortex (26.5%; p = 0.02).
Table 2 Levels of metals in different regions of the brain. This table shows the level of metals measured by ICPMS in the post-mortem brains (μg g−1) of people with Down syndrome (DS) and controls (C), % of change if any and the significance of the results (NS = not significant)
| Metalsa |
Hippocampus |
Frontal cortex |
Temporal cortex |
|
Note, this table also includes the semi-metallic element boron, and also the non-metallic element phosphorous.
|
| Boron (μg g−1) |
0.099 ± 0.035 C |
0.148 ± 0.035 C |
0.111 ± 0.030 C |
| 0.117 ± 0.015 DS |
0.118 ± 0.013 DS |
0.115 ± 0.013 DS |
| NS |
NS |
NS |
| Sodium (μg g−1) |
1482 ± 63.23 C |
2136 ± 316 C |
1801 ± 118 C |
| 1948 ± 82.6 DS |
1757 ± 67.74 DS |
1850 ± 97.47 DS |
| 31.4% increase p = 0.006** |
NS |
NS |
| Magnesium (μg g−1) |
103.4 ± 2.144 C |
89.87 ± 8.549 C |
105 ± 6.42 C |
| 110 ± 6.334 DS |
114.1 ± 2.395 DS |
106.5 ± 4.672 DS |
| N |
27% increase p < 0.001*** |
NS |
| Aluminium (μg g−1) |
0.507 ± 0.047 C |
0.754 ± 0.231 C |
0.746 ± 0.061 C |
| 0.484 ± 0.225 DS |
0.301 ± 0.034 DS |
0.260 ± 0.057 DS |
| NS |
60% decrease p = 0.005** |
64.9% decrease p < 0.001*** |
| Potassium (μg g−1) |
2428 ± 165 C |
2012 ± 217.3 C |
2532 ± 233 C |
| 2225 ± 189.7 DS |
2545 ± 105.6 DS |
2446 ± 207.6 DS |
| NS |
NS |
NS |
| Titanium (μg g−1) |
2383 ± 132.1 C |
2080 ± 162.1 C |
2539 ± 188.1 C |
| 1929 ± 161.1 DS |
2191 ± 81.38 DS |
2272 ± 124.6 DS |
| NS |
52.9% increase p < 0.001*** |
NS |
| Chromium (μg g−1) |
0.196 ± 0.116 C |
0.208 ± 0.065 C |
0.189 ± 0.116 C |
| 0.045 ± 0.005 DS |
0.045 ± 0.008 DS |
0.039 ± 0.008 DS |
| 77% decrease p = 0.025 |
78.8% increase p < 0.001 |
79.5% increase p = 0.040 |
| Manganese (μg g−1) |
0.249 ± 0.030 C |
0.1799 ± 0.019 C |
0.179 ± 0.012 C |
| 0.227 ± 0.013 DS |
0.175 ± 0.006 DS |
0.190 ± 0.011 DS |
| NS |
NS |
NS |
| Cobalt (μg g−1) |
0.0026 ± 0.0005 C |
0.005 ± 0.002 C |
0.0032 ± 0.0007C |
| 0.0035 ± 0.0002 DS |
0.004 ± 0.0002 DS |
0.003 ± 0.0002 DS |
| NS |
NS |
NS |
| Nickle (μg g−1) |
0.024 ± 0.006 C |
0.032 ± 0.007 C |
0.026 ± 0.005 C |
| 0.015 ± 0.006 DS |
0.032 ± 0.008 DS |
0.005 ± 0.0008 DS |
| NS |
NS |
80.8% decrease p < 0.001*** |
| Rubidium (μg g−1) |
2.961 ± 0.305 C |
2.24 ± 0.309 C |
2.528 ± 0.231 C |
| 1.101 ± 0.132 DS |
1.037 ± 0.129 DS |
0.999 ± 0.116 DS |
| 62.8% decrease p < 0.001*** |
53.6% decrease p < 0.001*** |
60.9% decrease p < 0.001*** |
| Strontium (μg g−1) |
0.019 ± 0.003 C |
0.048 ± 0.014 C |
0.042 ± 0.009 C |
| 0.019 ± 0.001 DS |
0.079 ± 0.029 DS |
0.046 ± 0.008 DS |
| NS |
NS |
NS |
| Ruthenium (μg g−1) |
0.00044 ± 4.985 × 10⁻⁵ C |
0.001 ± 0.0001 C |
0.0005 ± 4.536 × 10⁻⁵ C |
| 0.0014 ± 7.383 × 10⁻⁵ DS |
0.001 ± 6.527 × 10⁻⁵ DS |
0.0008 ± 2.998 × 10⁻⁵ DS |
| 223% increase p < 0.001*** |
34.9% increase p = 0.022* |
69.5% increase p < 0.001*** |
| Cadmium (μg g−1) |
0.008 ± 0.0013 C |
0.008 ± 0.001 C |
0.008526 ± 0.001 C |
| 0.0099 ± 0.001 DS |
0.011 ± 0.001 DS |
0.01045 ± 0.001 DS |
| NS |
NS |
NS |
| Phosphorous (μg g−1) |
2428 ± 165 C |
2012 ± 217.3 C |
2532 ± 233 C |
| 2225 ± 189.7 DS |
2545 ± 105.6 DS |
2446 ± 207.6 DS |
| NS |
26.5% increase p = 0.022* |
NS |
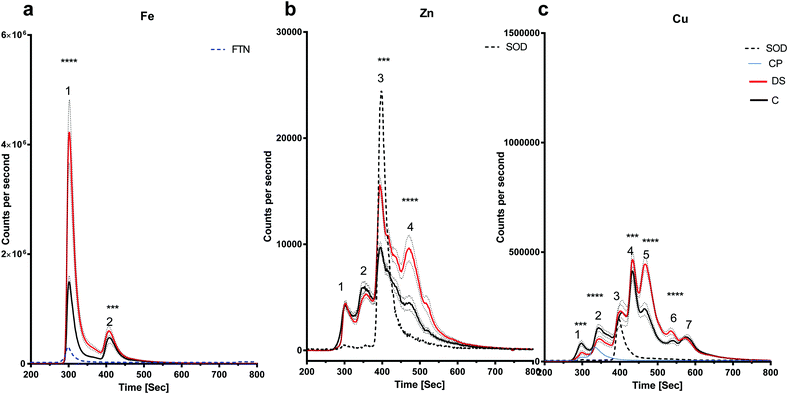
The zinc and copper content of specific proteins is altered in the DS hippocampus
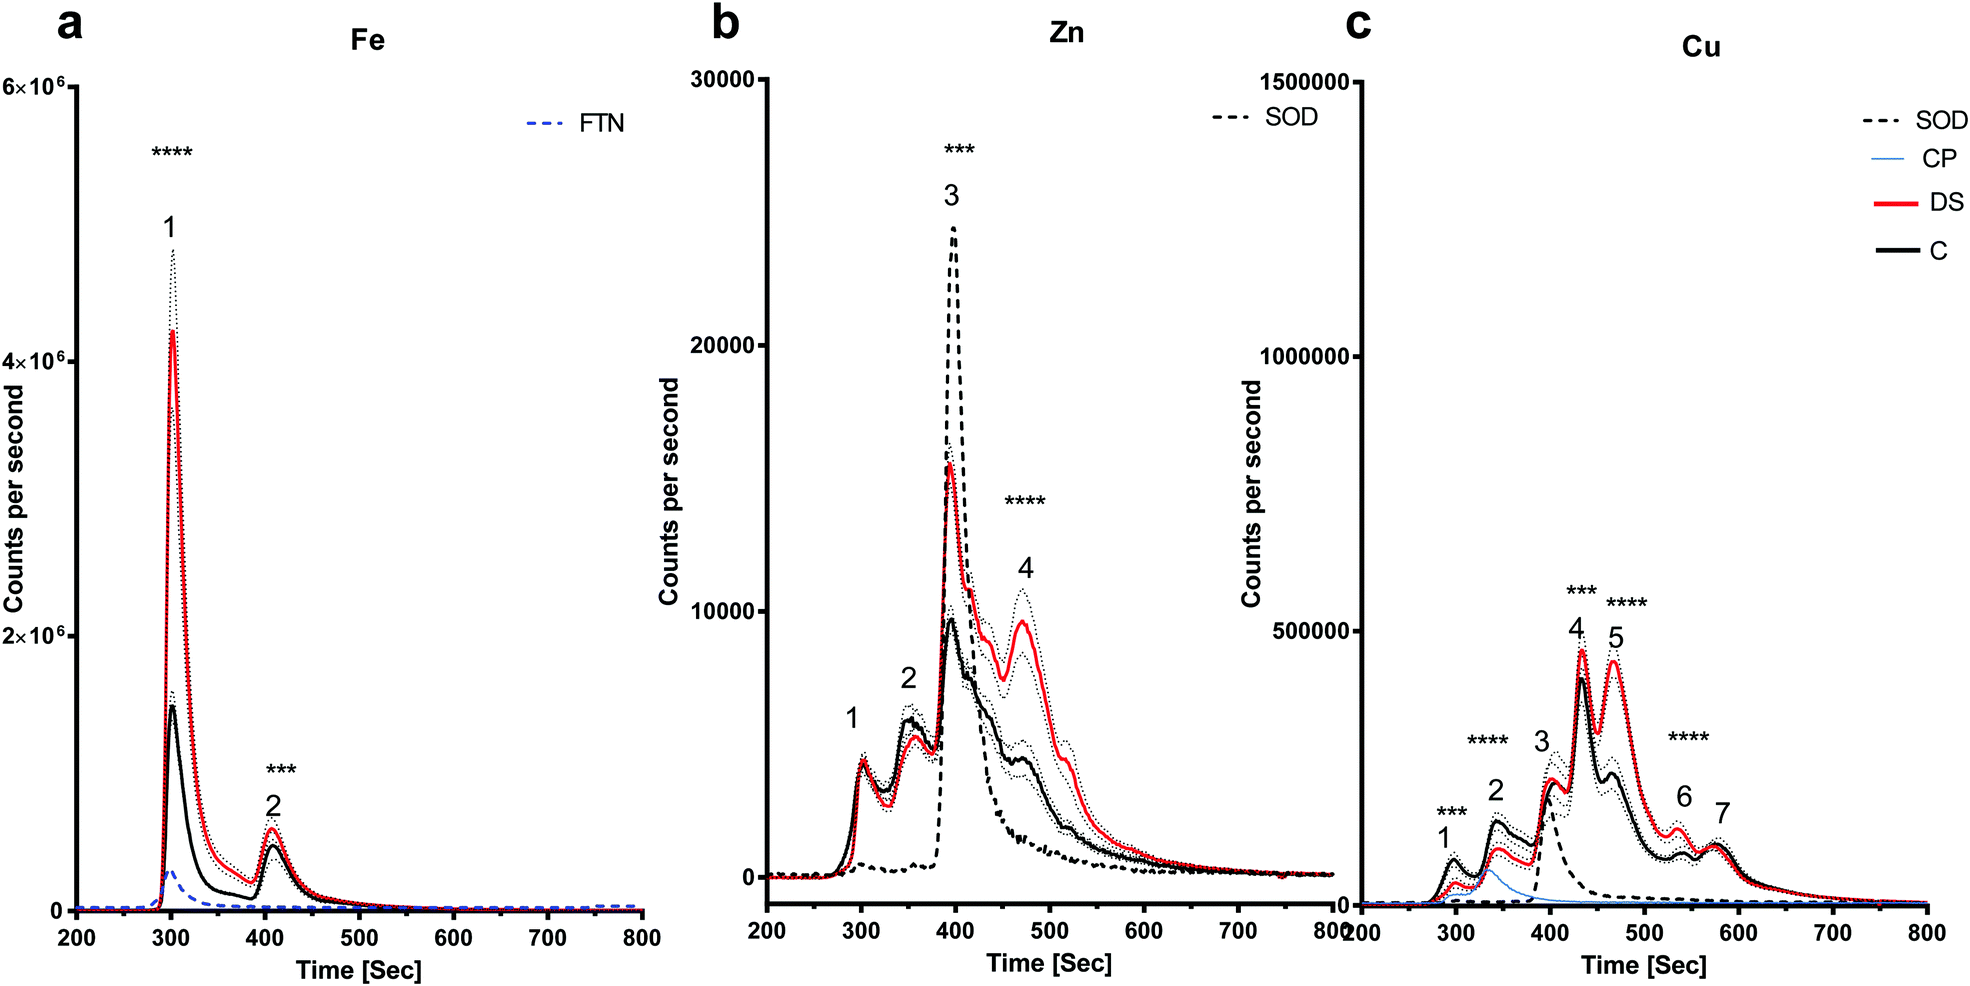
LC-ICPMS was employed to profile the abundance of soluble metalloproteins in the tissue. Our results showed that there was no change in the level of iron bound to proteins in the DS hippocampus compared with controls as the peaks observed were similar in size (Fig. 3a). For zinc, at least five proteins were eluted from the hippocampus samples (Fig. 3b), although it should be noted that some of the peaks were broad and therefore may indicate the elution of more than one protein. SOD1 was used as a standard zinc-binding protein which eluted at 400 seconds, coinciding with the third peak on the zinc chromatogram, and there was no difference between DS and controls in the hippocampus. However, some differences were observed between other protein peaks. For example, the second peak was significantly higher in the DS hippocampus (p < 0.0001) and peak five was significantly lower in the DS hippocampus compared with controls (p < 0.001). We used SOD1 and Cp as the standards for copper-binding proteins. In total, there were seven peaks observed on the copper chromatogram in the hippocampus; peaks one (p < 0.0001), two (p < 0.0001) and five (p < 0.5) were significantly higher in DS compared with controls (Fig. 3c) suggesting that the amount of copper bound to the proteins or expression of the protein were significantly different in DS compared with the controls.
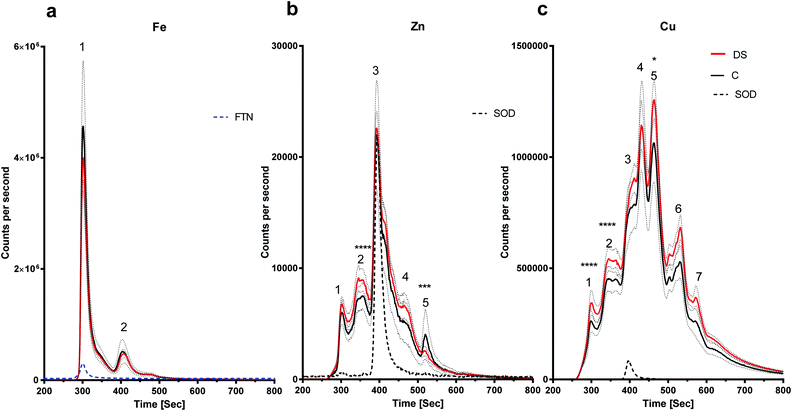 |
| | Fig. 3 Metalloproteomic profile of DS and control hippocampi, Hippocampal homogenates from post-mortem DS brains (n = 17) and age-matched control (C) brains (n = 6) were prepared and the levels of metals bound to proteins associated with metals were measured by LC-ICPMS. The dotted lines represent the standards including SOD1 (32 kDa), ceruloplasmin (151 kDa) and ferritin (450 kDa). (a) Iron chromatogram from DS (red line) and age-matched C (black line) showing no difference for peak 1 (ferritin; blue dotted line) and peak 2 in DS compared with the control in the hippocampal homogenates, (b) zinc chromatogram showing 5 peaks corresponding to 5 or more zinc associated proteins. Peaks 1, 3 and 4 were elevated for DS, no difference for peak 2 (SOD1; black dotted line), and peak 5 was elevated for DS, (c) copper chromatogram shows 7 peaks: peaks 1, 2, 3 (SOD1; black dotted line), 5, 6 and 7 were elevated for DS and no change for peak 4. ***p < 0.001, ****p < 0.0001. | |
There is an alteration in the level of iron, zinc and copper bound to metal-associated proteins in the frontal cortex of DS
The amount of iron bound to the protein(s) that eluted with the ferritin standard was elevated in the DS frontal cortex compared with the controls (Fig. 4a, peak 1, p < 0.0001). The chromatogram for the zinc-binding proteins exhibited five peaks in the frontal cortex (Fig. 4b). The peak corresponding with the SOD1 was significantly higher in the DS frontal cortex compared with controls (Fig. 4b, p < 0.0001). The amount of zinc present in peak two was significantly lower in DS (p < 0.0001), whereas it was significantly higher in DS for peaks four (p < 0.0001) and five (p < 0.0001). These data suggest that there are differences in the zinc metalloproteome in the DS frontal cortex when compared with control samples. Finally, seven protein peaks were evident on the copper chromatogram. Peaks three (p < 0.0001), four (p < 0.0001), five (p < 0.0001), six (p < 0.0001) and seven (p < 0.0001) were significantly increased in size in DS compared with the controls (Fig. 4c).
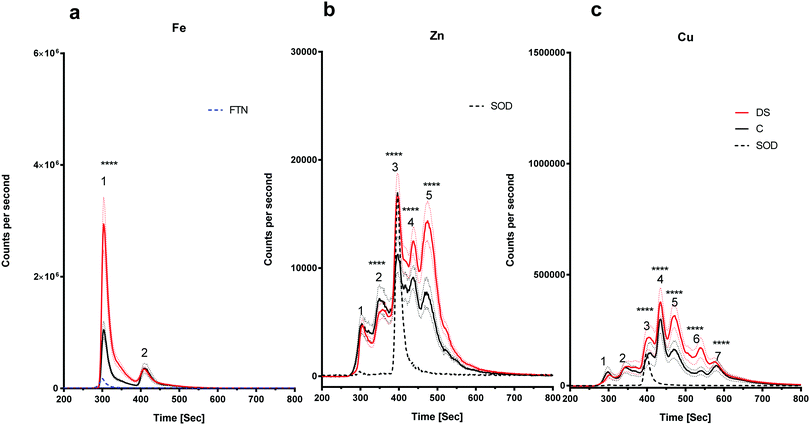 |
| | Fig. 4 Metalloproteomic profile of DS and control frontal cortex, Homogenates from post-mortem brains of DS (n = 17) and age-matched C (n = 7) were prepared and level of metals bound to proteins associated with metals were measured by LC-ICPMS. Ferritin and SOD1 standards were run and can be observed in peaks 1 and 3, respectively, (a) iron chromatogram from DS (red line) and age-matched C (black line), peak 1 was higher in DS and there was no change for peak 2 in the DS compared with the control in the frontal cortex homogenates, (b) zinc chromatogram shows 5 peaks: no change for peak 1, peak 2 was lower in DS, peaks 3, 4 and 5 were elevated in DS, (c) copper chromatogram shows 7 peaks: no differences for peaks 1 and 2, peaks 3, 4, 5, 6 and 7 were elevated in DS. ***p < 0.001, ****p < 0.0001. | |
There is an alteration in the level of iron, zinc and copper bound to metal-associated proteins in the temporal cortex of DS
The amount of iron bound to protein(s) that eluted with the ferritin standard (Fig. 5a, peak 1) were significantly elevated in the DS temporal cortex compared with the controls (Fig. 5a, p < 0.0001). The chromatogram also showed a second peak eluting at around 400 seconds with a higher level of this Fe protein (Fig. 5a, p < 0.001). The chromatogram for the zinc-binding proteins exhibited four peaks in the temporal cortex. Peak three (p < 0.01), corresponding to SOD1 and peak four (p < 0.001) were both significantly elevated in DS compared with the controls (Fig. 5b). The copper chromatogram displayed seven protein peaks. Peaks one (p < 0.01) and two (p < 0.001) were significantly lower, and peaks four (p < 0.01), five (p < 0.001) and six (p < 0.001) were significantly higher in the DS temporal cortex compared with the control (Fig. 5c).
 |
| | Fig. 5 Metalloproteomic profile of DS and control temporal cortex, Homogenates from post-mortem DS (n = 19) and age-matched control temporal C (n= 9) (a) iron chromatogram from DS (red line) and age-matched C (black line) temporal cortex homogenates showing elevated levels of iron bound to proteins eluted with ferritin (peak 1) and elevated peak 2 in DS temporal cortex, (b) zinc chromatogram shows elevated zinc in proteins where SOD1 eluted in the DS temporal cortex (peak 3), (c) copper chromatogram shows 7 peaks: peaks 1 and 2 (where CP standard eluted) was lower in DS, no change for peaks 3 and 7, peaks 4, 5 and 6 were elevated in DS. ***p < 0.001, ****p < 0.0001. | |
Discussion
Total metal levels in the DS brain
We report here for the first time that metal levels are differentially altered in the DS brain compared with age matched controls. It is of note that the neuropathological hallmarks of AD were present in all the DS individuals used in this study and all had been diagnosed with AD before death. Specifically, in the DS brain compared with age-matched non-DS controls we demonstrate that, iron is elevated in the hippocampus and frontal and temporal cortices; zinc is elevated in the frontal cortex and reduced in the temporal cortex; copper is elevated in the frontal cortex; calcium is reduced in the hippocampus and temporal cortex; and selenium is higher in the hippocampus and frontal cortex. These data are consistent with other reports of altered metal status in neurodegenerative diseases such as AD, and are perhaps not surprising given that AD is associated with DS. Differentiating the individual contributions of both AD and DS to the changes we have observed will be an important consideration for future studies.
Abnormalities in brain iron metabolism have been reported for neurodegenerative disorders, including Alzheimer's disease.25 Studies have demonstrated that iron is increased in the AD frontal lobe, temporal cortex, hippocampus and amygdala.26 Of relevance to this study is that iron plays a role in the translational regulation of the amyloid precursor protein (APP), a chromosome 21 gene, from which the putative toxic Aβ peptide found in AD plaques is derived.27 Translational regulation of APP occurs via a type II iron-responsive element located in the 5′ untranslated region of the APP transcript.28 Upon elevation of iron, APP translation is increased, hence in the DS brain, elevated iron could increase APP protein production. This, together with having an extra copy of the APP gene, may exacerbate the formation of extracellular Aß plaques in DS. On the other hand, an iron transporter responsible for carrying iron into cells, transferrin (Tf),29 has been shown to be dysregulated in AD,25 resulting in an increased level of Tf in the AD frontal cortex. It has similarly been reported that there is an increase in Tf in the DS brain.30 It is therefore possible that an increase in Tf elevates iron levels in neurons and this excess iron causes premature neurodegeneration via the Fenton reaction31,32 or ferroptosis, an iron-dependent non-apoptotic form of cell death.33 Whether any of these possible explanations is the cause of the iron accumulation we observed in our DS brain samples remains to be determined.
Zinc levels in the DS brain varied depending on the region of the brain examined; levels in the hippocampus were unchanged compared with controls while the abundance of zinc was lower in the temporal cortex and higher in the frontal cortex. Although, this is the first study reporting levels of zinc in the DS brain, low levels of zinc in the DS periphery and hair have been reported previously.34 Zinc has been reported to inhibit glutamate release via activation of pre-synaptic ATP-sensitive potassium channels (KATP),35 and it has been shown that a low level of zinc in the rat brain induces glutamate excitotoxicity.36 Of relevance to this study is that glutamate excitotoxicity elevates iron and ferritin-iron levels.37 It is interesting to speculate that, in the DS temporal cortex at least, a low level of zinc may induce glutamate excitotoxicity, leading to an increase in both iron levels and ferritin-bound iron, which are both observed in the DS temporal cortex.
Our finding of higher levels of copper in the DS frontal cortex compared to controls, is in contrast to findings in AD where lower levels of copper were found in the frontal cortex.9,38 The higher levels of Cu in the frontal cortex may relate to the increased expression of SOD, which is on chromosome 21. Consistent with this, the SEC-ICP-MS analysis shows that there is a significant increase in the Cu level in the peak containing SOD, and furthermore, there is a near global increase in soluble Cu containing proteins as seen by peaks 3–6 (Fig. 4).
Our results also revealed that the rubidium levels were decreased in the hippocampus, frontal and temporal cortices of the DS brain which is consistent with the findings in the AD brain.39
Another interesting finding was the decreased level of calcium in the DS hippocampus and temporal cortex, which is consistent with that shown in DS hair.19 Calcium is critical for the normal conduction of electrical currents along nerves, contributes to the electrophysiological properties of the neurons by activating calcium-sensitive potassium channels to induce excitation of neurons, and acts a second messenger to activate calcium-dependent signalling pathways in the cell.40 Pertinent to this study, low levels of calcium in the rat hippocampus block synaptic activity and increase spontaneous neuronal excitability.41 Additionally, low calcium in rat hippocampal slices generates non-synaptic epileptic activity.42 This is interesting, as seizures are common in DS. Indeed, in humans with DiGeorge syndrome, a syndrome caused by chromosome 22q11 deletion, low calcium-induced seizures are known to be the first sign of the syndrome.43 Hence, similar to DiGeorge syndrome, it is possible that seizures in the DS population are the result of low brain calcium leading to disruption of normal conduction of electrical currents along nerves. Furthermore, there are genes on human chromosome 21, such as RCAN1 and S100β, that modulate calcium and which are over-expressed in the DS population. RCAN1 is a negative regulator of calcineurin and calcineurin maintains calcium homeostasis by regulating calcium pumps and exchangers.44 Hence, an extra copy of RCAN1 could alter calcium homeostasis in the DS brain by influencing the activity of calcineurin, and consequently, the activity of calcium pumps and exchangers could change the calcium levels in the DS brain.
Finally, our data also revealed that selenium, an antioxidant essential for the activity of certain anti-oxidant enzymes such as glutathione,45 was more abundant in the DS hippocampus and frontal cortex compared with the controls. Selenium has been shown to provide neuroprotection to the rat brain after induction of traumatic brain injury46 and to also reduce Aβ plaque deposition in a transgenic AD mouse model (double knock-in of APP and Presnilin-1).47 It has also recently been implicated in the regulation of neuronal cell death via ferroptosis.48 Therefore, it is possible that a higher level of selenium in the DS hippocampus and frontal cortex affords some protection against the harmful effects resulting from other metal (such as iron) imbalances in the brain that may promote oxidative stress.
The DS brain metalloproteome
In general terms, the conclusion we can draw from our analysis is that compared with controls, the metalloproteome in the DS brain is altered (and again, consideration must be given to whether these changes are driven by the superimposed effect of AD in our DS cohort). Since we have not identified the majority of metal-binding proteins eluted, we can only speculate about what the differences may mean for the proteins we are able to identify with some confidence, i.e. those that elute with known standards. For example, peak one, corresponding to ferritin in the iron chromatograms shown in Fig. 4a and 5a was larger in both frontal and temporal cortices in DS. Therefore, more iron is bound to ferritin in DS. Higher levels of ferritin-bound iron have also been observed in the AD basal ganglia using a magnetic resonance imaging (MRI) method referred to as the field dependent relaxation rate increase (FDRI).49 However, whether this change in the iron loading of ferritin is related to an alteration in ferritin protein or some other change in iron regulatory proteins is unknown and warrants further investigation.
We also found that the level of copper bound to Cp was lower compared with the controls in the DS temporal cortex (Fig. 5c). Cp in the brain is a copper-containing iron-export enzyme that converts Fe2+ to Fe3+; and is expressed on the surface of astrocytes.50 A loss of function mutation in the Cp gene caused iron build up in the brain which led to neurodegeneration, indicating that Cp is essential for iron homeostasis.51 Copper regulates the iron-export ferroxidase activity of Cp and it has been shown that a requirement for taking up iron in iron-deficient K562 cells is to have copper-depleted Cp, suggesting that decreased Cp copper content could cause lower activity of Cp, and thereby enhance iron accumulation.52 Therefore, it is possible that Cp with lower copper content would have lower ferroxidase53 activity in the DS temporal cortex and cause an accumulation of iron in that region. Loss of Cp ferroxidase activity and iron accumulation has also been observed in the Parkinson's disease (PD) substantia nigra.54 This paper also reported that iron chelation in a Cp knock-out mouse (a model for PD) rescues Parkinsonism, suggesting that in the absence of Cp activity, iron accumulation occurs.
Finally, we found some intriguing differences between DS and controls related to the amounts of copper and zinc bound to SOD1. SOD1 which is located on chromosome 21 showed a different pattern of copper and zinc binding in different regions of the DS brain. While zinc and copper levels bound to SOD1 were similar in the DS hippocampus, SOD1-bound zinc and copper were both elevated in the DS frontal cortex, and zinc levels were higher in the DS temporal cortex. These data are potentially interesting because altered zinc–copper content of SOD1 adversely affects SOD1 function.53,55,56 A further study on SOD1G37R mice, a mouse model for amyotrophic lateral sclerosis (ALS), indicated that the metal content of SOD1 may be the determinant of the toxicity of the protein.24 In this case the mice harboured copper-deficient SOD1 and intriguingly, ALS symptoms could be relieved by treating the mutant mice with diacetyl-bis (4-methylthiosemicarbazonato)copperII which restored the copper content of the SOD1 enzyme.24
Limitations of the study
Our study is limited by several factors. Firstly, with the LC-ICPMS work we were not able to formally identify the protein peaks, and we relied on the use of known standards to provide guidance as to the likely identity of a small number of them. Further work is required to provide definitive protein identification. Secondly, we are only measuring the cytosolic or soluble metalloproteins which make up a part of the total level of Cu, Fe and Zn (ranging from 15–60% of the total) in the tissue as has been previously described.57 Finally, this work has been carried out on a small cohort of post-mortem human tissues of a given diagnosis. The issues that arise from this are that the samples are derived after death and typically at the end stage of disease. Thus, this only affords a limited “snapshot” into the biochemical milieu of the brain in these individuals. It would be more informative to obtain longitudinal data from a cohort, or multiple cohorts at different ages across the course of disease. In this specific study then, these considerations have important implications for the interpretation of the data – as our DS patients all had AD pathology present in their brain. Given that AD itself is characterised by changes in the metalloproteome, then it is unclear if the changes observed in our cohort are a result of the DS or the superimposed AD pathology. As such, analysis of samples derived from younger DS patients without AD pathology would be very important to differentiate the individual and/or combined effects of the DS and AD pathology on the metalloproteome.
Conclusions
This study is the first to demonstrate metal dyshomeostasis in the DS brain and may provide an avenue for further exploration/application of therapies designed to treat metal imbalance in DS. One possibility suggested from this work would be to treat the iron overload in DS by targeting chelatable iron in a similar way to the trials currently being conducted in Parkinson's disease.58 Secondly, we show that even in the absence of changes in the total level of metal in the tissue, specific protein changes do occur. Further, we observed scenarios where there appeared to be a global increase in the Cu metalloproteins present (Fig. 3c). We also found changes that were specific to single proteins (Fig. 4a). We conclude from this that using bulk analysis to understand the role of metals in biology is an oversimplification and more detailed work is required to understand the role of metals in DS.
Conflicts of interest
PAA and DIF are paid consultants and shareholders in Alterity Therapeutics, a company which develops compounds to target metals in neurodegenerative diseases as potential treatments. This company had no role in this study. There are no other potential conflicts to declare.
Appendix
 |
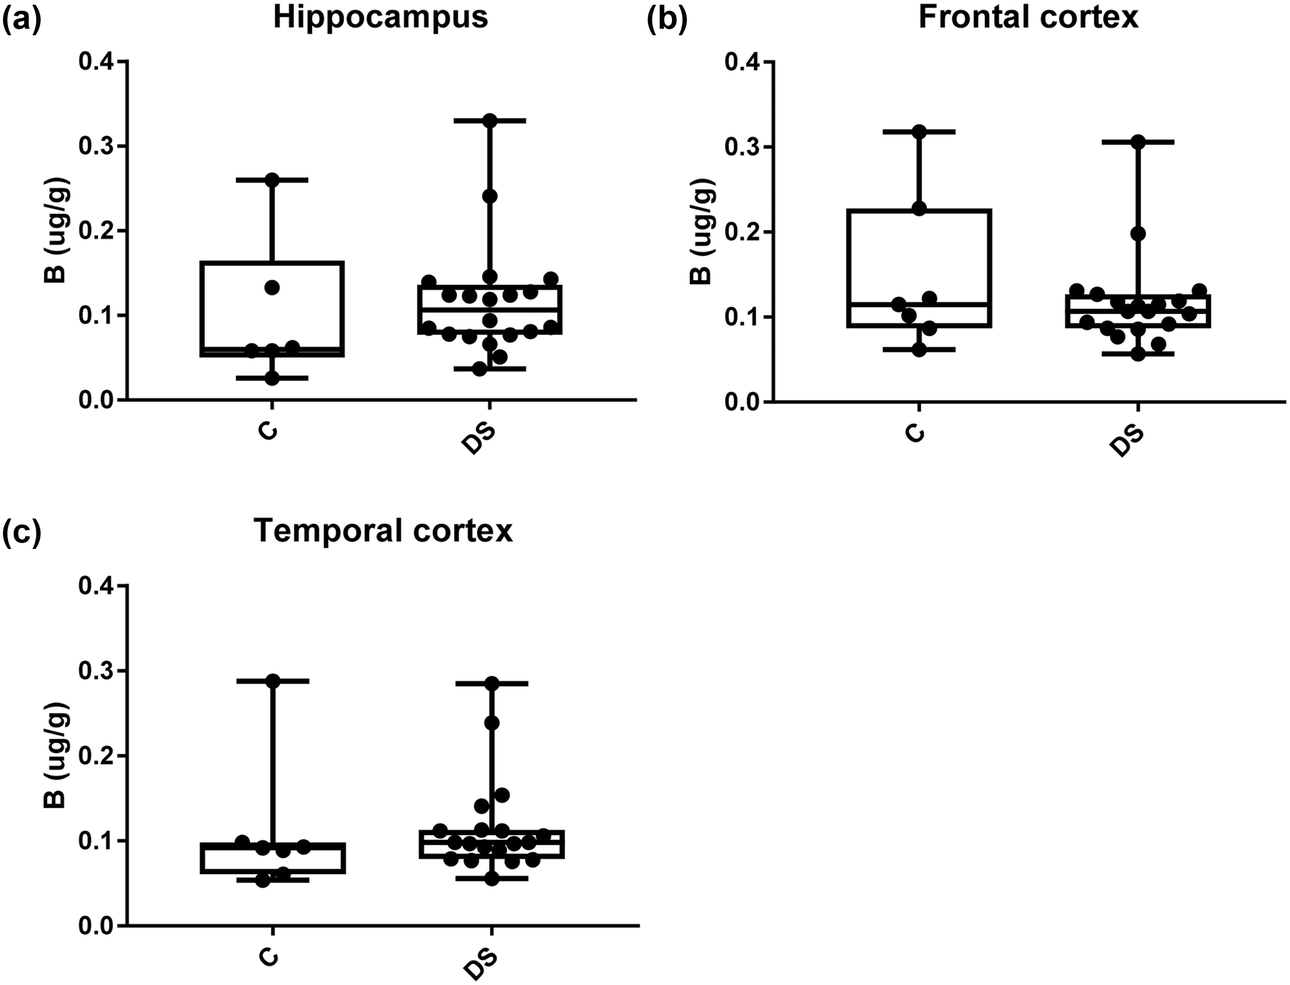
| | Fig. 6 Boron levels in select brain regions of the DS brain, box and whisker plots show the levels of Boron measured by ICPMS in (a) hippocampus, (b) frontal and (c) temporal cortex of post-mortem brains of DS (n = 18–19) compared with age-matched C (n = 6–7), there was no difference between the groups. The box and whisker graphs show median, minimum and maximum values. A two-tailed t-test was used for statistical analysis. | |
 |
| | Fig. 7 Sodium levels in select regions of the DS brain, box and whisker plots show the level of sodium measured by ICPMS in (a) hippocampus, (b) frontal and (c) temporal cortex of post-mortem brains of Down syndrome (n = 17–19) compared with age-matched controls (C) (n = 6–7). The levels of sodium were higher in the hippocampus region; p = 0.006. There were no differences in the frontal and temporal cortices between the groups. The box and whisker graphs show median, minimum and maximum values. A two-tailed t-test was used for statistical analysis. | |
 |
| | Fig. 8 Magnesium levels in select regions of the DS brain, box and whisker plots show the level of magnesium measured by ICPMS in (a) hippocampus, (b) frontal and (c) temporal cortex of post-mortem brains of Down syndrome (n = 17–19) compared with age-matched controls (C) (n = 6–7). The levels of magnesium were higher in the frontal cortex region; p < 0.001. The box and whisker graphs show median, minimum and maximum values. A two-tailed t-test was used for statistical analysis. | |
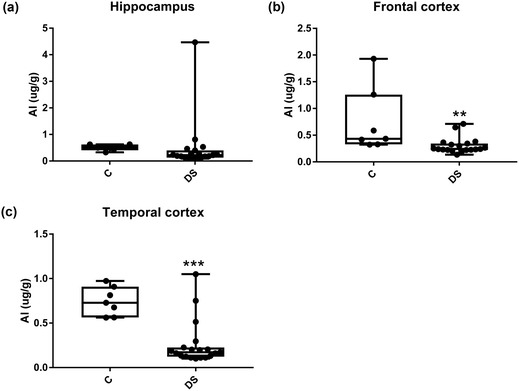 |
| | Fig. 9 Aluminium levels in select regions of the DS brain, box and whisker plots show the level of alminium measured by ICPMS in (a) hippocampus, (b) frontal and (c) temporal cortex of post-mortem brains of Down syndrome (n = 17–19) compared with age-matched controls (C) (n = 6–7). The levels of alminium were lower in the DS frontal and temporal cortices: p = 0.005 for the frontal cortex and p < 0.001 for the temporal cortex. The box and whisker graphs show median, minimum and maximum values. A two-tailed t-test was used for statistical analysis. | |
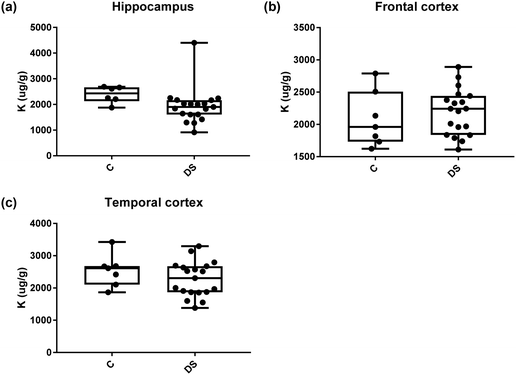 |
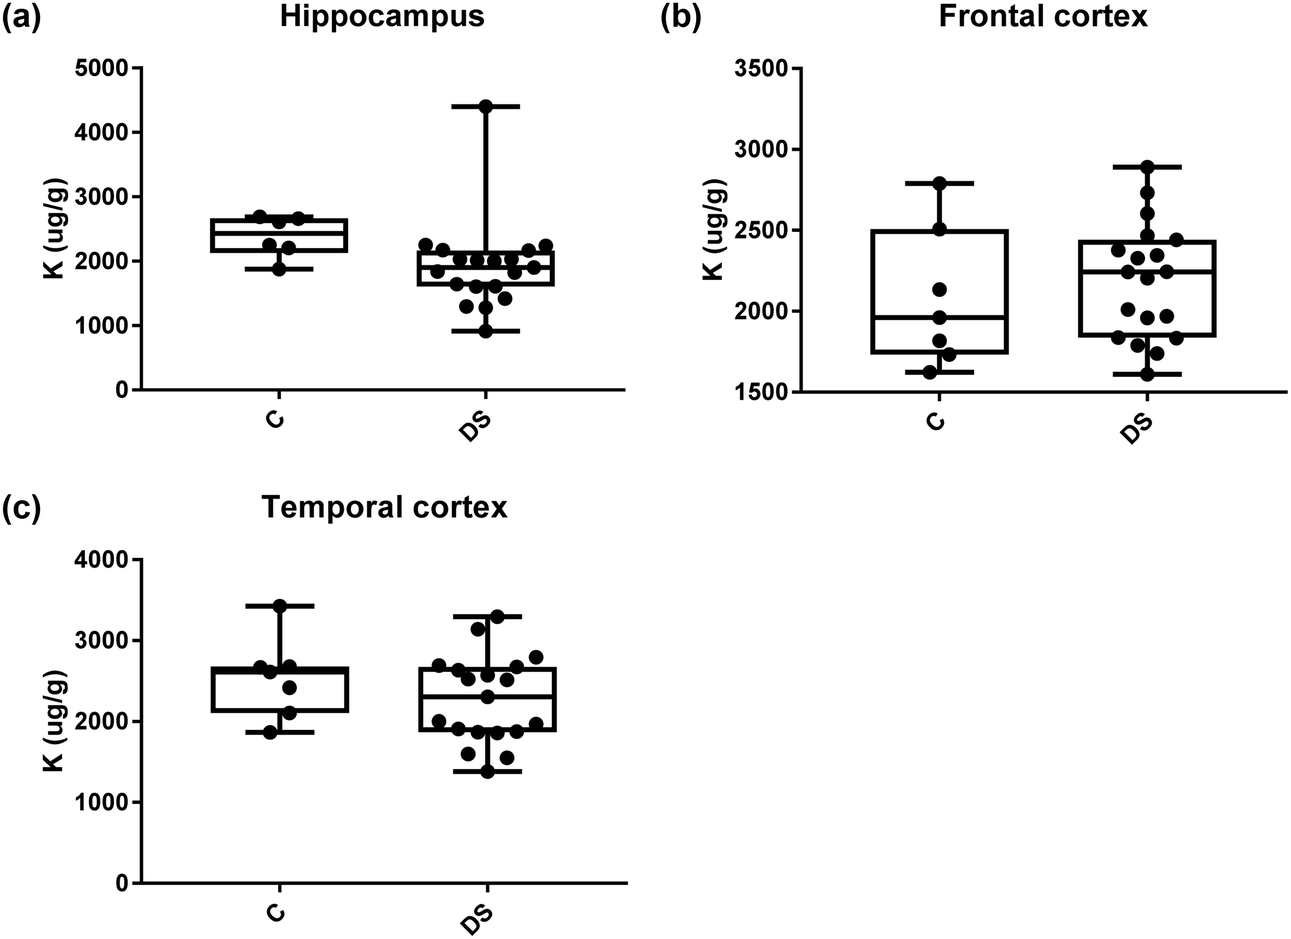
| | Fig. 10 Potassium levels in select regions of the DS brain, box and whisker plots show the level of potassium measured by ICPMS in (a) hippocampus, (b) frontal and (c) temporal cortex of post-mortem brains of Down syndrome (n = 17–19) compared with age-matched controls (C) (n = 6–7). There were no differences between the groups. The box and whisker graphs show median, minimum and maximum values. A two-tailed t-test was used for statistical analysis. | |
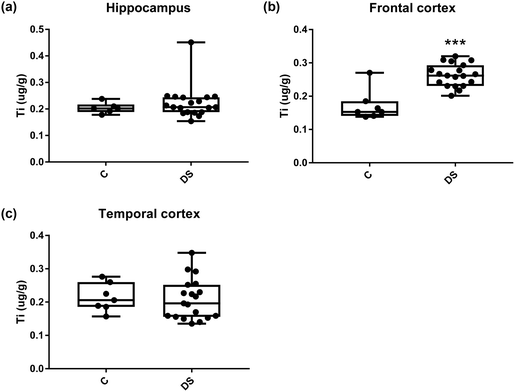 |
| | Fig. 11 Titanium levels in select regions of the DS brain, box and whisker plots show the level of titanium measured by ICPMS in (a) hippocampus, (b) frontal and (c) temporal cortex of post-mortem brains of Down syndrome (n = 17–19) compared with age-matched controls (C) (n = 6–7). The levels of titanium were higher in the frontal cortex; p < 0.001. The box and whisker graphs show median, minimum and maximum values. A two-tailed t-test was used for statistical analysis. | |
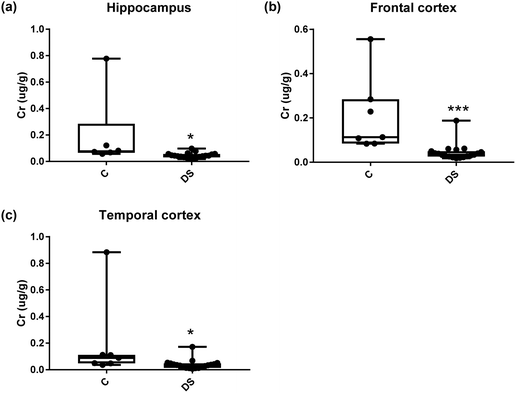 |
| | Fig. 12 Chromium levels in select regions of the DS brain, box and whisker plots show the level of chromium measured by ICPMS in (a) hippocampus, (b) frontal and (c) temporal cortex of post-mortem brains of Down syndrome (n = 17–19) compared with age-matched controls (C) (n = 6–7). The levels of chromium were lower in all the brain regions that were examined: p = 0.025 for the hippocampus; p < 0.001 for the frontal cortex and p = 0.04 for the temporal cortex. The box and whisker graphs show median, minimum and maximum values. A two-tailed t-test was used for statistical analysis. | |
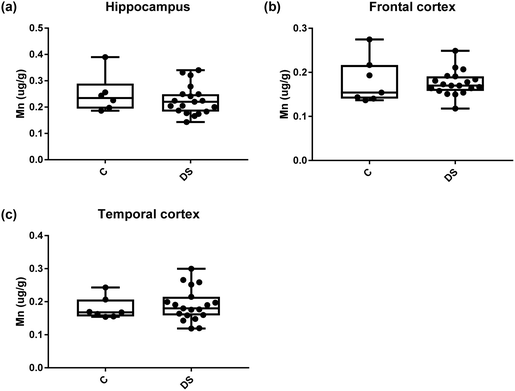 |
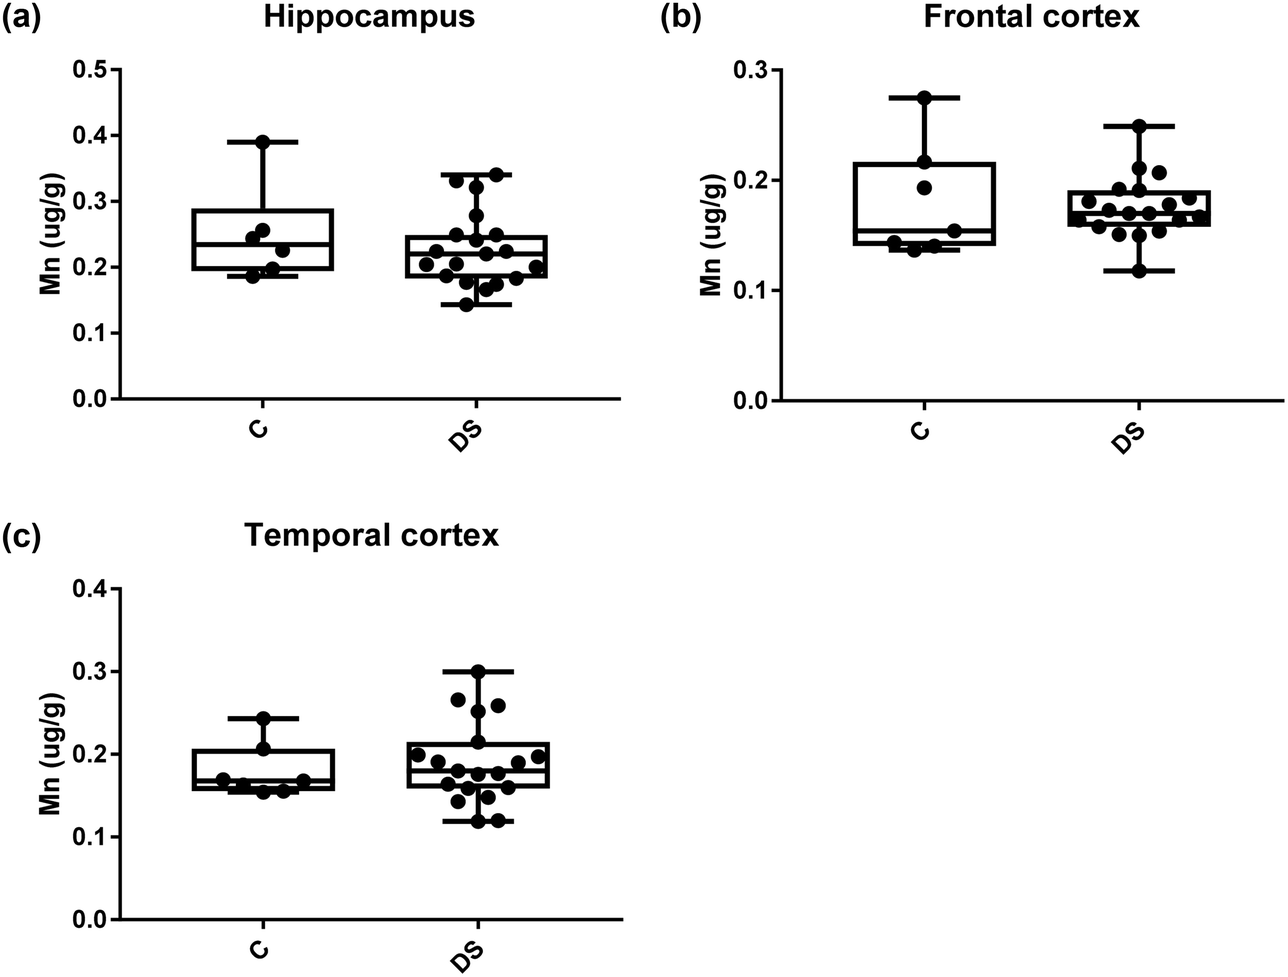
| | Fig. 13 Manganese levels in select regions of the DS brain, box and whisker plots show the level of mangenase measured by ICPMS in (a) hippocampus, (b) frontal and (c) temporal cortex of post-mortem brains of Down syndrome (n = 17–19) compared with age-matched controls (C) (n = 6–7). There was no difference in the levels of mangenase between the groups. The box and whisker graphs show median, minimum and maximum values. A two-tailed t-test was used for statistical analysis. | |
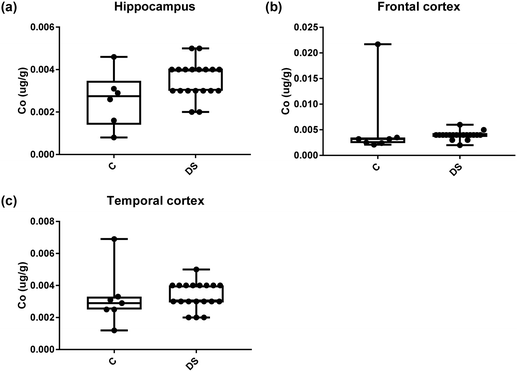 |
| | Fig. 14 Cobalt levels in select regions of the DS brain, box and whisker plots show the level of cobalt measured by ICPMS in (a) hippocampus, (b) frontal and (c) temporal cortex of post-mortem brains of Down syndrome (n = 17–19) compared with age-matched controls (C) (n = 6–7). There was no difference between the groups. The box and whisker graphs show median, minimum and maximum values. A two-tailed t-test was used for statistical analysis. | |
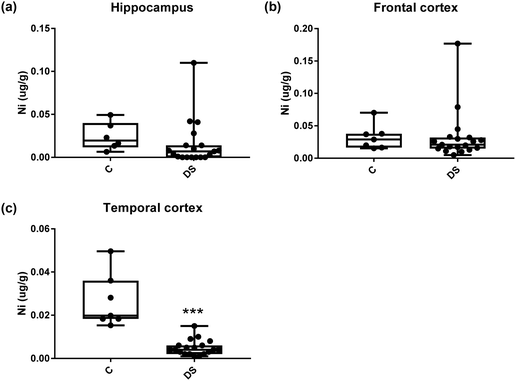 |
| | Fig. 15 Nickel levels in select regions of the DS brain, box and whisker plots show the level of nickel measured by ICPMS in (a) hippocampus, (b) frontal and (c) temporal cortex of post-mortem brains of Down syndrome (n = 17–19) compared with age-matched controls (C) (n = 6–7). The levels of nickel was lower in the temporal cortex; p < 0.001. The box and whisker graphs show median, minimum and maximum values. A two-tailed t-test was used for statistical analysis. | |
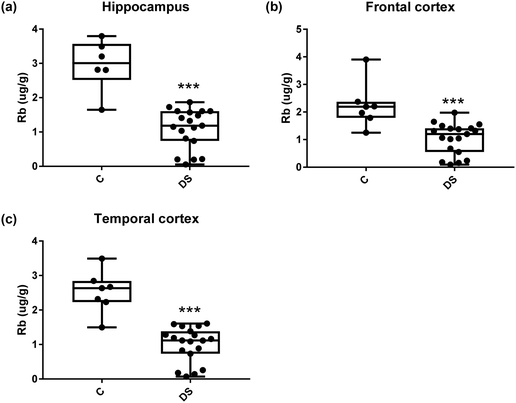 |
| | Fig. 16 Rubidium levels in select regions of the DS brain, Box and whisker plots show the level of rubidium measured by ICPMS in (a) hippocampus, (b) frontal and (c) temporal cortex of post-mortem brains of Down syndrome (n = 17–19) compared with age-matched controls (C) (n = 6–7). The levels of rubidium were lower in all the brain regions that were examined: p < 0.001 for the hippocampus; p < 0.001 for the frontal cortex and p < 0.001 for the temporal cortex. The box and whisker graphs show median, minimum and maximum values. A two-tailed t-test was used for statistical analysis. | |
 |
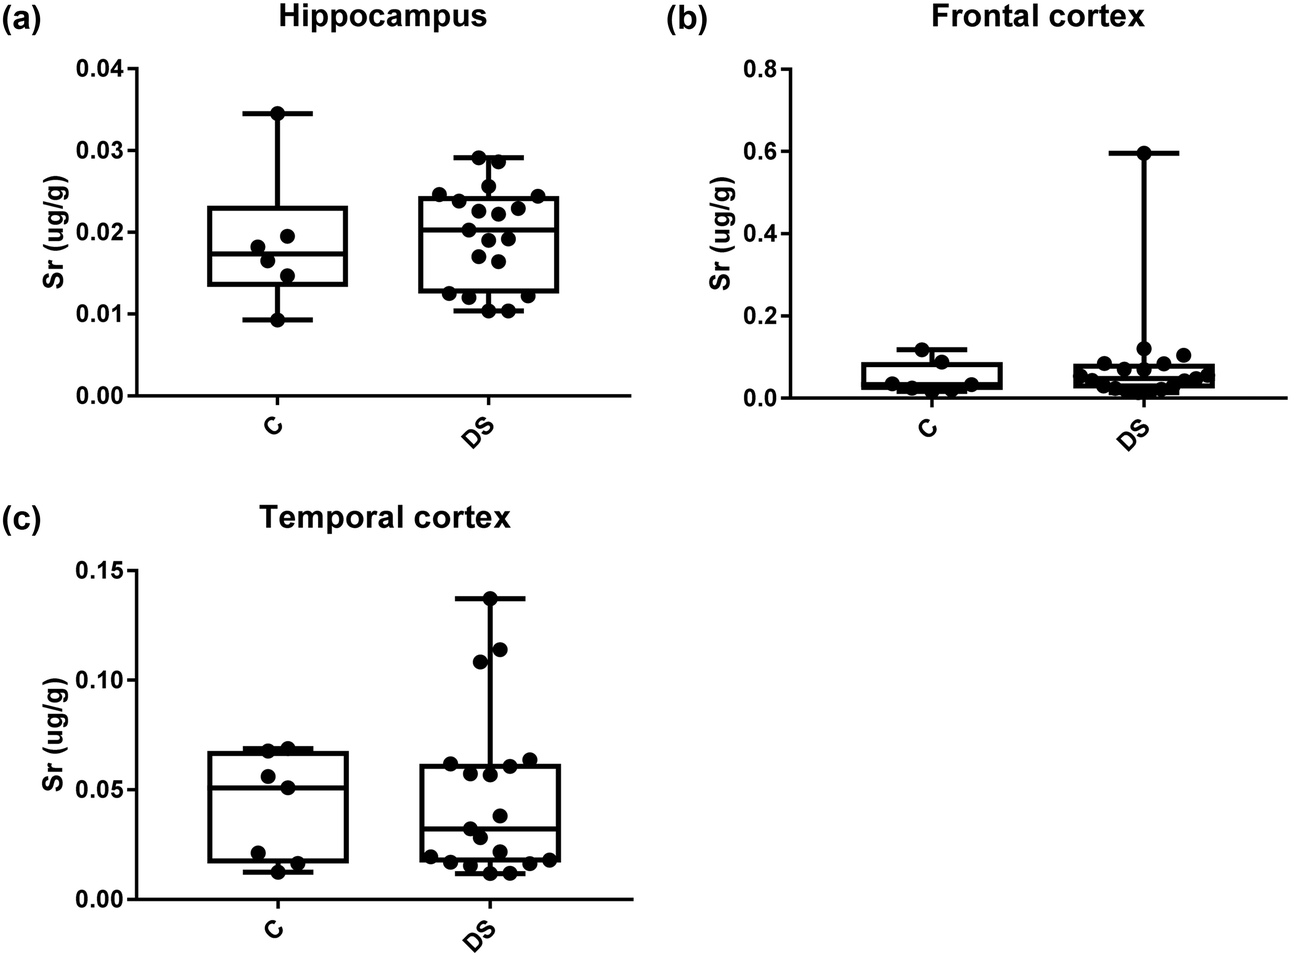
| | Fig. 17 Strontium levels in select regions of the DS brain, box and whisker plots show the level of strontium measured by ICPMS in (a) hippocampus, (b) frontal and (c) temporal cortex of post-mortem brains of Down syndrome (n = 17–19) compared with age-matched controls (C) (n = 6–7). There was no difference in the level of strontium between the groups. The box and whisker graphs show median, minimum and maximum values. A two-tailed t-test was used for statistical analysis. | |
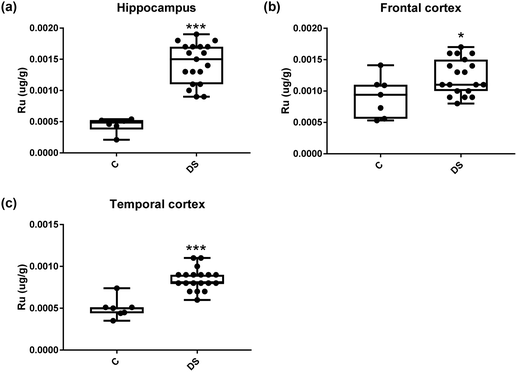 |
| | Fig. 18 Ruthenium levels in select regions of the DS brain, box and whisker plots show the level of ruthenium measured by ICPMS in (a) hippocampus, (b) frontal and (c) temporal cortex of post-mortem brains of Down syndrome (n = 17–19) compared with age-matched controls (C) (n = 6–7). The levels of ruthenium were higher in all the brain regions that were examined: p < 0.001 for the hippocampus; p = 0.022 for the frontal cortex and p < 0.001 for the temporal cortex. The box and whisker graphs show median, minimum and maximum values. A two-tailed t-test was used for statistical analysis. | |
 |
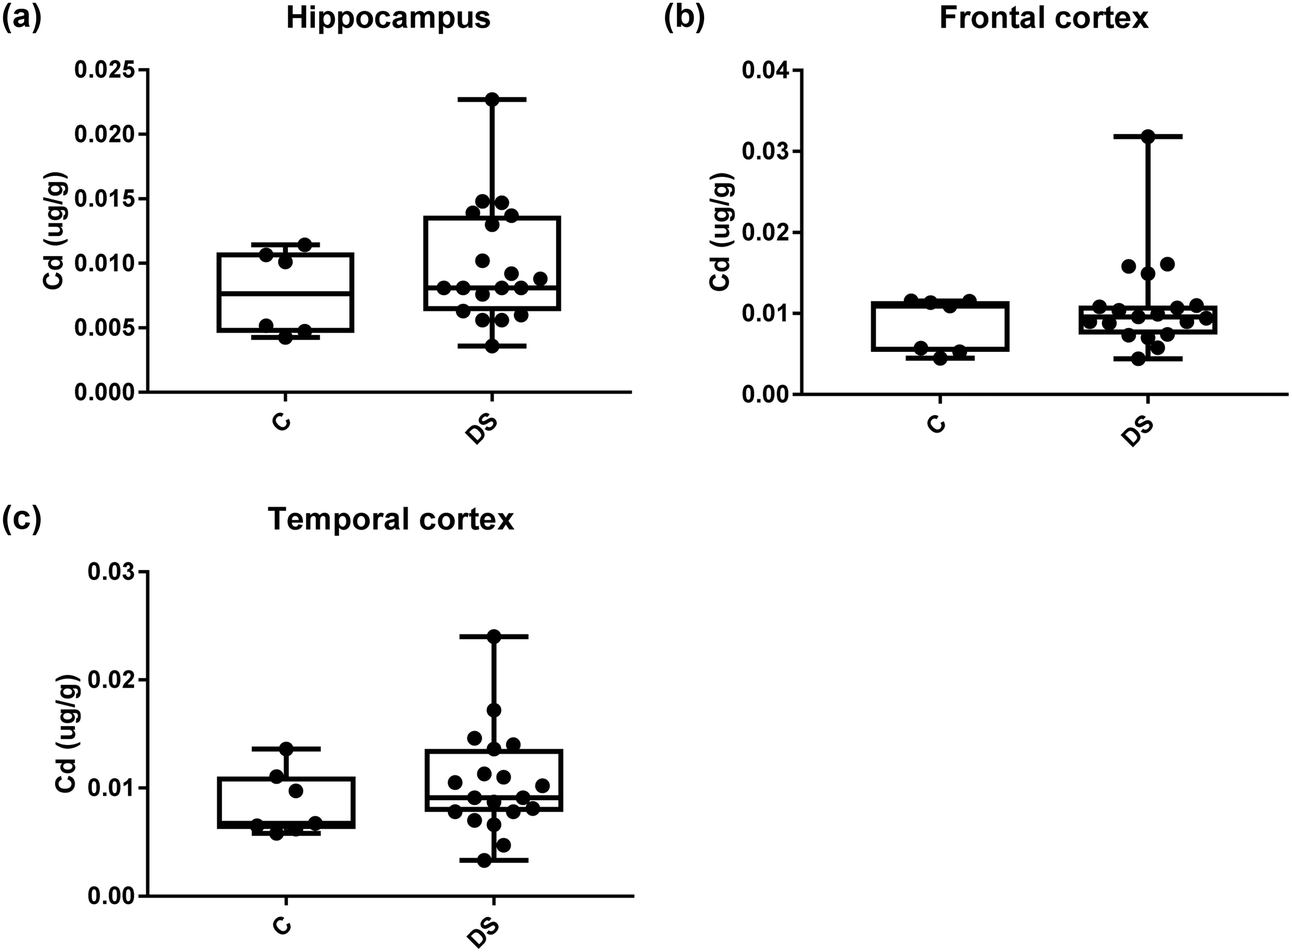
| | Fig. 19 Cadmium levels in select regions of the DS brain, box and whisker plots show the level of cadmium measured by ICPMS in (a) hippocampus, (b) frontal and (c) temporal cortex of post-mortem brains of Down syndrome (n = 17–19) compared with age-matched controls (C) (n = 6–7). There was no difference in the levels of cadmium between the groups. The box and whisker graphs show median, minimum and maximum values. A two-tailed t-test was used for statistical analysis. | |
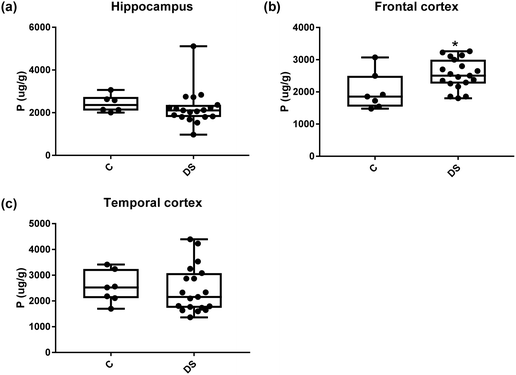 |
| | Fig. 20 Phosphorous levels in select regions of the DS brain, box and whisker plots show the level of phosphorus measured by ICPMS in (a) hippocampus, (b) frontal and (c) temporal cortex of post-mortem brains of Down syndrome (n = 17–19) compared with age-matched controls (C) (n = 6–7). The levels of phosphorous were higher in the frontal cortex; p = 0.022. The box and whisker graphs show median, minimum and maximum values. A two-tailed t-test was used for statistical analysis. | |
Acknowledgements
Nakisa Malakooti was supported by a NHMRC Dora Lush scholarship and Blaine Roberts by a NHMRC Dementia Leadership Fellowship (APP1138673) and NHMRC project grant (APP1164692). The Florey Institute of Neuroscience and Mental Health acknowledge the strong support from the Victorian Government and in particular the funding from the Operational Infrastructure Support Grant.
References
- A. Contestabile, F. Benfenati and L. Gasparini, Communication breaks-Down: from neurodevelopment defects to cognitive disabilities in Down syndrome, Prog. Neurobiol., 2010, 91, 1–22 CrossRef.
- A. Ghezzo, S. Salvioli, M. C. Solimando, A. Palmieri, C. Chiostergi, M. Scurti, L. Lomartire, F. Bedetti, G. Cocchi and D. Follo, Age-related changes of adaptive and neuropsychological features in persons with down syndrome, PLoS One, 2014, 9, e113111 CrossRef PubMed.
- D. Mann, The pathological association between Down syndrome and Alzheimer disease, Mech. Ageing Dev., 1988, 43, 99–136 CrossRef CAS.
- K. J. Barnham, C. L. Masters and A. I. Bush, Neurodegenerative diseases and oxidative stress, Nat. Rev. Drug Discovery, 2004, 3, 205–214 CrossRef CAS PubMed.
- S. Rivera-Mancía, I. Pérez-Neri, C. Ríos, L. Tristán-López, L. Rivera-Espinosa and S. Montes, The transition metals copper and iron in neurodegenerative diseases, Chem.-Biol. Interact., 2010, 186, 184–199 CrossRef PubMed.
- F. M. LaFerla, Calcium dyshomeostasis and intracellular signalling in Alzheimer's disease, Nat. Rev. Neurosci., 2002, 3, 862–872 CrossRef CAS.
- S. A. James, Q. I. Churches, M. D. de Jonge, I. E. Birchall, V. Streltsov, G. McColl, P. A. Adlard and D. J. Hare, Iron, copper, and zinc concentration in Aβ plaques in the APP/PS1 mouse model of Alzheimer's disease correlates with metal levels in the surrounding neuropil, ACS Chem. Neurosci., 2016, 8, 629–637 CrossRef.
- D. Strozyk, L. J. Launer, P. A. Adlard, R. A. Cherny, A. Tsatsanis, I. Volitakis, K. Blennow, H. Petrovitch, L. R. White and A. I. Bush, Zinc and copper modulate Alzheimer Aβ levels in human cerebrospinal fluid, Neurobiol. Aging, 2009, 30, 1069–1077 CrossRef CAS.
- A. Rembach, D. J. Hare, M. Lind, C. J. Fowler, R. A. Cherny, C. McLean, A. I. Bush, C. L. Masters and B. R. Roberts, Decreased copper in Alzheimer's disease brain is predominantly in the soluble extractable fraction, Int. J. Alzheimer's Dis., 2013, 2013, 623241 Search PubMed.
- B. r. R. Cardoso, D. J. Hare, M. Lind, C. A. McLean, I. Volitakis, S. M. Laws, C. L. Masters, A. I. Bush and B. R. Roberts, The APOE ε4 Allele Is Associated with Lower Selenium Levels in the Brain: Implications for Alzheimer's Disease, ACS Chem. Neurosci., 2017, 8(7), 1459–1464 CrossRef.
- M. P. Mattson, S. W. Barger, B. Cheng, I. Lieberburg, V. L. Smith-Swintosky and R. E. Rydel, beta-Amyloid precursor protein metabolites and loss of neuronal Ca2+ homeostasis in Alzheimer's disease, Trends Neurosci., 1993, 16, 409–414 CrossRef CAS.
- G. Bartzokis, M. Beckson, D. B. Hance, P. Marx, J. A. Foster and S. R. Marder, MR evaluation of age-related increase of brain iron in young adult and older normal males, Magn. Reson. Imaging, 1997, 15, 29–35 CrossRef CAS.
- A. Morita, M. Kimura and Y. Itokawa, The effect of aging on the mineral status of female mice, Biol. Trace Elem. Res., 1994, 42, 165–177 CrossRef CAS.
- H. R. Massie, V. R. Aiello and A. A. Iodice, Changes with age in copper and superoxide dismutase levels in brains of C57BL/6J mice, Mech. Ageing Dev., 1979, 10, 93–99 CrossRef CAS.
- C. J. Maynard, R. Cappai, I. Volitakis, R. A. Cherny, C. L. Masters, Q.-X. Li and A. I. Bush, Gender and genetic background effects on brain metal levels in APP transgenic and normal mice: implications for Alzheimer β-amyloid pathology, J. Inorg. Biochem., 2006, 100, 952–962 CrossRef CAS.
-
E. C. Larkin and G. A. Rao, Brain, behaviour, and iron in the infant diet, Springer, 1990, pp. 43–57 Search PubMed.
- N. E. Dixon, B. G. Crissman, P. B. Smith, S. A. Zimmerman, G. Worley and P. S. Kishnani, Prevalence of iron deficiency in children with Down syndrome, J. Pediatr., 2010, 157, 967–971 CrossRef CAS.
- D. Mazurek and J. Wyka, Down syndrome-genetic and nutritional aspects of accompanying disorders, Rocz. Panstw. Zakl. Hig., 2015, 66, 189 CAS.
- P. Barlow, P. Sylvester and J. Dickerson, Hair trace metal levels in Down syndrome patients, J. Intellect. Disabil. Res., 1981, 25, 161–168 CrossRef CAS.
- E. McCoy and J. Sneddon, Decreased calcium content and 45Ca2+ uptake in Down's syndrome blood platelets, Pediatr. Res., 1984, 18, 914–916 CrossRef CAS.
- P. A. Adlard, R. A. Cherny, D. I. Finkelstein, E. Gautier, E. Robb, M. Cortes, I. Volitakis, X. Liu, J. P. Smith and K. Perez, Rapid restoration of cognition in Alzheimer's transgenic mice with 8-hydroxy quinoline analogs is associated with decreased interstitial Aβ, Neuron, 2008, 59, 43–55 CrossRef CAS.
- A. Lothian and B. R. Roberts, Standards for quantitative metalloproteomic analysis using size exclusion ICP-MS, J. Visualized Exp., 2016 Search PubMed.
- K. L. Berggren, J. Chen, J. Fox, J. Miller, L. Dodds, B. Dugas, L. Vargas, A. Lothian, E. McAllum and I. Volitakis, Neonatal iron supplementation potentiates oxidative stress, energetic dysfunction and neurodegeneration in the R6/2 mouse model of Huntington's disease, Redox Biol., 2015, 4, 363–374 CrossRef CAS.
- B. R. Roberts, N. K. Lim, E. J. McAllum, P. S. Donnelly, D. J. Hare, P. A. Doble, B. J. Turner, K. A. Price, S. C. Lim and B. M. Paterson, Oral treatment with CuII (atsm) increases mutant SOD1 in vivo but protects motor neurons and improves the phenotype of a transgenic mouse model of amyotrophic lateral sclerosis, J. Neurosci., 2014, 34, 8021–8031 CrossRef CAS.
- D. Loeffler, J. Connor, P. Juneau, B. Snyder, L. Kanaley, A. DeMaggio, H. Nguyen, C. Brickman and P. LeWitt, Transferrin and iron in normal, Alzheimer's disease, and Parkinson's disease brain regions, J. Neurochem., 1995, 65, 710–716 CrossRef CAS.
- C. Cornett, W. Markesbery and W. Ehmann, Imbalances of trace elements related to oxidative damage in Alzheimer's disease brain, Neurotoxicology, 1998, 19, 339–345 CAS.
- R. Vassar, B. D. Bennett, S. Babu-Khan, S. Kahn, E. A. Mendiaz, P. Denis, D. B. Teplow, S. Ross, P. Amarante, R. Loeloff, Y. Luo, S. Fisher, J. Fuller, S. Edenson, J. Lile, M. A. Jarosinski, A. L. Biere, E. Curran, T. Burgess, J.-C. Louis, F. Collins, J. Treanor, G. Rogers and M. Citron, [Beta]-Secretase Cleavage of Alzheimer's Amyloid Precursor Protein by the Transmembrane Aspartic Protease BACE, Science, 1999, 286, 735 CrossRef CAS.
- J. T. Rogers, J. D. Randall, C. M. Cahill, P. S. Eder, X. Huang, H. Gunshin, L. Leiter, J. McPhee, S. S. Sarang, T. Utsuki, N. H. Greig, D. K. Lahiri, R. E. Tanzi and A. I. Bush, An iron-responsive element type II in the 5′-untranslated region of the Alzheimer's amyloid precursor protein transcript, J. Biol. Chem., 2002, 277, 45518–45528 CrossRef CAS.
- C. Pucharcos, X. Estivill and S. de la Luna, Intersectin 2, a new multimodular protein involved in clathrin-mediated endocytosis, FEBS Lett., 2000, 478, 43–51 CrossRef CAS.
- B. Leveugle, G. Spik, D. P. Perl, C. Bouras, H. M. Fillit and P. R. Hof, The iron-binding protein lactotransferrin is present in pathologic lesions in a variety of neurodegenerative disorders: a comparative immunohistochemical analysis, Brain Res., 1994, 650, 20–31 CrossRef CAS.
- A. Lawen and D. J. Lane, Mammalian iron homeostasis in health and disease: uptake, storage, transport, and molecular mechanisms of action, Antioxid. Redox Signaling, 2013, 18, 2473–2507 CrossRef CAS.
- H. Padmanabhan, M. J. Brookes and T. Iqbal, Iron and colorectal cancer: evidence from in vitro and animal studies, Nutr. Rev., 2015, 73(5), 308–317 CrossRef.
- S. J. Dixon, K. M. Lemberg, M. R. Lamprecht, R. Skouta, E. M. Zaitsev, C. E. Gleason, D. N. Patel, A. J. Bauer, A. M. Cantley and W. S. Yang, Ferroptosis: an iron-dependent form of nonapoptotic cell death, Cell, 2012, 149, 1060–1072 CrossRef CAS.
- A. Yenigun, F. Ozkinay, O. Cogulu, C. Coker, N. Cetiner, G. Ozden, O. Aksu and C. Ozkinay, Hair zinc level in Down syndrome, Down Syndr. Res. Pract., 2004, 9, 53–57 CrossRef.
- V. Bancila, I. Nikonenko, Y. Dunant and A. Bloc, Zinc inhibits glutamate release via activation of pre-synaptic KATP channels and reduces ischaemic damage in rat hippocampus, J. Neurochem., 2004, 90, 1243–1250 CrossRef CAS.
- A. Takeda, M. Hirate, H. Tamano and N. Oku, Release of glutamate and GABA in the hippocampus under zinc deficiency, J. Neurosci. Res., 2003, 72, 537–542 CrossRef CAS.
- P. Yu, M. Zhang, H. Ding, X. Di and P. Guan, Effect of Glutamate on Brain Iron Metabolism and the Regulation Mechanism, J. Drug Metab. Toxicol., 2015, 6, 2 Search PubMed.
- M. Cater, K. McInnes, Q. Li, I. Volitakis, S. La Fontaine, J. Mercer and A. Bush, Intracellular copper deficiency increases amyloid-beta secretion by diverse mechanisms, Biochem. J., 2008, 412, 141–152 CrossRef CAS PubMed.
- B. R. Roberts, J. D. Doecke, A. Rembach, L. F. Yévenes, C. J. Fowler, C. A. McLean, M. Lind, I. Volitakis, C. L. Masters and A. I. Bush, Rubidium and potassium levels are altered in Alzheimer's disease brain and blood but not in cerebrospinal fluid, Acta Neuropathol. Commun., 2016, 4, 119 CrossRef.
-
M. Zigmond, F. E. Bloom, S. C. Landis, J. L. Roberts and L. R. Squire, Fundamental Neuroscience, Academic Press, USA, 1999 Search PubMed.
- H. Haas and J. Jefferys, Low-calcium field burst discharges of CA1 pyramidal neurones in rat hippocampal slices, J. Physiol., 1984, 354, 185 CrossRef CAS.
- Z. Feng and D. M. Durand, Low-calcium epileptiform activity in the hippocampus in vivo, J. Neurophysiol., 2003, 90, 2253–2260 CrossRef CAS.
- P.-L. Tsai, L.-M. Lian and W.-H. Chen, Hypocalcemic seizure mistaken for idiopathic epilepsy in two cases of DiGeorge syndrome (chromosome 22q11 deletion syndrome), Acta Neurol. Taiwan., 2009, 18, 272–275 Search PubMed.
- M. Stark, Yeast protein serine/threonine phosphatases: multiple roles and diverse regulation, Yeast, 1996, 12, 1647–1675 CrossRef CAS.
- E. E. Battin and J. L. Brumaghim, Antioxidant activity of sulfur and selenium: a review of reactive oxygen species scavenging, glutathione peroxidase, and metal-binding antioxidant mechanisms, Cell Biochem. Biophys., 2009, 55, 1–23 CrossRef CAS.
- N. Şenol, M. Nazıroğlu and V. Yürüker, N-acetylcysteine and selenium modulate oxidative stress, antioxidant vitamin and cytokine values in traumatic brain injury-induced rats, Neurochem. Res., 2014, 39, 685–692 CrossRef.
- M. A. Lovell, S. Xiong, G. Lyubartseva and W. R. Markesbery, Organoselenium (Sel-Plex diet) decreases amyloid burden and RNA and DNA oxidative damage in APP/PS1 mice, Free Radicals Biol. Med., 2009, 46, 1527–1533 CrossRef CAS.
- B. Cardoso, D. Hare, A. Bush and B. Roberts, Glutathione peroxidase 4: a new player in neurodegeneration?, Mol. Psychiatry, 2017, 22, 328 CrossRef CAS PubMed.
- G. Bartzokis and T. Tishler, MRI evaluation of basal ganglia ferritin iron and neurotoxicity in Alzheimer's and Huntingon's disease, Cell. Mol. Biol., 2000, 46, 821–833 CAS.
- B. N. Patel, R. J. Dunn, S. Y. Jeong, Q. Zhu, J.-P. Julien and S. David, Ceruloplasmin regulates iron levels in the CNS and prevents free radical injury, J. Neurosci., 2002, 22, 6578–6586 CrossRef CAS.
- K. Yoshida, K. Furihata, S. I. Takeda, A. Nakamura, K. Yamamoto, H. Morita, S. Hiyamuta, S.-I. Ikeda, N. Shimizu and N. Yanagisawa, A mutation in the ceruloplasmin gene is associated with systemic hemosiderosis in humans, Nat. Genet., 1995, 9, 267–272 CrossRef CAS.
- Z. K. Attieh, C. K. Mukhopadhyay, V. Seshadri, N. A. Tripoulas and P. L. Fox, Ceruloplasmin ferroxidase activity stimulates cellular iron uptake by a trivalent cation-specific transport mechanism, J. Biol. Chem., 1999, 274, 1116–1123 CrossRef CAS.
- A. G. Estévez, J. P. Crow, J. B. Sampson, C. Reiter, Y. Zhuang, G. J. Richardson, M. M. Tarpey, L. Barbeito and J. S. Beckman, Induction of Nitric Oxide-Dependent Apoptosis in Motor Neurons by Zinc-Deficient Superoxide Dismutase, Science, 1999, 286, 2498–2500 CrossRef.
- S. Ayton, P. Lei, J. A. Duce, B. X. Wong, A. Sedjahtera, P. A. Adlard, A. I. Bush and D. I. Finkelstein, Ceruloplasmin dysfunction and therapeutic potential for Parkinson disease, Ann. Neurol., 2013, 73, 554–559 CrossRef CAS.
- J. P. Crow, J. B. Sampson, Y. Zhuang, J. A. Thompson and J. S. Beckman, Decreased zinc affinity of amyotrophic lateral sclerosis-associated superoxide dismutase mutants leads to enhanced catalysis of tyrosine nitration by peroxynitrite, J. Neurochem., 1997, 69, 1936–1944 CrossRef CAS.
- B. R. Roberts, J. A. Tainer, E. D. Getzoff, D. A. Malencik, S. R. Anderson, V. C. Bomben, K. R. Meyers, P. A. Karplus and J. S. Beckman, Structural characterization of zinc-deficient human superoxide dismutase and implications for ALS, J. Mol. Biol., 2007, 373, 877–890 CrossRef CAS PubMed.
- B. R. Roberts, D. J. Hare, C. A. McLean, A. Conquest, M. Lind, Q.-X. Li, A. I. Bush, C. L. Masters, M.-C. Morganti-Kossmann and T. Frugier, Traumatic brain injury induces elevation of Co in the human brain, Metallomics, 2015, 7, 66–70 RSC.
- D. Devos, C. Moreau, J. C. Devedjian, J. Kluza, M. Petrault, C. Laloux, A. Jonneaux, G. Ryckewaert, G. Garçon and N. Rouaix, Targeting chelatable iron as a therapeutic modality in Parkinson's disease, Antioxid. Redox Signaling, 2014, 21, 195–210 CrossRef CAS.
Footnote |
| † Equal last authors. |
|
| This journal is © The Royal Society of Chemistry 2020 |
Click here to see how this site uses Cookies. View our privacy policy here. 
 a,
Melanie A.
Pritchard
b,
Irene
Volitakis
a,
Ron C.
Kim
c,
Ira T.
Lott
c,
Catriona A.
McLean
a,
David I.
Finkelstein†
a,
Melanie A.
Pritchard
b,
Irene
Volitakis
a,
Ron C.
Kim
c,
Ira T.
Lott
c,
Catriona A.
McLean
a,
David I.
Finkelstein†