
 Open Access Article
 This Open Access Article is licensed under a Creative Commons Attribution-Non Commercial 3.0 Unported Licence
MetaboKit: a comprehensive data extraction tool for untargeted metabolomics†
Pradeep
Narayanaswamy‡
a,
Guoshou
Teo‡
b,
Jin Rong
Ow
c,
Adam
Lau
d,
Philipp
Kaldis
ce,
Stephen
Tate
d and
Hyungwon
Choi
 *bc
*bc
aSciex, R&D, Singapore
bDepartment of Medicine, Yong Loo Lin School of Medicine, National University of Singapore, Singapore. E-mail: hyung_won_choi@nus.edu.sg
cInstitute of Molecular and Cell Biology, A*STAR, Singapore
dSciex, Concord, Canada
eDepartment of Clinical Sciences, Lund University, Sweden
First published on 10th June 2020
Abstract
We have developed MetaboKit, a comprehensive software package for compound identification and relative quantification in mass spectrometry-based untargeted metabolomics analysis. In data dependent acquisition (DDA) analysis, MetaboKit constructs a customized spectral library with compound identities from reference spectral libraries, adducts, dimers, in-source fragments (ISF), MS/MS fragmentation spectra, and more importantly the retention time information unique to the chromatography system used in the experiment. Using the customized library, the software performs targeted peak integration for precursor ions in DDA analysis and for precursor and product ions in data independent acquisition (DIA) analysis. With its stringent identification algorithm requiring matches by both MS and MS/MS data, MetaboKit provides identification results with significantly greater specificity than the competing software packages without loss in sensitivity. The proposed MS/MS-based screening of ISFs also reduces the chance of unverifiable identification of ISFs considerably. MetaboKit's quantification module produced peak area values highly correlated with known concentrations in a DIA analysis of the metabolite standards at both MS1 and MS2 levels. Moreover, the analysis of Cdk1Liv−/− mouse livers showed that MetaboKit can identify a wide range of lipid species and their ISFs, and quantitatively reconstitute the well-characterized fatty liver phenotype in these mice. In DIA data, the MS1-level and MS2-level peak area data produced similar fold change estimates in the differential abundance analysis, and the MS2-level peak area data allowed for quantitative comparisons in compounds whose precursor ion chromatogram was too noisy for peak integration.
Introduction
Despite considerable advances in mass spectrometry (MS) technologies, the field of metabolomics is in the process of adopting systematic auto-fragmentation as the main source of identification and quantification in untargeted analysis. Although rapid advances in data independent acquisition (DIA) technology are rapidly altering the landscape,1–5 a multitude of challenges need to be addressed for metabolomics. For example, tandem MS (MS/MS) analysis of the metabolome requires a reference library of precursor ion information and product ion spectra. Nevertheless, reliable spectral libraries can be built only by single compound injection analyses of pure metabolite standards, and this is not a scalable approach to cover the entire metabolome. Moreover, product ion spectra with associated retention time (RT) of individual compounds are highly specific to instrumental parameters such as the type of liquid chromatography (LC) or collision energy. Last but not least, recent reports have highlighted frequent in-source fragmentation of compounds,6–8 adding more challenges to robust compound identification from MS/MS analysis.Latest developments in bioinformatic approaches have addressed some of these challenges, enabling quantitative metabolomics analysis using DIA-MS. For instance, MS-DIAL software provides an excellent software package equipped with multiple functionalities to perform compound identification and precursor ion peak integration from data dependent acquisition (DDA)-MS and DIA-MS analyses.5 MetDIA is a library-based ion chromatogram extraction workflow for metabolite quantitation from DIA-MS analysis, performing direct “metabolite-centric” identification from DIA data for target analytes and extracting their ion chromatograms.4
Here we report a new open-source software package, called MetaboKit, with multiple modules to perform data processing tasks for untargeted metabolomics experiments. These modules perform various tasks including MS/MS-oriented metabolite identification, production of customized spectral library, and targeted peak area integration for precursor ions (MS1) and product ions (MS2) in DIA analysis. MetaboKit addresses two challenges that have substantial room for improvement in the existing software packages: (i) MS/MS-driven compound identification with explicit annotation of in-source fragments (ISFs), and (ii) the use of the extracted ion chromatograms (XICs) of product ions as the proxy of quantification, in addition to the conventional use of the XICs of precursor ions.
The first point on the MS/MS-driven identification has been partly addressed in the existing software solutions, including the open source package MS-DIAL,5 publicly accessible XCMS Online9 or commercial software packages with proprietary license such as Scaffold Elements.10 However, MS-DIAL and XCMSonline software packages report identifications with and without MS1 and MS2 level evidence together, where a large number of identifications are solely based on MS1 data. Using a metabolite standard mixture, we later show that this approach results in an uncontrollable number of false positive identifications, and our scoring approach yields slightly improved identification of true positives with comparable or better specificity. XCMSonline claims that they screen for ISFs based on matching to low collision energy spectra from METLIN database and this process is integrated into its pipeline.7 However, it is unclear whether all compounds have such spectra in their proprietary database, nor do they explicitly indicate which ions were re-assigned as ISF in the output table. MS-DIAL addresses this by reporting a post-curation comment, alerting the user for potential ISF event. However, they add this curation note to even for the ions with identification solely based on MS1 evidence, while assigning alternative compound names in the same lines in the output.
The second point on using peak integration of product ion XICs as a source of quantification from DIA analysis is rapidly emerging yet remains underdeveloped in the literature.4,5 Despite the slow rate of adoption in the field, advancing MS technology is bound to call for such a solution in metabolomics in the very near future, and directly identifying quantifier product ions from an untargeted assay can lead to the development of a targeted assay.11 As such, evaluating the potential of product ion signals in DIA analysis as an alternative source of quantification is all the more worth the investigation.
One of MetaboKit's unique strengths is in the construction of a customized library out of the user's own product ion spectra, an approach we had previously advocated in large-scale untargeted metabolomics.3 The main purpose of creating such a library is to update the list of peak m/z values and peak heights in each spectrum, with known identity from reference libraries, to the user's instrumentation. More importantly, the library building process assigns a specific RT to each spectrum in the new library, a key signature of identification in untargeted metabolomics. This functionality empowers the user to gradually build their own database of MS/MS spectra from a specific instrument setting, instead of perpetually relying on the existing databases to benchmark their new data such as METLIN,12 HMDB,13 and LIPIDBLAST.14 Spectra in these libraries were evidently generated in different and possibly older instruments. By having a spectral library populated with user's new data, future DDA and DIA data analyses in laboratories can benefit considerably from this highly specific product ion spectral libraries.
In addition, our approach produces multiple quantitative data points for the same compound, i.e., at both MS1 and MS2 levels, from which the user can determine which ion to use for peak integration in each metabolite based on objective quality metrics such as the coefficient of variation and signal-to-noise ratio. We showcase these functionalities using a metabolite standard mixture with deep characterization via single compound injection analyses, and complex tissue analysis of murine liver samples with well characterized phenotype.
Methods
Metabolite standard mix
Mass Spectrometry Metabolite Library (MSMLS) kit was purchased from Sigma-Aldrich (Now Merck). MSMLS kit contains 600 unique metabolites with 5 μg (dried weight) per well in 96 well format. Plates were dissolved as per the vendor protocol. Each individual compound was injected separately, and the full information of 454 detected compounds including adducts, dimers, top three ISFs, and peak area values, can be found in Table S1 (ESI†). Among these, 91 metabolites including amino acids, nucleosides and nucleotides, organic acids and others related to the TCA cycle were selected to form a metabolite standard mix. These compounds are expected to have non-overlapping signals and therefore it represents a simple, yet clean standard mixture of compounds, and their full MS and MS/MS data were characterized.Cdk1 knockout mice
Cdk1 Liv−/− mice and wild-type mice were kept on a standard diet under 12 hour light/dark cycle in Specific Pathogen Free (SPF) conditions at the A*STAR Biological Resource Center (A*STAR BRC) in Singapore.15,16 Liver tissues were collected when the mice reached 18 months old. All animal experiments performed were approved by the A*STAR Institutional Animal Care and Use Committee (IACUC) in accordance with the National Advisory Committee for Laboratory Animal Research (NACLAR) Guidelines.Metabolite extraction for liver tissues
Liver tissue samples were weighed into Eppendorf tubes and then homogenized in methanol using bead homogenizer. Homogenized tissue was taken equivalent to 5 mg for metabolite extraction using Bligh and Dyer method.17 Aqueous phase (top layer) and organic phase (bottom layer) was transferred into tubes and dried in a speed vac. Dried tubes were reconstituted in 5% methanol for aqueous phase tubes and for organic phase tubes reconstituted in 10% acetonitrile/90% isopropanol with 10 mM ammonium formate (Mobile phase-B of organic fraction analysis method).Liquid chromatography conditions
Mass spectrometry analysis
The SCIEX TripleTOF® 6600 System was used to acquire data in both positive and negative ion mode using information dependent acquisition and data independent acquisition modes. Collision energy was 30 and CES 15 for the aqueous fraction and CE was 35 and CES 15 for the organic fraction with 21 Da SWATH® windows.DDA module
DDA module has three command lines: feature extraction, identification (scoring), and alignment. The feature extraction command processes the raw data files in the mzML format, and the scoring command performs the external library-assisted identification with automatic adduct ion mass calculation and product ion spectral matching. The user can specify a number of options to control the compound identification process, including mass tolerance for precursor ions and product ions, product ion intensity threshold as the percentage of height relative to the base peak in each spectrum (1% as default), dot product thresholds, and parameters controlling the ISF detection steps, all of which are fully described in the software manual. For dot product calculation, we use the square root of peak intensities to attenuate the impact of high intensity peaks in spectra with a moderate number of peaks, a general phenomenon we observed in metabolomics data in contrast to fragmentation spectra in proteomics.In this work, we analyzed DDA data with the following parameters: MS1 tolerance 15 ppm, MS2 tolerance 0.01 Da, dot product score threshold 0.5, ion chromatogram length between 3 and 60 seconds, maximum allowable difference of one second in RT for the ISF searching. We considered M−H adduct in negative ionization mode and M+H and M+Na adducts in positive ionization mode for metabolite standards, while we considered M−H, M–H2O−H, M+HCOO, 2M−H, M−2H in negative ionization mode and M+H, M+Na, M–H2O+H, M+NH4, 2M+H, M+2H, M+Li in positive ionization mode in the mouse liver data. These are provided as default parameters assuming a modern MS instrumentation. In the case of users analyzing data generated in low resolution MS instrument, we recommend re-specification of mass tolerances and ion chromatogram length accordingly.
Modified dot product score for the initial search against the reference spectral library
For the initial matching of an experimental MS/MS spectrum to reference spectra in a spectral library, we replace the peak intensity with the square root of the peak intensity in the regular dot product formula. This step reduces the impact of high-intensity peaks in the calculation of dot product score, which is suitable for MS/MS database search in metabolomics due to a typically small number of product ions in fragmentation spectra.Bi-directional dot product scores for the detection of ISFs
For each detected peak, we first search for a co-eluting parent compound with product ion spectrum using the apex RTs of precursor ion chromatograms. In this step, the MS/MS spectrum of the parent compound must contain a product ion peak at the same m/z value as the precursor ion m/z of the ISF, with minimum 10% of the height of the base peak. After identifying candidate parent ion-ISF pairs with XIC apex RT difference smaller than a user specified value (1 second by default), we perform dot product scoring. Instead of one-off dot product scoring using all product ions in the two spectra, we compute bi-directional dot products as follows. For the parent compound, we compute the dot product using the product ions present in the spectrum of the parent compound only. In turn, for the ISF, we compute the score using the product ions present in the spectrum of the ISF only. We take the maximum of the two scores as the final dot product score between the two spectra. In both cases, we discard all product ions whose m/z values are greater than the precursor ion m/z of the ISF. In the results table, MetaboKit bundles a parent compound and its ISF(s) into a “group” (the first column of the spreadsheet).Customized spectral library as a main output of the DDA module
The DDA module reports a single table summarizing consensus compound identification results across all the samples, with their precursor ion peak area, retention time of the apex, and the MS/MS matching score against the entry in the external spectral library. The DDA pipeline also produces a MS/MS spectral library in the .msp format, with annotation of average retention time across the samples in the given instrument setup. Each identified compound is one entry in the customized, associated with precursor monoisotopic m/z, adduct and dimer annotation, and the best scoring MS/MS and the median RT across the samples. These library entries are used either for targeted re-extraction of XICs at MS1 level from DDA data (using DDA-rex) or for targeted extraction of XICs at both MS1 and MS2 level from DIA data. In addition, we report all other MS/MS spectra with above-the-noise precursor ion XIC with no identification results in a separate file for user's inspection.DIA module and mapDIA analysis parameters
DIA scans were analyzed using the customized library obtained from DDA experiments with the following parameters in the DIA module: MS1 tolerance 15 ppm, MS2 tolerance 30 ppm, ion chromatogram length between 5 and 50 seconds, maximum allowable difference of 10 seconds in RT between library RT and peaks in each file, the Pearson correlation of XICs between precursor ion and product ion above 0.5, dot product score between library spectrum and experimental spectra above 0.5, and reporting up to 6 product ions.The DIA module of MetaboKit produces peak area values for precursor ions (MS1) and product ions (MS2). For the MS2-based quantitative summary using the mapDIA, product ions with average correlation above 0.2 (default) with other product ions of the same compound are retained for quantitative summary. mapDIA reports the sum of the peak area values of all selected product ions for each metabolite, and its statistical analysis module takes all product ion peak areas separately as input (without summing). Note that ISFs are quantified separately and their parent ions can be searched by the “group” identifiers.
Reference spectral libraries
We used the NIST2014 library, Human Metabolome Database (HMDB),13,18 MassBank,19 LIPIDBLAST,14,20 and all publicly available libraries listed in the MS-DIAL repository for the identification workflow in DDA analysis. The combined library has a total of 938![[thin space (1/6-em)]](https://www.rsc.org/images/entities/char_2009.gif) 926 spectra, representing 31125 unique compounds (treating structural isomers in lipids as one compound). MetaboKit reads the libraries and internally parses the precursor ion information and fragmentation spectra, where it recomputes the neutral, adduct-free, monoisotopic mass of each compound as the main representative data point. All libraries except the NIST library can be downloaded from their respective sources or by contacting the corresponding author of this paper. Due to its proprietary nature, the NIST library has to be purchased by the user and exported into .msp format.
926 spectra, representing 31125 unique compounds (treating structural isomers in lipids as one compound). MetaboKit reads the libraries and internally parses the precursor ion information and fragmentation spectra, where it recomputes the neutral, adduct-free, monoisotopic mass of each compound as the main representative data point. All libraries except the NIST library can be downloaded from their respective sources or by contacting the corresponding author of this paper. Due to its proprietary nature, the NIST library has to be purchased by the user and exported into .msp format.
MS-DIAL and XCMS online
We used default parameters for MS-DIAL software (version 3.9.0), with the same spectral library we used for MetaboKit throughout the paper. For XCMS Online, we used the option “UPLC/tripleTOF pos” option in the dropdown menu.Software and data availability
MetaboKit is an open-source command line tool, written in python language and distributed with binaries for all major OS platforms, including Microsoft Windows, Mac OS X, and Linux. The source code is freely available through GitHub repository at https://github.com/MetaboKit. The DDA and DIA-MS raw mass spectrometry data for metabolite standard mixture and mouse liver data were submitted to the MetaboLights repository (MTBLS1311 and MTBLS1266, respectively). The data can also be obtained by contacting the corresponding author.Results
Overview of MetaboKit workflows
MetaboKit consists of two major modules (Fig. 1). The DDA module performs compound identification and peak area integration for precursor ions from DDA analysis files (mzML format). The module searches monoisotopic mass of each precursor ion and its product ion MS/MS spectrum against a user-provided, gold-standard reference library simultaneously (Methods). The identification step creates a.msp formatted spectral library with (i) best scoring product ion spectra from the user's own experiments (across multiple samples), and (ii) median RT for each compound recorded in the current LC system. Similar to other approaches for warning or reporting the presence of ISFs,7,10 we screen ISFs by pairing peak features whose XICs are aligned at the same RT. However, our ISF search space is unique in that we only perform pairwise screening among the peaks with MS/MS fragmentation records. Our ISF screening is therefore intended to prevent false identifications via MS/MS search only. In this process, we have devised a score called bi-directional dot product score (0.5 or above by default, see Methods), which adapts the regular dot product score to the property that not all pairs of parent ion and ISF share all fragment ions, as verified by our single compound injection analysis (Fig. S1, ESI,† MS/MS spectra not shown due to large volume of images).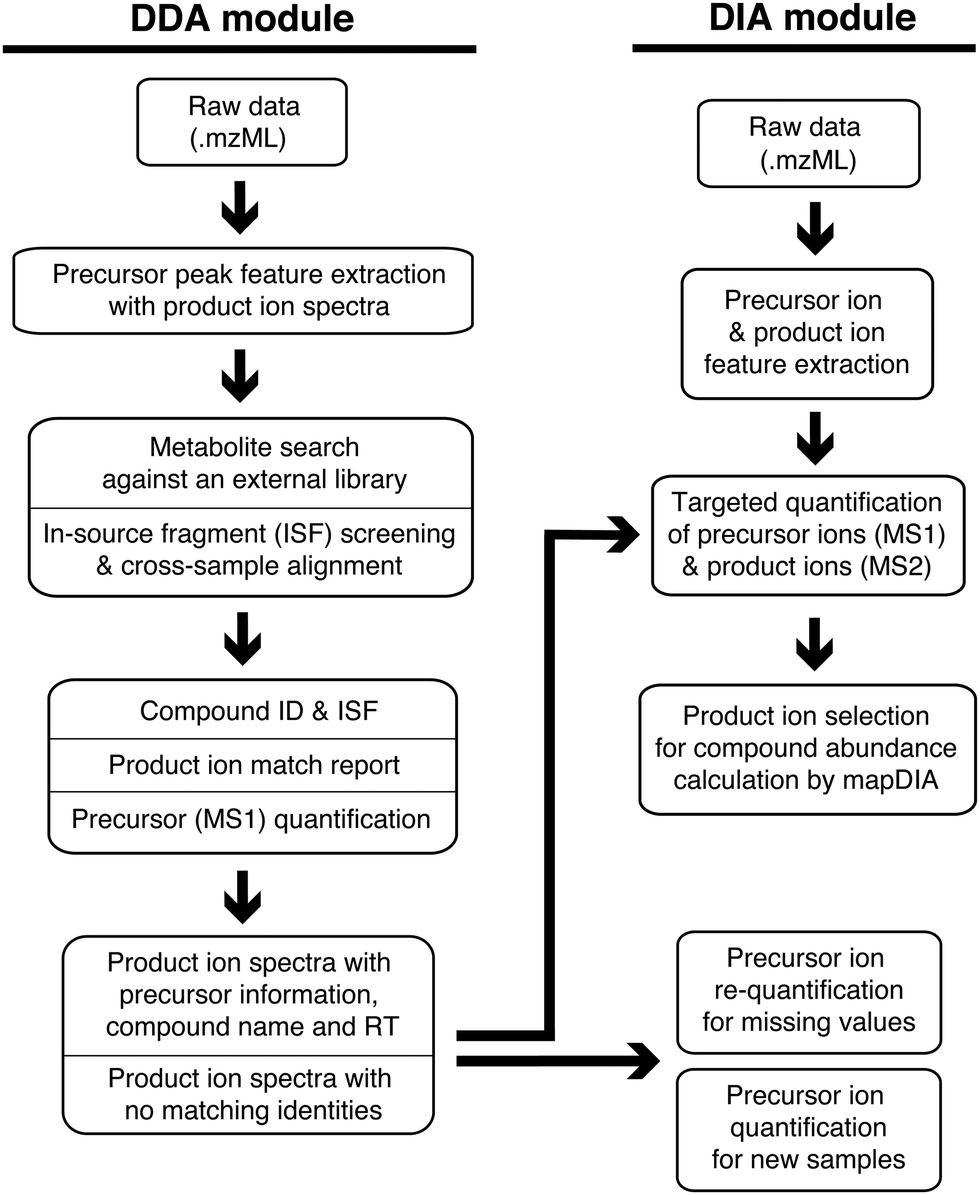 | ||
| Fig. 1 MetaboKit workflow. The left side and the lower right side of the diagram show the module for DDA-MS data, whereas the upper right side describes the module for DIA-MS data. The DDA module consists of steps dedicated for the compound identification and spectral library building, where the key information is the RT of compounds in the given chromatographic system. The DIA module focuses on peak area integration for precursor ions and product ions, and the latter peak area values are summed to represent a single quantitative summary per compound (mapDIA pipeline). | ||
When the user performs subsequent DIA experiments, the DIA module integrates peak areas of ion traces for precursor ions as well as product ions from DIA analysis files, assuming the use of the same LC system as the DDA analysis for RT matching. While we use peak area values of precursor ions from MS1 scans as the main modality for peak integration, we also integrate product ion peaks in DIA analysis, treating them as repeated measurements of the compounds. Optionally, the product ion data can be further processed by the mapDIA workflow, which selects the product ions for peak integration and performs missing data imputation, peak area summation from the qualifying product ions, and differential abundance analysis (Methods).21 All identification and peak area values are aligned across the samples and reported in a single spreadsheet. During the cross-sample alignment, the user can set parameters to take full control of key factors such as mass tolerance between samples and RT shifts in individual samples, although most parameters are optimized to function well in most high-resolution MS instrumentation setups.
Evaluation of compound identification from DDA analysis with metabolite standards
To evaluate the identification performance of the DDA module, we first analyzed a mixture of 91 metabolite standards with information dependent acquisition (a form of DDA) in triplicates (Methods). For each compound, we also generated a gold standard MS/MS spectrum and RT of each standard by single compound injection analysis, creating a list of 87 true positive identifications by LC-MS along with ISFs in the MS1 scans (Table S1, ESI†). We did not observe any XIC for the other four compounds in these experiments, indicating that they were likely degraded on the plate prior to analysis.Fig. 2a shows that MetaboKit identified 70 compounds in total (80% sensitivity), all with matching MS1 features and MS/MS spectra, showing equivalent performance to that of an alternative pipeline MS-DIAL5 (66 compounds, or 75% sensitivity), the software package most widely used for untargeted metabolomics data with DDA-MS and DIA-MS. In both software packages, nearly all detectable true positive compounds identified with MS/MS evidence exactly matched the RT from single compound analyses (Fig. 2b), verifying the high accuracy of MS/MS-based identifications of the two approaches (Table S2, ESI†). Another commonly used workflow XCMSonline for DDA experiments produced as few as 48 matches in the positive ion mode (UPLC/tripleTOF pos option, 55% sensitivity), including all peaks with any correct compound assignment that were annotated with multiple other compound names.
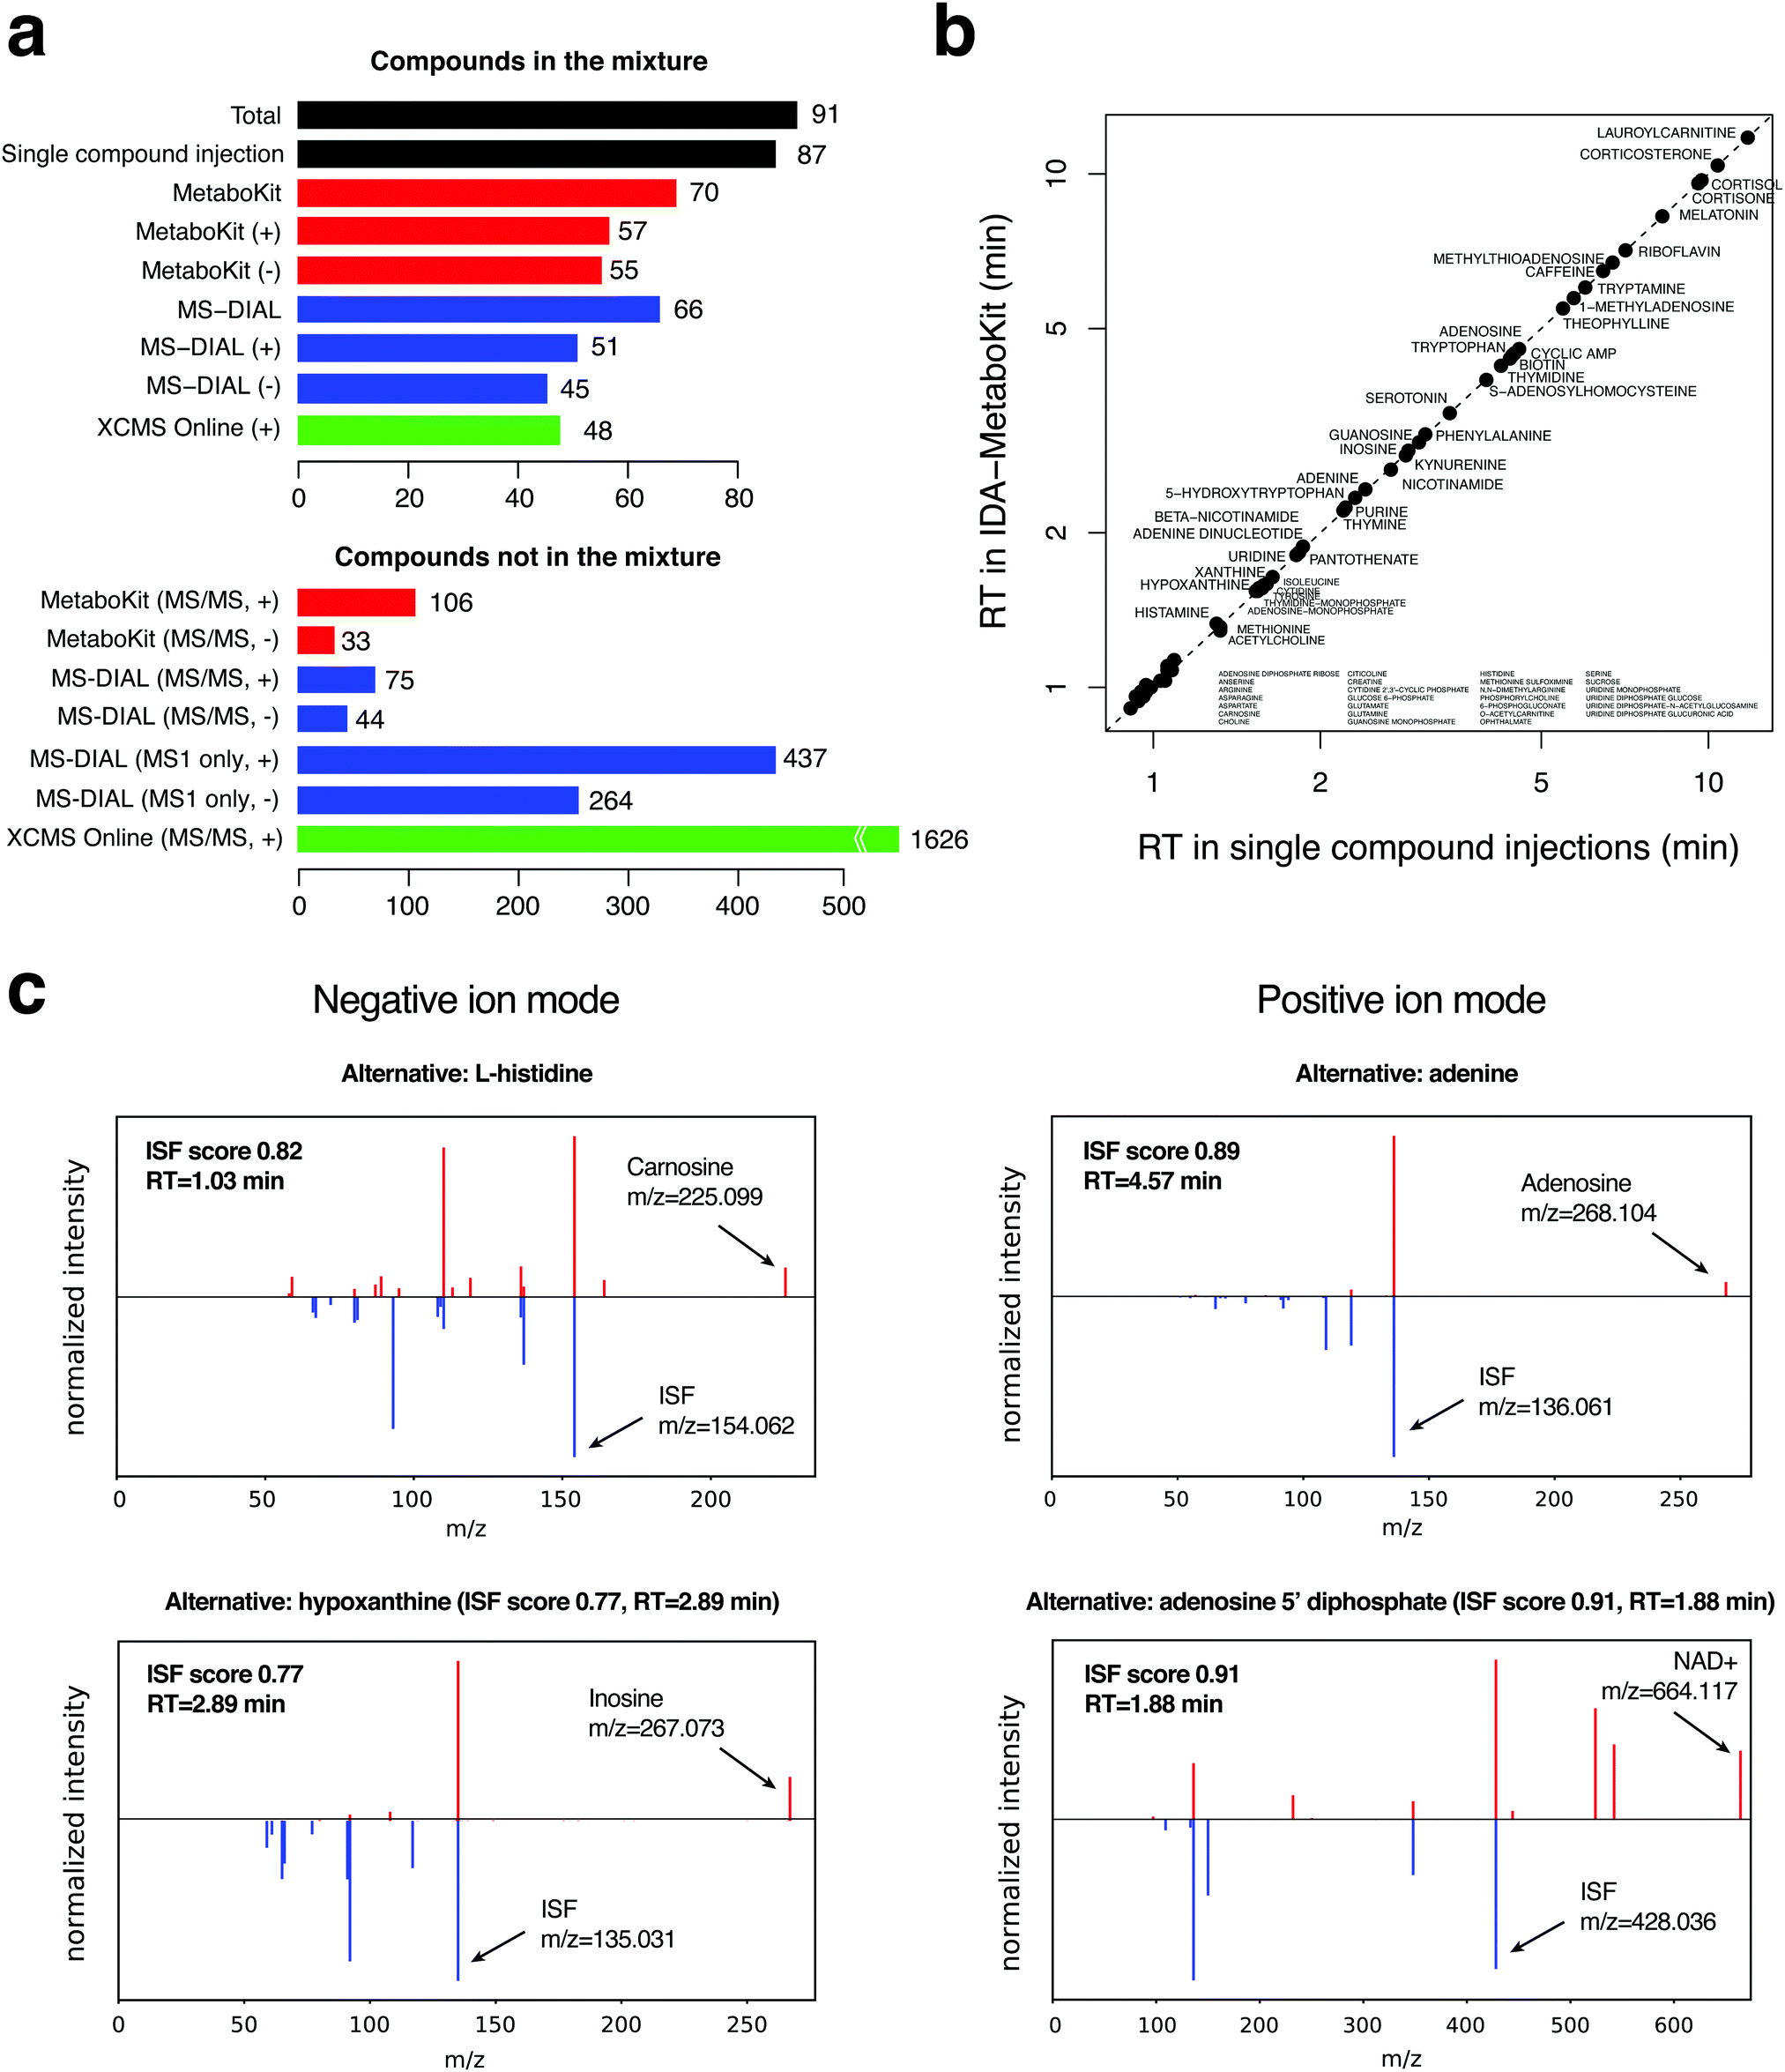 | ||
| Fig. 2 Identification results in the standard mix data. (a) Number of true and false identifications in the standard mix data, which contains 91 compounds in total. Any compound IDs not in the list of 91 were considered false identifications. (b) Retention time agreement between MetaboKit and single compound injection records. (c) Comparison of MS/MS spectra between ISFs and their parent ions detected at the same RT in negative and positive ion mode. The “Alternative” header in each panel refers to the incorrect compound ID that would have been reported if the same peak was not detected as an ISF. The scoring function for ISF is based on the appearance of precursor m/z peak in the fragmentation spectrum of a possible parent ion and the recovery of some, but not all, product ions between the two spectra. | ||
However, MetaboKit and MS-DIAL reported ∼110 additional compounds with MS/MS records that are not contained in the standard mixture (bottom of Fig. 2a). Assuming that our combined search space of 31125 unique compound names (see Methods) is a good representation of the human metabolome, reporting 110 additional compounds represents a specificity of 99.6%. However, it is indeed alarming that these compounds are still reported as identifications even in such a highly pure mixture of standards. It turns out that the majority of these records are degraded or oxidized products of the standards, or obvious chemical contaminants such as benzenesulfonic acids and dibutyl phthalate (Table S2, ESI†).
What is more surprising is that MS-DIAL also reported ∼700 identifications without MS/MS evidence. However, only one of those records represented one of the 91 standards, which underscores the importance of systematic MS/MS scans in untargeted analysis. Had we included these identifications into consideration, the specificity for MS-DIAL's identification results would have dropped from 99.6% to 97.4%. Considering that the majority of the 31125 compounds shouldn’t be present in our mixture and 1% specificity represents as many as over three hundred compounds, this is a serious drop in specificity. Even more surprisingly, XCMSonline's positive ion mode analysis reported as many as 1626 unique compound names by matching to METLIN's MS/MS records, which results in an alarmingly low level of specificity (95%) once we include identifications solely based on MS1 evidence.
MetaboKit circumvents erroneous assignment of ISFs to incorrect compound names by MS/MS matching
As outlined earlier, MetaboKit offers detection of ISFs after the initial identification step only for the ions with MS/MS records, as our basis of compound identification requires MS/MS spectrum matching (Methods). To this end, we designed a sensitive scoring algorithm called “bi-directional” dot product, tuned to adapt to partially consistent fragmentation patterns between a parent compound and its ISF (see Methods). In our workflow, for an ion to be called an ISF, it must co-elute with the candidate parent ion, and the peak height of a candidate ISF must be at least 10% of the base peak in the MS/MS spectrum of the parent compound. Once these conditions are met, the bi-directional dot product is calculated between the two ions. With this multi-faceted scoring approach, MetaboKit detected 40 ISF peaks of true positive metabolite standards (10 in negative mode, 30 in positive mode, and all of them were verified by single compound injection data in Table S1 (ESI†)). More than 58% of them would have been matched to incorrect compound names by MS/MS searching if it were not for the additional screening for ISFs (Fig. 2c).We next compared the ISF detection behavior to that of MS-DIAL and XCMSonline. For MS-DIAL, although the software does not explicitly call ISFs, it offers a warning that reads “found in higher mz's MsMs” in the post curation field, with or without alternative compound name assigned to the same record. We considered a MS/MS-based match record as ISF in MS-DIAL's output only if the peak was not assigned any compound identity but given the aforementioned warning. Likewise, XCMSonline is said to apply the MISA algorithm according to their recent paper,7 which uses spectral matching to low collision energy spectra stored in the METLIN database. However, their final compound identification report did not explicitly indicate which peak under a peak group corresponds to an ISF. Similar to MS-DIAL, we thus considered a peak as an ISF if the peak was not assigned any other alternative compound name and is under a peak group for another compound of a larger mass.
Table S1 (ESI†) shows that the overlap is modest among the detected ISFs by all three methods in comparison, with 48% of ISFs reported by MetaboKit overlapping with either of the two tools. One source of the difference between XCMSonline and the other two methods was the coverage of correctly identified compounds, where both MetaboKit and MS-DIAL detected a large number of compounds correctly while XCMSonline did not. Interestingly, when we expanded the ISF calls by including the peaks with other compound names (all incorrect identifications) assigned by MS-DIAL with the aforementioned warning signs or XCMSonline with assignment under a peak group, the expanded list of ISFs in those tools exploded to a staggering number of >100 (MS-DIAL) and >1000 ISF events (XCMSonline), most of which were not present in the single compound injection data. Therefore, we can conclude that MetaboKit's ISF calling algorithm is substantially more conservative than the other two methods, but the selected ISFs were all validated by single compound injection analysis.
The result can be explained by the fact that MetaboKit's search space for ISFs is limited to those peaks with MS/MS spectra only, as the purpose of our ISF detection is to rule out incorrect compound assignment to those peaks when compound identification requires MS/MS matching. After all, twenty three of the forty ISFs reported by MetaboKit would have been matched to incorrect compounds by MS/MS matching to external libraries. It is therefore safe to conclude that MetaboKit's ISF screening detects highly specific ISFs with credible MS/MS evidence and prevents incorrect compound assignment by MS/MS searching, but it does not detect other ISFs that do not generate high quality MS/MS spectra.
Handling of ISFs in complex mouse liver samples
We also analyzed whole liver tissue samples from five cyclin dependent kinase 1 knock-out mice (Cdk1Liv−/− mice)16 and five wild-type mice (WT) with DDA-MS modes of scans. The liver samples from the Cdk1Liv−/− mice exhibited pronounced phenotype of metabolic dysregulation with visible deposit of fats across the tissue. To ensure a good coverage of lipids, we first performed two different compound extractions (aqueous and organic fractions, see Methods) and analyzed them separately in both positive and negative ionization modes.Allowing for duplicate records between the four analyses (positive and negative ion modes with aqueous and organic fractions), MetaboKit identified a total of 1818 unique matches to the external libraries from the DDA analysis (Table S3, ESI†). We compared the identification results with MS-DIAL software, where we discarded all identification results without MS2 matching. After matching the results at the same m/z and RT coordinates, MetaboKit reported identifications for >770 more peaks than MS-DIAL based on product ion spectrum matching across the four files (Fig. S2, ESI†). The full table containing identification results can be found in Table S3 (ESI†).
We observed that MetaboKit's ISF screening detected 209 ISFs across the data sets (MetaboKit analysis tabs, Table S3, ESI†). Similar to the metabolite standard mix data, the corresponding records in MS-DIAL were listed as other compound names with “found in higher mz's MsMs” annotation in the post curation field. However, the two packages did not disagree on the identity of compounds in many cases. In the organic fraction of the first wild type mouse liver, for example, MS-DIAL reported cholesterol (H2O loss) at three different locations with m/z = 369.3512. In contrast, MetaboKit identified the same peak as an ISF of cholesterol with NH4 adduct (M+NH4, m/z = 404.3872) at 3.7 min and as an ISF of CE 18:1 at 6.73 min based on bidirectional dot product scoring (Fig. 3a and Fig. S3, ESI†). At 6.57 min, it also reported the original parent compound CE 18:2, but not the ISF at m/z = 369.3514 due to low matching score. The same identification results were replicated in another mouse sample (KO1), and therefore the DDA-based spectral library had records of cholesterol at 3.7 min and CEs at their respective time points after 6 min.
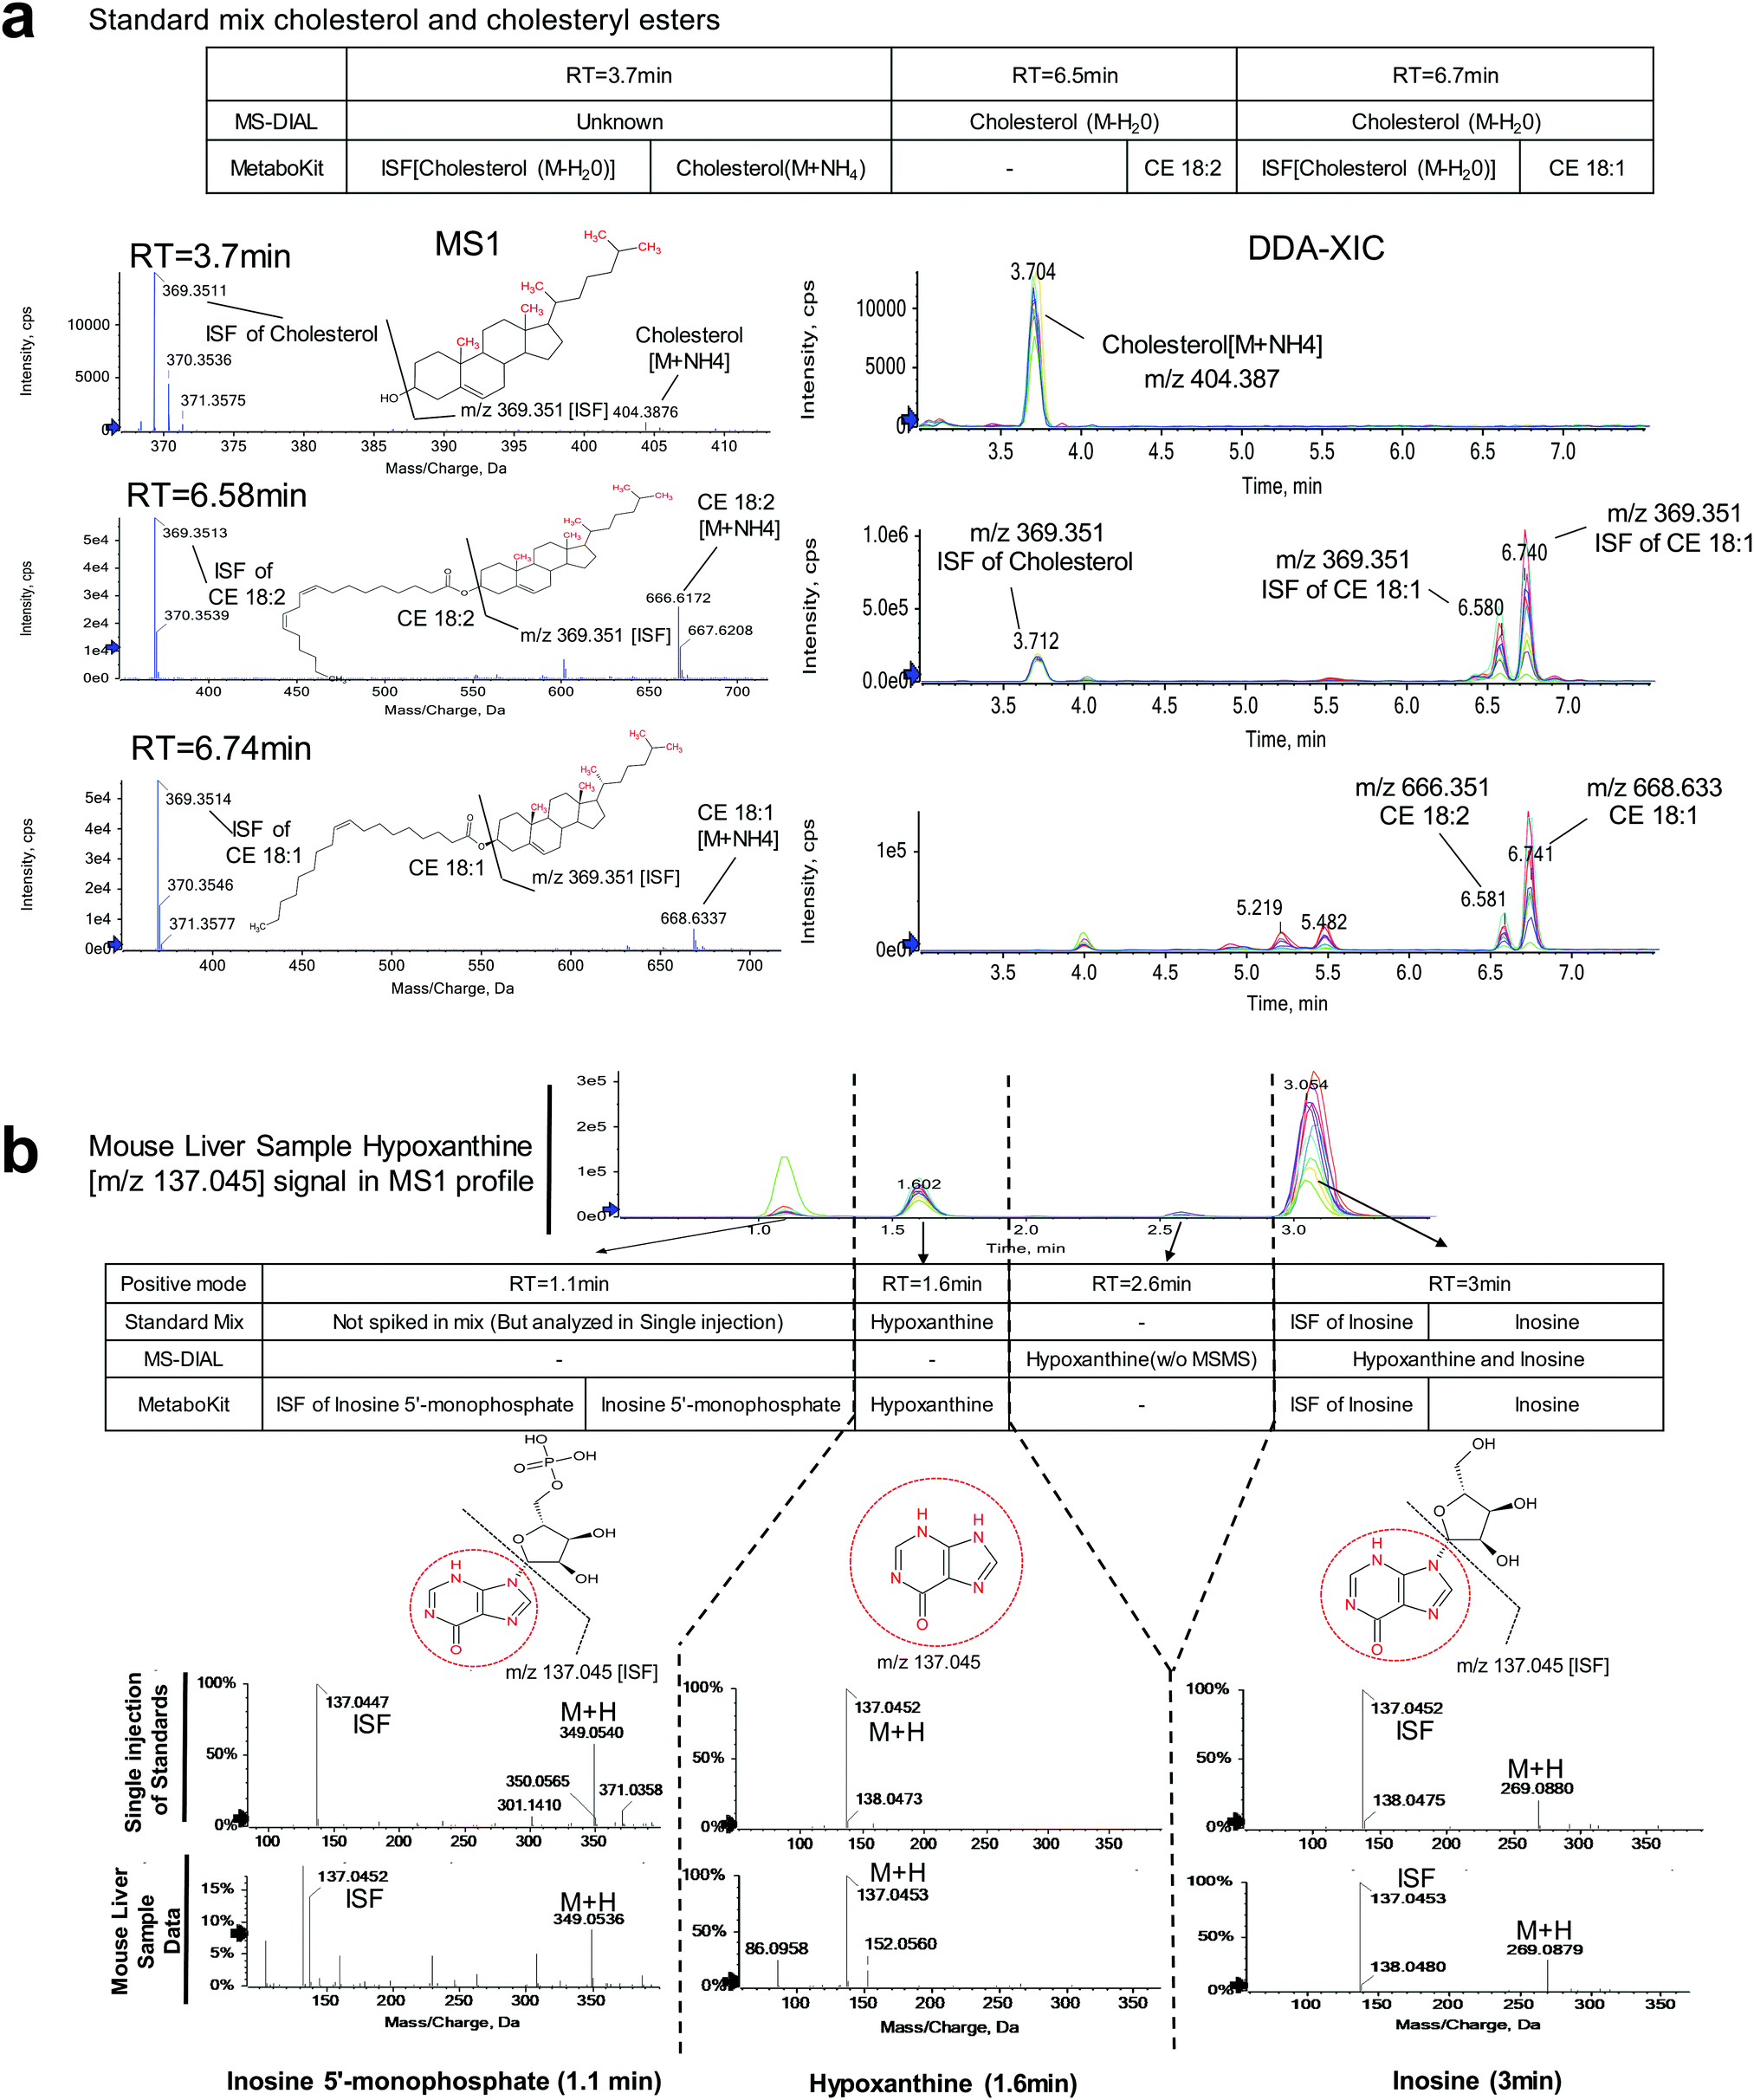 | ||
| Fig. 3 Identification of ISFs in DDA in MetaboKit in comparison to MS-DIAL. (a) In the third WT mouse liver sample, cholesterol compound with NH4 adduct (m/z = 404.3872) generates an ISF (m/z = 369.3512) at 3.7 min with water loss; cholesterol ester CE 18:2 generates another ISF (m/z = 369.3514) at 6.57 min, and CE 18:1 generates an ISF (m/z = 369.3514) at 6.73 min. MS-DIAL reports cholesterol with water loss at all three RTs. In contrast, MetaboKit detected both CEs at their respective RTs, with detection of ISF for the CE 18:1 compound. (b) In the case of hypoxanthine, four peaks detected at m/z = 137.045 at distinct RTs. At 1.6 min, hypoxanthine peak was identified (confirmed by standard), yet two other peaks were an ISF of inosine 5′ monophosphate (1.1 min) and an ISF of inosine (3 min, confirmed by standard). MS-DIAL software reported hypoxanthine and inosine at 3 min and reported hypoxanthine at 2.6 min without MS/MS evidence. MetaboKit correctly identified the three major peaks. | ||
A more complex case arose in hypoxanthine, an endogenous purine derivate. In the DDA analysis of the sample from the third wild type mouse, four peaks were detected at m/z = 137.045 (Fig. 3b). MS-DIAL software detected hypoxanthine at 2.6 min without MS/MS evidence and hypoxanthine and inosine at 3 min. By contrast, MetaboKit called the peak at 3 min as ISF of inosine, and correctly identified hypoxanthine based on MS/MS evidence at 1.6 min. Further, it also detected a highly abundant peak at 1.1 min as an ISF of inosine 5′monophosphate, with separate identification of the parent compound, resulting in more reliable identification results and producing a library entry with more precise RT in the DDA-based spectral library. More importantly, the single compound injection analysis of metabolite standards confirmed all aforementioned identifications, with hypoxanthine at 1.6 min and inosine at 3 min in the same LC-MS instrumentation.
MS1 and MS2-level quantification in DIA-MS analyses
To evaluate the potential of MS1 and MS2 level peak integration as quantitative analysis in DIA-MS, we next created the same standard mixture in a series of six input concentrations ranging from 10 ng ml−1 to 500 ng ml−1 (Table S4, ESI†) and computed peak areas for the compounds and their ISFs at both MS1 and MS2 levels. To derive a quantitative summary for MS2-based peak integration, we rolled up the peak areas of the product ions to a single summary value for each metabolite using the mapDIA pipeline (see Methods), where we selected up to two product ions as quantifiers of compounds.Fig. 4a shows the boxplot of Pearson correlation between all detected 69 compounds and the input concentrations, using precursor ion (MS1) and product ion (MS2) peak area data from the DIA data. As expected, peak area data at both levels produced high correlations (>0.99) for most of those compounds, although the correlation was lower for the MS2 data (product ions). For the compounds with detected ISFs, we discovered that MS1-level peak integration of ISFs is often as reliable as that of the parent compound in most compound standards, especially when the peak area values are greater in the former than in the latter (see quality metric tabs in Table S4, ESI†), and the frequency of quantifiable signals should be present in all samples. By contrast, MS2-level peak integration of ISFs produced alarmingly low correlations with input concentrations (Fig. 4b) and low coefficient-of-variation (evaluated at each input concentration). In the Table S4 (ESI†), we have highlighted the compounds in which MS1 peak area of the ISF can be a suitable alternative to that of the precursor ion (gray colored compounds in the “_Quality” tabs). This is also well reflected in the heatmaps of all parent ions of the compounds whose peaks were integrated at the MS1 (Fig. 4c) and MS2 levels (Fig. 4d), and in the heatmap of ISF peaks with peak integration at the MS1 level (Fig. 4e).
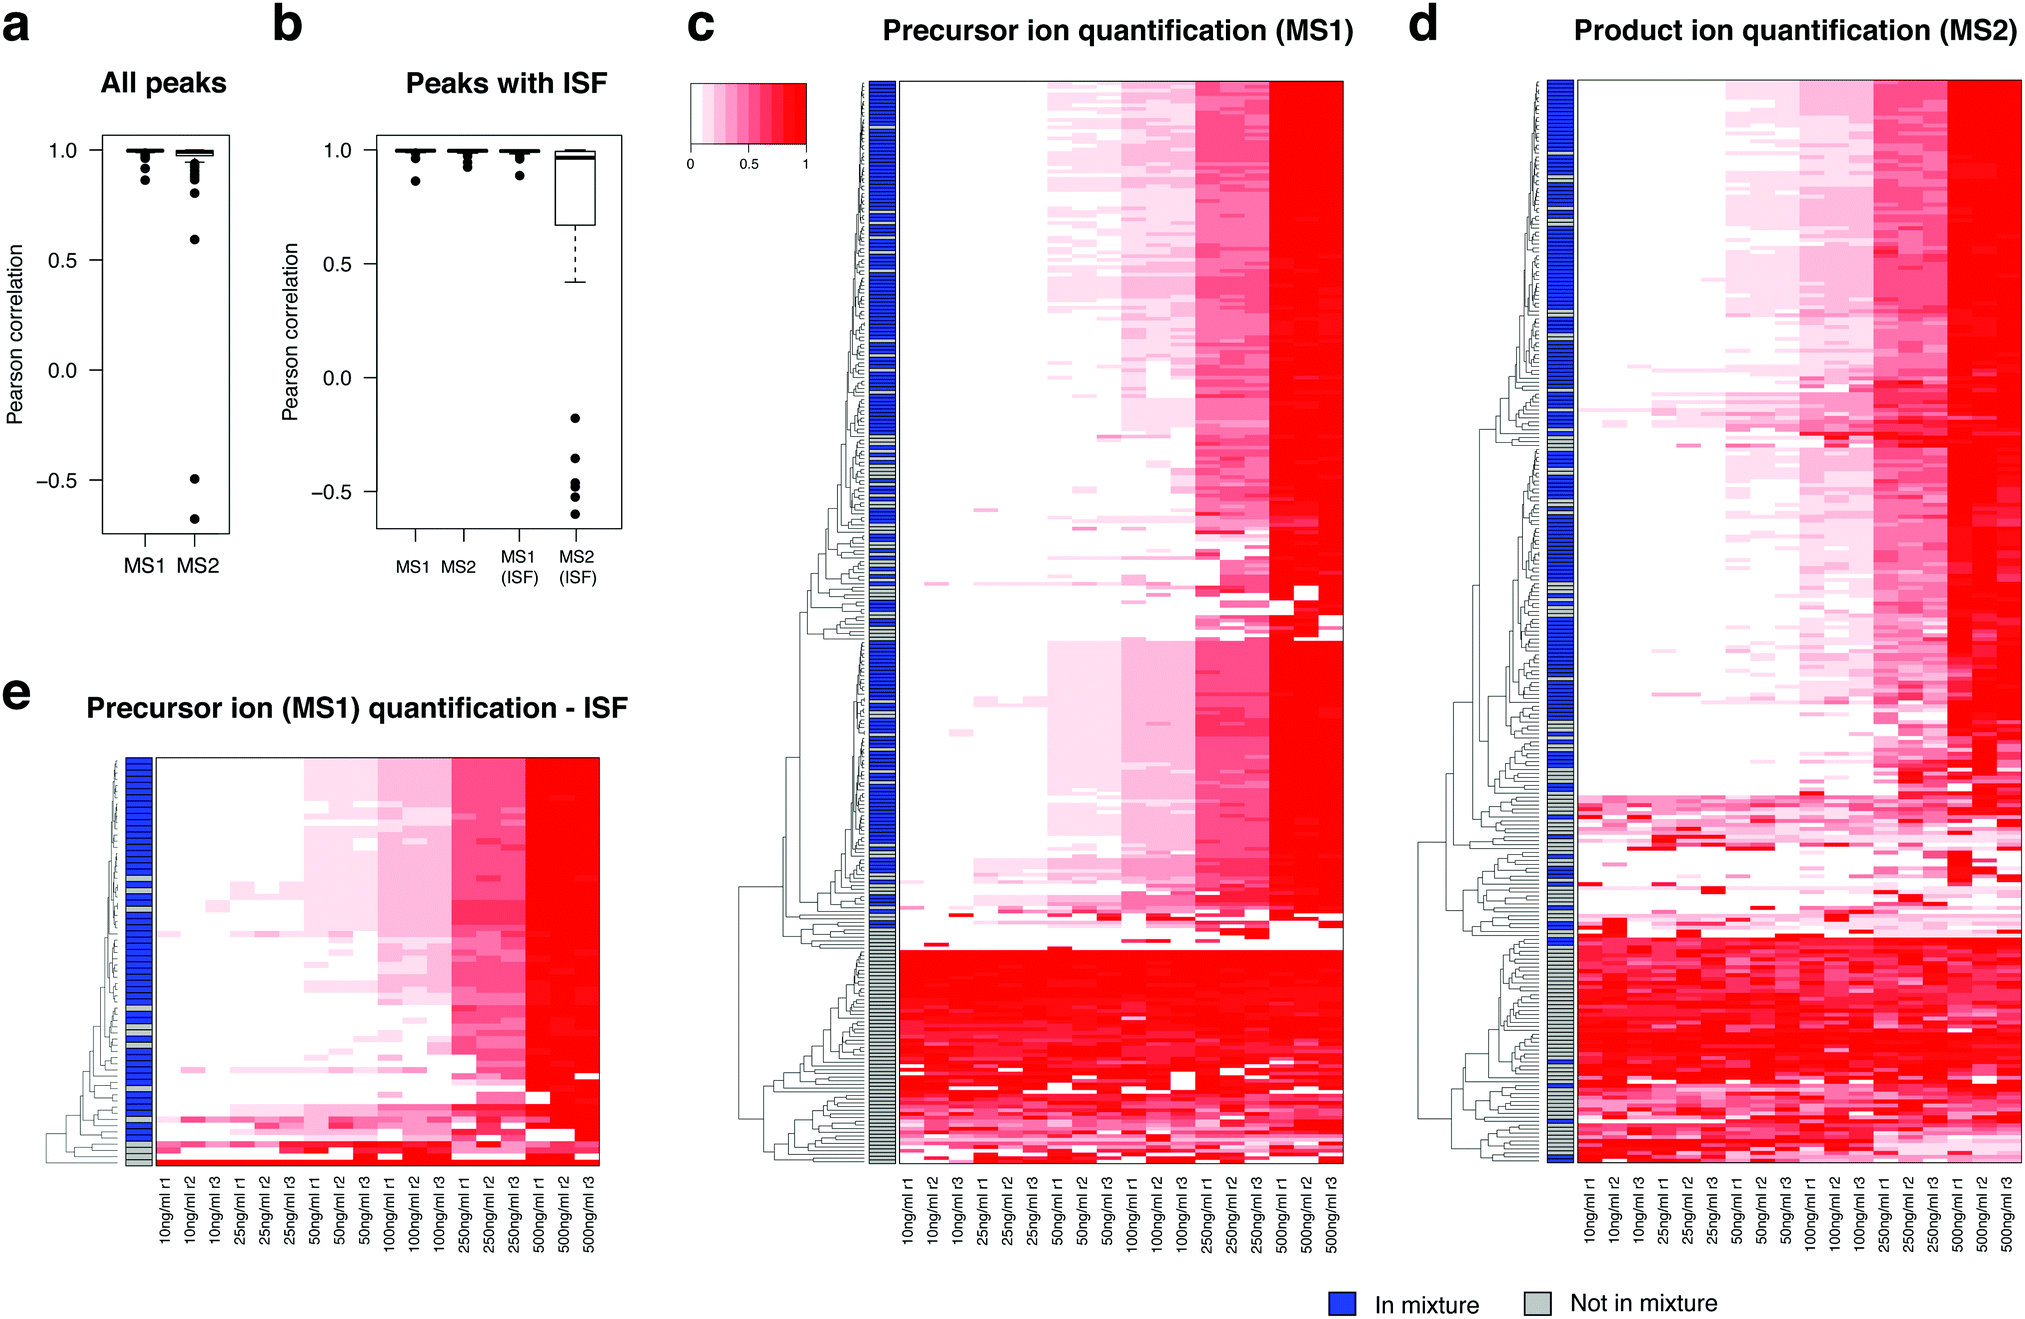 | ||
| Fig. 4 DIA-MS analysis of the dilution series of the standards. (a) Pearson correlation coefficients for the compound concentrations against input concentrations. Both precursor ion data and product ion data yield high correlation for most detected metabolite standards. (b) Pearson correlation coefficients for precursor ion and product ion data against input concentrations for ISFs and their corresponding parent compounds. (c) Heatmap of precursor ion peak area data. (d) Heatmap of product ion peak area data. (e) Heatmap of precursor ion peak area data for ISF peaks. In the three heatmaps, the compounds present in the metabolite mixture are indicated by blue side bar on the left-hand side. | ||
We have also evaluated the additional value of product ion peak areas in the DIA analysis of the mouse liver data (Table S5, ESI†). As expected, the quality of XICs was not universally high for all product ions (data not shown due to large volume of data). However, our hypothesis was that the sum of peak areas of product ions, if carefully selected, can be a reliable quantifier signal in untargeted analyses, and that a statistical analysis approach implemented in the mapDIA software,21 treating each product ion's peak area as repeated measure of abundance, can yield robust differential analysis with good sensitivity and specificity. Using precursor ion data and product ion data separately, we performed differential abundance analysis between Cdk1Liv−/− mice and wild-type mice.
Fig. 5a shows that precursor ion and product ion peak integration produce highly similar fold change estimates in the comparison of Cdk1 knockout and wildtype mice, even with moderate sample size (n = 5 per group). In addition, the fold change estimates are also highly similar between parent ions and their ISFs (Fig. 5b), further supporting the idea of using MS1 peak integration of ISF if the ISF is detected in greater abundance levels than the parent ion. Fig. 5c and d show the heatmap of precursor ion peak areas and product ion peak area sums for 990 and 870 compounds, respectively. The number of compounds with selected peak area data was smaller in the product ion-based peak area data since mapDIA applies rigorous quantifier selection criteria (Methods) for internal consistency of product ions as well as the per group missing data proportion criterion (at least 3 observations per group in the analysis). In addition, in as many as 105 peaks, we were able to integrate peak areas for product ions but not precursor ions. Close inspection of the data revealed that the peak shape of precursor ions was close to the noise level for these compounds, while the product ion chromatograms were clearly above the noise and their library matching scores were high (>0.8). This observation suggests that additional peak integration from product ions can increase the coverage of reliably quantified compounds in complex sample analysis.
 | ||
| Fig. 5 Analysis of the mouse liver data. (a) Fold changes in the Cdk1Liv−/− mice compared to the wild type mice (logarithm, base 2) with annotation of statistical significance using the precursor ion peak area data (horizontal axis) and the product ion peak area data (vertical axis). (b) Comparison of the fold changes between parent compounds and their ISFs using precursor ion peak area data. (c) Heatmap of 990 compounds with precursor ion peak area data (MS1). (d) Heatmap of 870 compounds with product ion peak area data (MS2). In both heatmaps, the black tick marks on the left side indicates statistical significance of differential metabolite abundance at 5% FDR. | ||
In addition, the statistical power to detect differential signals was substantially stronger in the product ion peak area data than the precursor ion data, owing to the presence of two or more readouts and the power of statistical averages. The black tick marks on the left side of each heatmap (Fig. 5c and d) indicates which metabolites are differentially abundant between KO and WT liver samples. At the same estimated type I error rate (FDR 5%), the comparison using the product ion data results in greater number of metabolites that can be detected. These changes included elevation of various lipid species (tri- and di-glycerides, lyso-phosphatidylcholines, oxidized glycerolipids, and ceramides) and fatty acids, oxidized fatty acids, prostaglandins, acylcarnitines, glucose and fructose, urate, uridine, inosine and vitamin C, and depletion of ergothioneine, the reduced form of glutathione, retinol, and acetyl-carnitine (Table S5, ESI†), suggesting significant accumulation of fats and dysregulation of mitochondrial function leading to elevated oxidative stress in the liver tissue.15
Discussion
In this paper, we presented a new software package that addresses gaps in current data processing workflows for untargeted metabolomics analysis. MetaboKit shares many common functionalities implemented in other popular software packages such as MS-DIAL and XCMS Online. However, one of MetaboKit's unique capabilities is the production of spectral libraries populated with MS1 and MS2 information from the user's own data, fully customized to instrumentation setup in each laboratory. Using MetaboKit's functionalities, this library can be refined over time as more experimental spectra are accrued from the same instrument, and all future experiments can be analyzed using the customized in-house library.Another strength of MetaboKit is its data-driven screening of ISFs on the peaks with MS/MS scans, which has been increasingly noticed and addressed in recent metabolomics literature.6–8 We confirmed that these ISFs indeed occur frequently through the single compound injection analysis of metabolite standards, which were replicated in the standard mix and in the mouse liver tissue analysis at exactly the same RTs. Simultaneous MS/MS-based identifications for any pair of co-eluting precursor ions (i.e. at the same RT) almost surely allude to the presence of in-source fragmentation, and if not screened carefully, they can easily be mistaken as different compounds. We have shown that our MS/MS-driven ISF detection clearly prevents incorrect compound assignments in tens of cases in a modestly sized experiment, providing high specificity of detection. However, other methods such as the MISA algorithm (XCMSonline) or the post hoc curation comments offered by MS-DIAL may be able to provide a more extensive list of ISFs, especially for those ions that do not produce MS/MS spectra in the DDA analysis. MetaboKit does not consider these cases because its compound identification requires MS/MS-based matching and this stringent identification requirement already narrows down the possibility of incorrect identification due to the presence of ISFs.
In MetaboKit, the spectral library building process produces another .msp formatted file that contains unannotated MS/MS spectra, which are usually not reported in other software packages. We provide this information so that the users can review the unmatched product ion spectra with associated precursor ion information and “copy and paste” some of the spectra that they can manually annotate from prior data or MS1 information back into the main spectral library. This option opens the possibility for the users to edit the spectral library and we expect it to play an important role for investigators who seek to build libraries for specialized compounds, such as lipids.
MetaboKit comes with a wide range of parameters that can be further optimized in a given instrumentation setup. However, most of these parameters are provided with recommended default values, and most parameters are calibrated in a sensible range of values. For instance, we have observed that the dot product scores in the compound identification step produce best results with the score threshold 0.5 (based on the standard mix data and multiple other data sets not shown). MS1 tolerance should be set between 10 and 20 ppm to avoid false positive identification in high-resolution MS data, whereas MS2 mass tolerance can be relaxed to a generous level, e.g. 0.01 Da. By contrast, some parameters can be relaxed from the suggested default values, such as the allowable RT shift, especially in large-sample analyses (default 10 seconds). The number of minimum matching peaks in the initial identifications can be relaxed from two product ions to one (one matching peak), and this can lead to increased identification of compounds with single major fragment ion. The parameters that may need more occasional tuning include: (i) the list of adduct ions to be considered, (ii) RT shift parameter for post-identification alignment of signals, and (iii) the length of ion chromatograms (in seconds). For example, adding more adduct ions in the search space may increase the number of identifications, but the improvement in sensitivity may be offset by decreased specificity. The last parameter can be broadened if the ion chromatogram is on average extremely short for faster analysis.
Lastly, we demonstrated the peak integration of ISFs and product ions as additional source of metabolite quantification in DIA experiments, similar to proteomics applications.22 Although multiple representations of the same metabolite may be confusing for interpretation, our design philosophy is to extract all possible opportunities for quantitation for each metabolite and allow the users to select the mode of quantification for each compound based on other objective quality metrics, such as signal-to-noise ratio of XICs in each sample and/or coefficient of variation computed from replicate analysis of a control sample. We leave this to our immediate future work.
Author contributions
P. N. and H. C. conceived the idea and designed the experiments. G. T. and H. C. developed MetaboKit software. P. N. generated the metabolite standards mixture and performed sample extraction and mass spectrometry analysis. A. L. assisted with conceptualization of ISF detection throughout the work. J. O. and P. K. prepared and provided the mouse liver samples. S. T. and H. C. supervised the overall project. P. N. and H. C. wrote the manuscript with input from all authors.Conflicts of interest
P. N., A. L. and S. T. are full-time employees of SCIEX. The remaining authors declare that the research was conducted in the absence of any commercial or financial relationships that could be construed as a potential conflict of interest.Acknowledgements
This work was supported in part by grants from Singapore Ministry of Education (MOE2018-T2-2-058 to H. C.), National Medical Research Council of Singapore (NMRC-CG-M009 and NMRC-OF-LCG 2017 to H. C.), A*STAR (IAF-ICP I1901E0040 to H. C.) and support from SCIEX. We thank Xueli Guan and Megan Lee for rigorous beta-testing of the software and valuable suggestions to improve the workflow.References
- R. Bonner and G. Hopfgartner, Bioanalysis, 2016, 8, 1735–1750 CrossRef CAS PubMed.
- T. Bruderer, E. Varesio, A. O. Hidasi, E. Duchoslav, L. Burton, R. Bonner and G. Hopfgartner, Anal. Bioanal. Chem., 2018, 410, 1873–1884 CrossRef CAS PubMed.
- G. Chen, S. Walmsley, G. C. M. Cheung, L. Chen, C. Y. Cheng, R. W. Beuerman, T. Y. Wong, L. Zhou and H. Choi, Anal. Chem., 2017, 89, 4897–4906 CrossRef CAS PubMed.
- H. Li, Y. Cai, Y. Guo, F. Chen and Z. J. Zhu, Anal. Chem., 2016, 88, 8757–8764 CrossRef CAS PubMed.
- H. Tsugawa, T. Cajka, T. Kind, Y. Ma, B. Higgins, K. Ikeda, M. Kanazawa, J. VanderGheynst, O. Fiehn and M. Arita, Nat. Methods, 2015, 12, 523–526 CrossRef CAS PubMed.
- R. Chaleckis, I. Meister, P. Zhang and C. E. Wheelock, Curr. Opin. Biotechnol., 2019, 55, 44–50 CrossRef CAS PubMed.
- X. Domingo-Almenara, J. R. Montenegro-Burke, C. Guijas, E. L. Majumder, H. P. Benton and G. Siuzdak, Anal. Chem., 2019, 91, 3246–3253 CrossRef CAS PubMed.
- O. Senan, A. Aguilar-Mogas, M. Navarro, J. Capellades, L. Noon, D. Burks, O. Yanes, R. Guimera and M. Sales-Pardo, Bioinformatics, 2019, 35, 4089–4097 CrossRef CAS PubMed.
- R. Tautenhahn, G. J. Patti, D. Rinehart and G. Siuzdak, Anal. Chem., 2012, 84, 5035–5039 CrossRef CAS PubMed.
- P. M. Seitzer and B. C. Searle, J. Proteome Res., 2019, 18, 791–796 CrossRef CAS PubMed.
- H. Zha, Y. Cai, Y. Yin, Z. Wang, K. Li and Z. J. Zhu, Anal. Chem., 2018, 90, 4062–4070 CrossRef CAS PubMed.
- C. A. Smith, G. O'Maille, E. J. Want, C. Qin, S. A. Trauger, T. R. Brandon, D. E. Custodio, R. Abagyan and G. Siuzdak, Ther. Drug Monit., 2005, 27, 747–751 CrossRef CAS PubMed.
- D. S. Wishart, D. Tzur, C. Knox, R. Eisner, A. C. Guo, N. Young, D. Cheng, K. Jewell, D. Arndt, S. Sawhney, C. Fung, L. Nikolai, M. Lewis, M. A. Coutouly, I. Forsythe, P. Tang, S. Shrivastava, K. Jeroncic, P. Stothard, G. Amegbey, D. Block, D. D. Hau, J. Wagner, J. Miniaci, M. Clements, M. Gebremedhin, N. Guo, Y. Zhang, G. E. Duggan, G. D. Macinnis, A. M. Weljie, R. Dowlatabadi, F. Bamforth, D. Clive, R. Greiner, L. Li, T. Marrie, B. D. Sykes, H. J. Vogel and L. Querengesser, Nucleic Acids Res., 2007, 35, D521–D526 CrossRef CAS PubMed.
- T. Kind, K. H. Liu, D. Y. Lee, B. DeFelice, J. K. Meissen and O. Fiehn, Nat. Methods, 2013, 10, 755–758 CrossRef CAS PubMed.
- M. J. Caldez, N. Van Hul, H. W. L. Koh, X. Q. Teo, J. J. Fan, P. Y. Tan, M. R. Dewhurst, P. G. Too, S. Z. A. Talib, B. E. Chiang, W. Stunkel, H. Yu, P. Lee, T. Fuhrer, H. Choi, M. Bjorklund and P. Kaldis, Dev. Cell, 2018, 47, 425–438 e425 CrossRef CAS PubMed.
- M. K. Diril, C. K. Ratnacaram, V. C. Padmakumar, T. Du, M. Wasser, V. Coppola, L. Tessarollo and P. Kaldis, Proc. Natl. Acad. Sci. U. S. A., 2012, 109, 3826–3831 CrossRef CAS PubMed.
- E. G. Bligh and W. J. Dyer, Can. J. Biochem. Physiol., 1959, 37, 911–917 CrossRef CAS PubMed.
- D. S. Wishart, C. Knox, A. C. Guo, R. Eisner, N. Young, B. Gautam, D. D. Hau, N. Psychogios, E. Dong, S. Bouatra, R. Mandal, I. Sinelnikov, J. Xia, L. Jia, J. A. Cruz, E. Lim, C. A. Sobsey, S. Shrivastava, P. Huang, P. Liu, L. Fang, J. Peng, R. Fradette, D. Cheng, D. Tzur, M. Clements, A. Lewis, A. De Souza, A. Zuniga, M. Dawe, Y. Xiong, D. Clive, R. Greiner, A. Nazyrova, R. Shaykhutdinov, L. Li, H. J. Vogel and I. Forsythe, Nucleic Acids Res., 2009, 37, D603–D610 CrossRef CAS PubMed.
- H. Horai, M. Arita, S. Kanaya, Y. Nihei, T. Ikeda, K. Suwa, Y. Ojima, K. Tanaka, S. Tanaka, K. Aoshima, Y. Oda, Y. Kakazu, M. Kusano, T. Tohge, F. Matsuda, Y. Sawada, M. Y. Hirai, H. Nakanishi, K. Ikeda, N. Akimoto, T. Maoka, H. Takahashi, T. Ara, N. Sakurai, H. Suzuki, D. Shibata, S. Neumann, T. Iida, K. Tanaka, K. Funatsu, F. Matsuura, T. Soga, R. Taguchi, K. Saito and T. Nishioka, J. Mass Spectrom., 2010, 45, 703–714 CrossRef CAS PubMed.
- T. Cajka and O. Fiehn, Methods Mol. Biol., 2017, 1609, 149–170 CrossRef CAS PubMed.
- G. Teo, S. Kim, C. C. Tsou, B. Collins, A. C. Gingras, A. I. Nesvizhskii and H. Choi, J. Proteomics, 2015, 129, 108–120 CrossRef CAS PubMed.
- L. C. Gillet, P. Navarro, S. Tate, H. Rost, N. Selevsek, L. Reiter, R. Bonner and R. Aebersold, Mol. Cell. Proteomics, 2012, 11, O111.016717 CrossRef PubMed.
Footnotes |
| † Electronic supplementary information (ESI) available. See DOI: 10.1039/d0mo00030b |
| ‡ These authors contributed equally to this work. |
| This journal is © The Royal Society of Chemistry 2020 |