
 Open Access Article
 This Open Access Article is licensed under a
 Creative Commons Attribution 3.0 Unported Licence
Within-species variation in OMV cargo proteins: the Myxococcus xanthus OMV pan-proteome†
Allison S.
Zwarycz
 a,
Paul G.
Livingstone
b and
David E.
Whitworth
*a
a,
Paul G.
Livingstone
b and
David E.
Whitworth
*a
aInstitute of Biological, Environmental and Rural Sciences, Aberystwyth University, Aberystwyth, Ceredigion SY23 4DD, UK. E-mail: dew@aber.ac.uk
bDepartment of Biomedical Sciences, Cardiff Metropolitan University, Western Avenue, Cardiff, CF5 2YB, UK
First published on 29th April 2020
Abstract
Extracellular membrane vesicles are produced by all domains of life (bacteria, archaea and eukaryotes). Bacterial extracellular vesicles (outer membrane vesicles or OMVs) are produced by outer membrane blebbing, and contain proteins, nucleic acids, virulence factors, lipids and metabolites. OMV functions depend on their internal composition, therefore understanding the proteome of OMVs, and how it varies between organisms, is imperative. Here, we report a comparative proteomic profiling of OMVs from strains of Myxococcus xanthus, a predatory species of Gram-negative myxobacteria whose secretions include secondary metabolites and hydrolytic enzymes, thought to be involved in prey lysis. Ten strains were chosen for study, of which seven had genome sequences available. The remaining three strains were genome sequenced allowing definition of the core and accessory genes and genome-derived proteins found within the pan-genome and pan-proteome respectively. OMVs were isolated from each strain and proteins identified using mass spectrometry. The M. xanthus OMV pan-proteome was found to contain tens of ‘core’ and hundreds of ‘accessory’ proteins. Properties of the OMV pan-proteome were compared with those of the pan-proteome deduced from the M. xanthus pan-genome. On average, 80% of ‘core’ OMV proteins are encoded by genes of the core genome, yet the OMV proteomes of individual strains contain subsets of core genome-derived proteins which only partially overlap. In addition, the distribution of characteristics of vesicle proteins does not correlate with the genome-derived proteome characteristic distribution. We hypothesize that M. xanthus cells package a personalized subset of proteins whose availability is only partially dictated by the presence/absence of encoding genes within the genome.
Introduction
Bacteria, archaea and eukaryotes ubiquitously produce extracellular vesicles. Although they share a similar appearance and physical properties (e.g. being spherical and bilayered), they often have different features and functions. Their size varies from 50–250 nm, with some eukaryotic vesicles reaching 1000 nm,1–3 and the quantity of vesicles produced depends on the type of producing cell, often changing depending on environmental conditions. For instance, certain extreme conditions, such as heat-shock and chemical stress, lead to an increased production of OMVs.4,5 Some vesicles are produced by spontaneous lysis of producer cells; others are the result of directed secretion of unwanted or misfolded proteins, while others are produced through yet unknown mechanisms.6–8The OMVs of Gram-negative bacteria are produced through pinching of the outer membrane, either spontaneously or actively, and are made throughout all growth phases and in virtually all environments.1 The function of OMVs is of particular interest, as it has been shown that they play a role in modulating host immune responses,5,9–13 communication between cells,14–16 delivering virulence factors and toxins,1,10,17–19 and directed secretion of molecules. Since the cargo of vesicles is protected and enclosed by a membrane, packaging within vesicles allows for a highly concentrated dose of molecules to be delivered to distant and inaccessible locations. Packaging of molecules into vesicles represents an alternative mechanism for general secretion and activity, independent of well-characterized and substrate-specific secretion pathways.
The specific molecules carried in any subset of vesicles largely depends on the host cell, environmental conditions and purpose of vesicle biogenesis.20,21 Vesicle components are expected to be similar within the same species, if grown under similar conditions. However, little is known about vesicle composition of strains belonging to the same genus or species. At the species level of classification organisms are usually genetically very similar (>95% average nucleotide identity, ANI22), however genomes can also be highly individual through the presence/absence of accessory genes. Therefore, genetic similarity may not correlate with OMV composition. To test this, we report the findings of a comparative proteomics study of OMVs made by the species Myxococcus xanthus.
Myxococcus is a genus within the myxobacteria, a group of deltaproteobacteria commonly found in soils, that act as facultative predators.23–27 To date hundreds of isolates of myxobacteria have been described, belonging to >60 genera.28 Their genomes typically encode several thousand proteins, many of which remain hypothetical and uncharacterized. Each isolate produces a variety of secondary metabolites, some of which have been exploited for drug development.29–32 Myxobacterial OMVs are predatory in their own right, with purified OMVs able to inhibit growth and kill both Gram-negative and Gram-positive prey bacteria,33–35 and several proteomics studies have investigated the composition of myxobacterial OMVs.35–38 However, no studies have compared the proteomes of myxobacterial OMVs from different strains, or indeed characterised the OMV proteome for any strain beyond the model organism M. xanthus DK1622.
Characterising the OMVs of ten Myxococcus spp. strains, we identified 2514 OMV protein sequences belonging to 833 individual proteins. Although the genomes of the Myxococcus strains suggest they belong to the same species (M. xanthus), nearly 50% of vesicle proteins were found in fewer than four strains, suggesting that genetically similar strains of myxobacteria have diverse OMV proteomes.
Experimental procedures
Myxococcus spp. strains and growth conditions
The following Myxococcus spp. strains were used in this study: M. xanthus DK1622,24 AB056, AB024B, AB022, CA005, CA006, CA010, CA018, CA023 and CA027.39 Strains were grown in CYE medium consisting of 5 mM MOPS pH 7.6, 2 mM MgSO4, 0.5% (w/v) casitone, 0.25% (w/v) yeast extract (shaking at 180 rpm, 30 °C), or on CYE medium solidified with 1.5% (w/v) agar.Genome sequencing and annotation
Draft genome sequences of six strains (CA010, CA006, CA005, AB056, AB024B and AB022) have been published previously (BioProject PRJNA529425), while the M. xanthus DK1622 genome was downloaded from the NCBI database (GenBank accession CP000113). CA027, CA023 and CA018 strains were sequenced in this study using 2 × 250 bp paired-end reads on the Illumina Hiseq 2500 platform by MicrobesNG (Birmingham, United Kingdom). The raw reads were subjected to Kraken 2 for read mapping, BWA-MEM for quality control, and SPAdes 3.7 for de novo assembly.40–42 The genome sequences are available from the NCBI nucleotides database under BioProject accessions PRJNA575213 (CA027), PRJNA575210 (CA023) and PRJNA575208 (CA018).The genome sequences were annotated using Prokka 1.13.7 with standard parameters.43 The assembly quality was determined using QUAST.44 Roary was used to determine the pan-genome of the ten strains using a MAFFT alignment and 90% sequence identity cut-off.45 To determine the average nucleotide identity (ANI) an ANI-based all-vs.-all matrix was constructed using the ANI-Matrix genome calculator.46 Digital-DNA/DNA hybridization (dDDH) was calculated using the Genome-to-Genome Distance Calculator, GGDC 2.1.47,48
OMV production and purification
To obtain OMVs, five replicates of 200 mL liquid cultures were grown in CYE medium for 7 days to an OD600 of ∼2. Cultures were centrifuged at 10![[thin space (1/6-em)]](https://www.rsc.org/images/entities/char_2009.gif) 400 × g for 30 minutes to pellet cells and the supernatants transferred to fresh vessels, four times. The absence of viable cells was confirmed by plating supernatant onto solid CYE before incubating at 30 °C. Cell-free supernatants were centrifuged at 100000 × g for 80 minutes to pellet OMVs. The resulting replicate pellets were combined, re-suspended in 2 mL TM buffer (10 mM Tris pH 7.6, 8 mM MgSO4), and stored at −80 °C. Protein concentration was measured using a Qubit Protein Assay Kit (Thermo Fisher).
400 × g for 30 minutes to pellet cells and the supernatants transferred to fresh vessels, four times. The absence of viable cells was confirmed by plating supernatant onto solid CYE before incubating at 30 °C. Cell-free supernatants were centrifuged at 100000 × g for 80 minutes to pellet OMVs. The resulting replicate pellets were combined, re-suspended in 2 mL TM buffer (10 mM Tris pH 7.6, 8 mM MgSO4), and stored at −80 °C. Protein concentration was measured using a Qubit Protein Assay Kit (Thermo Fisher).
LC-MS/MS
OMV samples were each run into the stacking layer of an SDS-PAGE gel, and a slice containing the sample proteins was cut from each gel lane. Gel slices were digested into peptides and analyzed by LC-MS/MS at the University of Birmingham Advanced Mass Spectrometry Facility. Mass/charge ratios were compared against theoretical peptide MS/MS spectra and when a match was found, the peptide was confirmed to be present in the sample. A protein was identified as being in the original sample if two unique peptides matching its sequence were detected. Protein identifications were made using the genomic data described above and the Swiss-PROT reviewed protein list.49Proteomics data characterization and analysis
Proteomics data were curated to remove common contaminants (e.g. keratins and trypsin) and proteins with fewer than two unique peptide matches. For each set of OMV proteins identified from MS data, the predicted subcellular locations were determined using PSORTb,50 potential secretion mechanisms were assessed using SignalP,51 and COG and KEGG groupings were established using EggNOG.52,53 OMV proteins were clustered with an identity cut-off of 0.90 using CD-HIT.54–56 Hierarchical clustering using the complete linkage method, generation of dendrograms and tanglegrams, and correlation coefficient calculations were performed in R using the dendextend library.57,58Experimental design and statistical rationale
Chi square goodness-of-fit tests were performed to determine if there were significant differences in the characterization (signal peptide, subcellular location, COG and KEGG orthology) distribution profiles of each isolate. In addition, to test for differences between strains, the Total Variation Distance (TVD) was determined for each pairwise combination. A Bonferonni correction was performed to compensate for multiple testing: p < 0.005 was taken as significant for Chi square tests (α = 0.05/10) and p < 0.001 was considered significant for TVD tests (α = 0.05/45).Results
Genome and proteome terminology
Pan-genome refers to all of the genes present in all strains (including both core and accessory genes), where core genes are those present in all strains and accessory genes are those present in only a subset of strains. Thus, each strain will have a core genome and an (individual) accessory genome, composed of core and accessory genes respectively. The genome-derived pan-proteome includes the proteins deduced from the pan-genome, with core and accessory referring to proteins common to all strains and those present in a subset of strains, respectively. Similarly, the OMV pan-proteome includes the proteins present in OMVs, where core OMV proteins are those present in OMV's from all strains and accessory OMV proteins are those present in only a subset of strains.The M. xanthus pan-genome is large and open
Seven of the strains studied here have had their genome sequences published.39 To confirm all strains belonged to the same species and to understand inter-strain variation, the genome sequences of the remaining three strains were determined, allowing all-by-all comparison. Table 1 describes the general properties of the genomes of all ten strains, including those newly sequenced here (CA027, CA023 and CA018). The pan-genome of the ten M. xanthus strains was then characterised using Roary (Table 2 and Fig. S1, ESI†). A core genome of 5454 genes was identified (ESI†), and approximately 2000 genes of each strain's genome (27%) belonged to its ‘shell’ accessory genome. 1533 genes were found to be unique to one of the ten genomes (‘cloud’ genes). Unsurprisingly, the M. xanthus core genome is nearly nine-times larger than that derived from six Myxococcus spp. strains of different species,59 nevertheless, more than a quarter of each M. xanthus genome is presumably non-essential and potentially ‘recently’ acquired since speciation by horizontal gene transfer.| Strain | Total length (kbp) | G + C (%) | # contigs | N50 | L50 | # genes | # CDS |
|---|---|---|---|---|---|---|---|
| N50 is the sequence length of the shortest contig that accounts for 50% of the total genome. L50 is the number of contigs equal to or longer than the N50, i.e. the minimal number of contigs to cover 50% of the assembly. CDS is the number of coding sequences or genome-derived proteins. | |||||||
| DK1622 | 9139 | 68.89 | 1 | — | — | 7407 | 7315 |
| CA027 | 9049 | 68.21 | 252 | 53183 |
82 | 7441 | 7348 |
| CA023 | 9077 | 66.04 | 238 | 85692 |
37 | 7433 | 7346 |
| CA018 | 9076 | 67.26 | 733 | 45742 |
58 | 7576 | 7490 |
| CA010 | 9117 | 64.87 | 408 | 68574 |
46 | 7464 | 7375 |
| CA006 | 9046 | 68.15 | 360 | 46018 |
64 | 7441 | 7353 |
| CA005 | 9110 | 67.82 | 227 | 81131 |
35 | 7405 | 7321 |
| AB056 | 9108 | 67.85 | 233 | 75794 |
37 | 7410 | 7331 |
| AB024B | 9059 | 67.33 | 365 | 47907 |
55 | 7448 | 7360 |
| AB022 | 9063 | 67.31 | 258 | 69990 |
38 | 7438 | 7351 |
| Total # of genes | ||
|---|---|---|
| Core | Hard core (10/10) | 5454 |
| Accessory | Shell (2–9/10) | 3516 |
| Cloud (1/10) | 1533 | |
| Pan-genome | Total | 10503 |
ANI value cutoffs of >81% and ≥95% have been proposed as defining levels of genomic differences between members of the same genera and species, respectively.60 Similarly, a digital DNA–DNA hybridisation (dDDH) cut-off of >70% has been proposed for same-species membership. Calculated ANI and dDDH values for all pairwise comparisons between M. xanthus strains are shown in Table 3. All ANI values were above 95%, and all dDDH values were above 70%, indicating that all strains belong to the same species (Table 3).
| AB056 | DK6122 | CA005 | CA006 | CA010 | AB024B | AB022 | CA018 | CA023 | CA027 | |
|---|---|---|---|---|---|---|---|---|---|---|
| Values above and below the diagonal represent dDDH and ANI percentages, respectively. Italic and bold values likely belong to the same species (Myxococcus xanthus), but different subspecies. | ||||||||||
| AB056 | 100 | 74.5 | 74.5 | 71.1 | 71 | 70.9 | 71 | 71.1 | 71.1 | 70.9 |
| DK1622 | 97 | 100 | 99.7 | 72.9 | 72.8 | 72.7 | 72.8 | 72.9 | 72.8 | 72.7 |
| CA005 | 97 | 100 | 100 | 72.9 | 72.8 | 72.7 | 72.8 | 72.9 | 72.8 | 72.7 |
| CA006 | 97 | 97 | 97 | 100 | 100 | 99.9 | 100 | 99.9 | 100 | 99.9 |
| CA010 | 97 | 97 | 97 | 100 | 100 | 99.8 | 99.9 | 99.9 | 100 | 99.9 |
| AB024B | 97 | 97 | 97 | 100 | 100 | 100 | 99.9 | 99.9 | 99.9 | 99.9 |
| AB022 | 97 | 97 | 97 | 100 | 100 | 100 | 100 | 99.9 | 99.9 | 99.8 |
| CA018 | 97 | 97 | 97 | 100 | 100 | 100 | 100 | 100 | 99.9 | 99.9 |
| CA023 | 97 | 97 | 97 | 100 | 100 | 100 | 100 | 100 | 100 | 99.9 |
| CA027 | 97 | 97 | 97 | 100 | 100 | 100 | 100 | 100 | 100 | 100 |
The OMVs of different M. xanthus strains contain individual subsamplings of the core pan-proteome
Liquid cultures of each M. xanthus strain were subjected to ultracentrifugation to harvest OMVs, and the resulting cell-free samples were subjected to proteomic characterisation, leading to the identification of 2514 proteins. The total number of identified proteins within OMVs differed substantially among the strains, with DK1622 having the most (498) and CA006 having the fewest (49) (Fig. 1). These differences could not be explained by protein concentration differences (Fig. S2, ESI†) – there was no significant correlation between protein concentration and the number of identified proteins or peptides. Of the 2514 proteins identified in the OMVs, 1997 (79%) were found to be members of the core proteome as deduced from the M. xanthus core genome (Fig. 1), suggesting a substantial amount of variation (21%) in OMV composition is dictated by the presence/absence of the encoding genes in the genome.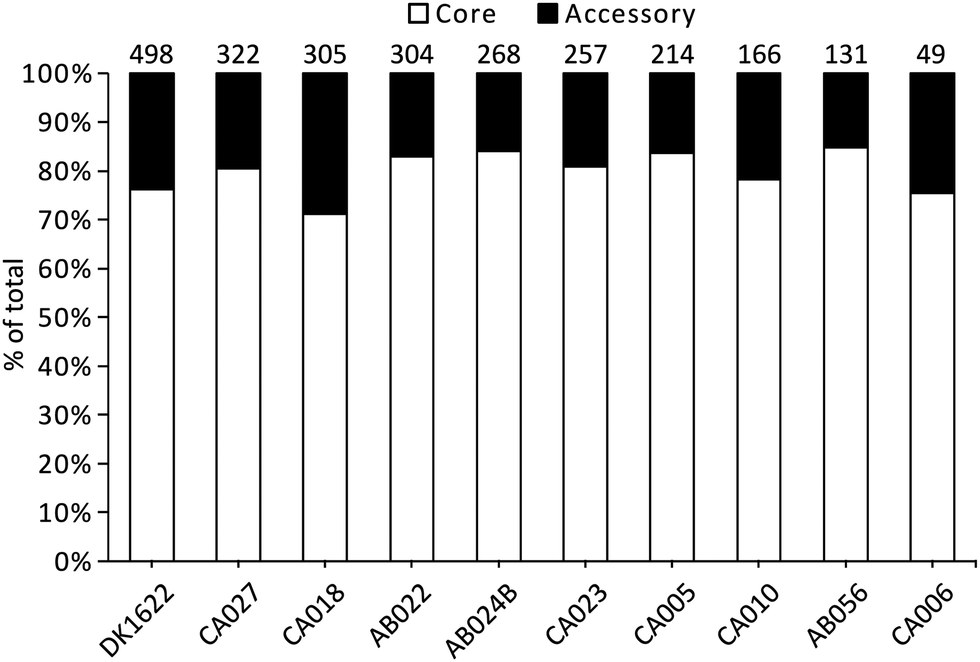 | ||
| Fig. 1 Number of OMV proteins within the genome-derived core and accessory proteomes for each M. xanthus strain. Numbers above the bars are the total number of proteins identified in the vesicles for a given strain. Columns are sorted based on the total number. | ||
Iterative CD-HIT was used to cluster the 2514 into 833 groups of orthologous proteins or ‘orthogroups’ sharing ≥90% sequence identity. When paralogous proteins were found (present in DK1622 and CA018 only), they were included in the same orthogroup. Although the OMV proteins of different strains were consistently between 70% and 85% ‘core’ proteins, the core proteins in question were not the same for each strain (Fig. 2). Pairwise CD-HIT analyses were performed to determine the number of shared orthogroups between pairs of strains (Table 4). CA018 shares few OMV proteins with any strains (<25%). All other strains share at least 50% of their vesicle proteins with each other. More than 50% of orthogroups were only found in a single strain's vesicles (Fig. 2A).
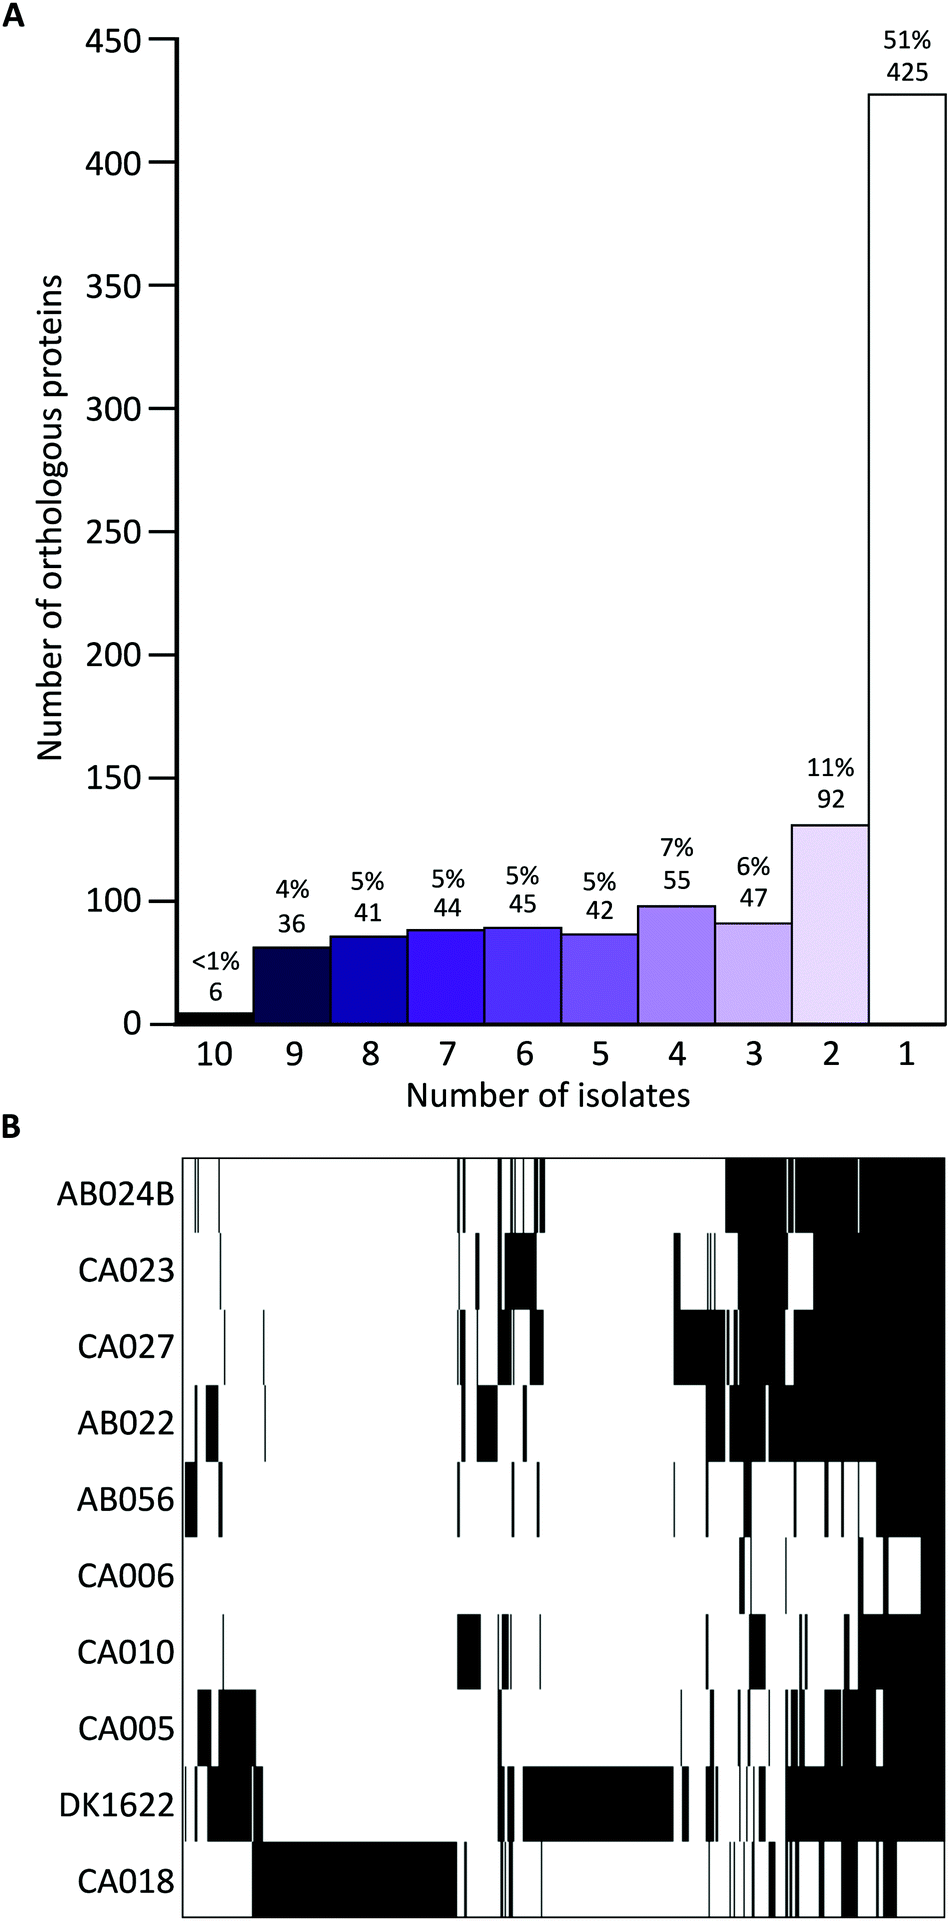 | ||
| Fig. 2 Iterative CD-HIT of proteins and hierarchical clustering of resulting orthogroups. OMV proteins clustered into 833 orthologous groups based on presence/absence in a given number of vesicles. (A) Histogram of orthogroups (found in a given number of vesicles (from 1 to 10) and their composition percentage). (B) Binary heatmap of presence/absence data ordered by clustering, where black and white indicate presence or absence of a protein/bin, respectively. More than half of the orthogroups were found in a single isolate's vesicles, CA018 or DK1622. | ||
| DK1622 | CA027 | CA023 | CA018 | CA010 | CA005 | CA006 | AB056 | AB024B | AB022 | |
|---|---|---|---|---|---|---|---|---|---|---|
| The values on the diagonal (italic) are the total number of OMV proteins for that strain. Values above and below the diagonal represent proportion and the absolute number of shared proteins, respectively. | ||||||||||
| DK1622 | 498 | 0.62 | 0.67 | 0.21 | 0.72 | 0.84 | 0.80 | 0.73 | 0.69 | 0.65 |
| CA027 | 201 | 322 | 0.88 | 0.23 | 0.89 | 0.66 | 0.98 | 0.73 | 0.90 | 0.78 |
| CA023 | 173 | 226 | 257 | 0.22 | 0.81 | 0.58 | 0.96 | 0.69 | 0.81 | 0.80 |
| CA018 | 64 | 70 | 57 | 305 | 0.18 | 0.17 | 0.16 | 0.14 | 0.25 | 0.22 |
| CA010 | 119 | 147 | 134 | 30 | 166 | 0.54 | 0.86 | 0.61 | 0.80 | 0.82 |
| CA005 | 179 | 141 | 124 | 36 | 89 | 214 | 0.71 | 0.61 | 0.62 | 0.68 |
| CA006 | 39 | 48 | 47 | 8 | 42 | 35 | 49 | 0.63 | 0.96 | 0.98 |
| AB056 | 95 | 96 | 90 | 18 | 80 | 80 | 31 | 131 | 0.66 | 0.71 |
| AB024B | 185 | 240 | 208 | 66 | 132 | 133 | 47 | 87 | 268 | 0.87 |
| AB022 | 197 | 238 | 205 | 66 | 136 | 145 | 48 | 93 | 233 | 304 |
Proteins found in ten, nine or eight vesicles accounted for <10% of the total number of proteins (between 25 and 83 proteins per vesicle).
Hierarchical clustering of the presence/absence data for each orthogroup clustered strains into four distinct groups (Fig. 2B), supporting the observation that although vesicles have a high proportion of core proteome proteins, many are from different parts of the core proteome.
If genome composition determines OMV composition, we would expect to see a similar profile of vesicle proteins in strains that are more genetically similar. Although this is the case for several strains (AB024B, CA027, CA023 and AB022), this was not the case for the other six strains, which displayed varied profiles of proteins. CA018, which is genetically similar to the previously mentioned four isolates, clusters as an outgroup when looking at the OMV proteins (Fig. 2B).
M. xanthus OMV proteomes from different strains have distinctive characteristics
A combination of tools were used to characterize the proteins of each orthogroup. For each characterization method, a Chi square goodness-of-fit test was performed to determine whether the vesicle distribution was significantly different from the genome-derived proteome distribution (χ2 scores and p-values are available in the ESI†). To evaluate pairwise similarity the total variation distance (TVD) was determined for each set of isolates (TVD p-value matrices are available in the ESI†). If proteins were randomly packaged into vesicles, it would be expected that a similar distribution of characteristics in the vesicles would be observed as are seen in the genome-derived proteomes.SignalP was used to predict the presence of conserved signal sequences for Sec (SP) or lipoprotein secretion (LIPO), twin arginine translocation (TAT) and other (non-classical, none or unknown) secretion mechanisms (Fig. 3A).51 All signal peptide distributions within vesicles were highly significantly different from the average genome-derived proteome distribution (p < 0.001). Pairwise comparisons show that both DK1622 and CA018 are significantly different from all other isolates and CA010 is additionally significantly different from CA005, AB022 and AB024B (p < 0.001). The lack of differences in other pairwise cases suggests their OMV proteins share a similar signal peptide profile. The subcellular location of each protein coding sequence was predicted using PSORTb, which classifies protein sequences based on a database of experimentally determined locations for a set of proteins, transmembrane alpha helices, signal peptides, and outer membrane and other motifs (Fig. 3B).50 Interestingly, over 45% of proteins had no predicted location. Approximately 17% of sequences were predicted to be cytoplasmic. Both inner membrane and outer membrane locations comprised approximately 12–14% of proteins each. Extracellular and periplasmic locations each comprised about 5% of proteins. All subcellular location distributions within vesicles were highly significantly different from the average proteome distribution (p < 0.001). The subcellular location distribution of DK1622 is significantly different from all strains except CA018 and CA005; CA018 is significantly different from all isolates (p < 0.001), except DK1622 and CA005.
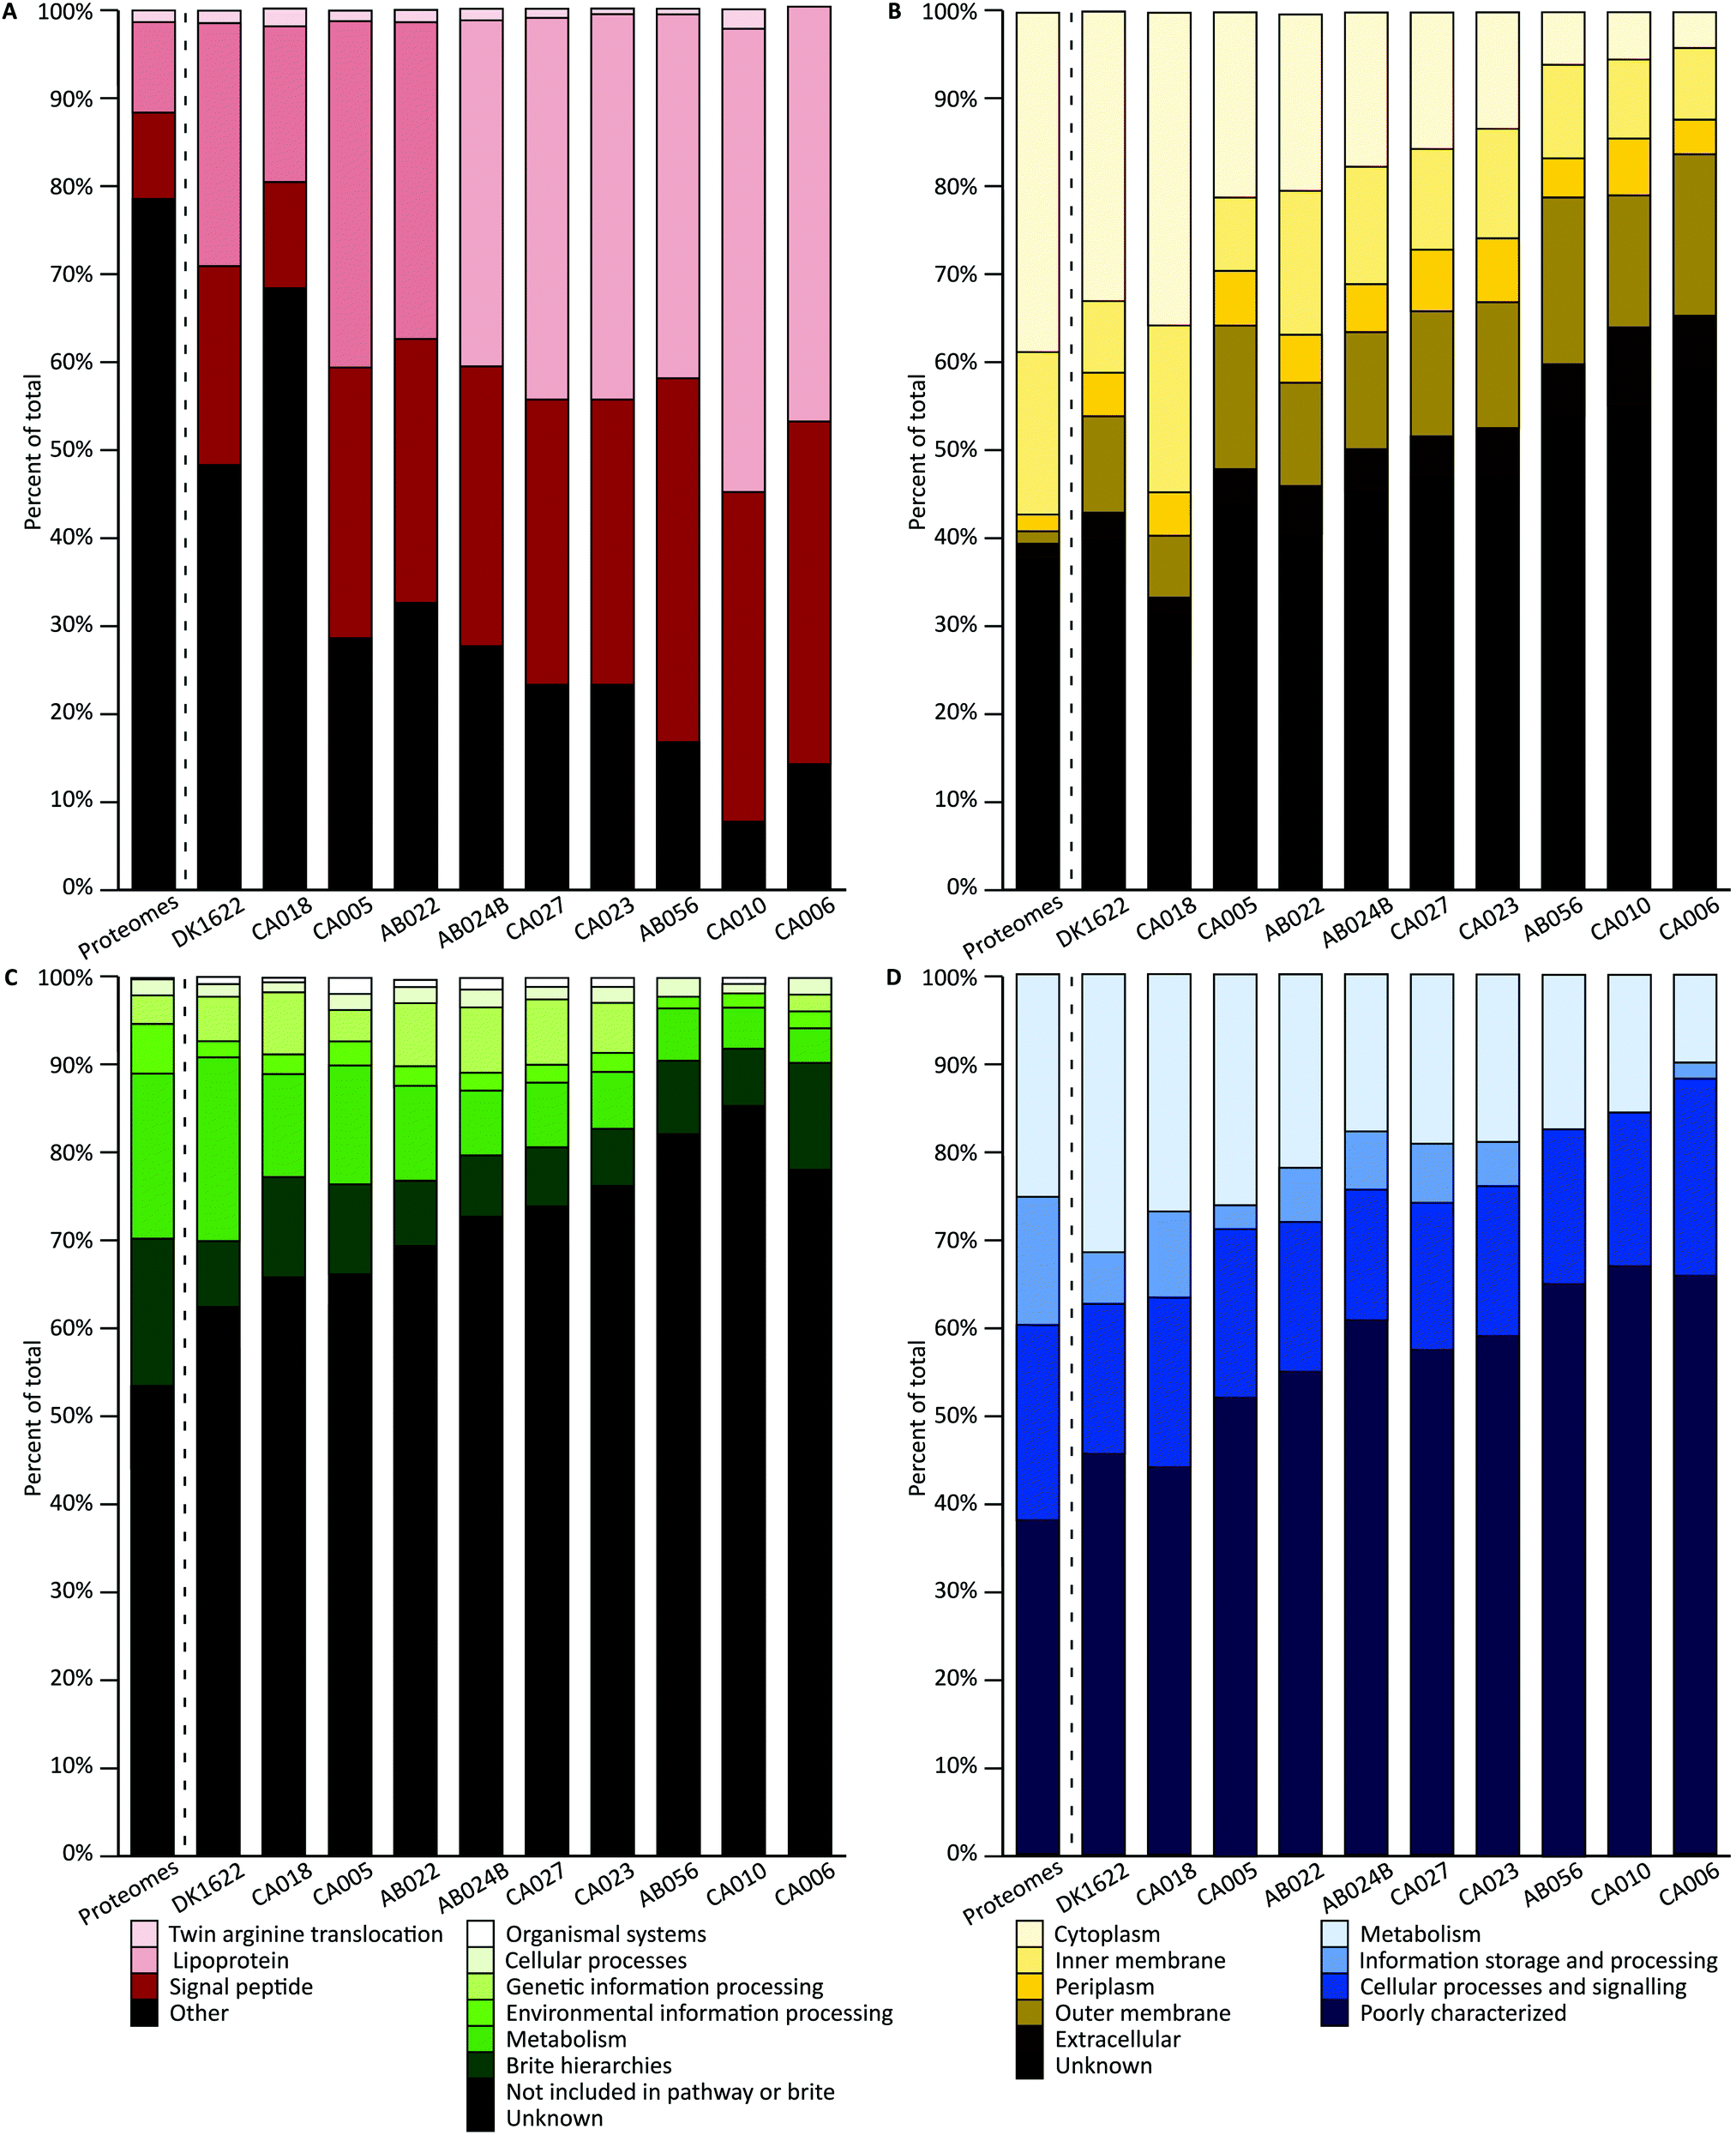 | ||
| Fig. 3 Characterization and distribution of genomic and OMV proteins. (A) Predicted signal peptide: twin arginine translocation; lipoprotein; sec and other or non-classical (other). (B) Predicted subcellular location: cytoplasmic; inner membrane; periplasmic; outer membrane; extracellular and unknown. (C) KEGG pathway. (D) COG orthology. The ‘Proteomes’ column (left of dotted line) in each graph represents the average number of genome-derived proteins with a given characteristic across all 10 genomes. The columns to the right of the dotted line represent the OMV proteins from each isolate. | ||
The KEGG and Clusters of Orthologous Groups (COG) classifications were applied to orthogroups based on orthology using EggNOG. A large proportion of proteins could not be classified as belonging to any of the KEGG or COG groups (Fig. 3C and D. ‘Unknown’ and ‘Poorly characterized’), mirroring the large proportion of hypothetical proteins encoded in myxobacterial genomes. The proteins that did match a known COG fell into several groups, including ‘inorganic ion transport and metabolism’; ‘molecular chaperones and related functions’; ‘cell wall and outer membrane structure and biogenesis’; ‘amino acid metabolism and transport’; and ‘energy production and conversion’; biogenesis’; ‘amino acid metabolism and transport’; and ‘energy production and conversion’. All KEGG and COG distributions within vesicles were significantly different to the average deduced proteome distribution, except CA018 COG distribution (p = 0.01) and CA006 KEGG distribution (p = 0.007). The KEGG distribution differences are not due to the ‘genetic information processing’ and ‘cellular processes’ proteins levels, which retain the same proportions as for the genome-derived proteome. In addition, a similar proportion of COG metabolism proteins were found in OMVs. COG pairwise comparisons show that both DK1622 and CA018 are significantly different from AB024B, CA027, CA023 and AB056 (p < 0.001). Pairwise comparisons of KEGG distributions indicate that: DK1622 is significantly different from AB024B, CA027, CA023, AB056 and CA010; CA018 is significantly different from CA023, AB056 and CA010; and CA010 is significantly different from CA005 and AB022 (p < 0.001). In summary, OMVs had fewer information storage and processing proteins and more poorly characterized proteins than their parent genomes.
In addition, characterization of the core and accessory proteome were performed (Fig. S3, ESI†). The accessory proteome contains more unknown proteins (COG and KEGG) than the core. The pan-proteome was used for comparison against the OMV proteomes as it reflects the average characterization of the strains (Fig. 3).
Cargo of M. xanthus vesicles
Of the 833 orthogroups, six were found in all ten vesicles. These included VolA, CirA, PvdQ, PhoD, GspD and an unknown protein (MXAN_5152 of DK1622) (Table 5). All of these proteins were found in at least one myxobacteria vesicle proteomic study.36,37 The majority of these high abundance proteins have no known function.| Locus ID | Gene name | Putative annotation | Signal sequence | Subcellular location | KEGG orthology | COG orthology |
|---|---|---|---|---|---|---|
| COG orthology categories: P, inorganic ion transport and metabolism; S, no prediction; U, intracellular trafficking, secretion and vesicular transport; M, cell wall and outer membrane structure and biogenesis; N, secretion, motility and chemotaxis; O, molecular chaperones and related functions; E, amino acid metabolism and transport; L, replication, recombination and repair; F, nucleotide transport and metabolism. | ||||||
| 10 vesicles | ||||||
| MXAN_1389 | phoD | Alkaline phosphatase | TAT | Unknown | Metabolism | Metabolism, P |
| MXAN_2906 | pvdQ | Penicillin acylase family protein | LIPO | Periplasm | Not incl. | Poorly characterized, S |
| MXAN_3106 | gspD | General secretion pathway protein | SP | Outer membrane | Brite hierarchies | Cellular processing and signalling, U |
| MXAN_4559 | cirA | TonB-dependent receptor | TAT | Outer membrane | Unknown | Metabolism, P |
| MXAN_5152 | OmpA family protein | LIPO | Outer membrane | Brite hierarchies | Cellular processing and signalling, M | |
| MXAN_7039 | volA | Lysophospholipase | LIPO | Unknown | Unknown | Unknown |
| 9 vesicles | ||||||
| MXAN_0283 | tolB | Translocation protein TolB | LIPO | Unknown | Not incl. | Poorly characterized, S |
| MXAN_0659 | nfdA | N-substituted formamide deformylase precursor | LIPO | Cytoplasmic | Unknown | Poorly characterized, S |
| MXAN_0855 | motB | Chemotaxis protein MotB | LIPO | Inner membrane | Cellular processes | Cellular processing and signalling, N |
| MXAN_0924 | Uncharacterized | SP | Unknown | Unknown | Unknown | |
| MXAN_0976 | Lipoprotein | LIPO | Unknown | Unknown | Unknown | |
| MXAN_1424 | Uncharacterized | SP | Unknown | Unknown | Unknown | |
| MXAN_1450 | oar | TonB-dependent receptor | OTHER | Outer membrane | Unknown | Metabolism, P |
| MXAN_1623 | Peptidase, M16 (Pitrilysin) family | LIPO | Unknown | Unknown | Cellular processing and signalling, O | |
| MXAN_1624 | Peptidase, M16 (Pitrilysin) family | SP | Unknown | Unknown | Cellular processing and signalling, O | |
| MXAN_2382 | apeB | M18 family aminopeptidase | OTHER | Cytoplasmic | Not incl. | Metabolism, E |
| MXAN_2480 | sppA | Protease 4 | SP | Unknown | Not incl. | Information storage and processing, L |
| MXAN_2595 | Uncharacterized | LIPO | Unknown | Unknown | Unknown | |
| MXAN_2659 | Uncharacterized | SP | Unknown | Unknown | Unknown | |
| MXAN_2661 | yfkN_2 | Bifunctional metallophosphatase/5′-nucleotidase | LIPO | Periplasmic | Unknown | Metabolism, F |
| MXAN_3274 | Lipoprotein | LIPO | Unknown | Unknown | Unknown | |
| MXAN_3553 | Uncharacterized | SP | Outer membrane | Unknown | Poorly characterized, S | |
| MXAN_4746 | susC/btuB | TonB-dependent receptor, vitamin B12/cobalamin outer membrane transporter | OTHER | Outer membrane | Unknown | Metabolism, P |
| MXAN_4866 | Uncharacterized | SP | Unknown | Unknown | Poorly characterized, S | |
| MXAN_5023 | fecA | Fe(3+) dicitrate transport protein FecA precursor | SP | Outer membrane | Not incl. | Cellular processing and signalling, M |
| MXAN_5024 | Uncharacterized | LIPO | Unknown | Unknown | Unknown | |
| MXAN_5684 | Lipoprotein | LIPO | Unknown | Unknown | Unknown | |
| MXAN_5686 | Uncharacterized | SP | Unknown | Unknown | Unknown | |
| MXAN_5809 | Uncharacterized | SP | Unknown | Unknown | Unknown | |
| MXAN_5933 | yfgC | TPR repeat-containing protein YfgC precursor | LIPO | Unknown | Unknown | Cellular processing and signalling, O |
| MXAN_6090 | Uncharacterized | SP | Outer membrane | Unknown | Unknown | |
| MXAN_6266 | yfkN_1 | Bifunctional metallophosphatase/5′-nucleotidase | OTHER | Periplasmic | Metabolism | Metabolism, F |
| MXAN_6487 | Outer membrane efflux protein | SP | Outer membrane | Unknown | Cellular processing and signalling, M | |
| MXAN_6574 | Lipoprotein | OTHER | Extracellular | Unknown | Poorly characterized, S | |
| MXAN_6660 | Uncharacterized | LIPO | Unknown | Unknown | Cellular processing and signalling, M | |
| MXAN_6709 | ptp | Prolyl tri/tetrapeptidyl aminopeptidase precursor | LIPO | Unknown | Unknown | Unknown |
| MXAN_6751 | Uncharacterized | LIPO | Outer membrane | Unknown | Unknown | |
| MXAN_6976 | Uncharacterized | OTHER | Unknown | Unknown | Unknown | |
| MXAN_7212 | Uncharacterized | LIPO | Unknown | Unknown | Unknown | |
| MXAN_7317 | Uncharacterized | SP | Outer membrane | Unknown | Unknown | |
| MXAN_7407 | Uncharacterized | SP | Unknown | Unknown | Metabolism, E | |
| Q6ZZC4 | ompP1 | Outer membrane protein NMB0088 | SP | Outer membrane | Not incl. | Cellular processing and signalling, M |
Proteins found in nine of ten vesicles were missing from either CA006 or CA018; all other isolates shared all 36 proteins. In addition, DK1622, CA027, CA023 and AB022 shared all of the 41 proteins found in eight of ten vesicles. Both DK1622 and CA018 make up the largest proportion of proteins found in only one vesicle, suggesting they package an additional repertoire of proteins into vesicles.
Genome similarity does not dictate OMV similarity
Genome similarity can be quantified using ANI and dDDH values, while OMV proteome similarity can be quantified using protein characterization methods and the presence/absence of orthogroups (Fig. 4). The presence/absence of a set of proteins correlates to protein characteristics, as demonstrated by a tanglegram and calculated correlation (Fig. 4E, 0.844 and 0.849) coefficient between the two dendrograms (Fig. 4C). However, neither presence/absence nor characterization correlate with a phylogenetic characterization based on ANI (P/A: 0.047 and 0.072, Fig. 4B; C: −0.011 and 0.069; Fig. 4E) or dDDH (P/A: 0.074 and 0.072; C: 0.039 and 0.067, Fig. 4D and E), which correlate poorly as compared to ANI with dDDH (0.892 and 0.999, Fig. 4A and E).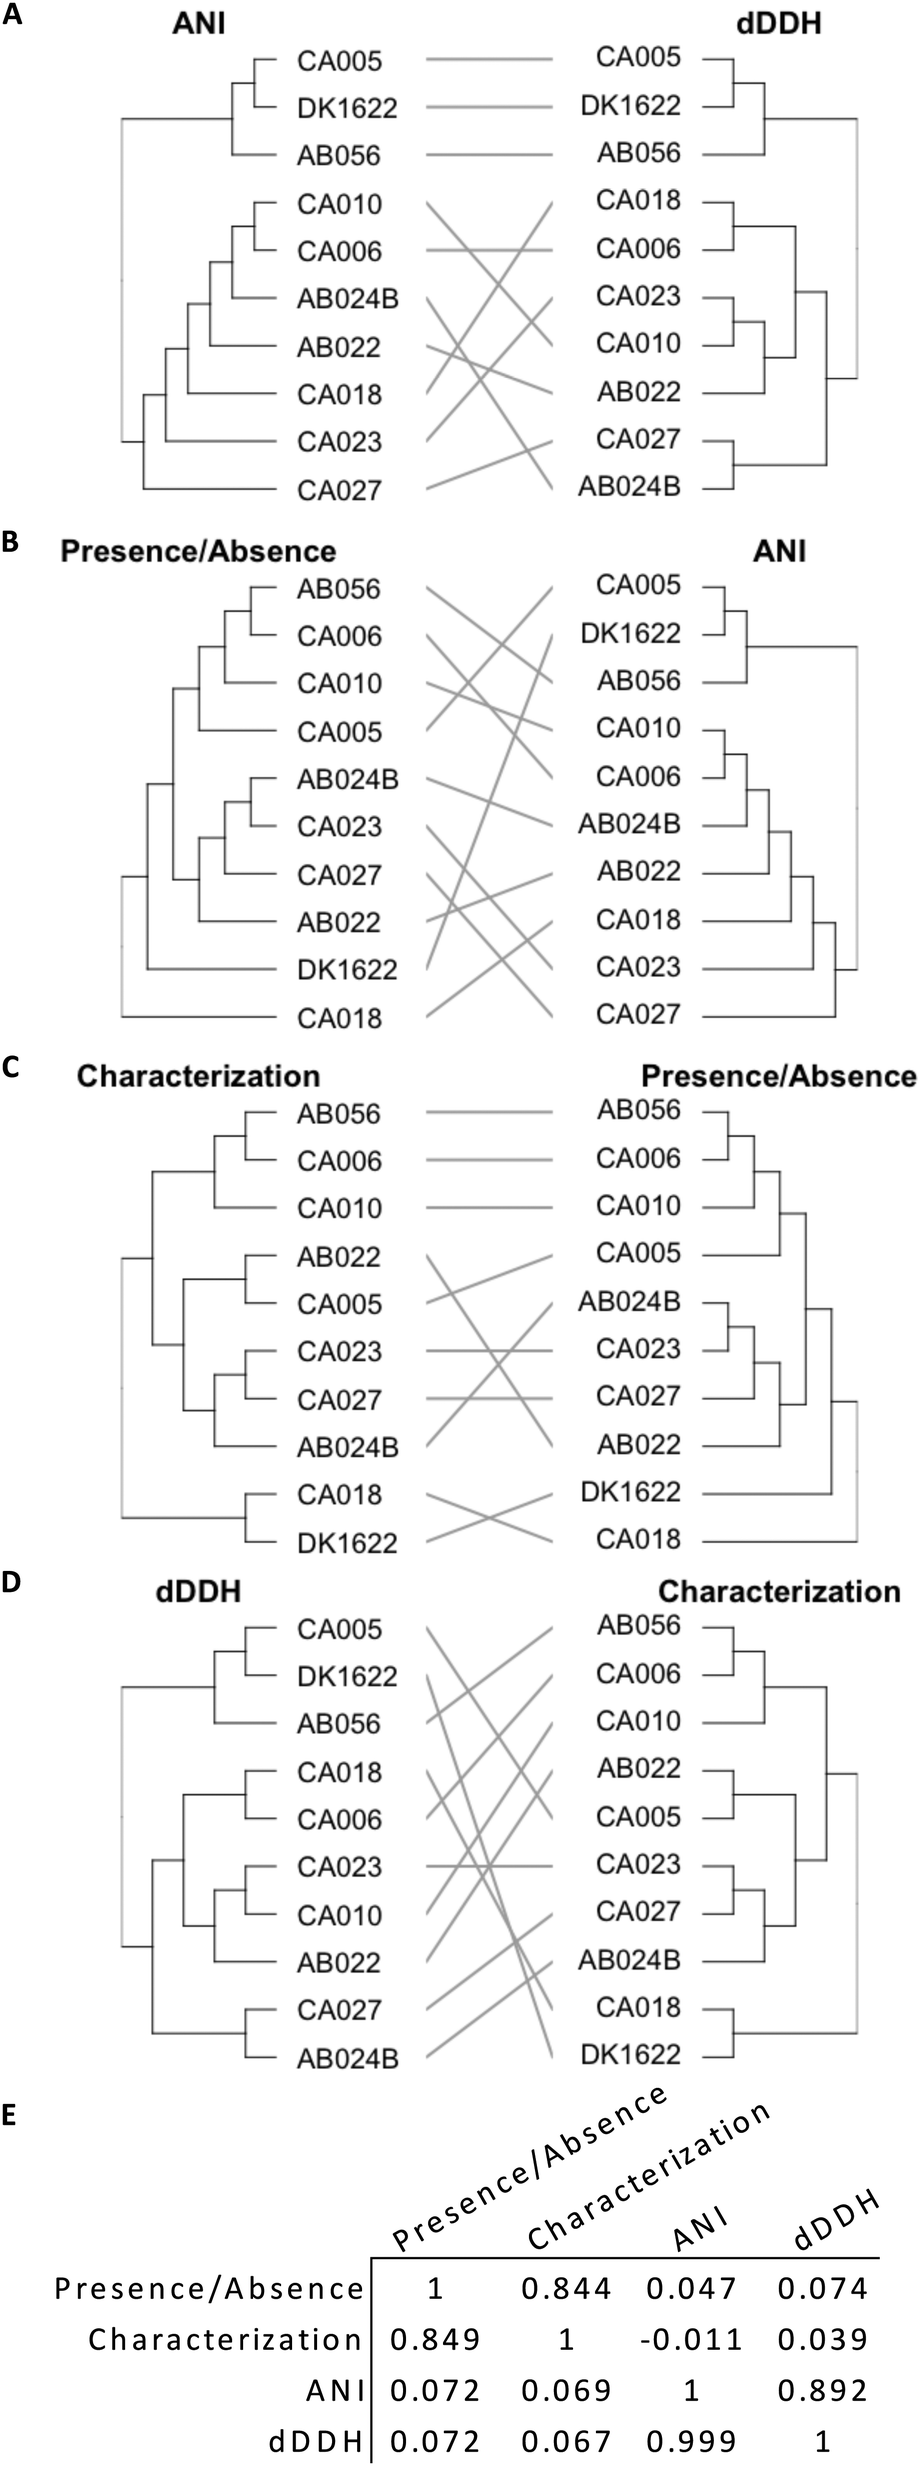 | ||
| Fig. 4 Tanglegrams of hierarchical clustering matrices and respective correlation coefficients. (A)–(D) Tanglegrams of ANI, dDDH, presence/absence and characterization clustering data, without sorting branches. (E) Correlation coefficient matrix of dendrograms. The correlation coefficients were measured using baker (above diagonal) and cophenetic (below diagonal) methods. | ||
Discussion
Both ANI and dDDH metrics confirmed that all ten strains studied here belonged to the same species (M. xanthus). Strain AB056 was most different from the other genomes, DK1622 and CA005 were very similar to each other, and the remaining seven strains formed a group of particularly similar genomes. The ten strains share a core genome of 5454 genes, which accounts for nearly 75% of each genome. The M. xanthus core genome is larger than that of Myxococcus spp. but in line with expectations given the greater genomic similarity shared within-species compared to within-genus.59 Nevertheless, each genome also hosts large numbers of unique genes of the accessory genome, likely acquired through horizontal gene transfer, and conferring significant individuality to each strain.Proteomic analysis of the OMVs secreted by the same ten M. xanthus strains led to the identification of 2514 proteins. The majority (70–85%) of these proteins were also encoded by genes of the core genome. However, the OMV core proteome was relatively small (6 proteins), as each isolate contains a distinct (and only partially overlapping) set of core genome-derived proteins. In addition, although vesicles share a proportion of proteins, the majority of proteins in vesicles were only found in a single isolate. Thus, the OMV proteomes seem more diverse than their corresponding genomes, suggesting that although ‘core’ proteins are selected for inclusion into OMVs, a larger set of passively packaged proteins are sampled from available proteins. Genome similarity metrics (ANI and dDDH) did not correlate with OMV proteome characteristics or orthogroup presence/absence data, supporting the contention that genetically similar myxobacteria can produce OMVs with relatively diverse vesicle contents.
After quantification, we functionally characterized each protein sequence. We found that the characterization profile of vesicles is very different from that of the genome-derived proteomes. OMV proteins have a higher proportion of Sec and lipoprotein signal peptides than the genome-derived proteome. This is likely due to the mechanism of protein packing in vesicles, which remains poorly understood, but involves pinching off portions of the outer membrane and encapsulating periplasmic components. The presence of a large set of unknown and uncharacterized proteins in vesicles compared to the genome-derived proteomes raises questions as to their purpose in vesicles.
There are four published reports on OMV vesicle proteomics of M. xanthus, using similar isolation and quantification methods which exhibit some overlap.35–38 We were able to identify more than 40% of each study's proteins in our own vesicles (Table 6). However, the proteomes have many individual proteins, which may explain differences between studies. The identification of proteins is likely dependent on the quality of vesicles and mass spectroscopy equipment, where highly sensitive machines will identify more low-abundance proteins.
| Kahnt et al. 201036 | Evans et al. 201235 | Berleman et al. 201437 | Whitworth et al. 201538 | This study | |
|---|---|---|---|---|---|
| M. xanthus strain | DK1622 | DK1622 | DZ2 | DK1622 | DK1622 |
| # identified OMV proteins | 162 | 15 | 287 | 315 | 498 |
| Method of extraction for MS | Whole-gel | Selected gel-bands | Whole-vesicle | Whole-vesicle | Whole-gel |
| # of same proteins identified | 126 (77%) | 10 (66%) | 154 (54%) | 140 (44%) | — |
Previous work on myxobacteria vesicles has demonstrated the presence of a variety of different proteins, many of which we identified in this study. Six proteins were found in all ten vesicles, including VolA, PvdQ, GspD, PhoD, CirA and an uncharacterized protein. VolA has been found in M. xanthus vesicles,36,37 and is present on the surface of Vibrio cholerae cells, where the primary function is liberating fatty acids for consumption, a possible function that could also occur on the surface of vesicles.61,62 In Pseudomonas aeruginosa, PvdQ has been linked to quorum quenching and iron homeostasis,63 which could be useful for myxobacteria predation, as they are known to sense and respond to prey quorum signals.64 GspD, a key member of the general secretion pathway, is typically found on the outer membrane.65 PhoD is required for phosphate acquisition, without which cells can begin self-degradation leading to autolysis.66 TonB-dependent receptors, like CirA, have also been found in Escherichia coli OMVs.67 Finally, protein MXAN_5152, a probable OmpA protein, was previously found in M. xanthus.36 These six proteins will likely be found in all Myxococcus vesicles, and perhaps all myxobacteria vesicles, due to their highly conserved nature in our vesicles and in other Gram-negative vesicles. This consistency suggests that M. xanthus actively packages a select set of proteins into vesicles.
Proteins found in eight or nine of the ten vesicles also suggest high conservation in M. xanthus and can lead to a template for M. xanthus vesicles. In this group's vesicles, there will likely be several TonB-dependent receptors, outer membrane proteins and porins, a variety of hydrolytic enzymes, several unknown lipoproteins and a large number of uncharacterized proteins. In a specific isolate of myxobacteria, we expect to find a certain proportion of OMV proteins that are unique to that isolate and another, smaller proportion that is shared in the Myxococcus genus. We also expect that a proteomics analysis of other myxobacteria genera (e.g. Corallococcus and Pyxidicoccus) would identify core OMV proteins for myxobacteria, genus/species specific and isolate-specific proteins.
Although we were able to identify several hydrolytic enzymes, these vesicles were produced in the absence of prey, in a nutrient rich medium. It is likely that myxobacteria produce a different repertoire of vesicle proteins dependent on the environment. While myxobacteria do not upregulate the production of hydrolytic enzymes in the presence of prey,68 it is possible that they may upregulate the packaging of constitutively produced proteins involved in predation into hydrolytic vesicles. In this way, they are always prepared to kill and utilize prey nutrients. It is also likely that vesicles are packed with a subset of proteins specific to the prey being attacked, in addition to a large set of widely toxic proteins. The vesicle proteome diversity most probably contributes to their wide prey range.
In addition to the composition of vesicles, we observed two scenarios of protein packaging in M. xanthus vesicles: (1) CA018 and CA006 are missing a large proportion of orthogroup members, and (2) CA018 has an additional repertoire of core genome-derived proteins that are absent in the other vesicles. From this data, we have formulated three theories to explain the packaging of vesicle proteins in myxobacteria. (1) Myxobacteria package a small set of highly conserved, core genome-derived proteome proteins that act as hydrolytic enzymes and receptors. (2) The majority of myxobacteria OMV proteins are passively packaged due to their presence near sites of vesicle formation, but still possess a potential predatory function. (3) Depending on the myxobacterial strain, organisms may possess an additional set of unique proteins.
Vesicles are not only produced by Gram-negative bacteria, but also by Gram-positive bacteria, archaea and eukaryotes. Often times they contain several of the same proteins and other molecules, suggesting a basic, common function. The diversity that exists across vesicle profiles highlights what little is known about their composition and its resulting function. In order to better understand vesicle function, further studies are required, at proteomic, metabolomic and genomic levels.
The diversity in vesicle proteins makes a large-scale comparative study difficult and labour-intensive. However, it is already clear that several proteins are found in nearly all vesicles isolated. With an increase in the quality and coverage of proteomics data, we will soon be able to identify many more proteins, with which we will be able to paint a better picture of vesicle proteins. Aside from proteins, vesicles also carry DNA, RNA, small molecules, toxins and ions. To illustrate a complete vesicle, a comprehensive look at all of the components of vesicles is required. With this data, we can begin to investigate the specific functions of vesicles, including communication, delivery of molecules, predation and immune system attack. It would also be interesting to assess how the cargo of myxobacterial OMVs changes under different environmental conditions.
The pattern of presence/absence of OMV proteins in our ten strains did not correlate with their taxonomic similarity. However, OMV protein presence/absence did correlate significantly with OMV proteome characteristics (such as targeting signals, COG category etc.), implying that proteins are actively selected for inclusion due to protein features (including their function) and not just random sampling. This is to be expected given that packaging into OMVs requires appropriate cellular localisation, however it also suggests some proteins are selected for inclusion on the basis of their function. The enrichment of proteins with ‘unknown’ cellular localisation is presumably a consequence of our lack of knowledge regarding the mechanisms of OMV packaging, and our current inability to predict whether particular proteins are targeted to OMVs. OMVs were also enriched for hypothetical proteins of unknown function, which encourages future exploitation of OMVs as sources of novel therapeutics.
Conflicts of interest
There are no conflicts of interest to declare.Acknowledgements
This work was supported by the Aberystwyth University Research Fund. We would like to thank MicrobesNG for sequencing the myxobacteria isolates, the University of Birmingham Advanced Mass Spectrometry Facility for the OMV proteomics and Kim Kenobi for assistance with the statistical analysis.References
- B. L. Deatherage and B. T. Cookson, Infect. Immun., 2012, 80, 1948–1957 CrossRef CAS PubMed.
- L. Brown, J. M. Wolf, R. Prados-Rosales and A. Casadevall, Nat. Rev. Microbiol., 2015, 13, 620–630 CrossRef CAS PubMed.
- J. H. Kim, J. Lee, J. Park and Y. S. Gho, Semin. Cell Dev. Biol., 2015, 40, 97–104 CrossRef CAS.
- A. J. McBroom and M. J. Kuehn, Mol. Microbiol., 2007, 63, 545–558 CrossRef CAS.
- H. M. Kulkarni and M. V. Jagannadham, Microbiology, 2014, 160, 2109–2121 CrossRef CAS PubMed.
- S. Roier, F. G. Zingl, F. Cakar and S. Schild, Microb. Cell, 2016, 3, 257–259 CrossRef CAS PubMed.
- S. Roier, F. G. Zingl, F. Cakar, S. Durakovic, P. Kohl, T. O. Eichmann, L. Klug, B. Gadermaier, K. Weinzerl, R. Prassl, A. Lass, G. Daum, J. Reidl, M. F. Feldman and S. Schild, Nat. Commun., 2016, 7, 10515 CrossRef CAS.
- B. L. Deatherage, J. C. Lara, T. Bergsbaken, S. L. Rassoulian Barrett, S. Lara and B. T. Cookson, Mol. Microbiol., 2009, 72, 1395–1407 CrossRef CAS.
- C. Théry, M. Ostrowski and E. Segura, Nat. Rev. Immunol., 2009, 9, 581 CrossRef.
- T. N. Ellis and M. J. Kuehn, Microbiol. Mol. Biol. Rev., 2010, 74, 81–94 CrossRef CAS PubMed.
- C. M. Ünal, V. Schaar and K. Riesbeck, Semin. Immunopathol., 2011, 33, 395–408 CrossRef.
- E. D. Avila-Calderón, A. Lopez-Merino, N. Jain, H. Peralta, E. O. López-Villegas, N. Sriranganathan, S. M. Boyle, S. Witonsky and A. Contreras-Rodríguez, Clin. Dev. Immunol., 2012, 352493 Search PubMed.
- L. Chen, J. L. Valentine, C. J. Huang, C. E. Endicott, T. D. Moeller, J. A. Rasmussen, J. R. Fletcher, J. M. Boll, J. A. Rosenthal, J. Dobruchowska, Z. Wang, C. Heiss, P. Azadi, D. Putnam, M. S. Trent, B. D. Jones and M. P. DeLisa, Proc. Natl. Acad. Sci. U. S. A., 2016, 113, E3609–E3618 CrossRef CAS PubMed.
- L. M. Mashburn and M. Whiteley, Nature, 2005, 437, 422–425 CrossRef CAS PubMed.
- S. Mathivanan, H. Ji and R. J. Simpson, J. Proteomics, 2010, 73, 1907–1920 CrossRef CAS PubMed.
- E. van der Pol, A. N. Böing, P. Harrison, A. Sturk and R. Nieuwland, Pharmacol. Rev., 2012, 64, 676–705 CrossRef CAS PubMed.
- L. M. Mashburn-Warren and M. Whiteley, Mol. Microbiol., 2006, 61, 839–846 CrossRef CAS PubMed.
- N. J. Bitto, R. Chapman, S. Pidot, A. Costin, C. Lo, J. Choi, T. D'Cruze, E. C. Reynolds, S. G. Dashper, L. Turnbull, C. B. Whitchurch, T. P. Stinear, K. J. Stacey and R. L. Ferrero, Sci. Rep., 2017, 7, 7072 CrossRef PubMed.
- D. Zhang, L. M. Iyer and L. Aravind, Nucleic Acids Res., 2011, 39, 4532–4552 CrossRef CAS PubMed.
- N. Orench-Rivera and M. J. Kuehn, Cell. Microbiol., 2016, 18, 1525–1536 CrossRef CAS.
- M. F. Haurat, J. Aduse-Opoku, M. Rangarajan, L. Dorobantu, M. R. Gray, M. A. Curtis and M. F. Feldman, J. Biol. Chem., 2011, 286, 1269–1276 CrossRef CAS PubMed.
- M. Richter and R. Rosselló-Móra, Proc. Natl. Acad. Sci. U. S. A., 2009, 106, 19126–19131 CrossRef CAS.
- M. Dworkin, Annu. Rev. Microbiol., 1966, 20, 75–106 CrossRef CAS PubMed.
- D. Kaiser, C. Manoil and M. Dworkin, Annu. Rev. Microbiol., 1979, 33, 595–639 CrossRef CAS PubMed.
- J. Muñoz-Dorado, F. J. Marcos-Torres, E. Garcia-Bravo, A. Moraleda-Muñoz and J. Pérez, Front. Microbiol., 2016, 7, 781 Search PubMed.
- J. Pérez, A. Moraleda-Muñoz, F. J. Marcos-Torres and J. Muñoz-Dorado, Environ. Microbiol., 2016, 18, 766–779 CrossRef PubMed.
- R. Keane and J. Berleman, Microbiology, 2016, 162, 1–11 CrossRef CAS PubMed.
- K. I. Mohr, Microorganisms, 2018, 6, E84, DOI:10.3390/microorganisms6030084.
- H. Reichenbach, J. Ind. Microbiol. Biotechnol., 2001, 27, 149–156 CrossRef CAS PubMed.
- K. J. Weissman and R. Müller, Nat. Prod. Rep., 2010, 27, 1276–1295 RSC.
- J. Herrmann, A. A. Fayad and R. Müller, Nat. Prod. Rep., 2017, 34, 135–160 RSC.
- M. Dehhaghi, F. Mohammadipanah and G. J. Guillemin, Neurotoxicology, 2018, 66, 195–203 CrossRef CAS PubMed.
- A. Goes, P. Lapuhs, T. Kuhn, E. Schulz, R. Richter, F. Panter, C. Dahlem, M. Koch, R. Garcia, A. K. Kiemer, R. Muller and G. Fuhrmann, Cells, 2020, 9, E194, DOI:10.3390/cells9010194.
- E. Schulz, A. Goes, R. Garcia, F. Panter, M. Koch, R. Muller, K. Fuhrmann and G. Fuhrmann, J. Controlled Release, 2018, 290, 46–55 CrossRef CAS PubMed.
- A. G. Evans, H. M. Davey, A. Cookson, H. Currinn, G. Cooke-Fox, P. J. Stanczyk and D. E. Whitworth, Microbiology, 2012, 158, 2742–2752 CrossRef CAS PubMed.
- J. Kahnt, K. Aguiluz, J. Koch, A. Treuner-Lange, A. Konovalova, S. Huntley, M. Hoppert, L. Søgaard-Andersen and R. Hedderich, J. Proteome Res., 2010, 9, 5197–5208 CrossRef CAS PubMed.
- J. E. Berleman, S. Allen, M. A. Danielewicz, J. P. Remis, A. Gorur, J. Cunha, M. Z. Hadi, D. R. Zusman, T. R. Northen, H. E. Witkowska and M. Auer, Front. Microbiol., 2014, 5, 474 Search PubMed.
- D. E. Whitworth, S. E. Slade and A. Mironas, Amino Acids, 2015, 47, 2521–2531 CrossRef CAS PubMed.
- D. Sutton, P. G. Livingstone, E. Furness, M. T. Swain and D. E. Whitworth, Front. Microbiol., 2019, 10, 2650 CrossRef PubMed.
- D. E. Wood and S. L. Salzberg, Genome Biol., 2014, 15, R46, DOI:10.1186/gb-2014-15-3-r46.
- H. Li and R. Durbin, Bioinformatics, 2009, 25, 1754–1760 CrossRef CAS PubMed.
- A. Bankevich, S. Nurk, D. Antipov, A. A. Gurevich, M. Dvorkin, A. S. Kulikov, V. M. Lesin, S. I. Nikolenko, S. Pham, A. D. Prjibelski, A. V. Pyshkin, A. V. Sirotkin, N. Vyahhi, G. Tesler, M. A. Alekseyev and P. A. Pevzner, J. Comput. Biol., 2012, 19, 455–477 CrossRef CAS PubMed.
- T. Seemann, Bioinformatics, 2014, 30, 2068–2069 CrossRef CAS PubMed.
- A. Gurevich, V. Saveliev, N. Vyahhi and G. Tesler, Bioinformatics, 2013, 29, 1072–1075 CrossRef CAS PubMed.
- A. J. Page, C. A. Cummins, M. Hunt, V. K. Wong, S. Reuter, M. T. Holden, M. Fookes, D. Falush, J. A. Keane and J. Parkhill, Bioinformatics, 2015, 31, 3691–3693 CrossRef CAS PubMed.
- L. M. Rodriguez-R and K. T. Konstantinidis, PeerJ Preprints, 2006, e1900v1901, DOI:10.7287/peerj.preprints.1900v1.
- J. P. Meier-Kolthoff, A. F. Auch, H.-P. Klenk and M. Göker, BMC Bioinf., 2013, 14, 60, DOI:10.1186/1471-2105-14-60.
- J. P. Meier-Kolthoff, R. L. Hahnke, J. Petersen, C. Scheuner, V. Michael, A. Fiebig, C. Rohde, M. Rohde, B. Fartmann, L. A. Goodwin, O. Chertkov, T. Reddy, A. Pati, N. N. Ivanova, V. Markowitz, N. C. Kyrpides, T. Woyke, M. Göker and H.-P. Klenk, Stand. Genomic Sci., 2014, 9, 2, DOI:10.1186/1944-3277-9-2.
- T. U. Consortium, Nucleic Acids Res., 2019, 47, D506–D515 CrossRef PubMed.
- N. Y. Yu, J. R. Wagner, M. R. Laird, G. Melli, S. Rey, R. Lo, P. Dao, S. C. Sahinalp, M. Ester, L. J. Foster and F. S. Brinkman, Bioinformatics, 2010, 26, 1608–1615 CrossRef CAS PubMed.
- T. N. Petersen, S. Brunak, G. von Heijne and H. Nielsen, Nat. Methods, 2011, 8, 785–786 CrossRef CAS PubMed.
- J. Huerta-Cepas, K. Forslund, L. P. Coelho, D. Szklarczyk, L. J. Jensen, C. von Mering and P. Bork, Mol. Biol. Evol., 2017, 34, 2115–2122 CrossRef CAS PubMed.
- J. Huerta-Cepas, D. Szklarczyk, D. Heller, A. Hernández-Plaza, S. K. Forslund, H. Cook, D. R. Mende, I. Letunic, T. Rattei, L. J. Jensen, C. von Mering and P. Bork, Nucleic Acids Res., 2019, 47, D309–D314 CrossRef CAS PubMed.
- W. Li and A. Godzik, Bioinformatics, 2006, 22, 1658–1659 CrossRef CAS PubMed.
- Y. Huang, B. Niu, Y. Gao, L. Fu and W. Li, Bioinformatics, 2010, 26, 680–682 CrossRef CAS PubMed.
- L. Fu, B. Niu, Z. Zhu, S. Wu and W. Li, Bioinformatics, 2012, 28, 3150–3152 CrossRef CAS PubMed.
- R. Ihaka and R. Gentleman, J. Comput. Graph. Stat., 1996, 5, 299–314 Search PubMed.
- T. Galili, Bioinformatics, 2015, 31, 3718–3720 CrossRef CAS PubMed.
- P. G. Livingstone, R. M. Morphew and D. E. Whitworth, Front. Microbiol., 2018, 9, 3187, DOI:10.3389/fmicb.2018.03187.
- M. Kim, H. S. Oh, S. C. Park and J. Chun, Int. J. Syst. Evol. Microbiol., 2014, 64, 346–351 CrossRef CAS PubMed.
- A. C. Pride, C. M. Herrera, Z. Guan, D. K. Giles and M. S. Trent, mBio, 2013, 4, e00305–e00313 CrossRef CAS PubMed.
- A. C. Pride, Z. Guan and M. S. Trent, J. Bacteriol., 2014, 196, 1619–1626 CrossRef PubMed.
- P. Nadal Jimenez, G. Koch, E. Papaioannou, M. Wahjudi, J. Krzeslak, T. Coenye, R. H. Cool and W. J. Quax, Microbiology, 2010, 156, 49–59 CrossRef PubMed.
- D. G. Lloyd and D. E. Whitworth, Front. Microbiol., 2017, 8, 439 CrossRef PubMed.
- K. V. Korotkov, T. L. Johnson, M. G. Jobling, J. Pruneda, E. Pardon, A. Héroux, S. Turley, J. Steyaert, R. K. Holmes, M. Sandkvist and W. G. Hol, PLoS Pathog., 2011, 7, e1002228 CrossRef CAS PubMed.
- A. Moraleda-Muñoz, J. Carrero-Lérida, J. Pérez and J. Muñoz-Dorado, J. Bacteriol., 2003, 185, 1376–1383 CrossRef PubMed.
- E. Y. Lee, J. Y. Bang, G. W. Park, D. S. Choi, J. S. Kang, H. J. Kim, K. S. Park, J. O. Lee, Y. K. Kim, K. H. Kwon, K. P. Kim and Y. S. Gho, Proteomics, 2007, 7, 3143–3153 CrossRef CAS PubMed.
- P. G. Livingstone, A. D. Millard, M. T. Swain and D. E. Whitworth, Microb. Genomes, 2018, 4(2) DOI:10.1099/mgen.0.000152.
Footnote |
| † Electronic supplementary information (ESI) available: Roary core genome sequences for M. xanthus DK1622. Chi square and total variation distance statistics. See DOI: 10.1039/d0mo00027b |
| This journal is © The Royal Society of Chemistry 2020 |