
Quantitative capillary zone electrophoresis-mass spectrometry reveals the N-glycome developmental plan during vertebrate embryogenesis†
Yanyan
Qu‡
a,
Kyle M.
Dubiak
a,
Elizabeth H.
Peuchen§
a,
Matthew M.
Champion
a,
Zhenbin
Zhang
a,
Alex S.
Hebert
b,
Sarah
Wright
a,
Joshua J.
Coon
b,
Paul W.
Huber
a and
Norman J.
Dovichi
 *a
*a
aDepartment of Chemistry and Biochemistry, University of Notre Dame, Notre Dame, IN 46556, USA. E-mail: ndovichi@nd.edu
bDepartments of Chemistry and Biomolecular Chemistry, University of Wisconsin-Madison, WI 53706, USA
First published on 26th February 2020
Abstract
Glycans are known to be involved in many biological processes, while little is known about the expression of N-glycans during vertebrate development. We now report the first quantitative studies of both the expression of N-linked glycans at six early development stages and the expression of N-glycosylated peptides at two early development stages in Xenopus laevis, the African clawed frog. N-Glycans were labeled with isobaric tandem mass tags, pooled, separated by capillary electrophoresis, and characterized using tandem mass spectrometry. We quantified 110 N-glycan compositions that spanned four orders of magnitude in abundance. Capillary electrophoresis was particularly useful in identifying charged glycans; over 40% of the observed glycan compositions were sialylated. The glycan expression was relatively constant until the gastrula–neurula transition (developmental stage 13), followed by massive reprogramming. An increase in oligomannosidic and a decrease in the paucimannosidic and phosphorylated oligomannosidic glycans were observed at the late tailbud stage (developmental stage 41). Two notable and opposing regulation events were detected for sialylated glycans. LacdiNAc and Lewis antigen features distinguished down-regulated sialylation from up-regulated species. The level of Lewis antigen decreased at later stages, which was validated by Aleuria aurantia lectin (AAL) and Ulex europaeus lectin (UEA-I) blots. We also used HPLC coupled with tandem mass spectrometry to identify 611 N-glycosylation sites on 350 N-glycoproteins at the early stage developmental stage 1 (fertilized egg), and 1682 N-glycosylation sites on 1023 N-glycoproteins at stage 41 (late tailbud stage). Over two thirds of the N-glycoproteins identified in the late tailbud stage are associated with neuron projection morphogenesis, suggesting a vital role of the N-glycome in neuronal development.
Introduction
N-Glycans are expressed on cell surfaces and are associated with a wide range of biological processes, including inflammation, cell adhesion, neural cell interactions, and nervous system development.1–6 However, glycans are challenging to study because of their complex structures and lack of convenient spectroscopic features. Sophisticated technologies have recently been developed for the study of N-glycans in developmental glycobiology. In one very impressive approach, chemical labeling and fluorescent microscopy have been used to visualize glycans incorporating modified monosaccharides, and this technology has been used to generate high-resolution images of glycans and to quantify specific monosaccharides in tissue by using fluorescence labeling during Danio rerio (zebrafish) development.7–9 These images, however, are silent on glycan composition and structure.In contrast, structural information is provided by the combination of glycan separation with mass spectrometry, albeit without localization information.10–13 The progress in quantitative isobaric tandem mass tags (TMT) provides an exciting opportunity to monitor glycan expression pattern changes throughout development at multiple stages.14,15 However, to date, applications of TMT tags have been limited to standards and well-characterized cell lines.16,17
In this work, we coupled capillary zone electrophoresis (CZE) with tandem mass spectrometry (MS/MS) to quantify TMT-labeled N-glycans with high dynamic range and high precision during early development in Xenopus laevis embryos. Use of a narrow inner diameter separation capillary (20 μm) and a very efficient electrospray interface provided high sensitivity detection,18–20 which allowed analysis of N-glycans generated from as little as 300 ng of yolk-depleted embryonic proteins. We used this technology to study the expression of N-linked glycans at six developmental stages: stage 1 (fertilized egg), stage 5 (16-cell, ∼2 h post-fertilization – hpf), stage 8 (blastula, midblastula transition, 5 hpf), stage 13 (gastrula–neurula transition, 15 hpf), stage 22 (early tailbud, 1 dpf), and stage 41 (late tailbud, ∼3 dpf). We also investigated glycosylation sites on N-glycoproteins in stage 1 and stage 41 embryos; two thirds of the N-glycoproteins identified at stage 41 are associated with neuron projection morphogenesis.
Only one other mass spectrometry-based study of N-glycan quantitation during vertebrate embryogenesis has been published.13 That study considered changes in N-glycan expression in zebrafish embryos, which are another vertebrate developmental model organism, using a label-free quantitation method. That study reported that the level of sialylated N-glycans with LacNAc antennae increased, while sialylated N-glycans with LacdiNAc antennae decreased, during development. Those observations are consistent with the results reported in this paper.
Experimental
Materials and reagents
Urea, triethylammonium bicarbonate (TEAB), ammonium acetate (CH3COONH4), ammonium bicarbonate (NH4HCO3), dithiothreitol (DTT), iodoacetamide (IAA), acetone, human chorionic gonadotropin (HCG), L-cysteine, Laemmli 2× Concentrate, acrylamide, and bovine serum albumin (BSA) were from Sigma-Aldrich (St. Louis, MO). PNGase F was from New England Biolabs (Ipswich, MA). AminoxyTMTsixplex and aminoxyTMTzero label reagents were from Thermo Scientific (Waltham, MA). Mammalian Cell-PE LB™ buffer (NP40) for embryo lysis was purchased from G-Biosciences (St. Louis, MO). Complete, mini protease inhibitor cocktail (provided in EASYpacks) was from Roche (Indianapolis, IN). Fluorescein labeled Aleuria aurantia lectin (AAL) was from Vector Laboratories (California, CA). TRITC conjugated Ulex europaeus lectin (Gorse, Furze) (UEA-I) was from EY Laboratories, Inc. (San Mateo, CA). Tween 20 was from VWR (Radnor, PA). Acetonitrile (ACN) and acetic acid were from Fisher Scientific (Pittsburgh, PA). Water and methanol were from Honeywell Burdick & Jackson (Wicklow, Ireland). Xenopus laevis (X. laevis) was from Nasco (Fort Atkinson, WI). Marc's Modified Ringers (MMR) was prepared in-house from 0.1 M NaCl, 2 mM KCl, 1 mM MgSO4, 2 mM CaCl2, 0.5 mM HEPES, and 0.1 mM EDTA from Fisher Scientific (Waltham, MA).Xenopus laevis embryo culture and protein preparation
All animal procedures were performed according to protocols approved by the University of Notre Dame Institutional Animal Care and Use Committee (Approval number: 18-02-04408), as described elsewhere.21,22 Briefly, female Xenopus laevis were induced to spawn by injection with 600 units of HCG 12–15 h prior to spawning. At the time of spawning, testes were isolated from males that had been immersed in ice water for 15–20 min. Eggs and minced testes were combined in 2–5 mL 1/3× MMR (0.1 M NaCl, 2.0 mM KCl, 1 mM MgSO4, 2 mM CaCl2, 5 mM HEPES, pH 7.4) and left to fertilize at room temperature. After 10 min, the eggs and testes were flooded with additional 1/3× MMR and incubated for another 20 min. After fertilization, the embryos were dejellied using 1/3× MMR plus 2% L-cysteine by incubating with swirling for 4 min, upon which the eggs were washed with 1/3× MMR and then allowed to develop at room temperature in 1/3× MMR.Twenty embryos were collected using a Pasteur pipette at each of the following developmental stages: 1, 5, 8, 13, 22, and 41; embryos were collected into Eppendorf tubes. Six tubes with embryos from each stage were considered as a set, being one biological replicate. Based on the information from ref. 23 and 24, stage 1 was collected immediately after fertilization; stage 5 was collected 2 h post fertilization; stage 8, 5 h post fertilization; stage 13, approximately 15 h post fertilization; stage 22, 1 day post fertilization; and stage 41 was collected at 3 days, 4 h post fertilization. The morphogical characteristics were confirmed with a microscope when collecting the embryos. All samples were snap frozen in liquid nitrogen immediately following collection to preserve the experimental time point. The six-stage embryo sets were collected in biological triplicates.
Compared to other common lysis buffers, the use of NP40 discriminates against yolk, which accounts for ∼90% by weight of early stage embryos.21 In this experiment, we depleted the yolk using NP40 extraction to increase the relative portion of embryonic proteins before filter aided N-glycan purification as well as to improve the performance of de-N-glycopeptide analysis. The twenty embryos in each Eppendorf tube were suspended in 600 μL of NP40 buffer containing complete protease inhibitor and homogenized for 60 s, followed by sonication for 5 min twice on ice. The lysates were then centrifuged for 10 min at 14![[thin space (1/6-em)]](https://www.rsc.org/images/entities/char_2009.gif) 000g, and the supernatant was collected in a fresh tube for further protein concentration measurements using the bicinchoninic acid (BCA) method.
000g, and the supernatant was collected in a fresh tube for further protein concentration measurements using the bicinchoninic acid (BCA) method.
Filter aided N-glycan purification of Xenopus embryos
Each protein sample (100 μg) from stage 1, 5, 8, 13, 22, and 41 embryos was reduced with 10 mM DTT for 2 h at 37 °C and alkylated with 25 mM IAA in the dark at room temperature for 45 min. The alkylated proteins were then transferred to a Microcon®−30 centrifugal filter unit (Merck, Darmstadt, Germany) with a filter membrane for sample cleanup and N-glycan preparation. Basically, the lysis buffer NP40 was first removed by centrifugation for 20 min at 16000g. The proteins on the membrane were then washed three times with 200 μL of 8 M urea in 50 mM TEAB via centrifugation at 18000g for 30 min each time. Subsequently, the proteins were washed four times with 200 μL of 20 mM TEAB via centrifugation at 15000g for 20 min each time to remove the urea. Finally, 50 μL of PNGase F solution in 20 mM TEAB (0.5 μL PNGase F/100 μg protein) was loaded onto each filter membrane, and the samples were vortexed for 5 min followed by N-deglycosylation at 37 °C for 16 h.
The released glycans were separated from the proteins via centrifugation at 15000g for 15 min, followed by three washes with 50 μL of 20 mM TEAB buffer. The combined glycan eluates from each embryo stage were lyophilized with a vacuum concentrator (Thermo Fisher Scientific, Marietta, OH). Glycan samples were prepared in biological triplicates.
AminoxyTMT labeling and multiplex glycome fractionation
Glycan samples from stage 1, 5, 8, 13, 22 and 41 embryos were labeled with aminoxyTMT6-126, aminoxyTMT6-127, aminoxyTMT6-128, aminoxyTMT6-129, aminoxyTMT6-130, and aminoxyTMT6-131 reagents, respectively, according to the manufacturer's protocols. Each aminoxyTMT reagent was dissolved in 200 μL of 95% methanol with 0.1% acetic acid, and transferred into the corresponding tube that contained the lyophilized glycans. Each resulting sample was mixed by continuous vortexing for 10 min at room temperature, and then the liquid was evaporated with a vacuum concentrator. Subsequently, 200 μL of 95% methanol was added to the samples to dissolve them and they were mixed again for 10 min. After lyophilization, 100 μL of 10% acetone was added to each labeled glycan sample and incubated for 10 min with continuous vortexing to quench excess reagent. Finally, six samples with differently aminoxyTMT labeled glycans were combined and subjected to lyophilization with a vacuum concentrator.An Oasis™ HLB cartridge (3 cc Vac, Waters, Milford, MA) was used to clean up and fractionate the sixplexed glycan sample. Briefly, each sample was redissolved in 200 μL of 50% ACN and then loaded onto the equilibrated Oasis™ HLB column, which was filled with 3 mL of 95% ACN. After washing the column twice with 3 mL of 95% ACN to ensure the removal of the quenched reagent, the labeled glycans were sequentially eluted with 2 mL of 90% ACN (fraction 1), 85% ACN (fraction 2), 80% ACN (fraction 3) and 50% ACN (fraction 4). Each glycan fraction was lyophilized using a vacuum concentrator and stored at −20 °C before further analysis. To evaluate the method's reproducibility, two aliquots of proteins from one biological replicate at different stages were taken for filter aided N-glycan purification, aminoxyTMT labeling and multiplex glycome fractionation, following the same protocol as the technical duplicates. The TMT labeling channel for each stage was constant for the technical and biological replicates.
Glycomic CZE-ESI-MS/MS and data analysis
Capillary zone electrophoresis (CZE) separation of aminoxyTMT6 labeled glycans was performed using an uncoated fused silica capillary (20 μm i.d. × 150 μm o.d. × 60 cm length, Polymicro Technologies, Phoenix, AZ). The separation voltage was provided by a Spellman CZE 1000R high-voltage power supply.CZE was coupled with ESI-MS via our third generation electrokinetically pumped sheath-flow nanospray interface.20 Briefly, the distal end of the separation capillary was etched using hydrofluoric acid to reduce the o.d. to ∼50 μm (Caution: use appropriate safety procedures while handling HF solutions). An emitter was prepared from a borosilicate glass tube (0.75 mm i.d. × 1.0 mm o.d. × 10 cm), which was pulled to a ∼23 μm diameter tip using a P-1000 flaming/brown micropipet puller (Sutter Instruments, Novato, CA). The electrospray interface was constructed from a plastic cross. The emitter was placed in one arm of the cross. The separation capillary was threaded through the cross into the emitter so that the tip of the etched capillary was located at the emitter tip. The other two arms of the cross were connected to a sheath buffer reservoir with plastic tubing and to a syringe filled with sheath electrolyte for system flushing. The sheath electrolyte was 10% (v/v) methanol and 0.5% (v/v) FA.
The dried aminoxyTMT6 glycan fractions eluted with 90%, 85%, 80% and 50% ACN were redissolved in 6 μL, 4 μL, 2 μL, and 2 μL, respectively, of an electrolyte consisting of 5 mM NH4HCO3. The different resuspension volumes were used to normalize the sample concentrations across the fractions.
The injection end of the capillary was fixed in a block that allowed pumping fluids with either pressure or voltage.25 Samples were injected hydrodynamically for 1 second at 30 psi, producing an injection volume of ∼1.3 nL. The background electrolyte for the separation was 25 mM CH3COONH4 (pH ∼ 4.7). The capillary was sequentially washed prior to injection with 1 M NaOH, water, and background electrolyte at 30 psi for 15 min. During separation, 20 kV was applied at the injection end of the capillary and 2.0 kV was applied at the sheath buffer reservoir for electrospray. The mass spectrometer faceplate was grounded. The power supplies were controlled by LabView software.
A Q-Exactive HF mass spectrometer (Thermo Fisher Scientific) was operated in positive ion mode for acquiring N-glycan quantitative information. Full MS scans were acquired in an Orbitrap mass analyzer over m/z 500–2000 with a resolution of 30 K. The top-ten HCD scans per full scan were acquired with a normalized collision energy (NCE) of 45%. The resolution of the MS/MS scan was set at 15 K. One microscan was set for each MS and MS/MS scan. The target value was 3 × 10⁶ and the maximum injection time was 50 ms. The dynamic exclusion duration was 5 s.
Applying a higher NCE for the HCD scan increased the reporter ion yield of complex type and acidic N-glycans, while preserving backbone fragment information.26 In addition to the HCD scan, an extra CID scan of aminoxyTMT6N-glycans at MS2 for structure sequencing was performed on an Orbitrap Fusion Lumos mass spectrometer (Thermo Fisher Scientific). The full MS was acquired with an m/z range of 500–1700 and detected in the Orbitrap at a resolution of 60 K with an AGC target of 1 × 10⁶, maximum injection time of 50 ms, and 1 microscan. The CID data-dependent MS2 acquisition with a dynamic exclusion of 5 s was detected in the Orbitrap with a resolution of 50 K. The collision energy was 25% and the activation time was 10 ms.
The acquired data were processed manually using Xcalibur software.17 The glycan compositions were assigned by accurate precursor mass matching (10 ppm tolerance) and MS2 fragmentation characterization. The CZE migration behavior was also used to filter and confirm the glycan IDs. HCD scans of the precursors during their elution windows were used to record the reporter ion peak intensities (m/z 126.13, 127.14, 128.14, 129.14, 130.15, and 131.15). The ratios of normalized channels were then calculated to represent the relative abundance of the corresponding N-glycans.
Four abbreviations are used to represent monosaccharide residues: HexNAc, N-acetylglucosamine (GlcNAc) or N-acetylgalactosamine (GalNAc); Hex, galactose, glucose, or mannose; Fuc, fucose; and Neu5Ac, N-acetylneuraminic acid. The glycan compositions are represented by assigning the number of monosaccharides and substituents in order: HexNAc; Hex; Fuc; NeuAc; and phosphate. For example, G26001 represents a glycan composition of 2 HexNAc, 6 Hex, 0 Fuc, 0 Neu5Ac, and 1 phosphate.
Solid-phase de-N-glycopeptide isolation of Xenopus embryos
de-N-Glycopeptides were isolated from stage 1 and stage 41 embryos by employing solid-phase extraction of N-glycopeptides (SPEG) as described in previous studies with some modifications.27–29 NP40 was employed for protein extraction. The NP40 lysate supernatant obtained from two hundred embryos at each stage was precipitated with cold acetone (v/v, 1/4) at −20 °C overnight. After centrifugation, the protein pellets were washed with cold acetone twice, dried at room temperature, and resuspended in 8 M urea in 100 mM NH4HCO3 buffer (pH 8.0) via vortexing with sonication.Each protein sample (4 mg) was reduced with 10 mM DTT for 2 h at 37 °C and alkylated with 25 mM IAA in the dark at room temperature for 45 min. After the solutions were diluted nine times with 100 mM NH4HCO3 (pH 8.0) to reduce the urea concentration below 1 M, digestion was performed with a trypsin/protein mass ratio of 1/30 at 37 °C overnight. The peptides were then desalted with a Sep-Pak C18 Cartridge (Waters, Milford, MA).
Glycosylated peptides were oxidized with 10 mM NaIO4 in 100 mM CH3COONa and 150 mM NaCl (pH = 5.5) at room temperature for 1 h in the dark; then the reaction was quenched with 25 mM Na2S2O3 for 20 min. The resulting solution was incubated with 150 μL of equilibrated UltraLink® hydrazide resin (Thermo Scientific) at room temperature for 16 h. The resins were then washed six times each with 1.5 M NaCl, water, 80% ACN, and 50 mM NH4HCO3 buffer. De-N-glycopeptides were liberated via incubating the resins in 50 mM NH4HCO3 buffer (pH 8.0) with 4.5 μL of PNGase F at 37 °C overnight. The supernatant was collected and combined with the wash solutions. The released de-N-glycopeptides were then desalted with Pierce® C-18 spin columns (Thermo Scientific) and lyophilized using a vacuum concentrator.
de-N-Glycoproteomic UPLC-ESI-MS/MS and data analysis
de-N-Glycosylated peptides prepared from early and late stage Xenopus embryos were analyzed using a UPLC-ESI-MS/MS system composed of a nanoACQUITY UltraPerformance LC® (UPLC®) M-Class system (Waters, Milford, MA) and a Q Exactive HF mass spectrometer. Chromatography was performed using an ACQUITY UPLC M-Class Peptide BEH130 C18 column (300 Å, 1.7 μm, 100 μm × 100 mm, Waters, Milford, MA). The column temperature was 45 °C. Solvent A (0.1% FA in water) and solvent B (0.1% FA in ACN) were used to establish a 96 min gradient, comprised of 14 min of 2%, then 1 min of 2–6%, 70 min of 6–28%, and 1 min of 28–80%, and finally maintained at 80% of solvent B for 10 min, with a flow rate of 0.75 μL min−1.The Q Exactive HF mass spectrometer was operated in positive ion mode. The electrospray voltage was 1.8 kV. Full MS scans were acquired in the Orbitrap mass analyzer over m/z 350–1800 with a resolution of 60000. The number of microscans was set as one; the AGC target was 3 × 10⁶; and the maximum injection time was 50 ms. The top-twelve HCD scans per full scan were acquired with an NCE of 29% and the resolution of the MS/MS scan was set at 30000. The dynamic exclusion duration was 60 s.
Raw files were analyzed using MaxQuant (version 1.6.1.0). MS/MS spectra were searched against the protein reference database from Xenopus laevis genome 9.1 downloaded from the Xenbase website (downloaded 31 October 2016). Oxidation (M), acetyl (K), acetyl (protein N-term), acetyl (N-term), and deamination (N) were set as variable modifications; carbamidomethyl (C) was set as a fixed modification. Trypsin was the specific digestion enzyme; a maximum of two missed cleavages was allowed. The precursor mass tolerances of the first search and main search were 20 and 4.5 ppm, respectively. The fragment ion mass tolerance was 20 ppm. False discovery rates (FDRs) were 1% for both peptide and protein identification. For de-N-glycopeptide identification, only asparagines (N) with deamidation probabilities ≥ 0.9 and within the canonical sequence motif N-!P-S/T/C (where !P signifies any amino acid except proline) were accepted as true glycosylation sites.30,31 The statistically enriched gene ontology (GO) categories for the identified Xenopus formerly glycosylated proteins were analyzed by Cytoscape (v3.7.1) plugin ClueGO.32,33
Lectin blot analysis
Acetone precipitated protein samples from embryos at stage 1, 5, 8, 13, 22, and 41 were subjected to SDS-PAGE and lectin blotting. The samples were resuspended in NP40 buffer. Laemmli 2× Concentrate was added to each sample (25 μg) and boiled for 5 min. The samples were then loaded onto a 10% acrylamide gel and run for 2.5 h at 70 Volts. The proteins were transferred to a nitrocellulose membrane (Maine Manufacturing LLC, Sanford, ME) in Towbin Buffer overnight at 4 °C at 20 Volts. The membranes were then blocked using 5% BSA in 1 × PBS containing 1% Tween 20 (VWR) for 2 h at room temperature. Fluorescein labeled AAL and TRITC conjugated UEA blotting were performed. The lectins were added to 0.5% BSA in 1× PBS containing 1% Tween 20 to a final concentration of 1:500. The membranes were stained with gentle rocking overnight at 4 °C. The membranes were rinsed three times with 1 × PBS containing 1% Tween 20 and fluorescently imaged using an Azure c400 gel imaging system (Azure Biosystems, Dublin, CA).
Results and discussion
Xenopus laevis N-glycan diversity
The N-glycome was analyzed at six development stages: stage 1 (fertilized egg), stage 5 (16-cell), stage 8 (midblastula transition), stage 13 (gastrula–neurula transition), stage 22 (early tailbud), and stage 41 (late tailbud). Yolk-depleted embryo samples were treated with PNGase-F to release the N-glycans. PNGase F doesn’t cleave when α1–3 fucose is on the core GlcNAc. This situation is primarily found in plants and invertebrates, and is not expected to be present in Xenopus. The liberated N-glycans were isolated with a filter-aided protocol that enabled the removal of lysis detergent followed by the purification of N-glycans without transferring the samples. After labeling with six-plex TMT reagents, the samples were pooled and four fractions were generated using HLB solid phase, the same column for access reagent cleanup, to reduce the wide glycome dynamic range in the Xenopus model (see Fig. S1, ESI†). Then each fraction was analyzed by CZE-MS/MS (Fig. 1). Experiments were performed in biological triplicate.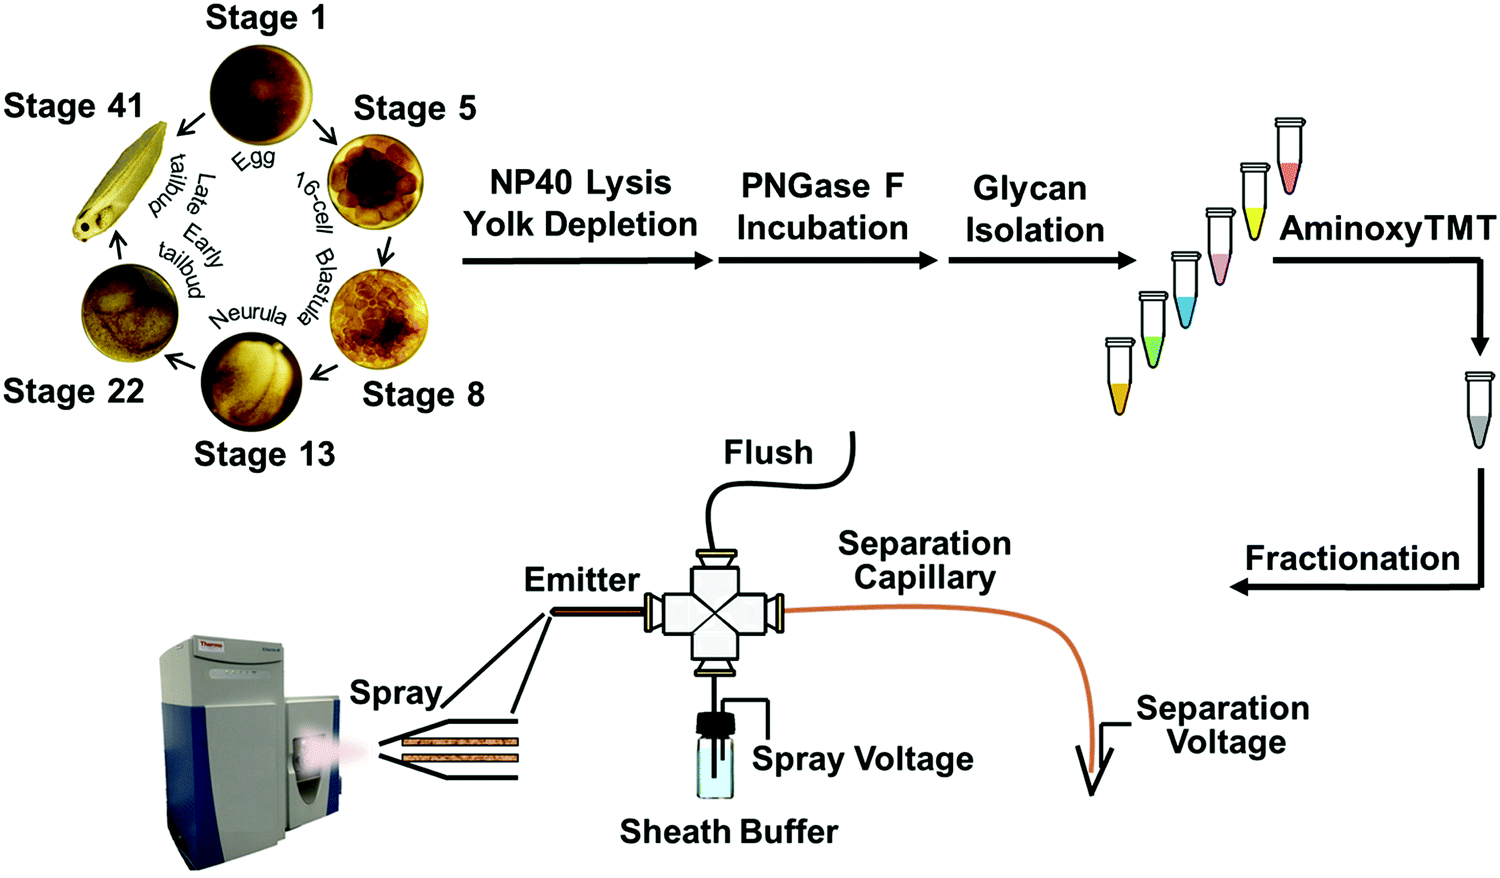 | ||
| Fig. 1 Analytical pathway of multiplex N-glycomic quantitation of Xenopus laevis embryogenesis using a custom-built CZE-ESI-MS/MS platform with a third-generation electrokinetically-pumped sheath-flow nanospray interface. | ||
Fig. 2A presents the base peak electropherogram of the second fraction generated by solid-phase extraction. CZE separation generated distinct regions with zero, one, two, and three negative charges, and allowed separation of the lower pKa phosphorylated glycans from the sialylated glycans (Fig. 2A inset).
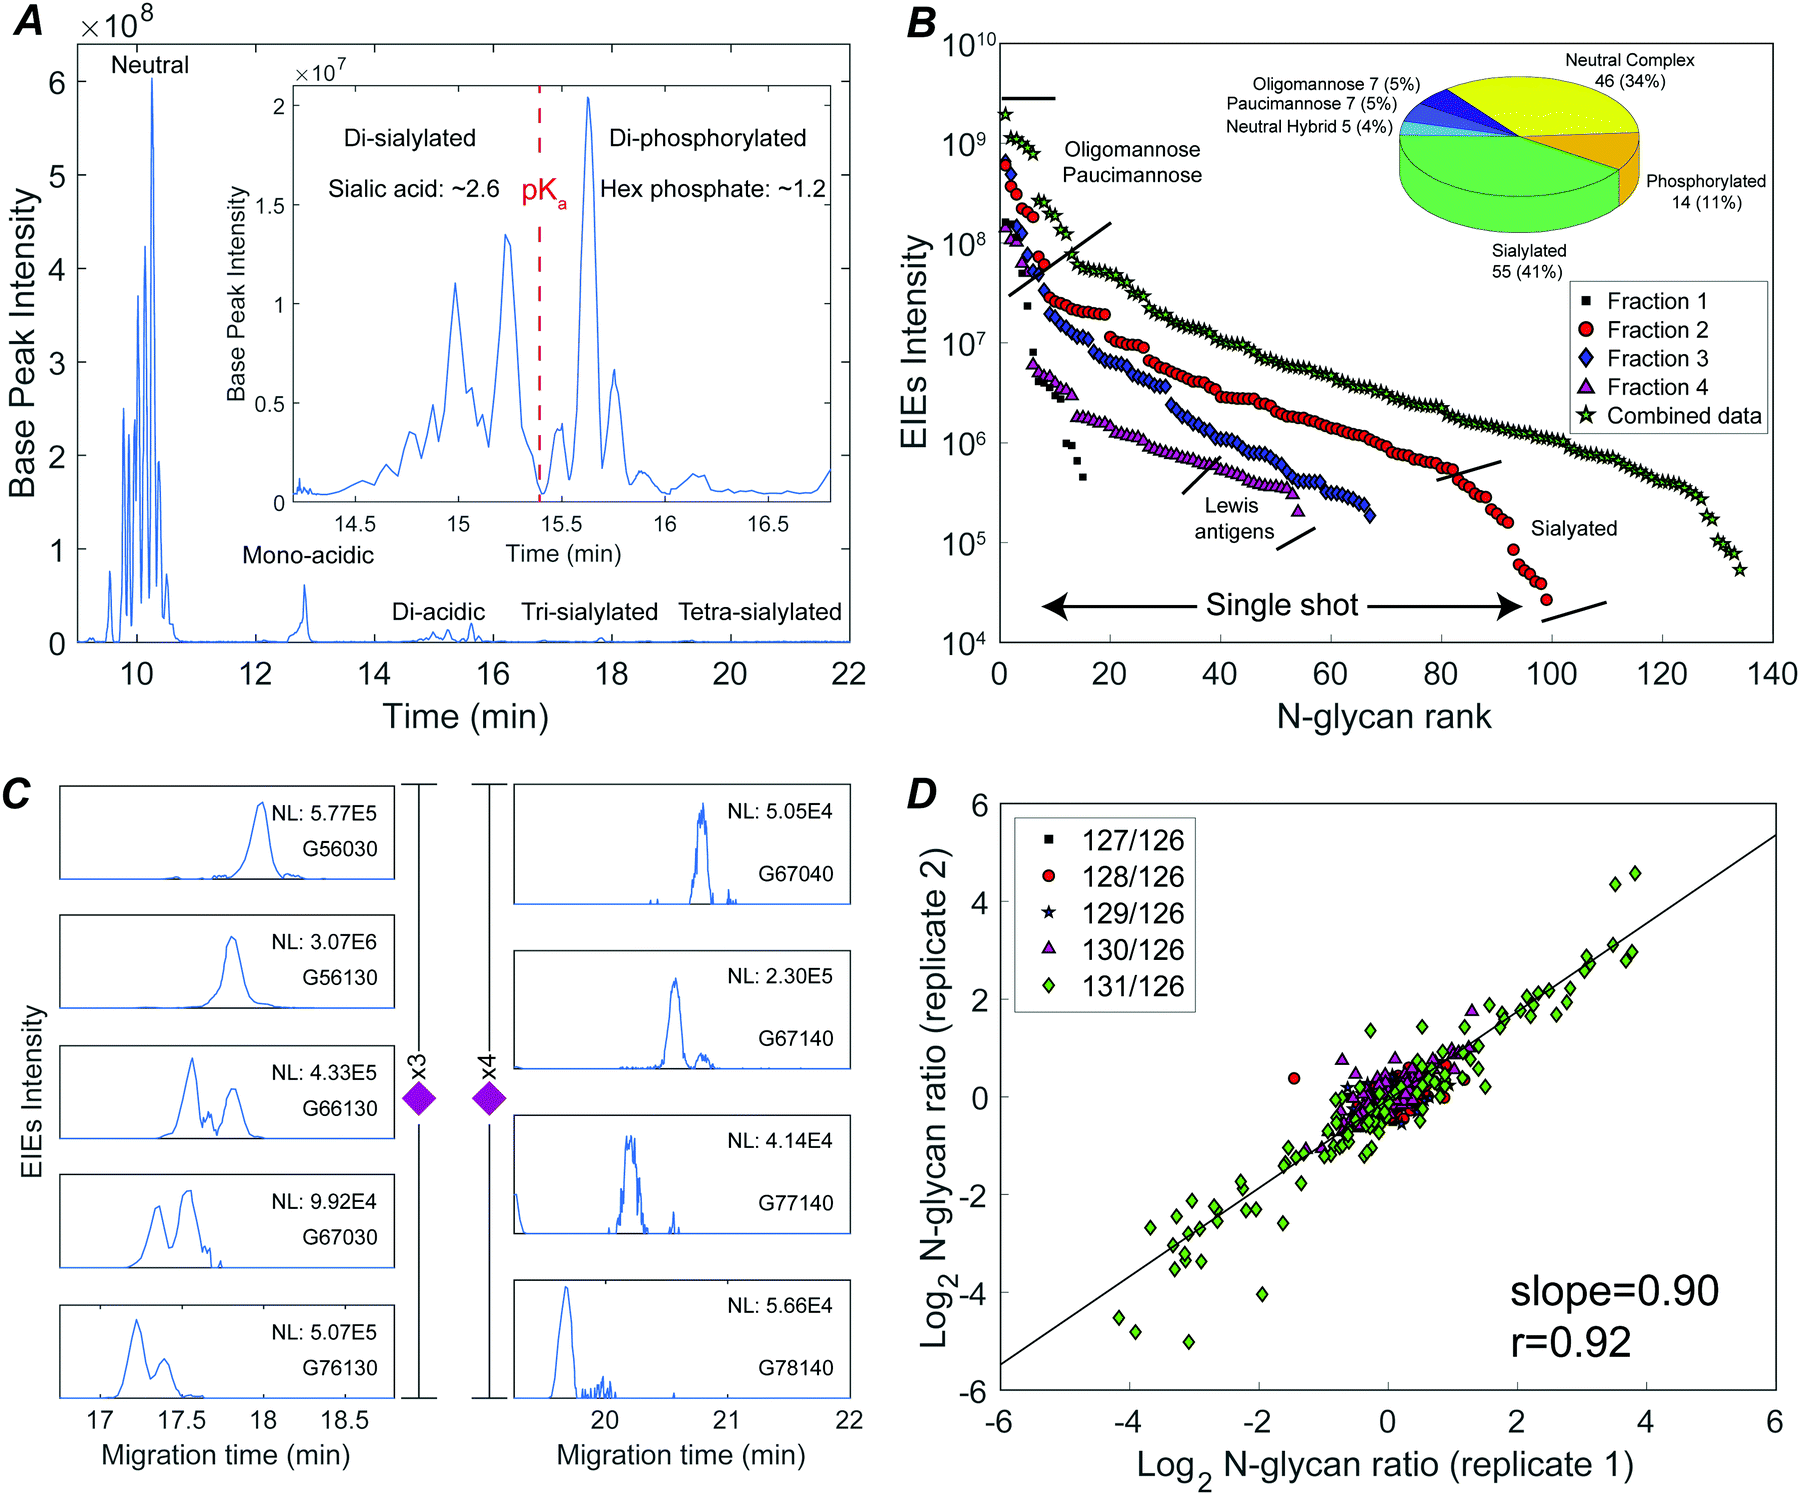 | ||
| Fig. 2 Deep N-glycome discovery and quantitation of a sixplexed sample using CZE-ESI-MS/MS. (A) Base peak electropherogram of fraction 2 (red circles in panel B); the inset shows the resolution of di-sialylated and di-phosphorylated species. (B) N-Glycan abundances covering a 3–4 orders of magnitude dynamic range in single-shot CZE-ESI-MS/MS analysis of the four fractions, and spanning a 4 orders of magnitude concentration range in the concentration-adjusted combined data. The inset shows the numbers of identified glycan compositions. (C) Extracted ion electropherograms (EIEs) of low abundance tri- and tetra-sialylated N-glycans. Glycan compositions are represented as G(HexNAc; Hex; Fuc; NeuAc; phosphate). (D) Galaxy plot correlating N-glycan changes in abundance between the two technical replicates. | ||
The TMT reagent adds one positive charge to glycans, which allows electrophoretic separation of neutral glycans; roughly half of the identified glycan compositions were neutral (Fig. 2B inset, and Table S1, ESI†). Neutral oligomannose and paucimannose were typically resolved near the front of the electropherogram. Neutral complex N-glycans were isolated and observed to have much lower abundance compared to oligomannose (Table S1, ESI†). The antennae of neutral complex N-glycans were investigated. It is known that LacdiNAc antennae (GalNAc-β1,4-GlcNAc) usually present in insects, while in mammals and other vertebrates, complex- and hybrid-type N-glycans usually contain LacNAc antennae (Gal-β1,4-GlcNAc).13 Among the identified neutral complex N-glycans, the LacdiNAc antenna was rarely detected; instead, LacNAc dominated with a common observation of Gal extension (Fig. S2A, ESI†). Composition G56100 (m/z 818.6818, 3+), for example, could be a bisected biantennary structure with Gal extended LacNAc (as suggested by the diagnostic ions of m/z 1091.5386 (1+, Hex1HexNAc3)), instead of being solely assigned as mammals’ common tri-antennary structure with terminated LacNAc antennae (Fig. S2B, ESI†). Another notable feature was the high degree of fucosylation in neutral complex N-glycans. Roughly 54% of compositions were assigned as multi-fucosylated species (with ≥two fucose) and 35% contained at least three fucose residues, suggesting the heavy expression of Lewis antigens. The Lewis patterns were not unambiguously confirmed when the antenna arms were heavily fucosylated (Fig. S2C, ESI†), because the occurrence of di-fucosylated LacNAc (Lewis Y) would also result from fucose rearrangement between mono-fucosylated LacNAc arms (Lewis X) upon MS/MS fragmentation.34,35
CZE provides remarkable separation of trace-level acidic glycans from the abundant, neutral oligomannosidic and paucimannosidic glycans. Half of the glycan compositions identified were acidic: ∼40% were sialylated N-glycans and ∼10% were phosphorylated (inset in Fig. 2B). TMT labeled mono-acidic glycans are nearly neutral and are not well resolved by electrophoresis. However, the CZE-MS/MS system generated well-resolved peaks for low abundance and slower-migrating tri- and tetra-sialylated N-glycans, Fig. 2C.
By investigating the MS/MS fragmentation, the antenna pattern of sialylated glycan was observed to be different from the neutral complex type. In addition to sialyl LacNAc, sialyl LacdiNAc (as suggested by the diagnostic ions of m/z 698.2615 (1+, HexNAc2NeuAc1) and 860.3143 (1+, Hex1HexNAc2NeuAc1)) was commonly detected (Fig. S3, ESI†).10,13
Phosphorylated N-glycans migrated after sialylated N-glycans due to their lower pKa (Fig. 2A inset). Oxonium ions with m/z values of 243.0256 (1+, Hex1Phosphate1) and 405.0783 (1+, Hex2Phosphate1) were prominent in the MS/MS fragmentation spectra of these compositions, confirming the existence of mannose-6-phosphate (M6P) (Fig. S4, ESI†).36,37 The 14 M6P species could be categorized into two groups: high-mannose-type, which was mainly observed from mono-phosphorylated N-glycans, and high-mannose-type capped with HexNAc, which was common in di-phosphorylated species (Fig. S4, ESI†).36
Quantitative changes in glycosylation during X. laevis development
The system produced a nearly four orders of magnitude dynamic range in extracted ion intensities (MS1) across 99 N-glycan compositions for single-shot analysis of fraction 2 (Fig. 2B). 134 N-glycans spanning a four orders of magnitude concentration range were identified combing concentration-adjusted extracted ion intensities from all four fractions (Table S1, ESI†).143 compositions were identified across three biological replicates; 110 N-glycan compositions were quantified using TMT reporter ions (MS2) (Fig. S5, ESI†). The reproducibility of TMT quantitation was tested for technical duplicates. The N-glycan fold changes across different embryo stages were well correlated (log–log slope = 0.90) (Fig. 2D).
Fig. 3 presents volcano plots of the quantified N-glycans, with the p-value determined by a two-tailed, unpaired Student's t-test. The N-glycan expression levels had no substantial changes before stage 13. A marked increase in statistically significant changes occurs at stage 22 and dramatically increases at stage 41. Roughly 54% of quantified N-glycans (59 compositions) exhibited significant changes in abundance at stage 41 (p < 0.027, Benjamini–Hochberg corrected with FDR < 5%); of these, 50 N-glycans had at least a 2-fold change in abundance. The glycan molecular mass, fold change, and p-values are presented in Table S2 (ESI†).
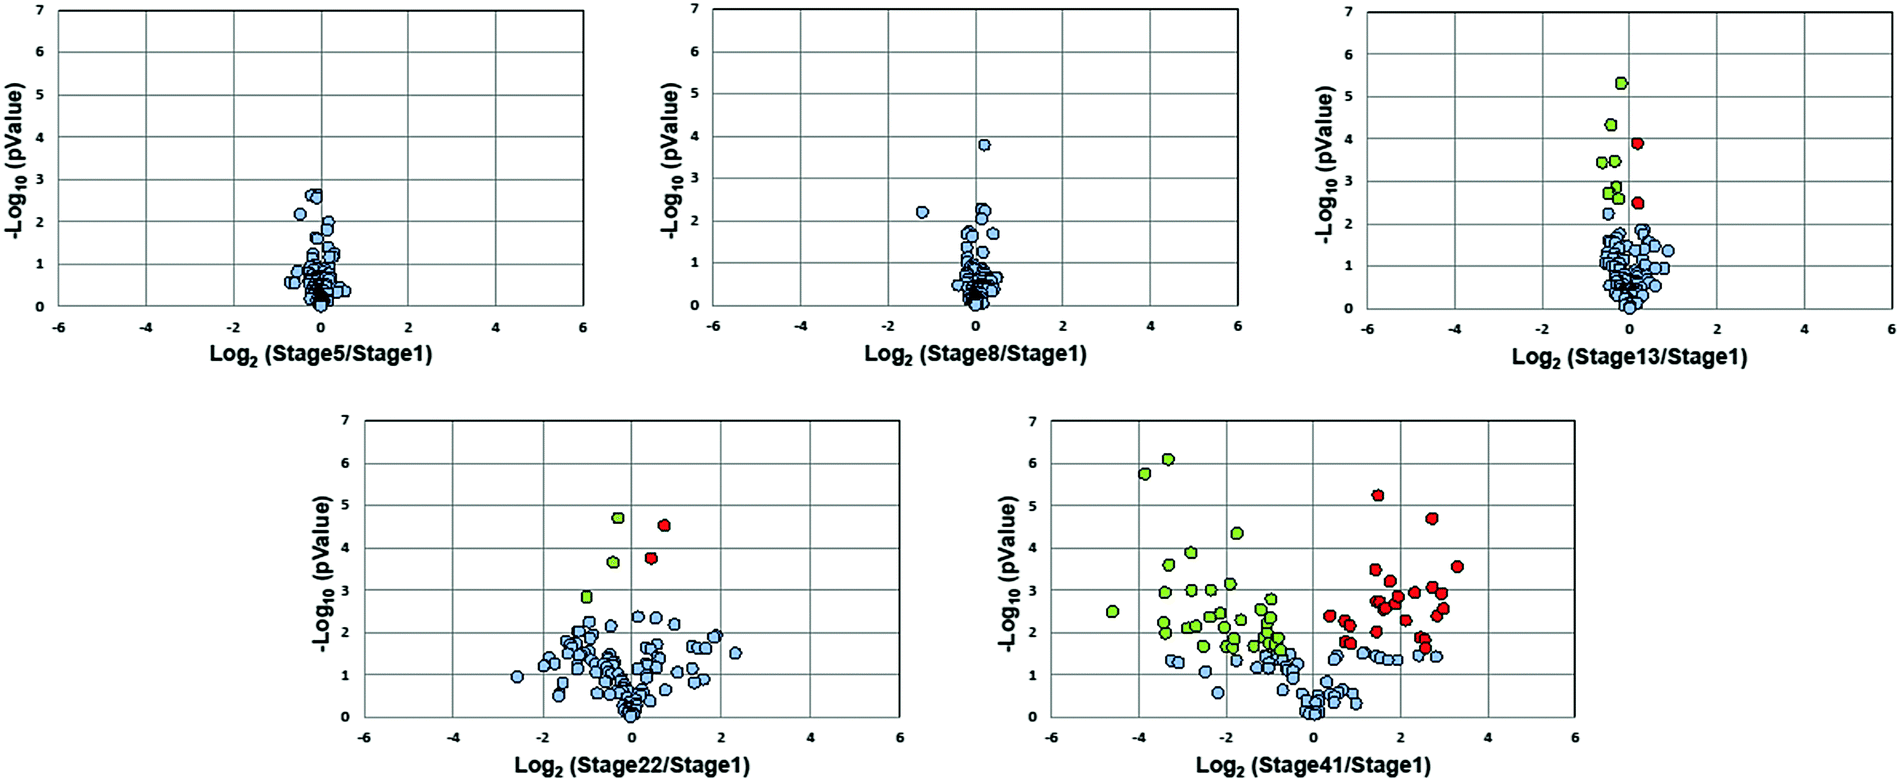 | ||
| Fig. 3 Volcano plots of the quantified N-glycan compositions over six embryonic stages during development. Glycans with significant changes are marked in red (increase) and green (decrease), respectively. | ||
Stage 13 marks the end of gastrulation and the beginning of neurulation, when the cells of the three germ layers begin to differentiate into distinct cell types. This important developmental transition is reflected in substantial changes of the embryo N-glycome detected at neurulation and that continue into the tail bud stage (Fig. 4A). Roughly half the glycans show a two-fold increase in expression while the other half show a decrease.
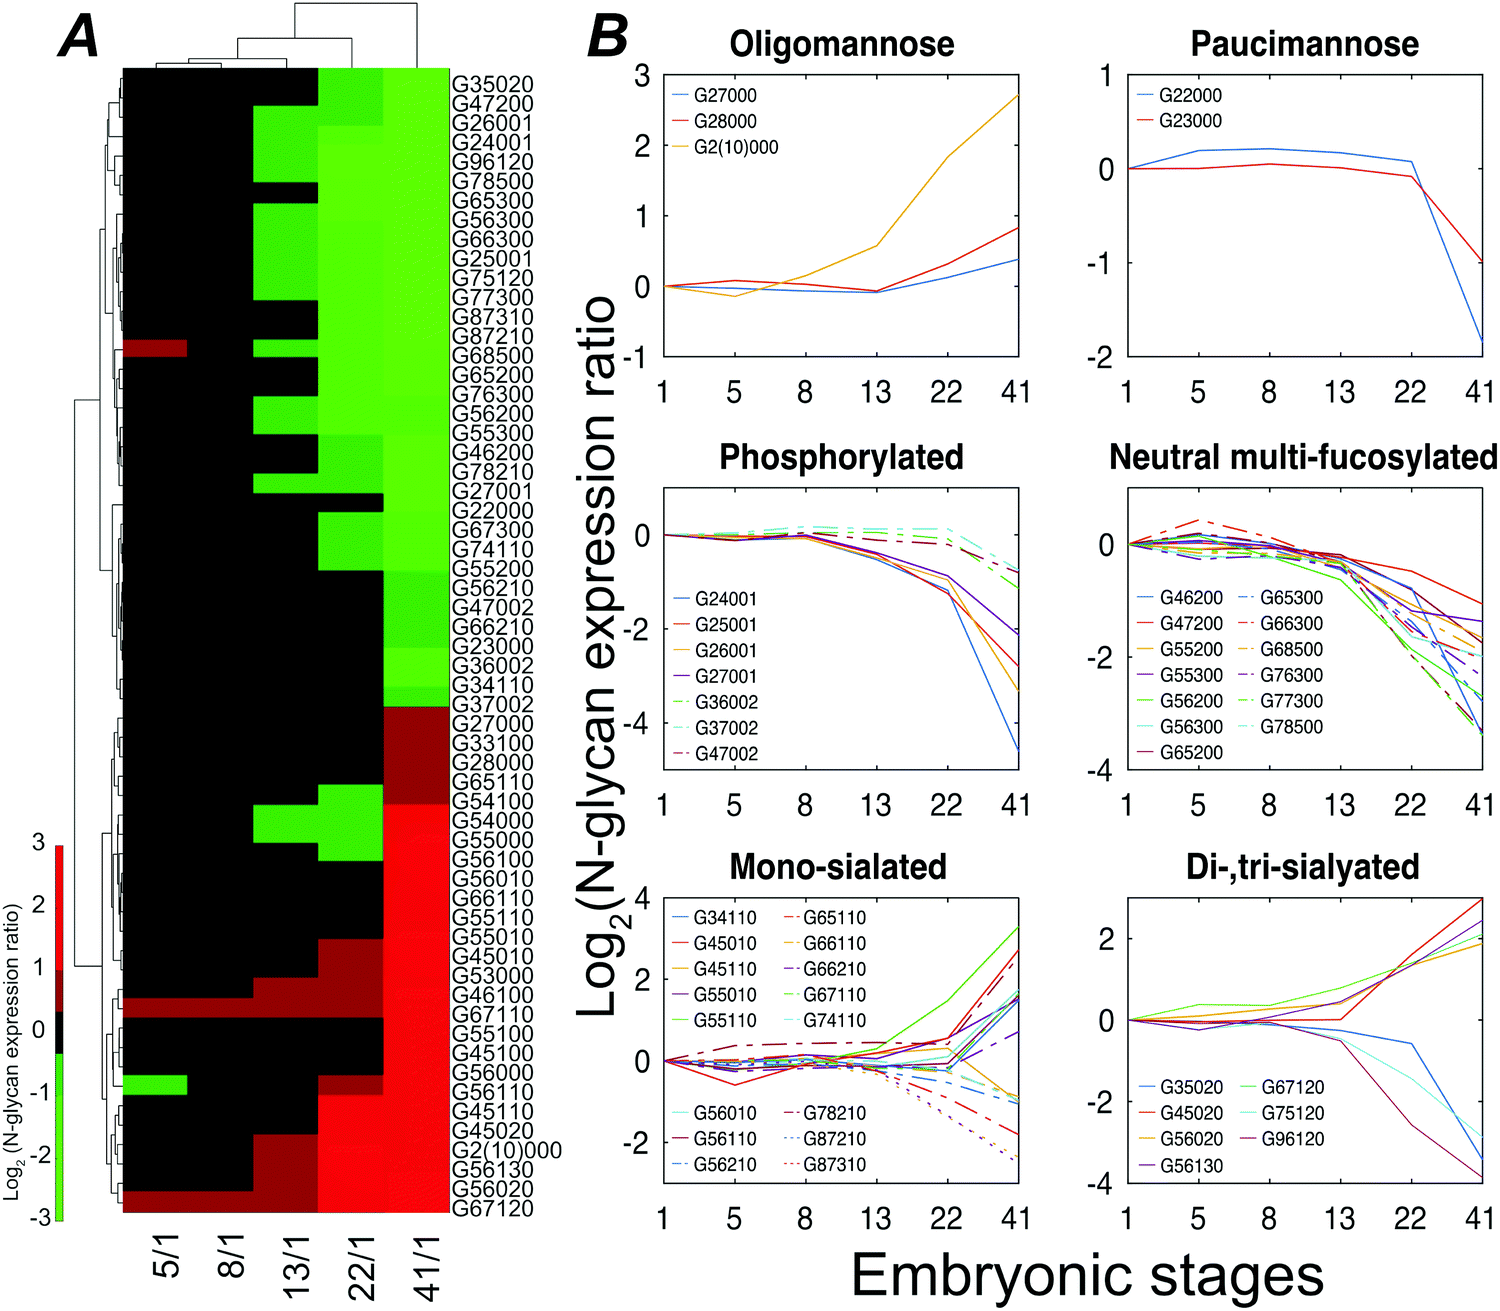 | ||
| Fig. 4 Xenopus laevis embryo N-glycome analysis. (A) Heatmap displaying variations of statistically significant (p-value < 0.027) N-glycan compositions expressed at stage 41. (B) Structural clustering of quantified N-glycans with statistically significant changes across six embryonic time points. | ||
The expression of different classes of glycans exhibits changes during Xenopus laevis embryogenesis (Fig. 4B). Oligomannose was slightly upregulated at late stages, resulting in a constant dominance throughout all the analyzed time points. In contrast, truncated paucimannosidic N-glycans showed significant decline at stage 41. This observation is consistent with recent lectin microarray data for Xenopus laevis embryos, which reported that the signals of oligomannosidic N-glycan binding lectins increased from stage 15, being consistently correlated with the detected expression decrease of the mannoside acetylglucosaminyltransferase 1 (Mgat1) gene at a late stage.38Mgat1 processes the synthesis of hybrid- and complex-N-glycans. The low expression of Mgat1 likely increases the oligomannose level; however, the decrease in the hybrid- or complex-type at late stages was ambiguous. According to earlier paucimannosylation studies,39–41 it may be reasonable to assume that down-regulation of β-N-acetylhexosaminidase activity leads to the decline of paucimannose, as well as redirecting the pathway towards the elaboration of hybrid and complex N-glycans, which is consistent with our observations. The M6P category, both mono- and di-phosphorylated species, declined during development by up to 25-fold at stage 41.
CZE separations depend on the solution-phase charge of the analyte, and CZE is particularly useful for investigation of sialylation, where two notable and opposing events were observed. LacdiNAc and Lewis antigen features distinguished down-regulated sialylation from up-regulated species. The reduction of the LacdiNAc-containing sialylated glycans at a later stage was also found in a previous zebrafish embryogenesis study, which has been speculated to have a biosynthetic pathway switch from LacdiNAc to LacNAc at late development stages.13
Lewis antigen neutral complex N-glycan, another subtype, was observed to decrease at stage 13. The impact of the fucosylation degree on neutral N-glycan was investigated, Fig. S6 (ESI†). We detected a high expression of G56000 (Hex6HexNAc5) at stage 41 as compared to stage 1; as the degree of fucosylation increased, the expression ratio of the corresponding glycan compositions between these two stages declined, and the mono-fucosylated (with core fucose or arm fucose) expression stayed high while the di- and tri-fucosylated structures, which were confidently distinguished with Lewis antigen, were down-regulated at later embryonic stages.
The dynamic patterns of fucosylation were validated by lectin blotting with Aleuria aurantia lectin (AAL) and Ulex europaeus lectin (UEA-I), which recognize fucose.42,43 The levels of glycans recognized by AAL generally declined after stage 13 (Fig. S7A, ESI†). AAL preferentially binds the (α-1,3) linked residue in the Lewis X epitope as well as the (α-1,6) linked core fucose. We assume that the slightly brighter staining on large protein smears by AAL at late stages was associated with the high expression of mono-fucosylated neutral and sialylated glycans that were more likely to have (α-1,6) linked core fucoses. UEA-I, which prefers the (α-1,2) linked fucose of H antigen, was found to have obviously decreased recognition at stage 41 (Fig. S7B, ESI†), indicating the potential down-regulation of Lewis Y epitope during embryogenesis. Likewise, the gene that regulates the expression of H antigen, Fut1, was revealed to have lower expression at late embryonic stages of Xenopus laevis.38 Bands in the labeled migration range (Fig. S7A, ESI†) were excised from the membrane, digested, and analyzed by UPLC-MS/MS. The analysis was complicated by the high background signal from BSA, which was used to block the membrane. Nevertheless, 42 Xenopus proteins were identified. Three (serine protease inhibitor A6 (Q00387, MW 49k), LOC398139 (Q6NTP7, MW 85k), and HSP90 beta (Q6AZV1, MW 83k)) were also identified in our analysis of formerly glycosylated proteins, below.
Glycoprotein expression in early development
We conducted de-N-glycopeptide analysis to profile the proteins that were associated with N-glycans in Xenopus laevis embryos. Briefly, yolk-depleted proteins from stage 1 and stage 41 embryos were digested with trypsin. Oxidized glycopeptides were selectively immobilized on a hydrazide solid support. The immobilized glycopeptides were treated with PNGase-F to release the de-N-glycopeptides, which were analyzed using UPLC-MS/MS. Normalized peak intensities (relative intensity) were utilized to compare the abundance distribution of formerly glycosylated peptides between stage 1 and stage 41. The potential for false-positive N-glycosylation site identification was evaluated with a whole proteome study in which the protein was digested at pH 8 without PNGase F treatment.44 132 out of 15223 identified peptides contained deamidated Asn residues within the N-X-S/T/C motif, indicating a 0.9% false discovery rate. 42% of this deamidation was in N-G-S/T/C sequences, which can have a high rate of spontaneous deamidation during sample preparation.44 We matched these peptides with those generated in our de-glycoproteomic study, and the putative false-positive N-glcosylation sites were removed.
For stage 1 embryos, 611 N-glycosylation sites located on 350 N-glycosylated proteins were identified (Fig. S8A and Table S3, ESI†). Early stage glycosylation was dominated by serine protease inhibitor A6 (serpina6 or EP45) (Fig. S8B, ESI†), which originates in the liver and is taken up by oocytes from blood.45 EP45 has been shown to act as an oocyte-maturation-enhancer,45 indicating that glycosylation might play a significant role during oogenesis. EP45 is maternal in origin, and its functions are expected to be limited to oocytes and early embryos, leading to a down-regulation in embryos through stage 11 to 22, as seen in our earlier study of Xenopus developmental proteomics.22 Zona pellucida (Zp) is a group of vitelline envelop glycoproteins outside oocyte that functions as the sperm-receptor during fertilization and decreases at hatching occurring at a late stage.46 When compared to the total de-N-glycoproteome of stage 1 embryos, a relatively low combined abundance of formerly glycosylated peptides (3.4%) was observed from the Zp family.
We detected 1682 N-glycosylation sites located on 1023 N-glycosylated proteins at stage 41, which is roughly twice the number identified at stage 1. To better understand the elevated protein N-glycosylation at later stages of embryogenesis, we used Gene Ontology (GO) annotation to characterize the biological processes and molecular functions of the N-glycoproteins. Almost 60% of N-glycoproteins at the early stage were in the “response to endoplasmic reticulum stress” GO category. Interestingly, almost 70% of N-glycoproteins at stage 41 were associated with “neuron projection morphogenesis” (Fig. S9A, ESI†), which implies a significant role for N-glycosylation in neural system development during embryogenesis.
Cell component classifications were also interesting. The stage 1 embryo showed glycoproteins roughly equally divided between the vacuole and endoplasmic reticulum, which suggests active processing of these glycoproteins. The stage 41 embryo had larger fractions associated with intrinsic components of the membrane, and also associated with the cell–cell adherens junction. The later components likely drive cell–cell recognition during organogenesis (Fig. S9B, ESI†).
Conclusions
This manuscript demonstrates the use of CZE-MS/MS for the analysis of TMT-labeled oligosaccharides from Xenopus laevis embryos. CZE separations are based on the size-to-charge ratio of the analyte, and careful choice of the separation pH allows facile resolution of di-sialylated and di-phosphorylated species. TMT labeling allowed pooling of samples early in the preparation protocol, presumably reducing systematic errors in the analysis. In this study, which required prefractionation to deal with the high dynamic range in Xenopus embryo glycan expression, isobaric labeling enabled high-throughput sample preparation and MS analysis compared to a label-free method. The system is quite sensitive; while we started with 100 μg of proteins for glycome sample preparation, N-glycans generated from as little as 300 ng of proteins were analyzed with CE-MS/MS to identify 143 N-glycan compositions across biological triplicates and to quantify 110 N-glycans across a four orders of magnitude abundance range.The glycan expression was relatively constant through stage 13 of Xenopus development. This stage marks the end of gastrulation and the beginning of neurulation. This important developmental transition is reflected in substantial changes of the embryo N-glycome detected at neurulation and that continue into the tail bud stage. This onset of neurulation was followed by massive reprogramming of N-glycan expression with a dramatic decrease in expression of paucimannose, phosphorylated, and neutral multi-fucosylated N-glycans. In contrast, there was a bifurcation in the expression of sialyated glycans, with one set showing a dramatic increase in expression and the other set showing a decrease in expression following the midblastula transition.
Finally, we also explored glycoprotein expression by digesting embryonic proteins, capturing oxidized glycopeptides on a hydrazine solid support, and treatment with PNGAse-F to release de-N-glycopeptides, which were subjected to label-free quantitation using LC-MS/MS. We observed 350 glycoproteins and 611 glycosylation sites in freshly fertilized embryos at the single cell stage (stage 1); the dominant glycoprotein was serpina6, an oocyte-maturation enhancer. In contrast, we observed 1023 N-glycoproteins in late tailbud embryos (stage 41). Gene ontology analysis of these N-glycoproteins shows that roughly 70% are associated with “neuron projection morphogenesis”, which suggests an important role of glycosylation in neural system development.
This study describes both N-glycan expression and N-glycopeptide expression changes during development. However, we do not link the glycan with its parent glyoprotein. Glycoproteomics is both extremely challenging and tedious,47–50 and glycoproteomic analysis of the complex N-glycoproteins that accompany early vertebrate development awaits significant technological advances.
Data availability
Mass spectra are available at http://ftp://massive.ucsd.edu/MSV000084180/.Author contributions
Conceptualization: YQ, NJD, PWH. Data curation: YQ. Funding acquisition: NJD, PWH, MMC, J. J. C. Investigation: YQ, ZZ, ASH, E. H. P., K. M. D., S. W. Project administration: NJD. Resources: J. J. C. Supervision: N. J. D., P. W. H., M. M. C., J. J. C. Writing: Y. Q., N. J. D., P. H.Conflicts of interest
N. J. D. is a co-inventor of the nanoelectrospray interface used in this work and receives royalties on sales.Acknowledgements
This work was funded by the National Institutes of Health (R35 GM136334 – NJD and P41 GM108538 – JJC). We thank Dr William Boggess in the Notre Dame Mass Spectrometry and Proteomics Facility for his help with this project.References
- S. F. Gilbert, M. S. Tyler and R. N. Kozlowski, Developmental Biology, Sinauer Associates, Sunderland, Mass., 2006 Search PubMed.
- R. Kleene and M. Schachner, Glycans and neural cell interactions, Nat. Rev. Neurosci., 2004, 5, 195–208 CrossRef CAS PubMed.
- R. S. Haltiwanger and J. B. Lowe, Role of glycosylation in development, Annu. Rev. Biochem., 2004, 73, 491–537 CrossRef CAS PubMed.
- J. Gu, T. Isaji, Q. Xu, Y. Kariya, W. Gu, T. Fukuda and Y. Du, Potential roles of N-glycosylation in cell adhesion, Glycoconjugate J., 2012, 29, 599–607 CrossRef CAS PubMed.
- R. L. Schnaar, R. Gerardy-Schahn and H. Hildebrandt, Sialic acids in the brain: gangliosides and polysialic acid in nervous system development, stability, disease, and regeneration, Physiol. Rev., 2014, 94, 461–518 CrossRef PubMed.
- R. L. Schnaar, Glycobiology simplified: diverse roles of glycan recognition in inflammation, J. Leukocyte Biol., 2016, 99, 825–838 CrossRef CAS PubMed.
- S. T. Laughlin, J. M. Baskin, S. L. Amacher and C. R. Bertozzi, In vivo imaging of membrane-associated glycans in developing zebrafish, Science, 2008, 320, 664–667 CrossRef CAS PubMed.
- J. M. Baskin, K. W. Dehnert, S. T. Laughlin, S. L. Amacher and C. R. Bertozzi, Visualizing enveloping layer glycans during zebrafish early embryogenesis, Proc. Natl. Acad. Sci. U. S. A., 2010, 107, 10360–10365 CrossRef CAS PubMed.
- K. W. Dehnert, B. J. Beahm, T. T. Huynh, J. M. Baskin, S. T. Laughlin, W. Wang, P. Wu, S. L. Amacher and C. R. Bertozzi, Metabolic labeling of fucosylated glycans in developing zebrafish, ACS Chem. Biol., 2011, 6, 547–552 CrossRef CAS PubMed.
- E. Song, A. Mayampurath, C. Y. Yu, H. Tang and Y. Mechref, Glycoproteomics: identifying the glycosylation of prostate specific antigen at normal and high isoelectric points by LC-MS/MS, J. Proteome Res., 2014, 13, 5570–5580 CrossRef CAS PubMed.
- D. Park, K. A. Brune, A. Mitra, A. I. Marusina, E. Maverakis and E. C. B. Lebrilla, Characteristic Changes in Cell Surface Glycosylation Accompany Intestinal Epithelial Cell (IEC) Differentiation: High Mannose Structures Dominate the Cell Surface Glycome of Undifferentiated Enterocytes, Mol. Cell. Proteomics, 2015, 14, 2910–2921 CrossRef CAS PubMed.
- E. Noro, E. A. Togayachi, T. Sato, A. Tomioka, M. Fujita, M. Sukegawa, N. Suzuki, H. Kaji and H. Narimatsu, Large-Scale Identification of N-Glycan Glycoproteins Carrying Lewis x and Site-Specific N-Glycan Alterations in Fut9 Knockout Mice, J. Proteome Res., 2015, 14, 3823–3834 CrossRef CAS PubMed.
- K. Hanzawa, N. Suzuki and S. Natsuka, Structures and developmental alterations of N-glycans of zebrafish embryos, Glycobiology, 2017, 27, 228–245 Search PubMed.
- H. Hahne, P. Neubert, K. Kuhn, C. Etienne, R. Bomgarden, J. C. Rogers and B. Kuster, Carbonyl-reactive tandem mass tags for the proteome-wide quantification of N-linked glycans, Anal. Chem., 2012, 84, 3716–3724 CrossRef CAS PubMed.
- N. Rauniyar and J. R. Yates, Isobaric labeling-based relative quantification in shotgun proteomics, J. Proteome Res., 2014, 13, 5293–5309 CrossRef CAS PubMed.
- X. Zhong, Z. Chen, S. Snovida, Y. Liu, J. C. Rogers and L. Li, Capillary Electrophoresis-Electrospray Ionization-Mass Spectrometry for Quantitative Analysis of Glycans Labeled with Multiplex Carbonyl-Reactive Tandem Mass Tags, Anal. Chem., 2015, 87, 6527–6534 CrossRef CAS PubMed.
- S. Zhou, Y. Hu, L. Veillon, S. I. Snovida, J. C. Rogers, J. Saba and Y. Mechref, Quantitative LC-MS/MS Glycomic Analysis of Biological Samples Using AminoxyTMT, Anal. Chem., 2016, 88, 7515–7522 CrossRef CAS PubMed.
- R. Wojcik, O. O. Dada, M. Sadilek and N. J. Dovichi, Simplified capillary electrophoresis nanospray sheath-flow interface for high efficiency and sensitive peptide analysis, Rapid Commun. Mass Spectrom., 2010, 24, 2554–2560 CrossRef CAS PubMed.
- L. Sun, G. Zhu, Y. Zhao, X. Yan, S. Mou and N. J. Dovichi, Ultrasensitive and fast bottom-up analysis of femtogram amounts of complex proteome digests, Angew. Chem., Int. Ed., 2013, 52, 13661–13664 CrossRef CAS PubMed.
- L. Sun, G. Zhu, Z. Zhang, S. Mou and N. J. Dovichi, Third-generation electrokinetically pumped sheath-flow nanospray interface with improved stability and sensitivity for automated capillary zone electrophoresis-mass spectrometry analysis of complex proteome digests, J. Proteome Res., 2015, 14, 2312–2321 CrossRef CAS PubMed.
- E. H. Peuchen, L. Sun and N. J. Dovichi, Optimization and comparison of bottom-up proteomic sample preparation for early-stage Xenopus laevis embryos, Anal. Bioanal. Chem., 2016, 408, 4743–4749 CrossRef CAS PubMed.
- L. Sun, M. M. Bertke, M. M. Champion, G. Zhu, P. W. Huber and N. J. Dovichi, Quantitative proteomics of Xenopus laevis embryos: expression kinetics of nearly 4000 proteins during early development, Sci. Rep., 2014, 4, 4365 CrossRef PubMed.
- P. D. Nieuwkoop and J. Faber, Normal Table of Xenopus laevis (Daudin), Garland Publishing Inc., New York, 1994 Search PubMed.
- M. K. Khokha, C. Chung, E. L. Bustamante, L. W. K. Gaw, K. A. Trott, J. Yeh, N. Lim, J. C. Y. Lin, N. Taverner, E. Amaya, N. Papalopulu, J. C. Smith, A. M. Zorn, R. M. Harland and T. C. Grammer, Techniques and probes for the study of Xenopus tropicalis development, Dev. Dyn., 2002, 225, 499–510 CrossRef CAS PubMed.
- S. N. Krylov, D. A. Starke, E. A. Arriaga, Z. Zhang, N. W. C. Chan, M. M. Palcic and N. J. Dovichi, Instrumentation for chemical cytometry, Anal. Chem., 2000, 72, 872–877 CrossRef CAS PubMed.
- B. Chen, X. Zhong, Y. Feng, S. Snovida, M. Xu, J. Rogers and L. Li, Targeted MultiNotch MS3 Approach for Relative Quantification of N-Glycans Using Multiplexed Carbonyl-Reactive Isobaric Tags, Anal. Chem., 2018, 90, 1129–1135 CrossRef CAS PubMed.
- H. Zhang, X. J. Li, D. B. Martin and R. Aebersold, Identification and quantification of N-linked glycoproteins using hydrazide chemistry, stable isotope labeling and mass spectrometry, Nat. Biotechnol., 2003, 21, 660 CrossRef CAS PubMed.
- J. Zhu, Z. Sun, K. Cheng, R. Chen, M. Ye, B. Xu, D. Sun, L. Wang, J. Liu, F. Wang and H. Zou, Comprehensive mapping of protein N-glycosylation in human liver by combining hydrophilic interaction chromatography and hydrazide chemistry, J. Proteome Res., 2014, 13, 1713–1721 CrossRef CAS PubMed.
- S. Sun, B. Zhang, P. Aiyetan, J. Y. Zhou, P. Shah, W. Yang, D. A. Levine, Z. Zhang, D. W. Chan and H. Zhang, Analysis of N-glycoproteins using genomic N-glycosite prediction, J. Proteome Res., 2013, 12, 5609–5615 CrossRef CAS PubMed.
- D. F. Zielinska, F. Gnad, J. R. Wiśniewski and M. Mann, Precision mapping of an in vivo N-glycoproteome reveals rigid topological and sequence constraints, Cell, 2010, 141, 897–907 CrossRef CAS PubMed.
- P. J. Boersema, T. Geiger, J. R. Wiśniewski and M. Mann, Quantification of the N-glycosylated secretome by super-SILAC during breast cancer progression and in human blood samples, Mol. Cell. Proteomics, 2013, 12, 158–171 CrossRef PubMed.
- G. Bindea, B. Mlecnik, H. Hackl, P. Charoentong, M. Tosolini, A. Kirilovsky, W. H. Fridman, F. Pagès, Z. Trajanoski and J. Galon, ClueGO: a Cytoscape plug-in to decipher functionally grouped gene ontology and pathway annotation networks, Bioinformatics, 2009, 25, 1091–1093 CrossRef CAS PubMed.
- L. Wu, L. Tian, S. Wang, J. Zhang, P. Liu, Z. Tian, H. Zhang, H. Liu and H. Y. Chen, Comparative Proteomic Analysis of the Response of Maize (Zea mays L.) Leaves to Long Photoperiod Condition, Front. Plant Sci., 2016, 7, 752 Search PubMed.
- M. Wuhrer, C. A. M. Koeleman, C. H. Hokke and A. M. Deelder, Mass spectrometry of proton adducts of fucosylated N-glycans: fucose transfer between antennae gives rise to misleading fragments, Rapid Commun. Mass Spectrom., 2006, 20, 1747–1754 CrossRef CAS PubMed.
- S. Holst, A. I. Belo, E. Giovannetti, I. van Die and M. Wuhrer, Profiling of different pancreatic cancer cells used as models for metastatic behaviour shows large variation in their N-glycosylation, Sci. Rep., 2017, 7, 16623 CrossRef PubMed.
- H. Park, J. Kim, Y. K. Lee, W. Kim, S. K. You, J. Do, Y. Jang, D. B. Oh, J. I. Kim and H. H. Kim, Four unreported types of glycans containing mannose-6-phosphate are heterogeneously attached at three sites (including newly found Asn 233) to recombinant human acid alpha-glucosidase that is the only approved treatment for Pompe disease, Biochem. Biophys. Res. Commun., 2018, 495, 2418–2424 CrossRef CAS PubMed.
- J. Y. Kang, O. Kwon, J. Y. Gil and D. B. Oh, Data for analysis of mannose-6-phosphate glycans labeled with fluorescent tags, Data Brief, 2016, 7, 1531–1537 CrossRef PubMed.
- Y. Onuma, H. Tateno, S. Tsuji, J. Hirabayashi, Y. Ito and M. Asashima, A lectin-based glycomic approach to identify characteristic features of Xenopus embryogenesis, PLoS One, 2013, 8, e56581 CrossRef CAS PubMed.
- T. Walski, E. J. M. Van Damme, N. Smargiasso, O. Christiaens, E. De Pauw and G. Smagghe, Protein N-glycosylation and N-glycan trimming are required for postembryonic development of the pest beetle Tribolium castaneum, Sci. Rep., 2016, 6, 35151 CrossRef CAS PubMed.
- K. Aoki, M. Perlman, J. M. Lim, R. Cantu, L. Wells and M. Tiemeyer, Dynamic developmental elaboration of N-linked glycan complexity in the Drosophila melanogaster embryo, J. Biol. Chem., 2007, 282, 9127–9142 CrossRef CAS PubMed.
- H. C. Tjondro, I. Loke, S. Chatterjee and M. T. Andersen, Human protein paucimannosylation: cues from the eukaryotic kingdoms, Biol. Rev., 2019, 94, 2068–2100 CrossRef PubMed.
- J. Taubenschmid, J. Stadlmann, M. Jost, T. I. Klokk, C. D. Rillahan, A. Leibbrandt, K. Mechtler, J. C. Paulson, J. Jude, J. Zuber, K. Sandvig, U. Elling, T. Marquardt, C. Thiel, C. Koerner and J. M. A. Penninger, A vital sugar code for ricin toxicity, Cell Res., 2017, 27, 1351 CrossRef CAS PubMed.
- M. Roucka, K. Zimmermann, M. Fido and A. Nechansky, Application of Lectin Array Technology for Biobetter Characterization: Its Correlation with FcγRIII Binding and ADCC, Microarrays, 2016, 6, 1 CrossRef PubMed.
- Y. Ren, P. Hao, S. K. Alex Law and S. K. Sze, Hypoxia-induced Changes to Integrin α 3 Glycosylation Facilitate Invasion in Epidermoid Carcinoma Cell Line, Mol. Cell. Proteomics, 2014, 13(11), 3126–3137 CrossRef CAS PubMed.
- G. Marteil, R. D'Inca, A. Pascal, N. Guitton, T. Midtun, A. Goksøyr, L. Richard-Parpaillon and J. Z. Kubiak, EP45 accumulates in growing Xenopus laevis oocytes and has oocyte-maturation-enhancing activity involved in oocyte quality, J. Cell Sci., 2010, 123, 1805–1813 CrossRef CAS PubMed.
- L. H. Vo, T. Y. Yen, B. A. Macher and J. L. Hedrick, Identification of the ZPC oligosaccharide ligand involved in sperm binding and the glycan structures of Xenopus laevis vitelline envelope glycoproteins, Biol. Reprod., 2003, 69, 1822–1830 CrossRef CAS.
- Y. Qu, L. Sun, Z. Zhang and N. J. Dovichi, Site-Specific Glycan Heterogeneity Characterization by Hydrophilic Interaction Liquid Chromatography Solid-Phase Extraction, Reversed-Phase Liquid Chromatography Fractionation, and Capillary Zone Electrophoresis-Electrospray Ionization-Tandem Mass Spectrometry, Anal. Chem., 2018, 90, 1223–1233 CrossRef CAS PubMed.
- S. Suttapitugsakul, F. Sun and R. Wu, Recent Advances in Glycoproteomic Analysis by Mass Spectrometry, Anal. Chem., 2020, 92, 267–291 CrossRef CAS PubMed.
- Y. Zhang, W. Zhao, Y. Zhao, Y. Mao, T. Su, Y. Zhong, S. Wang, R. Zhai, J. Cheng, X. Fang, J. Zhu and H. Yang, Comparative Glycoproteomic Profiling of Human Body Fluid between Healthy Controls and Patients with Papillary Thyroid Carcinoma, J. Proteome Res., 2019 DOI:10.1021/acs.jproteome.9b00672.
- J. T. Roberts, K. R. Patel and A. W. Barb, Site-specific N-glycan Analysis of Antibody-binding Fc γ Receptors from Primary Human Monocytes, Mol. Cell. Proteomics, 2019, 19, 362–374 CrossRef PubMed.
Footnotes |
| † Electronic supplementary information (ESI) available: Fig. S1–S8 and supporting information spreadsheet. See DOI: 10.1039/d0mo00005a |
| ‡ Current address: Astrazenca, Gaithersburg, MD 20878, USA. |
| § Current address: Pfizer, McPherson, KS 67460, USA. |
| This journal is © The Royal Society of Chemistry 2020 |