
On the absence of triplet exciton loss pathways in non-fullerene acceptor based organic solar cells†
Maria S.
Kotova
a,
Giacomo
Londi
 b,
Johannes
Junker
a,
Stefanie
Dietz
a,
Alberto
Privitera
c,
Kristofer
Tvingstedt
a,
David
Beljonne
b,
Andreas
Sperlich
*a and
Vladimir
Dyakonov
a
b,
Johannes
Junker
a,
Stefanie
Dietz
a,
Alberto
Privitera
c,
Kristofer
Tvingstedt
a,
David
Beljonne
b,
Andreas
Sperlich
*a and
Vladimir
Dyakonov
a
aExperimental Physics 6, Julius Maximilian University of Würzburg, Am Hubland, 97074 Würzburg, Germany. E-mail: sperlich@physik.uni-wuerzburg.de
bLaboratory for Chemistry of Novel Materials, University of Mons, B-7000 Mons, Belgium
cClarendon Laboratory, Department of Physics, University of Oxford, Oxford OX1 3PU, England, UK
First published on 7th April 2020
Abstract
We investigate the viability of highly efficient organic solar cells (OSCs) based on non-fullerene acceptors (NFA) by taking into consideration efficiency loss channels and stability issues caused by triplet excitons (TE) formation. OSCs based on a blend of the conjugated donor polymer PBDB-T and ITIC as acceptor were fabricated and investigated with electrical, optical and spin-sensitive methods. The spin-Hamiltonian parameters of molecular TEs and charge transfer TEs in ITIC e.g., zero-field splitting and charge distribution, were calculated by density functional theory (DFT) modelling. In addition, the energetic model describing the photophysical processes in the donor–acceptor blend was derived. Spin-sensitive photoluminescence measurements prove the formation of charge transfer (CT) states in the blend and the formation of TEs in the pure materials and the blend. However, no molecular TE signal is observed in the completed devices under working conditions by spin-sensitive electrical measurements. The absence of a molecular triplet state population allows to eliminate a charge carrier loss channel and irreversible photooxidation facilitated by long-lived triplet states. These results correlate well with the high power conversion efficiency of the PBDB-T:ITIC-based OSCs and their high stability.
New conceptsOrganic solar cells (OSCs) are a promising technology that is on the verge of commercial breakthrough, but still raises numerous fundamental physical questions. The blends of polymer donors and small molecular acceptors are prone to different spin-dependent mechanisms of charge carrier loss and absorber degradation. Knowledge about the involvement of spin states is therefore essential for the design of efficient materials. An ideal approach to tackle this problem are methods based on electron spin resonance, which are known for their high spin sensitivity and selectivity. For the first time, we demonstrate the application of electrically and photoluminescence detected magnetic resonance (EDMR, PLDMR) to OSCs based on novel non-fullerene acceptors (NFA). Those methods directly connect spin-dependent processes with optical and electrical properties of thin films and devices under test. On the one hand, PLDMR can reveal the involvement of both molecular and interfacial triplet states in pristine materials, as well as blended donor:acceptor films. On the other hand, EDMR can be applied to OSCs under realistic operating conditions. Spin-sensitive electrical and PL spectroscopy on real devices and absorbers is an important tool to understand the complex photo- and electro-physics of organic solar cells, which is not fully accessible with other techniques such as transient absorption, photoluminescence or current–voltage methods. |
1. Introduction
A new era of organic photovoltaic (OPV) research started after the introduction of new acceptor (A) and donor (D) materials in the technology. In the past, most of the bulk heterojunction (BHJ) organic solar cells (OSCs) employed soluble fullerene derivatives as electron acceptors due to their superior electron affinity and good transport properties. Nevertheless, fullerene acceptors have limited absorption of the solar spectrum, air- and light-induced degradation issues and it is difficult to modify their energy levels. Development of novel non-fullerene acceptors (NFA) and good matching donor polymers, that overcome some of these issues,1 have led to rapid progress and power conversion efficiencies (PCE) of over 18% have been achieved in single junction devices.2–4 This success has been achieved in part by the application of thiophene based NFAs, e.g., 3,9-bis(2-methylene-(3-(1,1-dicyanomethylene)-indanone))-5,5,11,11-tetrakis(4-hexylphenyl)-dithieno[2,3-d:2′,3′-d′]-s-indaceno[1,2-b:5,6-b′]dithiophene (ITIC) or its derivatives. ITIC is a fused ring electron acceptor,5 consisting of donor core and strong electron acceptor units at the two sides of the backbone. Despite this rapid rise in efficiency, a fundamental understanding of the charge generation mechanism and loss channels is still lacking.Upon photoexcitation, bound electron–hole pairs, excitons, are generated in D and A materials. Excitons dissociate at the D/A interface and form interfacial charge transfer (CT) states. It has been widely reported that free charges can be generated from these intermediate CT states. The energy of the CT state (ECT) is closely related to the energetic difference between the donor HOMO and the acceptor LUMO. This value represents a fundamental limit of the open-circuit voltage (VOC). The remarkably high VOC in NFA-based OSCs has been achieved by increasing ECTvia a closer matching of A and D energy levels. However, an increase in ECT can lead to a new loss pathway resulting from charge recombination to the now energetically favorable D and A triplet exciton (TE) states.6–11 Formation of TEs is not only causing a new loss pathway and reduced short-circuit current (JSC) but can also lead to enhanced degradation of the active layer. The energy of TEs is sufficient to excite ground state triplet oxygen (3O2) adsorbed from ambient air to its very reactive excited singlet form (1O2*).12 This can result in chemical reactions of the OSC's active layer with the excited singlet oxygen and finally in a degradation of OSC performance.13
The presence of the TE population in NFA-based OSCs and their involvement in carrier leakage is investigated in this work using two spectroscopic techniques: photoluminescence detected magnetic resonance (PLDMR) on thin active layer films and electrically detected magnetic resonance (EDMR) on fully processed OSCs under operating conditions. To pinpoint energy levels of all involved excited states (singlet/triplet excitons, CT states) additional photoluminescence (PL), external quantum efficiency (EQE), temperature dependent current density–voltage dependence (J–V) and electroluminescence (EL) were studied on pure materials, PBDB-T:ITIC blends and solar cells based on them. In order to support spin-sensitive measurements, DFT modelling was performed as well. The analysis showed that the population of donor and acceptor triplet states does take place in pure donor and acceptor materials and in their blends at low temperatures. Nevertheless, charge separation and extraction outperform the less efficient triplet formation and recombination in working devices at ambient conditions.
2. Experimental section
2.1 Materials and devices
ITIC was used as acceptor and poly[(2,6-(4,8-bis(5-(2-ethylhexyl)thiophen-2-yl)benzo[1,2-b:4,5-b′]dithiophene)-co-(1,3-di(5-thiophene-2-yl)-5,7-bis(2-ethylhexyl)-benzo[1,2-c:4,5-c′]dithiophene-4,8-dione))] (PBDB-T) as donor for the BHJ active layer. PBDB-T is known for good thermal stability and has good HOMO alignment with ITIC. This material combination was shown to be very efficient in solar cells with a maximum reported PCE of 11.3%.14ITIC and PBDB-T were purchased from 1-Material, PEDOT:PSS from Heraeus, Al doped ZnO (AZO) nanoparticle solution from Avantama (slot N-21X) and all were used without further purification. Sample preparation was done on Herasil ITO-glass substrates.
Devices were fabricated in the conventional ITO/PEDOT:PSS/active layer/Ca/Al and inverted ITO/ZnO/active layer/MoO3/Al device structures (Fig. 1). The ITO-coated glass substrates were thoroughly cleaned by deionized water, acetone, isopropanol and etched in oxygen plasma for 30 s. The cleaned substrates were then covered with a thin layer (25 nm) of PEDOT:PSS or AZO. PEDOT:PSS solution was used without modifications, coated substrates were annealed at 130 °C for 15 minutes in air. AZO solution was diluted with isopropanol at 1![[thin space (1/6-em)]](https://www.rsc.org/images/entities/char_2009.gif) :1 concentration. Coated substrates were then annealed at 120 °C for 10 minutes in air. Further processing steps were performed inside a nitrogen glovebox. PBDB-T and ITIC were dissolved in chlorobenzene solvent with a total concentration of 20 mg mL−1 in ratio of PBDB-T:ITIC 1:1 and stirred at 50 °C for at least 24 hours. Subsequently, the mixture was spin coated on AZO or PEDOT:PSS covered glass substrates to reach an optimal film thickness of approximately 100 nm. The active layers were thermally annealed for 30 minutes at 70 °C. Finally, 10 nm MoO3 and 100 nm Ag or alternatively 5 nm Ca and 120 nm Al layers were deposited subsequently to complete the inverted or conventional devices, respectively. Devices were fabricated in various geometries with active areas of 1.5 mm2, 3 mm2 and 9 mm2.
:1 concentration. Coated substrates were then annealed at 120 °C for 10 minutes in air. Further processing steps were performed inside a nitrogen glovebox. PBDB-T and ITIC were dissolved in chlorobenzene solvent with a total concentration of 20 mg mL−1 in ratio of PBDB-T:ITIC 1:1 and stirred at 50 °C for at least 24 hours. Subsequently, the mixture was spin coated on AZO or PEDOT:PSS covered glass substrates to reach an optimal film thickness of approximately 100 nm. The active layers were thermally annealed for 30 minutes at 70 °C. Finally, 10 nm MoO3 and 100 nm Ag or alternatively 5 nm Ca and 120 nm Al layers were deposited subsequently to complete the inverted or conventional devices, respectively. Devices were fabricated in various geometries with active areas of 1.5 mm2, 3 mm2 and 9 mm2.
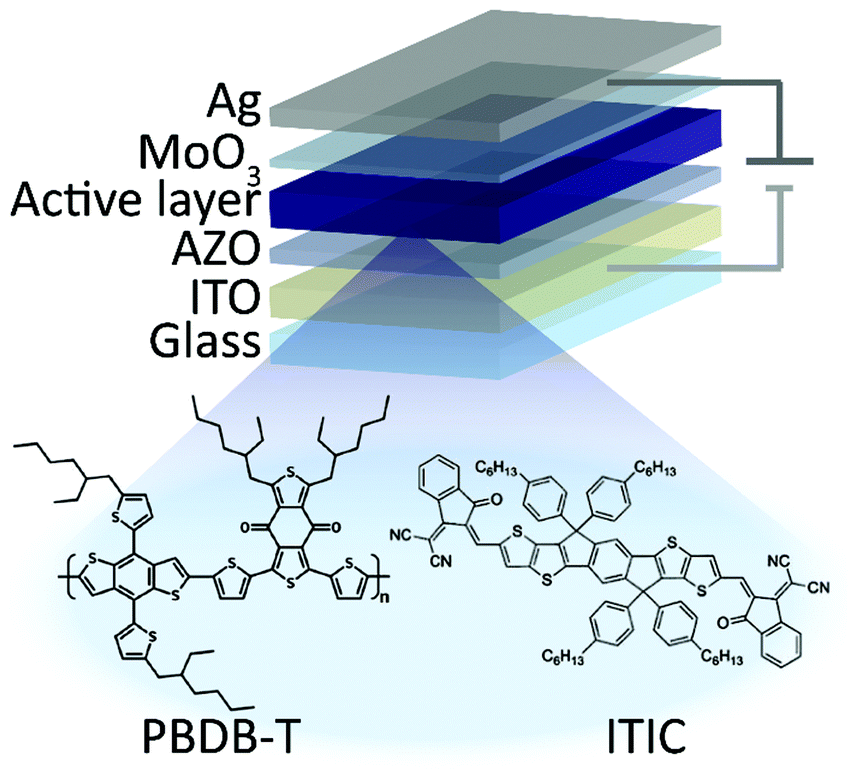 | ||
| Fig. 1 Structure of inverted solar cells. | ||
Samples for photoluminescence detected magnetic resonance (PLDMR) measurements were prepared in EPR glass tubes. For this, about 100 μL solution of the investigated material was filled into a standard X-band EPR tube with 3 mm inner diameter. Drying was achieved via evacuation to a rough vacuum of 10−2 mbar and flushing at least three times with helium gas. During the drying process, a thin layer of the investigated material is deposited on the inner walls of the tube. After the drying procedure, the tubes were sealed with a blow torch.
2.2 Methods
The current density–voltage (J–V) measurements were carried out in a N2 glove box at room temperature under 100 mW cm−2 illumination of the standard AM 1.5G spectrum. J–V curves were measured with a Keithley 2612B programmable current–voltage source. The thicknesses of films were measured with a Dektak profilometer.Photoluminescence (PL) is provided by exciting the sample from a side with a 405 nm, 4.5 mW CPS405 cw laser diode module from Thorlabs. Electroluminescence (EL) is generated by current injection by an Agilent 4155C parameter analyzer for 10 or 20 seconds during which the spectra are collected. The emission from the sample is coupled to a Princeton Instrument Acton Spectra Pro SP2300 spectrometer equipped with a LN2 cooled Pylon 400 CCD detector.
The external (photocurrent) quantum efficiency (EQE) was determined with a home-built setup comprising an Oriel halogen lamp, a light chopper coupled to an Oriel monochromator, a Y-fiber adapter directing light to the solar cell and a S2281 Hamamatsu Si reference photodetector. Signals are recorded by two lock-in amplifiers (Signal Recovery 7265, Stanford Research Systems SR830).
Spin-sensitive measurements were performed in a modified X-band spectrometer (Bruker E300). In PLDMR configuration, samples were illuminated with a glass fiber connected to a cw 532 nm laser. The PLDMR measurements were done at 5 K, provided by a continuous flow helium cryostat (Oxford ESR 900). The PL was detected by a silicon photodiode placed in front of a microwave cavity with optical access (ER4104OR). The change of PL or photocurrent was detected via a Lock-In-Amplifier (Signal Recovery 7230) with the on–off modulated microwave (Anritsu 3694C) as reference. In comparison to the PLDMR setup, in EDMR an electrical signal from the solar cell under test is detected. With a source measuring unit (Keithley 237), every desired point of the J–V-characteristic can be chosen to detect the current flowing through the OSC under applied magnetic field. The EDMR measurements were performed under illumination of a white light LED with the approximate equivalent of 1 sun intensity.
3. Results and discussion
3.1 Electrical characterization
J–V characteristics of the best devices are presented in Fig. 2(a) and solar cell parameters are summarized in Table 1. The averaged parameters of devices, fabricated in the same conditions, are shown in parenthesis. Details of the device optimization are presented in the ESI.† The highest performance was obtained for conventional OSCs with a PCE of 9.8% and an external quantum efficiency (EQE) of up to 73% (Fig. 2b). Inverted structures did not outperform conventional solar cells with a maximum PCE of 7.5% for freshly prepared inverted devices. During the first days of storage in the nitrogen glovebox, these devices showed a slight increase in VOC and JSC to comparable or better values than the conventional OSCs. The highest PCE for these aged devices was about 8.5%, limited by the lower fill factor (FF) of just 56% in comparison to 66% for conventional devices. The difference in FF may be caused by a non-optimal AZO layer conductivity in comparison to a well-adjusted PEDOT:PSS layer. While the conventional structure featured higher PCE, it showed lower overall stability in comparison to inverted OSCs. The conventional structure retained only 0.2% of efficiency after 20 days of dark storage in nitrogen atmosphere, while the inverted structure declined to 87% of the initial PCE within 100 days. Therefore, further results are mostly obtained for the more stable inverted structure. According to literature, the improvement in performance and stability of the inverted devices can be caused by a vertical phase separation in the active layer.15,16 The acceptor tends to slowly diffuse to the bottom electrode and in the conventional structure this prevents hole extraction at the cathode. In the inverted structure however, the formation of an ITIC-rich bottom layer is favorable for charge extraction and can lead to both, a slight increase in PCE and enhanced long-term stability. In addition, it has been also shown that the hole transport layer PEDOT:PSS, used in conventional structures has hygroscopic and acidic nature, and can thus result in a reduction of device stability. The aluminum top contact in the conventional structures can also lead to enhanced OSCs degradation in comparison to air-stable Ag-contacts, utilized in inverted OSCs.13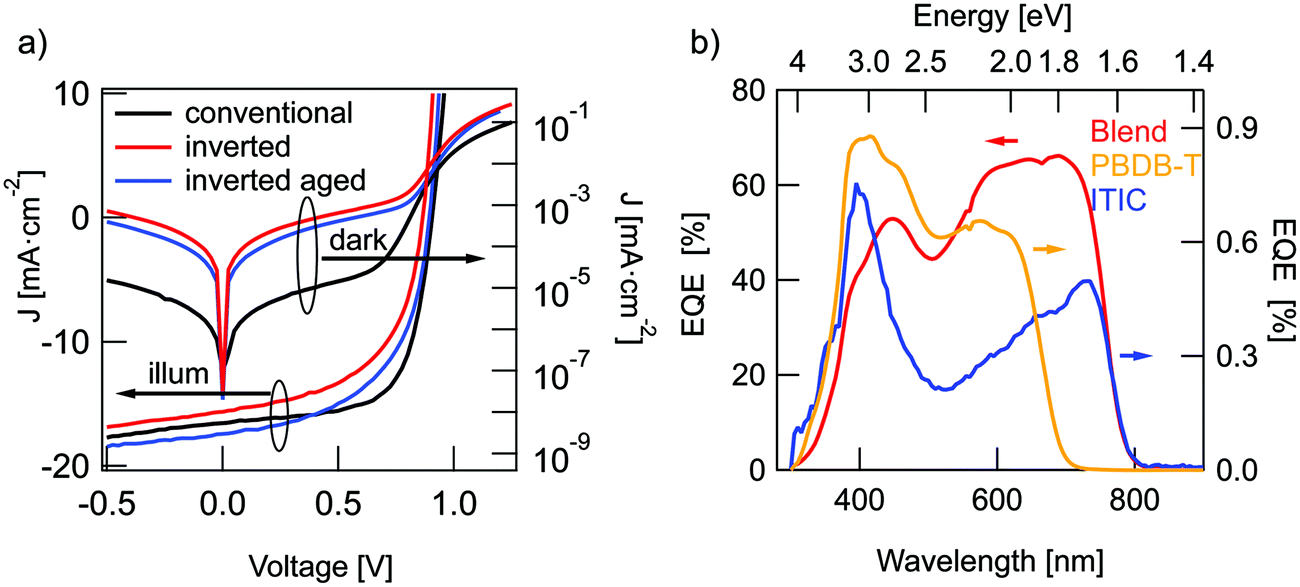 | ||
| Fig. 2 Solar cell characteristics. (a) J–V-curves of PBDB-T:ITIC solar cells in dark and under illumination: conventional (black traces), inverted (red) and aged inverted (blue). (b) EQE spectra for inverted solar cells (red trace) together with diodes from pure PBDB-T (yellow) and pure ITIC (blue). | ||
| Structure | (n =) | V OC [mV] | FF [%] | J SC [mA cm−2] | PCE [%] |
|---|---|---|---|---|---|
| Conventional | 5 | 918 (918) | 66.0 (65.0) | 16.2 (14.7) | 9.8 (8.9 ± 0.9) |
| Inverted | 16 | 868 (868) | 53.0 (52.4) | 16.4 (15.3) | 7.5 (7.0 ± 0.3) |
| Aged inverted | 11 | 895 (894) | 54.0 (53.6) | 17.4 (16.5) | 8.5 (8.0 ± 0.3) |
3.2 Energy level determination
Charge generation in OSCs undergoes first, optical absorption into donor and acceptor excited singlet states SD/SA, followed by interfacial charge transfer to an intermediate CT state. There are several possibilities to assess singlet and CT energies based on rule-of-thumb estimates, direct and indirect measurements that are presented and evaluated below.One possible method to determine the energy of singlet excited states in pure materials is to determine the midpoint between the low energy peak of the absorption (or EQE) spectra and the high energy peak of the PL spectra. The low energy peaks of the EQE in Fig. 2b can be estimated at 1.7 eV for ITIC and 1.96 eV for PBDB-T. The PL spectra in Fig. 3a deliver the high energy peaks at 1.6 eV for ITIC and 1.8 eV for PBDB-T. The midpoints are thus 1.65 eV for ITIC and 1.88 eV for PBDB-T.
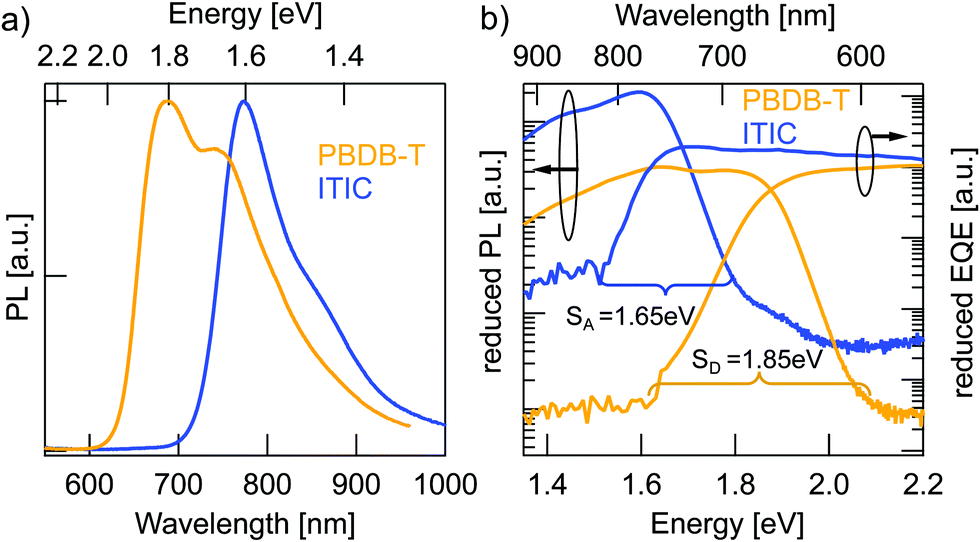 | ||
| Fig. 3 Determination of the singlet excited state energies of pure materials. (a) PL spectra of pure material films: PBDB-T (yellow) and pure ITIC (blue). (b) The same PL data represented as reduced PL/E together with reduced EQE × E of diodes of the pure materials in logarithmic representation. The onsets of PL and EQE are marked, as well as their midpoint as an estimate for the singlet energy. | ||
Since the low energy EQE peaks of these materials are rather undefined (especially in the case of PBDB-T), the above method renders some uncertainty. We thus chose to further corroborate the singlet energy estimations by measuring also the midpoints of the PL and EQE onsets on a logarithmic scale. In Fig. 3b the EQE from Fig. 2b and the PL from Fig. 3a are represented logarithmically over the energy in eV to facilitate pinpointing the onsets. Intensities are scaled as reduced PL/E and reduced EQE × E (see ESI†). The EQE (PL) onsets can be read off to be at 770 nm/1.6 eV (590 nm/2.1 eV) and 820 nm/1.5 eV (685 nm/1.8 eV) for PBDB-T and ITIC, respectively. We note here, however, that the onset of the PL will blue-shift for stronger excitation intensity. Likewise, will the EQE onset redshift if a more sensitive detector would be used. In other words, the external conditions can have a direct effect on these assigned midpoints. However, by comparing both approaches, we can provide decent estimates of the singlet excited state energies as 1.85 eV for the PBDB-T SD and 1.65 eV for the ITIC SA with about ±0.05 eV uncertainty.
The first option for an estimation of the CT energy of the blends is the well-known trend in which the CT energy is about 0.5–0.6 eV higher than qVOC at ambient temperature.17 With an open-circuit voltage at around 0.9 eV, the CT energy is thus estimated to be 1.45 ± 0.05 eV.
A second approach is to use temperature dependent J–V measurements to determine the CT energy. As it has been shown, the extrapolated qVOC value at temperature T = 0 K equals ECT.18 We performed VOC(T) measurements for a temperature range from 200 K to 300 K (Fig. S3, ESI†). The extrapolated 0 K value equals 1.40 eV ± 0.05 eV.
The third approach we used to estimate the ECT value employs Marcus theory of the mirror image relationship between optical absorption and emission spectra from and into the CT state as described in detail by Vandewal et al.17 (also see ESI†). The midpoint energy of these two spectra has been suggested19 to embody the most suitable method to determine ECT. If the measured spectra are of truly Gaussian shape, then additionally, the reorganization energy λ can be directly deduced from the linewidth of the fitted absorption and emission bands.
Fig. 4a shows reduced EQE × E and EL/E spectra for a solar cell and an ITIC diode in inverted device architecture (EL in linear representation in Fig. S2 of the ESI†). The solar cell EQE onset is further red-shifted to 900–1000 nm in comparison to the pure material EQEs in Fig. 3b. The broader, long-wavelength photocurrent response at energies below the absorbance of pure donor or acceptor films can be ascribed to the direct absorption to CT states. Conversely, with forward biasing, the photovoltaic device is operated as a light-emitting diode with the EL originating from radiative charge recombination via singlet excitons or CT states. The solar cell EL in Fig. 4a reaches up to 2 eV (600 nm) without a clear onset and furthermore, it does not have a typical Gaussian shape, but shows a pronounced local bump at around 1.6 eV. The latter can probably be assigned not to CT emission but rather to a superimposed contribution from ITIC singlet exciton EL, which has an emission peak at the same energy. This pronounced emission from ITIC complicates the analysis of EL spectra including reasonable fitting with Marcus theory.20 To directly address the underlying contribution from CT emission, the ITIC EL spectrum was subtracted from the solar cell EL. For this, the ITIC EL was normalized such that the ITIC EL peak value was corresponding to the local peak value of the solar cell EL. The resulting “subtracted” CT EL signal was used for further analysis in Fig. 4b.
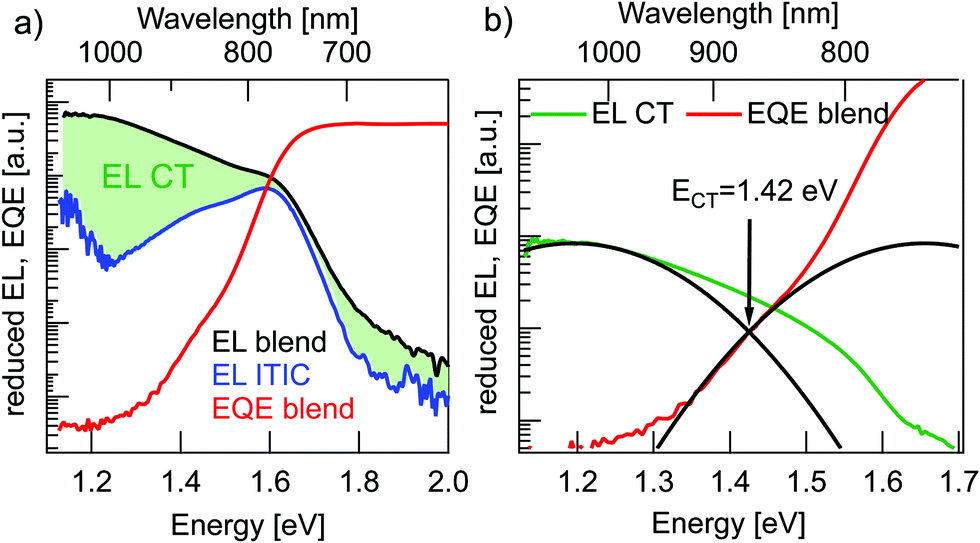 | ||
| Fig. 4 Determination of CT state energy. (a) Reduced EQE × E spectrum for an inverted BHJ solar cell (red) together with EL/E spectra for the same solar cell (black trace) and an ITIC diode (blue). The green shaded area represents the CT EL emission. (b) Subtracted solar cell EL/E spectrum (green) and reduced EQE × E spectrum (red) together with Gaussian fitting curves (black) to determine ECT. | ||
In the estimation of ECT, Gaussian fits to the reduced EQE × E and EL/E spectra in the CT energy regime were performed (Fig. 4b). In order to get proper fits, the reorganization energy λ was limited to physically reasonable values in between 0.2 eV to 0.35 eV.17 For these conditions the best fit in Fig. 4(b) yields ECT = 1.42 eV and λ = 0.23 eV. Due to a very small spectral range where CT absorption dominates the EQE signal (<1.3 eV) and a not perfectly Gaussian form of EL spectra, even after subtraction of the ITIC contribution, this method can (in this case) only give a rough estimate of the value of ECT.
In conclusion, all three methods for ECT determination yield values in agreement with their mean value of 1.45 ± 0.05 eV.
3.3 Singlet–triplet energy gap by DFT modelling
We calculated the absorption spectra for a pure PBDB-T tetramer and for ITIC via time-dependent DFT (TD-DFT) within the Tamm–Dancoff approximation (TDA)21 and employing a polarizable continuum model (PCM)22 with a dielectric constant of ε = 4.5, in order to take into account the electronic polarization and the solid-state environment. For such calculations, we used the LC-ωhPBE23 functional in order to resort to a screened RSH (SRSH) functional24,25 in combination with PCM (see details in ESI†). For the polymer donor, we find the first singlet excited state SD to lie at 2.24 eV above the ground state. The first triplet state TD is located at 1.84 eV, yielding a singlet–triplet gap of ∼0.4 eV. Regarding the ITIC acceptor, its singlet energy SA falls at 1.95 eV, while TA1 is found to be at 1.49 eV (giving rise to a similar singlet–triplet energy splitting of ∼0.46 eV). Further, higher-lying ITIC triplet states can be found at 1.69 eV and 2.26 eV. Despite the level of theory used, the calculated singlet excitation energies are overestimated with respect to experiment, by 0.39 eV for the donor PBDB-T and by 0.30 eV for the NFA ITIC molecular acceptor. Part of this discrepancy could be due to solid-state effects and nuclear reorganization effects not included in the modeling. In any case, the results of the calculations combined with the measured singlet energies help drawing a complete Jablonski diagram.3.4 Jablonski diagram
According to the energy level determination discussed above, the Jablonski diagram of the PBDB-T:ITIC blend can be drawn as shown in Fig. 5. The singlet state energy SD of the donor PBDB-T has the highest value of 1.85 eV and the acceptor ITIC singlet state SA is at 1.65 eV. Singlet CT1 and triplet CT3 states have degenerate energy values at 1.45 ± 0.05 eV due to the large electron–hole separation distance26 and oscillation between these two states can occur via intersystem crossing (ISC), e.g. due to hyperfine interaction or slightly different g-factors for electrons and holes. The intended solar cell processes are: optical excitation of donor or acceptor, followed by charge transfer (CT) to the singlet CT1 state, potentially thermally-activated charge separation into free charges and finally charge extraction as photocurrent. Competing loss mechanisms include PL from SA, SD and CT1, as well as triplet-related loss mechanisms.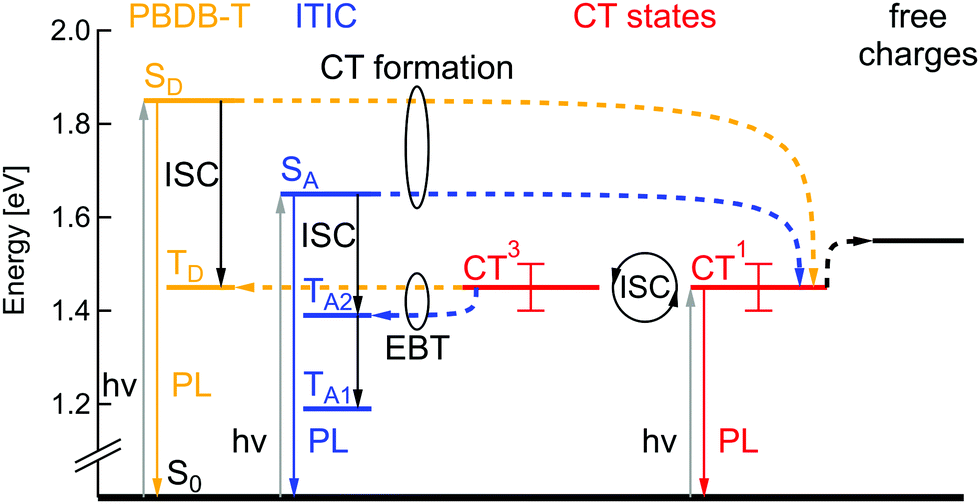 | ||
| Fig. 5 Jablonski diagram of the PBDB-T:ITIC blend. SD, TD – singlet and triplet excited states of the donor PBDB-T (yellow). SA, TA1, TA2 – singlet and two triplet states of the acceptor ITIC (blue). CT1, CT3 – singlet and triplet charge transfer states (red), ISC – intersystem crossing, EBT – electron back transfer. | ||
Following the simulations described above, TD lies at 1.45 eV, TA1 at 1.19 eV and TA2 at 1.39 eV. Triplet states of donor and acceptor may thus be populated either by ISC from the singlet excited states, but also via electron back transfer (EBT) from the triplet CT3, in case this transition is energetically favorable. Consequently, depending on local CT energetics and the efficiency of charge separation, there could be higher or lower population rate of molecular triplet excitons. An efficient triplet state population would lead to additional efficiency losses but would also cause a substantial degradation mechanism in the solar cells, as previously mentioned. To study TE formation we used magnetic resonance methods, that will be discussed in the following part.
3.5 Optical detection of spin states in pure materials and blends
Optical spectroscopy of triplet excitons alone is not always fully conclusive and cannot readily be applied to fully processed devices. Alternatively, one can take advantage of the paramagnetic properties of TEs.8 A magnetic field can be used to lift the degeneracy of the three triplet Zeeman sublevels. By applying a microwave field that is resonant with the Zeeman splitting, Zeeman sublevel transitions are induced within the TE manifold. This can in turn modify the overall triplet–triplet annihilation rate, triplet–polaron annihilation rate, triplet relaxation rate, or intersystem crossing rate.9,27,28 Increasing any of these rates, drives the system of reactions forward, resulting in a change of steady state photoluminescence yield and charge carrier recombination rate. As a result, a change in optical emission or in the solar cells’ JSC or VOC is observed and can be used to determine whether TEs are present or not. In this work we used electrically detected magnetic resonance (EDMR) on fully processed solar cells under operating conditions and photoluminescence detected magnetic resonance (PLDMR) on pure material and BHJ films. In comparison to EPR spectroscopy, PLDMR has a higher sensitivity due to the much easier detection of photons in the visible range than in the microwave regime. It is also possible to study the excited states (e.g. triplet excitons) and their recombination processes, such as triplet–triplet annihilation or triplet–polaron annihilation, which usually cannot be probed by conventional EPR. EDMR additionally allows to establish the connection between triplet or other spin states and the photocurrent or photovoltage in real device under working operation conditions, which is not possible by other methods.The Zeeman splitting of triplets in a magnetic field is shown in Fig. 6a. There can be a symmetrical (Fig. 6a, top) or asymmetrical (Fig. 6a, center) splitting. Symmetrical splitting is observed for loosely interacting spins, such as for CT excitons. Asymmetrical splitting is valid for molecular TEs – i.e. in the case of two spins in close vicinity. The dipolar interaction between closely interacting spins leads to an energetic splitting of the spin sublevels even if no external magnetic field is applied.29,30 Asymmetrical splitting of TE states leads to transitions at two different magnetic field values and resulting spectra will have (at least) two peaks (black trace at Fig. 6a, bottom). Symmetrical splitting of TE states in a magnetic field results in only one transition and thus one peak (Fig. 6a, grey curve, bottom). If both, distant and non-distant spins, are simultaneously present, then the resulting spectrum will be the superposition of a sharp central peak and a broader background signal (Fig. 6a bottom, red envelope). Broader spectral components will therefore be referred to as molecular TE signal and the central narrow peak as CT3 signal.
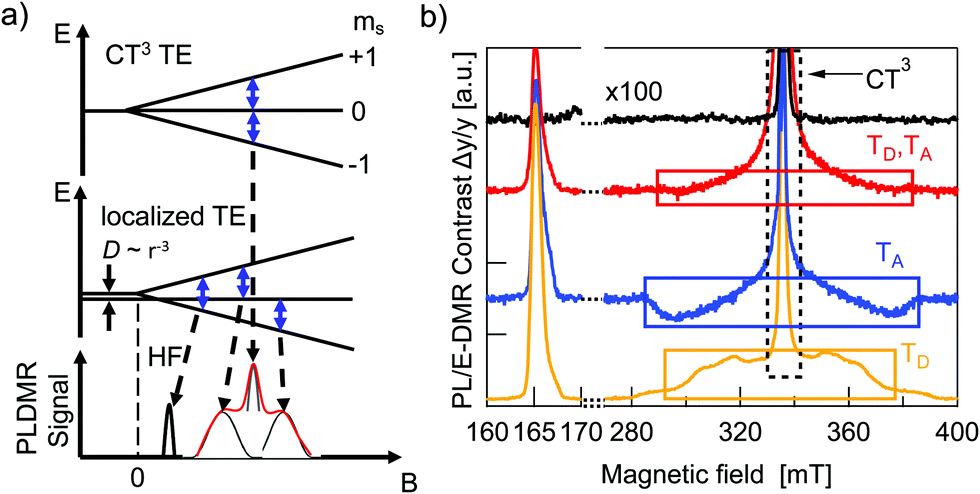 | ||
| Fig. 6 Spin-sensitive photoluminescence (PLDMR) and photocurrent (EDMR) spectroscopy of triplet excitons. (a) Zeeman diagram and zero-field splitting D = 0 (top), D > 0 (middle) for a triplet S = 1 state. Blue arrows indicate possible spin–flip transitions. Red enveloping curve (bottom) symbolises the PLDMR signal shape. HF – (forbidden) half-field transition. (b) PLDMR contrast ΔPL/PL of PBDB-T (yellow), ITIC (blue), PBDB-T:ITIC 1:1 blend (red) at 5 K; EDMR contrast ΔJSC/JSC multiplied by factor 100 of inverted PBDB-T:ITIC SC at 250 K (black). Note, for visibility we cut the CT peaks (dashed box at 340 mT), which is approximately two orders of magnitude higher. | ||
Additional measurements at lower magnetic fields can be helpful to understand superimposed spectra. Strong dipolar interaction between two spins causes the first order forbidden Δms = ±2 transition between the ms = −1 and ms = +1 levels to become slightly allowed. This transition occurs at half the magnetic field required for the allowed transitions, and hence it is called the half-field (HF) transition.31
The PLDMR analysis performed at 5 K on PBDB-T and ITIC films discloses the presence of different paramagnetic species: molecular TEs (TD and TA) and CT3 triplet states (Fig. 6b). Both materials also have an almost identical half-field signal at 166 mT.
The PLDMR spectrum of the PBDB-T:ITIC BHJ shows a strongly quenched molecular TE contribution and an enhanced CT3 signal. The amplitude of the half-field signal in the blend is also lower than that of pure donor or acceptor. As both pure materials are not easily distinguishable in half-field spectra and molecular TEs of the blend show diminished intensity and cannot clearly be assigned to one or the other material, it is plausible to infer that the formation of molecular TEs occurs on both ITIC and PBDB-T. This fits well with the energetics as presented in Fig. 5, as energies of donor and acceptor triplet states are very close to ECT. Population of molecular triplet states can occur either via ISC or via EBT from CT to triplet states. The latter being favorable if the energy of the CT state is higher than TD and TA1.
3.6 Computation of ITIC spin properties
In order to support PLDMR results, spin properties, including zero-field splitting (ZFS) parameters, were calculated at the DFT level of theory on an isolated ITIC molecule in a triplet ground-state (see details in ESI†). We assign the broad spectral feature in the ITIC PLDMR spectrum to this intramolecular localized triplet exciton (Fig. 7) with an averaged spin-up (in green)–spin-down (in yellow) distance of 1.4–1.5 Å.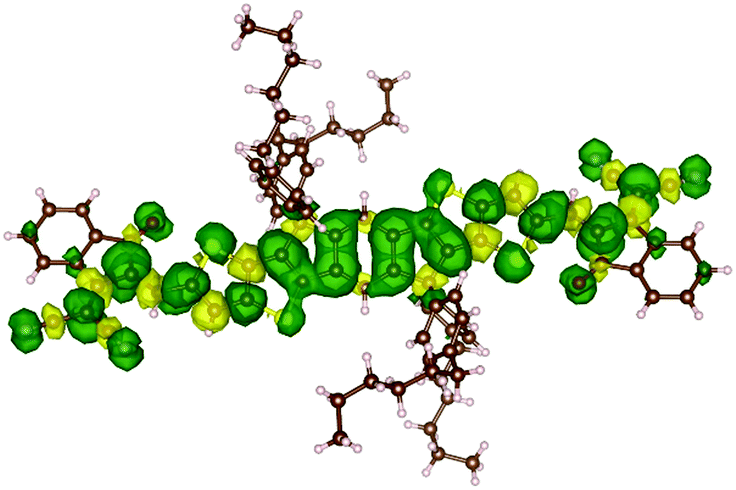 | ||
| Fig. 7 Spin density distribution in an ITIC triplet ground state molecule. The green density surface represents the spin-up distribution, while the yellow density surface the spin-down one. | ||
We anticipated that the sharp signal on the ITIC PLDMR spectrum could arise from an intermolecular delocalized triplet exciton state. To assess the nature of the triplet electronic excitations in an ITIC dimer, we performed TD-DFT calculations, taking advantage of the spatial overlap metric Φs between hole and electron densities.32,33 Pure CT excitations correspond to non-overlapping hole and electron density (Φs = 0), while fully localized Frenkel excitations instead lead to Φs = 1. By looking at the lowest six triplet excited states of the dimer, we found that each is two-fold degenerate, with the first four transitions being Frenkel excitations that perfectly match those found in the ITIC monomer, i.e. at 1.49 and 1.69 eV. The fifth triplet excited state located at 1.85 eV above the ground state has a rather strong CT character, with the hole density primarily confined on one molecule and the electron density on the other (Fig. 8). For this state, we were also able to estimate the e–h capture radius, which can be taken as a proxy for the spin-up–spin-down distance. Such analysis yields an e–h radius of 4.5 Å. Thus, we can conclude that intermolecular CT excitations in the pure ITIC phase could be responsible for the sharp peak on the PLDMR spectrum.
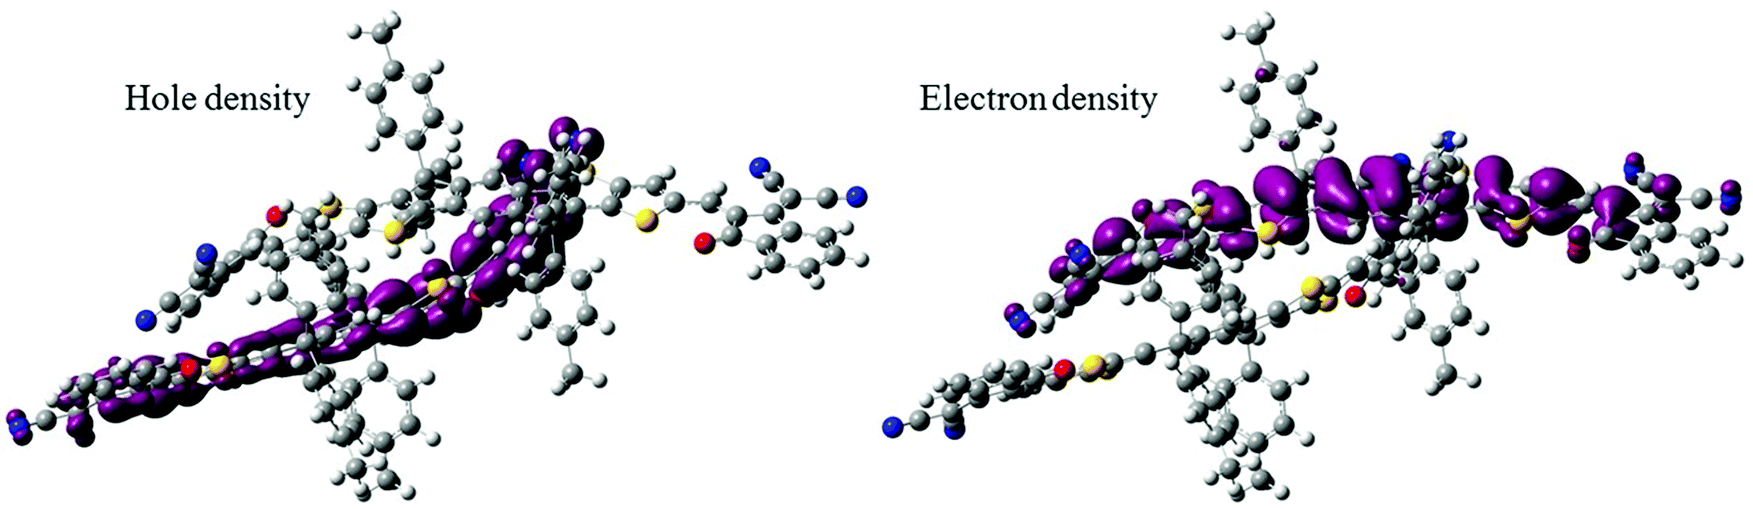 | ||
| Fig. 8 Hole and electron density distribution relative to the triplet T5 excited state in an ITIC dimer which shows a strong CT character. | ||
3.7 Electrical detection of spin states in solar cells
After PLDMR has demonstrated the generation of triplet excitons in pure materials and mixed films at low temperature, it is now appropriate to verify triplets also in a solar cell under operating conditions. In this case a direct influence of the triplet excited states on the photocurrent or photovoltage is of high relevance. Therefore, we applied electrically detected magnetic resonance (EDMR) to solar cells in the following. The top-most trace in Fig. 6b (black) represents an EDMR spectrum of an OSC in inverted structure, fabricated as described in Section 2.1. The measurement was done under white LED illumination at an intensity that yields approximately JSC at 1 sun AM 1.5G illumination (T = 250 K). Remarkably, the only observable species in the EDMR spectrum is an intense narrow CT peak. The triplet signal, even the transition at half-field (HF in Fig. 2a), is completely absent. This conclusively shows that molecular triplet excitons, which are generated in mixed films at low temperature, are completely absent in solar cells under operating conditions.3.8 Discussion
These experimental and theoretical results presented above suggest the following scenario: after light absorption, a singlet exciton is generated. In the neat ITIC and PBDB-T films, this singlet exciton can either recombine, undergo ISC to the low-lying triplet state or mostly unlikely dissociate into free charges via a CT state. In the neat films, charge transfer is hindered because of the absence of a suitable electron donor or acceptor. Nevertheless, a substantial CT signal is still observed in PLDMR. This is in line with the low, but detectable EQE and PCE in OSCs based on the neat materials. Conversely, the population of CT states is clearly superior in the blend, suggesting that the charge transfer mechanism is more efficient than ISC. This explains the decrease of the molecular TE signal in favor of an enhanced CT peak in blends. All in all, ISC is still likely to occur at low temperatures because the mobility of singlet excitons is low and this affects the probability of reaching suitable A/D interfaces where CT can occur. On the other hand, if the charge separation of CT states into free charges is slowed down at low temperatures, EBT to molecular TEs is certainly a competitive recombination mechanism.In devices operated at (or near) ambient temperatures, the photophysical processes can be different: singlet excitons diffuse towards the D/A interface and form CT states more efficiently due to the increased mobility at ambient temperatures. In this case, ISC and EBT will be outperformed by charge separation and extraction. However, there is also the possibility of an increased rate of (non-)radiative recombination before reaching an interface, which is more likely than a slow ISC.
4. Conclusion
In this work we investigated organic solar cells based on the donor PBDB-T and the non-fullerene acceptor ITIC in two different architectures. In the standard architecture, solar cells with structure glass/ITO/PEDOT:PSS/active layer/Ca/Al reached an efficiency of 9.8% without any additives to the active layer solution. However, they only exhibited a short lifetime of several days. Solar cells in inverted architecture structured as glass/ITO/AZO/active layer/MoO3/Ag showed an improved lifetime and the efficiency retained stable values for at least 100 days. Singlet and triplet state energies of PBDB-T, ITIC and the interfacial CT states were determined by rigorous analysis of photoluminescence, electroluminescence and external quantum efficiency spectra in combination with DFT calculations. Spin properties of ITIC molecules were calculated via DFT modelling, CT and molecular triplets have been assigned with zero-field splitting D values and charge distribution. A comprehensive energetic model describing the photophysical processes in PBDB-T:ITIC solar cells was derived. According to a proposed Jablonski diagram, triplet states of donor and acceptor can be populated in the blends either via intersystem crossing from singlet excitons or alternatively via electron back transfer from triplet CT states. We applied spin-sensitive PL measurements to probe the population of triplet states in pure materials and in the blend at low temperatures. The technique allows to distinguish between localized TE and delocalized CT states. Although spin-sensitive PL detection indeed shows a low intensity signal of molecular TEs together with an expected pronounced CT peak in the blends, no molecular TE signals at all could be detected by electrically detected magnetic resonance in solar cells under operating conditions. We attribute this important finding to suppressed TE formation in solar cells, probably due to more efficient charge extraction than the recombination of CT interface states into triplet excitons. These results are also consistent with the high efficiency and stability of solar cells based on PBDB-T:ITIC.With the highly sensitive tool at hand to probe the populations of CT states and triplet excitons in donor:acceptor absorber blends, we can indeed forecast additional recombination losses due to electron back transfer from CT to localized triplet states. In real devices, the impact of such a process depends on the interaction between electron back transfer and charge carrier extraction, which reflects the electrical properties of the blends and electrode interfaces rather than the donor:acceptor photophysics. Similarly, the active layer degradation can be accelerated by triplet excitons formed, but again in devices it will depend on the measurement's conditions (short-circuit or open-circuit). According to our gained understanding, it is essential to conduct comparative studies on films and devices to clarify the influence of CT and triplet states on the performance of solar cells, provided that we are able to investigate these relevant states selectively and directly.
Conflicts of interest
There are no conflicts to declare.Acknowledgements
We acknowledge EU H2020 for funding through the Grant SEPOMO (Marie Skłodowska-Curie Grant Agreement 722651). We thank Dr Andreas Baumann for discussions and help with solar cell processing. Computational resources were provided by the Consortium des Équipements de Calcul Intensif (CÉCI), funded by the Fonds de la Recherche Scientifiques de Belgique (F.R.S.-FNRS) under Grant No. 2.5020.11, as well as the Tier-1 supercomputer of the Fedération Wallonie-Bruxelles, infrastructure funded by the Walloon Region under Grant Agreement No. 1117545. DB is a FNRS Research Director.References
- N. Gasparini, A. Wadsworth, M. Moser, D. Baran, I. McCulloch and C. J. Brabec., Adv. Energy Mater., 2017, 1703298, DOI:10.1002/aenm.201700770.
- J. Yuan, Y. Zhang, L. Zhou, G. Zhang, H. Yip, T. Lau, X. Lu, C. Zhu, H. Peng, P. A. Johnson, M. Leclerc, Y. Cao, J. Ulanski, Y. Li and Y. Zou, Joule, 2019, 3, 1, DOI:10.1016/j.joule.2019.01.004.
- Y. Cui, H. Yao, J. Zhang, T. Zhang, Y. Wang, L. Hong, K. Xian, B. Xu, S. Zhang, J. Peng, Z. Wei, F. Gao and J. Hou, Nat. Commun., 2019, 10, 2515, DOI:10.1038/s41467-019-10351-5.
- Q. Liu, Y. Jiang, K. Jin, J. Qin, J. Xu, W. Li, J. Xiong, J. Liu, Z. Xiao, K. Sun, S. Yang, X. Zhang and L. Ding, Sci. Bull., 2020, 65(4), 272, DOI:10.1016/j.scib.2020.01.001.
- J. J. Rech, N. Bauer, D. Dirkes, J. Kaplan, Z. Peng, H. Zhang, L. Ye, S. Liu, F. Gao, H. Ade and W. You, Mater. Chem. Front., 2019, 3, 1642, 10.1039/C9QM00314B.
- M. C. Scharber, N. A. Schultz, N. S. Sariciftci and C. J. Brabec, Phys. Rev. B: Condens. Matter Mater. Phys., 2003, 67, 085202, DOI:10.1103/PhysRevB.67.085202.
- S. Cook, H. Ohkita and J. R. Durrant, Appl. Phys. Lett., 2006, 89, 101128, DOI:10.1063/1.2338528.
- M. Liedtke, A. Sperlich, H. Kraus, A. Baumann, C. Deibel, M. J. M. Wirix, J. Loos, C. M. Cardona and V. Dyakonov, J. Am. Chem. Soc., 2011, 133, 9088, DOI:10.1021/ja2025432.
- H. Kraus, M. C. Heiber, S. Väth, J. Kern, C. Deibel, A. Sperlich and V. Dyakonov, Sci. Rep., 2016, 6, 29158, DOI:10.1038/srep29158.
- S. Väth, K. Tvingstedt, A. Baumann, M. C. Heiber, A. Sperlich, J. A. Love, T.-Q. Nguyen and V. Dyakonov, Adv. Energy Mater., 2016, 7, 1602016, DOI:10.1002/aenm.201602016.
- T. Offermans, P. A. van Hal, S. C. J. Meskers, M. M. Koetse and R. A. J. Janssen, Phys. Rev. B: Condens. Matter Mater. Phys., 2005, 72, 045213, DOI:10.1103/PhysRevB.72.045213.
- A. Sperlich, H. Kraus, C. Deibel, H. Blok, J. Schmidt and V. Dyakonov, J. Phys. Chem. B, 2011, 115(46), 13513, DOI:10.1021/jp2077215.
- M. Jorgensen, K. Norrman and F. C. Krebs, Sol. Energy Mater. Sol. Cells, 2008, 92, 686, DOI:10.1016/j.solmat.2008.01.005.
- W. Zhao, S. Zhang and J. Hou, Sci. China: Chem., 2016, 59, 1574, DOI:10.1007/s11426-016-0198-0.
- Y. Wang, W. Lan, N. Li, Z. Lan, Z. Li, J. Jia and F. Zhu, Adv. Energy Mater., 2019, 9, 1900157, DOI:10.1002/aenm.201900157.
- Z. Xu, L.-M. Chen, G. Yang, C.-H. Huang, J. Hou, Y. Wu, G. Li, C.-S. Hsu and Y. Yang, Adv. Funct. Mater., 2009, 19, 1227, DOI:10.1002/adfm.200801286.
- K. Vandewal, K. Tvingstedt, A. Gadisa, O. Inganäs and J. V. Manca, Phys. Rev. B: Condens. Matter Mater. Phys., 2010, 81, 125204, DOI:10.1103/PhysRevB.81.125204.
- G. Garcia-Belmonte, Sol. Energy Mater. Sol. Cells, 2019, 94, 2166, DOI:10.1016/j.solmat.2010.07.006.
- K. Vandewal, J. Benduhn and V. C. Nikolis, Sustainable Energy Fuels, 2018, 2, 538, 10.1039/C7SE00601B.
- S. Xie, Y. Xia, Z. Zheng, X. Zhang, J. Yuan, H. Zhou and Y. Zhang, Adv. Funct. Mater., 2018, 28, 1705659, DOI:10.1002/adfm.201705659.
- S. Hirata and M. Head-Gordon, Chem. Phys. Lett., 1999, 302, 375, DOI:10.1016/S0009-2614(99)00137-2.
- J. Tomasi, B. Mennucci and R. Cammi, Chem. Rev., 2005, 105, 2999, DOI:10.1021/cr9904009.
- T. M. Henderson, A. F. Izmaylov, G. Scalmani and G. Scuseria, J. Chem. Phys., 2009, 131, 044108, DOI:10.1063/1.3185673.
- S. Refaely-Abramson, S. Sharifzadeh, M. Jain, R. Baer, J. B. Neaton and L. Kronik, Phys. Rev. B: Condens. Matter Mater. Phys., 2013, 88, 081204, DOI:10.1103/PhysRevB.88.081204.
- Z. Zheng, D. A. Egger, J.-L. Brédas, L. Kronik and V. Coropceanu, J. Phys. Chem. Lett., 2017, 8(14), 3277, DOI:10.1021/acs.jpclett.7b01276.
- B. Hu, L. Yan and M. Shao, Adv. Mater., 2009, 21, 1500, DOI:10.1002/adma.200802386.
- L. S. Swanson, J. Shinar, A. R. Brown, D. D. C. Bradley, R. H. Friend, P. L. Burn, A. Kraft and A. B. Homes, Phys. Rev. B: Condens. Matter Mater. Phys., 1992, 46, 15072, DOI:10.1103/PhysRevB.46.15072.
- J. A. Weil, J. R. Bolton and J. E. Wertz, Electron Paramagnetic Resonance: Elementary Theory and Practical Applications, Wiley, 1994, ISBN: 0-471-57234-9 Search PubMed.
- S. Richert, C. E. Tait and C. R. Timmel, J. Magn. Reson., 2017, 280, 103, DOI:10.1016/j.jmr.2017.01.005.
- C. Hintze, U. E. Steiner and M. Drescher, Chem. Phys. Chem., 2017, 18(1), 6, DOI:10.1002/cphc.201600868.
- R. C. Stevenson, J. Magn. Reson., 1984, 57, 24, DOI:10.1016/0022-2364(84)90231-2.
- Y. Olivier, J.-C. Sancho-Garcia, L. Muccioli, G. D’Avino and D. Beljonne, J. Phys. Chem. Lett., 2018, 9(20), 6149, DOI:10.1021/acs.jpclett.8b02327.
- G. Londi, R. Dilmurat, G. D’Avino, V. Lemaur, Y. Olivier and D. Beljonne, Phys. Chem. Chem. Phys., 2019, 21, 25023, 10.1039/C9CP05201A.
Footnote |
| † Electronic supplementary information (ESI) available. See DOI: 10.1039/d0mh00286k |
| This journal is © The Royal Society of Chemistry 2020 |