
Exploring the limits of adsorption-based CO2 capture using MOFs with PVSA – from molecular design to process economics†
David
Danaci
 ab,
Mai
Bui
cd,
Niall
Mac Dowell
*cd and
Camille
Petit
*ab
ab,
Mai
Bui
cd,
Niall
Mac Dowell
*cd and
Camille
Petit
*ab
aDepartment of Chemical Engineering, Imperial College London, South Kensington, London, SW7 2AZ, UK. E-mail: camille.petit@imperial.ac.uk; Tel: +44 (0)20 7594 3182
bBarrer Centre, Imperial College London, South Kensington, London, SW7 2AZ, UK
cCentre for Environmental Policy, Imperial College London, South Kensington, London, SW7 1NE, UK. E-mail: niall@imperial.ac.uk; Tel: +44 (0)20 7594 9298
dCentre for Process Systems Engineering, Imperial College London, South Kensington, London, SW7 2AZ, UK
First published on 23rd September 2019
Abstract
Metal–organic frameworks (MOFs) have taken the materials science world by storm, with potentials of near infinite possibilities and the panacea for adsorption-based carbon capture. Yet, no pilot-scale (or larger-scale) study exists on MOFs for carbon capture. Beyond material scalability issues, this clear gap between the scientific and engineering literature relates to the absence of suitable and accessible assessment of MOFs in an adsorption process. Here, we have developed a simple adsorbent screening tool with process economics to evaluate adsorbents for post-combustion capture, while also considering factors relevant to industry. Specifically, we have assessed the 25 adsorbents (22 MOFs, 2 zeolites, 1 activated carbon) against performance constraints – i.e. CO2 purity and recovery – and cost. We have considered four different CO2 capture scenarios to represent a range of CO2 inlet concentrations. The cost is compared to that of amine-based solvents for which a corresponding model was developed. Using the model developed, we have conceptually assessed the materials properties and process parameters influencing the purity, recovery and cost in order to design the ‘best’ adsorbent. We have also set-up a tool for readers to screen their own adsorbent. In this contribution, we show that minimal N2 adsorption and moderate enthalpies of adsorption are key in obtaining good process performance and reducing cost. This stands in contrast to the popular approaches of maximizing CO2 capacity or surface area. Of the 22 MOFs evaluated, UTSA-16 shows the best performance and lowest cost for post-combustion capture, having performance in-line with the benchmark, i.e. zeolite 13X. Mg-MOF-74 performs poorly. The cost of using the adsorbents remains overall higher than that of an amine-based absorption process. Ultimately, this study provides specific directions for material scientists to design adsorbents and assess their performance at the process scale. This works intends to bridge the gap between scientific and engineering studies to accelerate CO2 capture adsorbents development. The approach can be extended to other molecular separations.
 Dr Camille Petit | Dr Camille Petit is a Reader in the Chemical Engineering Department at Imperial College London. Dr Petit was a postdoctoral researcher at Columbia University and received her PhD in Chemistry in 2011 from the City University of New York. Her research focuses on elucidating the fundamentals of porous materials formation, structure, and chemistry to exploit them in interfacial applications, e.g. separation of molecules. Her work also investigates the implications of using these materials at the large-scale. Dr Petit has published >60 peer-reviewed articles. She is the recipient of an ERC Starting Grant and the 2017 AIChE's 35 under 35 award. |
Design, System, ApplicationAdsorption-based processes represent one of the proposed routes for post combustion CO2 capture. The design and operation of an adsorption process, and subsequently its feasibility, centres around the adsorbent, i.e. the porous material used to carry out the separation between CO2 and N2 molecules. As such, evaluating adsorbents and identifying adsorbent properties that yield both technically and economically feasible designs is paramount to test the potential of adsorption-based carbon capture at large scale. This task is particularly important given the thousands of adsorbents that exist. Adsorption processes are inherently highly coupled systems. For example, an adsorbent with a very high capacity will have a correspondingly high temperature change upon adsorption, which will reduce the equilibrium loading of that sorbent. The total energy released upon adsorption is the product of amount adsorbed and enthalpy of adsorption. Thus, an optimum would exist for capacity which will balance this trade-off. Our work relates adsorbent properties with process performance both from a technical, and economic perspective. Including the link between molecular-level material properties and process cost expedites the design of new fit-for-purpose adsorbents. This work can be used to guide, or change the focus of, future adsorbent development for post-combustion capture applications. |
Introduction
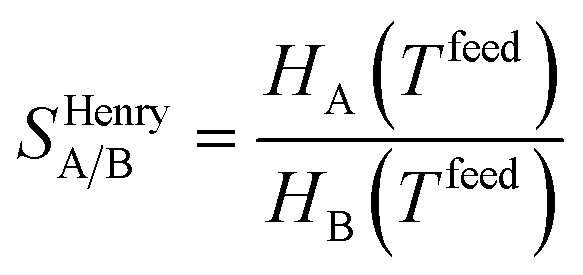
Despite nearly two decades of intense research effort, some could argue that the field of so-called “designer adsorbents” is still more of a scientific curiosity than a fully realised tool. Designer adsorbents allow one to tune materials for a given application, e.g. CO2 capture in the context of the present study. Heavily researched exemplars of designer adsorbents are metal organic frameworks (MOFs). A number of MOFs have been tested at lab-scale.1–19 These studies typically place a large emphasis on unveiling the molecular separation mechanisms and enhancing CO2 uptake, selectivity (e.g. ideal selectivity (eqn (1)), or Henry selectivity (eqn (2))), or working capacity (eqn (3)).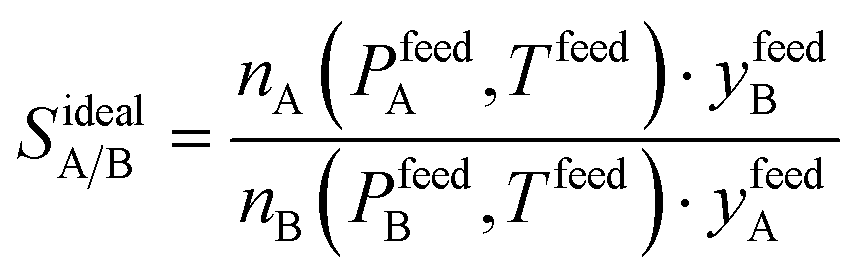 | (1) |
 | (2) |
WCpureA = nA(Pfeed·yfeedA,![[thin space (1/6-em)]](https://www.rsc.org/images/entities/char_2009.gif) Tfeed) − nA(Pdes·yfeedA,Tfeed) Tfeed) − nA(Pdes·yfeedA,Tfeed) | (3) |
While these are necessary features to investigate, they are in no way sufficient. For instance, an adsorbent should also exhibit a “fast” rate of mass transfer (non-limiting) and be “easily” regenerated under moderate conditions.
Comparatively to the number of lab scale research studies, progress towards scale-up remains very slow. Hence, it becomes clear that in order to transition to the next stage or technology readiness level (TRL), one cannot rely solely on the current practice of post-hoc rationalisation of materials to maximise CO2 uptake, CO2/N2 selectivity or working capacity. Such an approach makes it impossible to reliably and quickly determine the most promising materials (and material attributes), especially when those are highly tuneable as in MOFs. To address this knowledge gap, links must be drawn between the adsorbent design and the adsorption process. In other words, adsorbent properties should be screened/evaluated using a process performance index. The screening tool should provide a framework based on selected metrics that define a range of acceptable values for each of the process parameters considered. Typical parameters for the evaluation of {adsorbent + adsorption process} systems are: purity, recovery, energy consumption and cost. In the case of CCS, a CO2 purity of ≥ 95% mol is desired, and the highest recovery possible; 90% mol is generally taken. However, when comparing alternatives within a technology (i.e. various adsorbents) or between technologies (i.e. adsorption, absorption, membranes, distillation), the cost of undertaking the separation is the next key consideration. Process economics allows for trade-offs between capital and operating costs to be explicitly described. For instance, an adsorbent with poor working capacity may have higher capital costs attributed to adsorbent amount and adsorption vessels, however, it may show better performance at lower vacuum levels (higher absolute pressure), saving capital and operating costs for vacuum generation.
The evaluation of adsorbents accounting for these, and other, parameters is crucial, as it gives a more accurate representation of the attainable performance at scale. In the absence of experimental determination, these parameters can be accounted for by rigorous adsorption process simulation,20–29 or by reduced-order adsorption process models,30–34 as described in a number of CO2 capture studies. Rigorous cyclic modelling can be arduous, especially regarding the cycle design and optimization. For what we aim to address here, i.e. swift adsorbent evaluation and screening, this approach is prohibitive owing to a typical paucity of available data. Reduced-order models are typically 0-D or 1-D equilibrium models which account for the aforementioned issues. These adsorption models are ideal for adsorbent screening as they are rapid and require minimum input data that can be easily obtained using common laboratory apparatus.
When applying these models, one should select the specific adsorption process, i.e. pressure swing adsorption (PSA), pressure vacuum swing adsorption (PVSA) temperature swing adsorption (TSA) or a combination of PSA and TSA (PTSA). All of these adsorption processes are cyclic, and in their simplest implementation, a mixture is passed through a packed bed of adsorbent where the more strongly adsorbed (heavy) component is removed, and the other (light) component passes through. Upon saturation of the adsorbent, the feed is diverted to another vessel and the saturated vessel is regenerated. In the case of PSA or PVSA this is by a reduction in pressure, and the more strongly adsorbed is collected as the other product. PSA or PVSA are commonly proposed as they have shorter cycle times than TSA processes, due to the lengthy cool down times of TSA beds. Given the vast volume of flue gases that are associated with large-scale post-combustion capture, short cycle times are key in reducing the amount of CO2 that must be captured/stored per cycle – as there are the associated adsorbent requirements. PVSA – the approach selected for this work – also has the potential for much lower regeneration energy requirements than amine-based absorption processes.35 This is due to the absence of both chemical reactions to be reversed, and the sensible heating requirements of the amine solution. A possible area of concern regarding packed-bed processes are the pressure drop limitations. Given the high volumetric flow rates, management of the pressure drop to avoid issues such as gas channelling and adsorbent crushing may result in a large number of vessels, as will be investigated in this work. An important aspect to consider when analysing a PSA/PVSA process is the variation of the adsorbent bed temperature. As adsorption is an exothermic phenomenon, the bed experiences a temperature increase during the adsorption step and a corresponding decrease during the desorption step. These temperature changes hamper the working capacity that the adsorbent has. Upon adsorption, the amount adsorbed is less than the isothermal (or feed temperature) amount. During desorption, the gas recovered is less than the isothermal amount. This can result in a situation where the non-isothermal working capacity is significantly lower than that under isothermal conditions (or read off a single isotherm). While the desorption step is taking place, the composition of the gas and adsorbed phase also changes. As gas is removed from the adsorbent, this mixes with the existing gas in the bed, causing the composition to change. This means that the concentration of CO2 at any point of desorption process is not the same as the feed concentration; thus, simple isotherm evaluation cannot give a reliable estimate. This is further complicated by the fact that the ‘end composition’ is not known a priori. The CO2 concentration in the bed at the end of the desorption step is higher than the feed, thus the partial pressure is higher than imagined, also reducing the amount that can be removed from the adsorbent.
In our study, we have applied a PVSA model to screen 22 MOFs for CO2/N2 separation from post-combustion flue-gas sources from natural gas combustion, coal combustion, cement production, and steel production. We have screened MOFs using data reported in the literature and compared their performance and cost to that of commercial zeolites and activated carbon. Following this approach, we have determined links between adsorbent properties that influence aspects of the separation process (i.e. purity, recovery, and capture cost). We have also conducted a parametric evaluation of adsorbent properties to identify optimum adsorbent characteristics, and to generate a dataset that can be used by others to simply evaluate the performance of their adsorbents.
Our work evaluates adsorbents at scale without the necessity of intermediate scale-up steps. Those that are promising could be candidates for larger scale investigation, and rigorous adsorption modelling. This is accomplished while accounting for a range of industrially relevant factors, including separation performance, process equipment requirements, and cost. The association of adsorbent properties with these factors forms a link between materials science and industry; a pertinent requirement to accelerate the implementation of adsorption-based carbon capture technologies.
Methods
Materials selection and cyclic adsorption model
We provide here a general overview of the model and describe the details in the ESI.† The model includes three main sections, the PVSA model, equipment enumeration and sizing, and process economics.The PVSA model determines the adsorbent performance under cyclic and adiabatic conditions. For this, we employ the 0-D equilibrium model developed by Maring and Webley,30 albeit with 500 steps used in the solution of the equations, rather than 100. This helps improve the accuracy of the result for materials with steep isotherms. The validation of the adsorption model was conducted in the original work, which found an acceptable match between experimental data and rigorous simulation results.
The model is equilibrium-based and its benefits over a kinetic-based model include: minimal input data, rapid solutions, and improved accuracy over simple metrics. Yet, opting for an equilibrium-based adsorption model has associated compromises. A kinetic model allows for bed profiles (i.e. temperature, pressure, composition) to be obtained, which leads to a more accurate simulation, and flexibility around the cycle operation – not possible with an equilibrium model. The timing of cycle steps can be optimised to maximise process performance. Another advantage of kinetic models is that all adsorbents can be modelled, however, experimentally determined mass transfer coefficients are required and these are generally obtained from breakthrough measurements. Breakthrough apparatus are fairly uncommon, and analysis of the data must be conducted carefully. In the absence of reliable adsorption kinetics data, efforts in cycle optimisation may be futile. Equilibrium models are valid only for adsorbents with sufficiently fast kinetics. It is therefore inappropriate to apply the model for adsorbents, which are known to have slow adsorption kinetics, such as K-A, K- or Cs-CHA, CMS, and supported amines at ambient temperatures. In summary, an equilibrium-based model allows a first assessment of {adsorbent + process} systems, while a kinetic-based model enables a refined evaluation and a possible optimization of the process.
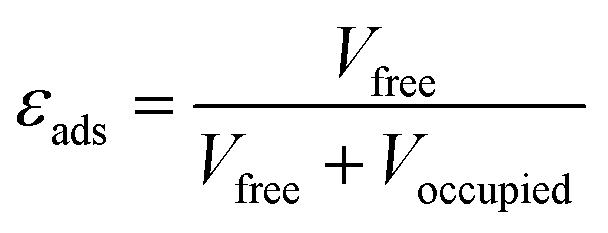
The physical properties data for the adsorbents – i.e. density, bed void fraction, and heat capacity – are often unavailable and must be estimated. We used the desolvated crystallographic information files of the MOFs to derive some parameters. We determined the porosity of the adsorbent (εads) using the solvent accessible pore volume; a probe with Connolly radius of 1.3 Å (helium) was used to obtain the occupied and free volume with the porosity obtained by applying eqn (4). From this, we calculated the total void space of the packed bed (εbed) by applying eqn (5), taking 0.37 (randomly packed spheres) as the packing void fraction (εpack). We estimated the pelletised adsorbent density (ρpellet) by applying a scaling factor of 80% to the crystallographic density; this relationship was established by Wu et al.36 We then quantified the density of the packed bed (ρbed) using eqn (6).
 | (4) |
| εbed = εpack + (1 − εpack)·εads | (5) |
| ρbed = (1 − εpack)·ρpellet | (6) |
The estimation of the heat capacity does not have an established method. We calculated the heat capacity of the MOFs by summing the molar fraction contributions of the metal atoms and the organic ligands. We used the molar heat capacity of the metal atoms from Rumble,37 and approximated the molar heat capacity of the organic ligands at 313.15 K following the method described by Goodman et al.38 A sample calculation is provided in the ESI.† For the three reference materials, i.e. zeolite 13X, 5A, and activated carbon, the sources for their physical property data are provided in the ESI.†
The reliance on reported isotherms as well estimated physical properties gives rise to uncertainties. Of the physical properties required in this work, the approach used for the MOF heat capacity has the most uncertainty. Using a molar fraction contribution of the metal atoms and ligands ignores the contribution of the lattice/crystal vibrational modes, thus underestimating the heat capacity. Conversely, the loss of some degrees of freedom of the ligand upon coordination is also not reflected, overestimating the heat capacity. The relative contributions of these factors are not known and will likely vary on a case-by-case basis. We therefore carried out a sensitivity analysis on the adsorbent physical properties and their influence on performance metrics (i.e. purity, recovery, and cost) and we discuss the findings in the results and discussion section. Uncertainty also exists in isotherm measurements,39–43 the root causes of this are multifaceted encompassing material synthesis, apparatus, and method. The utility of a sensitivity analysis on this is contentious, as isotherms repeated on the same sample on the same apparatus typically show little variation.
As our model relies on reported experimental isotherms, this approach takes advantage of the existing literature and accounts for ‘real’ structures rather than model ones. Yet, the requirement of having CO2 and N2 isotherms at 3 temperatures means that only a few materials can be investigated here.
| Scenario | Size | CO2 concentration [mol mol−1] | Flow rate [kg s−1] | CO2 emissions [MM tCO2 y−1] |
|---|---|---|---|---|
| Natural gas | 400 MWe | 4.38 | 607 | 1.28 |
| Coal | 500 MWe | 12.5 | 377 | 2.18 |
| Cement | 1 MM tpa | 21.0 | 152 | 1.41 |
| Steel | 4 MM tpa | 25.5 | 621 | 6.86 |
We considered an inlet gas pressure of 1.05 bara at a temperature of 313.15 K. The gas is then compressed to 1.50 bara and cooled to 313.15 K for adsorption. We investigated the influence of desorption pressure on adsorbent performance at five levels: 0.15 bara, 0.10 bara, 0.05 bara, 0.03 bara and 0.01 bara. These low vacuum levels are not necessarily industrially viable. We chose these levels in order to obtain the best possible performance (purity and recovery) from the adsorbents. If even at these vacuum levels, the performance is not reaching the desirable level, a change in the process is required.
We used the output from the PVSA model to size and enumerate the required process equipment. The PVSA model returns values on the basis of 1 kg of adsorbent and the process is scaled to the feed flow rate of each scenario, based on the total feed required to complete one adsorption cycle for 1 kg. As the PVSA model implemented here is an equilibrium model, cycle times are imposed ex post facto. We specified a 1-hour total cycle consisting of 45 minutes adsorption/feed time, and 15 minutes desorption time. This is compared to ≤15 minutes for PSA systems used for H2 production or air separation. The cycle time is the main contributor to process intensification: fewer adsorbent vessels are required if the cycle time is reduced. This is due to the requirement to accommodate the adsorbing species in the feed for the duration of the adsorption time. The volumetric flow rate of the feed gas dictates the line and valve sizes, which for large-scale post-combustion capture, is inherently high. This necessitates large pipe diameters and valves, generally motor actuated, with slow actuation times (5–10 minutes). Thus, switching flow paths between cycle steps is time consuming. In the instance where one bed is being switched from adsorption to regeneration, the feed must be diverted to the regenerated column prior to shutting off the saturated one. These factors culminate in a situation where cycle times <30 minutes for these situations are highly unlikely. As detailed design data is unknown, we have assumed a cycle time of 1 hour to account for these factors while also allowing for some margin in the operation.
Process economics
The primary equipment items included in the capital cost calculations are the feed gas compressor, feed cooling exchangers, adsorbent vessels, adsorbent, and vacuum pumps. The minor equipment items included are the cooling water pumps, vacuum pump motors, and control valves directly associated with the adsorbent vessels. The operating costs cover the electrical requirements for the rotating machinery, cooling water requirements, and adsorbent replacement costs.For the purposes of comparison, we assigned all adsorbents a cost of 1.5 £ kg−1 and a lifetime of 5 years. Some MOFs have chemical and thermal stability issues and/or are costly to synthesise due to the requirement for exotic organic ligands, rare metals, and solvent use. Therefore, it may be naive to assume that all MOFs have the same lifetime of 5 years. Adsorbents currently applied industrially such as zeolites, activated carbons, and silicas and aluminas, display lifetimes of 7–10 years if the process is operated sensibly. As there are no long-term studies of MOFs being applied at the pilot scale for adsorption-based processes, we have opted for a conservative estimate based on existing knowledge, while also giving the MOF materials the best chance. The cost of 1.5 £ kg−1 is in-line with industrial purchase costs for zeolite 13X from generic manufacturers, with costs being up to 3.5–5 £ kg−1 for the state-of-the-art materials from the eminent manufacturers. If a MOF is deemed suitable for carbon capture applications and is commercialised, raw material production can be scaled to the requisite level with existing technologies. An assigned value of 1.5 £ kg−1 assumes that MOF production could be scaled efficiently and is the best-case scenario cost for a synthetic adsorbent. As per the physical properties, the influence of adsorbent cost on capture cost was investigated in our sensitivity analysis (see Results and discussion).
We converted the electrical requirements to an equivalent cost of natural gas that would need to be combusted in an on-site boiler to produce that electrical power. We did not include these outside battery limits (OBL) costs in the separation plant capital costs.
We determined the installed costs using the IChemE/factorial cost estimation method46,47 with equipment purchase costs taken from a range of sources detailed in the ESI.† We adjusted the costs for economic factors using the Chemical Engineering Plant Cost Index (CEPCI). Values reported in this work are based on the october 2018 value of 616.3, and a USD to GBP exchange rate of 0.76 £ $−1. There are limitations in the costing approach proposed here (accuracy is ±30%). Yet, such approach allows us to make a more informed conclusions with the data that is currently available.
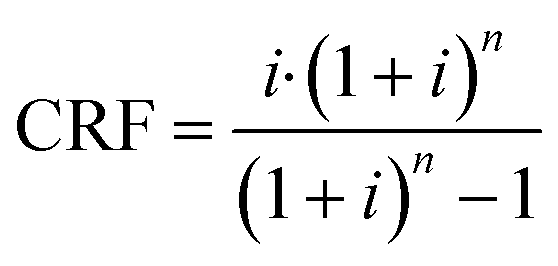
To determine the cost per tonne of CO2 captured, we used the total annualised cost (TAC), eqn (7), where CRF is the capital recovery factor and CCap and COp are the total capital costs and annual operating costs, respectively.
| TAC = CRF·CCap + COp | (7) |
For the capital recovery factor (eqn (8)), we assumed a cost of capital (i) of 10%, and a repayment period (n) of 25 years.
 | (8) |
The costs of capture for each scenario using amine absorption to achieve 90% CO2 capture were also determined as a point of comparison. Costs for 30% wt monoethanolamine (MEA) and a ‘new generation’ (‘NG’) absorbent with lower regeneration energy requirements such as Cansolv.48 A cost of 1100 US$ t−1 was used for both amine absorbents. The details of the model are provided in the ESI.† A conventional process topology is used with multiple unit operations were required due to equipment size limitations (heat exchanger areas and column fabrication limitations).
The flue-gases are assumed to be provided dry and without contaminants, with the drawback that pre-treatment equipment and costs are not accounted for in this work. The implications of this are not significant in this case as explained in the results and discussion section.
The majority of the work on post-combustion capture via adsorption has been focused on coal-fired sources, likely due to their more manageable CO2 content. Indeed, the higher CO2 content in coal-fired flue gases means that the separation is easier to achieve. These reported economic assessments49,50 provide comparison points for our work. We have observed significant variation between these reported estimates and our work (3 to 10 times). The cost differences between our work and that of Susarla et al.50 likely arose from the differences in the cost of vessels and vacuum pumps. In our case, we calculated the cost of adsorbent vessels based on mass of steel required, which is determined using the relevant pressure vessel standards. The vessels must withstand vacuum, which results in high vessel thicknesses and a correspondingly high mass. For vacuum pumps, we opted for an equipment cost correlation from Garrett.51 Susarla et al. used cost correlations for the vessels based on volume, which ordinarily do not account for the pressure vessel requirements, and they obtained costs for vacuum pumps from vendors. Considering vessels and vacuum pumps comprise the greatest proportion of capital costs, differences in the determination of these could result in significant variation. Indexing of costs to current day values was also not mentioned in either case.
Results and discussion
Adsorbent evaluation and screening
Applying the model described above, we have screened 22 MOFs, 2 zeolites and an activated carbon for the CO2 capture scenarios mentioned earlier (Table 1). We show the outcomes for all scenarios in Fig. 1. We describe in detail the NGCC case first and then provide a broader overview on the other scenarios. In Fig. 1, we have grouped the adsorbents in the following way, Mg-MOF-74 through UTSA-16 are MOFs with open metal sites, MOF-177 through Zn(BPDC)(BPP) are those with fully saturated coordination sites, ZIF-8 through ZIF-82 are the sub-classification of MOFs known as zeolitic imidazolate frameworks, and activated carbon through zeolite 13X are commercial adsorbents for reference.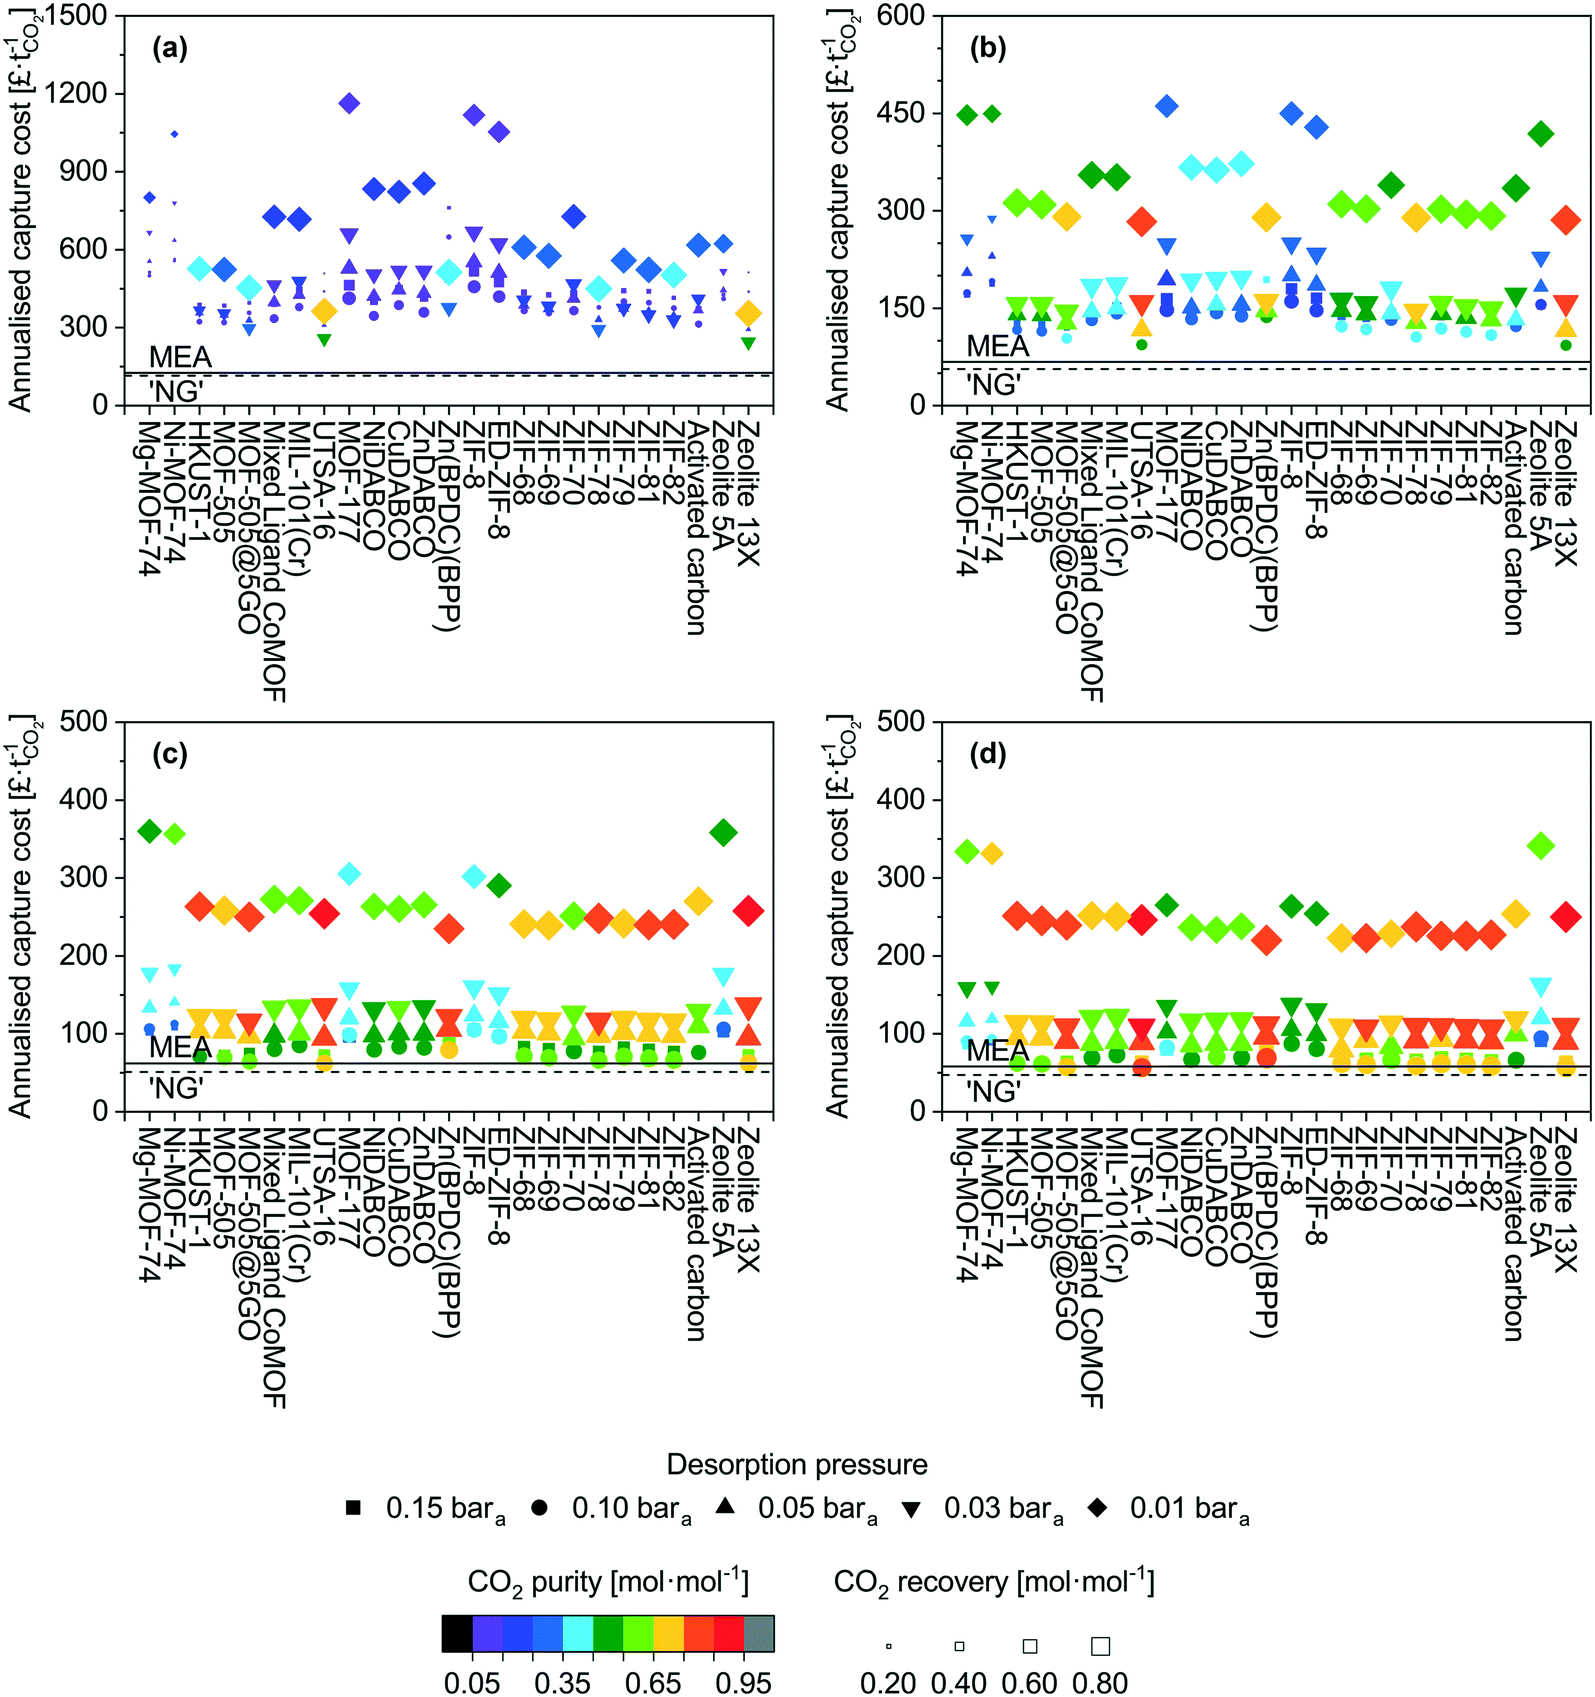 | ||
| Fig. 1 Separation performance and cost evaluation of 25 adsorbents for CO2/N2 separation for the four scenarios investigated as a function of desorption pressure: (a) NGCC, (b) coal-fired, (c) cement, (d) steel. In all cases, the cost of the MOFs is taken as £1.5 kg−1. | ||
The most striking output is the capture cost, with most data points >300 £ t−1, while amine absorption is below 150 £ t−1. These costs may seem initially higher in comparison to other reports.52–57 In all those cases, single equipment items are used and sized without limitations. In our work, limits are imposed on maximum column diameter, heat exchanger area, feed blower flow rate etc. resulting in multiple unit operations. The full details of this are provided in the model description in the ESI,† however, the result of this is that capital costs using our approach are high.
The adsorption high costs are capital driven, and a breakdown of the costs are presented in the ESI† (Fig. S1 to S4). One reason for this is the feed gas is low density and correspondingly the volumetric flow rate is significantly high. Accommodating the recommended gas velocities and pressure drops in the adsorption columns necessitates several columns in parallel to distribute the feed. Low velocities (i.e. pressure drop per unit length) will result in gas channelling and poor distribution of gas through the bed. Conversely, high overall pressure drops (i.e. total pressure drop of the packed bed) can crush the adsorbent pellets. Vacuum pumps also contribute significantly to the capital costs. Normally, large-scale vacuum generation is achieved using steam ejectors, however, the product becomes mixed with steam. The limitation of mechanical vacuum pumps is the maximum achievable flow rate. The variant opted for here has a maximum flow rate of ≈15000 act m3 h−1. However, given that the desorption step is a fraction of an hour (in this case 15 minutes), multiple parallel pumps are required to achieve the nameplate flow rate. Furthermore, at 0.01 bara, a given number of moles of gas occupies ≈100 times more volume than at standard conditions.
The adsorbent working capacity also contributes to the number of columns. Adsorbents such as MOF-177 and ZIF-8 have low capacities and linear isotherms in the pressure range of interest.58,59 This results in a low working capacity which necessitates a considerable adsorbent mass, and corresponding vessel volume to adsorb the captured CO2.
In addition to purity and recovery, another commonly used performance indicator is the energy penalty, or parasitic energy of the plant. We have included plots of energy penalty for all scenarios in the ESI† (Fig. S5 to S8). For UTSA-16, the total power and specific energy range from 83 MW and 1.96 GJetCO2−1 in the cement scenario to 377 MW and 1.82 GJetCO2−1 for the steel scenario at 0.01 bara desorption pressure. The power requirements are affected by the feed flow rate differences, and the specific energy requirements may be a better comparison between separations. For the natural gas and coal scenarios, specific energies of 4.1 and 2.4 GJetCO2−1, respectively, are required.
The scenarios investigated here do not highlight any grouping within the MOF families. This suggests that there is not a singular adsorbent factor or characteristic that defines the suitability of an adsorbent for a given application. This is not necessarily surprising as working capacity, recovery, and working selectivity are the parameters that define process performance and cost. It is not unforeseeable that a multitude of isotherms could yield the same results. For instance as previously mentioned, UTSA-16 and zeolite 13X display very similar performance, however, they are very different in nature. This hypothesis is tested later in this study.
We now provide a perspective on costs with comparison to the costs of amine absorption. All scenarios here cost more than amine adsorption, though we find exceptions for cement and steel at ‘high’ desorption pressure (0.10–0.15 bara). For the lowest desorption pressure (0.01 bara) for which the best performance in terms of purity and recovery are seen, the costs remain significantly higher than the benchmark. There are two main contributions to this. The first is the superior gas handling capability of absorption columns relative to packed columns. A given diameter can accommodate a higher flow rate with lower pressure loss. For the 0.01 bara case, the vast majority of the costs are vacuum equipment capital costs, which are unavoidable in a PVSA system. Finally, the amine absorption process achieves a recovery of 90% mol and purities ≥ 95% mol CO2, it is therefore an unfair comparison to a certain extent but further demonstrates that for these large-scale applications, PVSA may not be the optimal choice. The use of MEA based absorbents as a benchmark is also somewhat outdated as there are new systems based on mixtures of methyl diethanolamine (MDEA) and piperazine (PZ), and 2-amino-2-methyl-1-propanol (AMP) and piperazine, which display more desirable characteristics63 and may have lowered capture costs even more. Given the costs presented thus far, pretreatment and product compression costs are not an immediate concern. However, examples of these costs can be found in a range of resources.64–66
From an adsorbent perspective, of the MOFs evaluated, UTSA-16 does appear to perform the best for the post-combustion capture scenarios investigated using PVSA. Its performance is on par with zeolite 13X over all factors considered here. Considering its water co-adsorption and regeneration characteristics are more desirable than zeolite 13X,67–69 it may be a preferred candidate assuming that long-term cyclic stability can be verified. It is possible that the MOFs investigated here display better performance in a TSA process. However, conventional TSA processes have long cycle times due to the cooling of the vessel. This results in a greater number of columns to continuously accommodate the feed. Yet, this may be offset by the absence of vacuum costs. Whether suitable process intensification can be achieved will determine the feasibility of conventional TSA processes for large-scale applications. If recent developments in TSA technology such as Inventys' VeloxoTherm™ process70 are successful, it may enable industrial scale application of TSA for post-combustion capture.
From the screening exercise above, we conclude that: (i) MOFs performed poorly relative to amine-based absorption for the selected CO2 capture scenarios, though we observe improvements for more concentrated feeds and further improvements could be brought by process optimization; (ii) UTSA-16 performs the best out of all the MOFs screened while Mg-MOF-74 performs unsatisfactorily; (iii) the former observation highlights how the evaluation methods used in the existing literature are typically unfitting to claim a given MOF is suitable for CO2 capture applications.
UTSA-16 vs. Mg-MOF-74
We investigate here in more details the underlying reasons for the distinct performances of these two MOFs. This ‘exercise’ allows us to get a first grasp on the links between material properties and process performance. The isotherms of USTA-16 and Mg-MOF-74 are shown in Fig. 2. Mg-MOF-74 exhibits steep isotherms and a high enthalpy of adsorption, leading to two compounding effects. The steep isotherms require very deep vacuum to desorb the adsorbed gas. Since the process is adiabatic, a high enthalpy of adsorption causes greater temperature increase in the bed upon adsorption, reducing the capacity, and the corresponding decrease upon desorption retains the adsorbed gas. The bed temperature swing, i.e. the difference between the highest and lowest temperature experienced, is 25 K for Mg-MOF-74, vs. 5 K for UTSA-16 at 0.01 bara desorption. Comparing the isotherms in Fig. 2, it also becomes apparent that ultimate CO2 capacity is not necessarily significant. In fact, working capacity drives the low recoveries seen in many cases. Indeed, although Mg-MOF-74 has excellent CO2 capacity, it does not perform well when regenerability is accounted for. Considering the cyclic nature of the adsorption process, regenerability/desorption has equal importance as adsorption.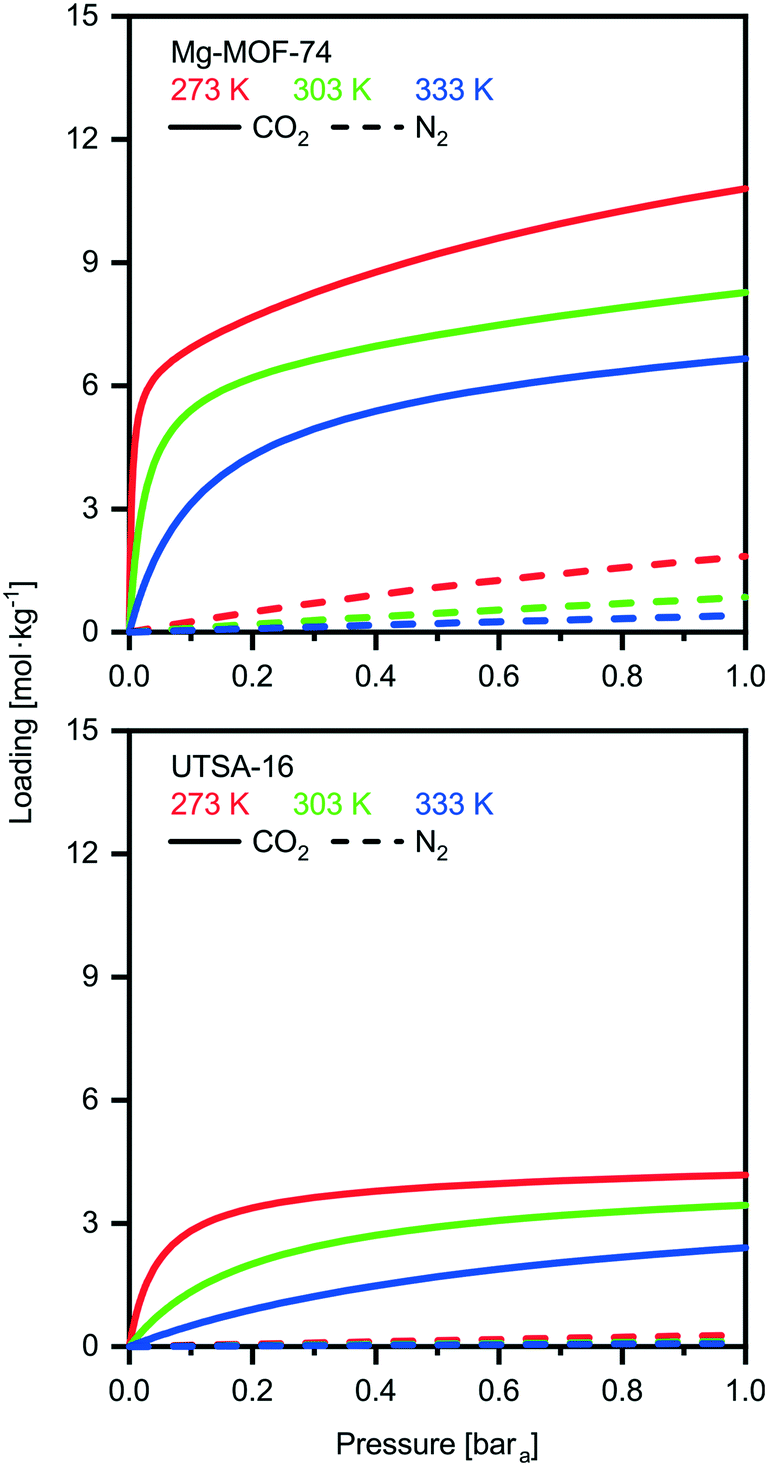 | ||
| Fig. 2 CO2 (solid lines) and N2 (dashed lines) adsorption isotherms of the two ‘extreme’ MOF adsorbents in terms of separation performance: Mg-MOF-74 (top, poorly performing MOF) and UTSA-16 (bottom, highly performing MOF) at 273 K (red), 303 K (green), and 333 K (blue). | ||
The excellent CO2 adsorption of Mg-MOF-74 is also accompanied by high N2 adsorption. This is due to the large pore apertures and high surface areas, which result in the adsorbent being non-discriminatory. In such a case where there is ≈96% mol N2 in the feed, N2 adsorption becomes an area of concern. The adsorbed N2 is collected with the CO2 product, and as such, any N2 adsorbed dilutes the CO2 product. This is further enhanced by the fact that N2 is easier to desorb than CO2, and in many cases the working capacity of N2 can be greater than CO2. The greater purity results displayed by UTSA-16 are not solely due to better CO2 working capacity, but also due to excellent selectivity. For the purposes of comparison, a plot of the ratio between the CO2 and N2 working capacities, also known as the working selectivity, is included in the ESI† (Fig. S9 to S12) for all adsorbents. It shows that most of the MOFs are hampered by poor selectivity. This analysis highlights that one should look at enhancing CO2/N2 selectivity and decreasing the N2 uptake rather than maximizing CO2 uptake.
Effects of process parameters
Taking Mg-MOF-74 and USTA-16 as examples, we then investigated the effect of process and adsorbent parameters on performance and capture cost, namely: adsorption temperature, desorption pressure, adsorbent cost and adsorbent density.We first investigated the impact of adsorption temperature, i.e. the temperature the feed is adjusted to following compression, on the purity, recovery and cost. The results are presented in Fig. 3a–c. Considering all three outputs, Mg-MOF-74's performance is optimum between 358 and 373 K. CO2 purity increases with temperature up to 373 K due to two factors: higher temperature isotherms are less steep, which improves the working capacity, and the nitrogen loading is suppressed. Beyond 373 K, the CO2 purity reduces due to the CO2 working capacity decreasing at a rate faster than the reduction in void volume. The improvement in recovery with temperature is also due to the isotherms becoming less steep. The minimum capture cost is seen at ≈373 K, i.e. when the improved working capacity and recovery and the corresponding reduction in capital costs offset the increased operating costs to supply steam for feed heating. Beyond this point, the increased heat exchanger area and steam utility required to heat the feed are further disadvantaged by reductions in working capacity and recovery – resulting in a higher cost per tonne captured. The CO2 emissions from the generation of the steam should also be kept in mind. The optimum temperature for UTSA-16 is seen at 313 K, i.e. the current operating temperature. Changes in temperature either side will reduce the CO2 working capacity, resulting in poorer purity, recovery, and capture cost. For completeness, we present an extended temperature range in the ESI† (Fig. S16 to S20) for all adsorbents. Only results for purity and recovery are shown, as the requisite allowances to calculate the cost under cryogenic operation are not present in the model. In summary, tuning the adsorption temperature may allow to reach higher performance levels, though in the present cases, the outputs remain below the targets.
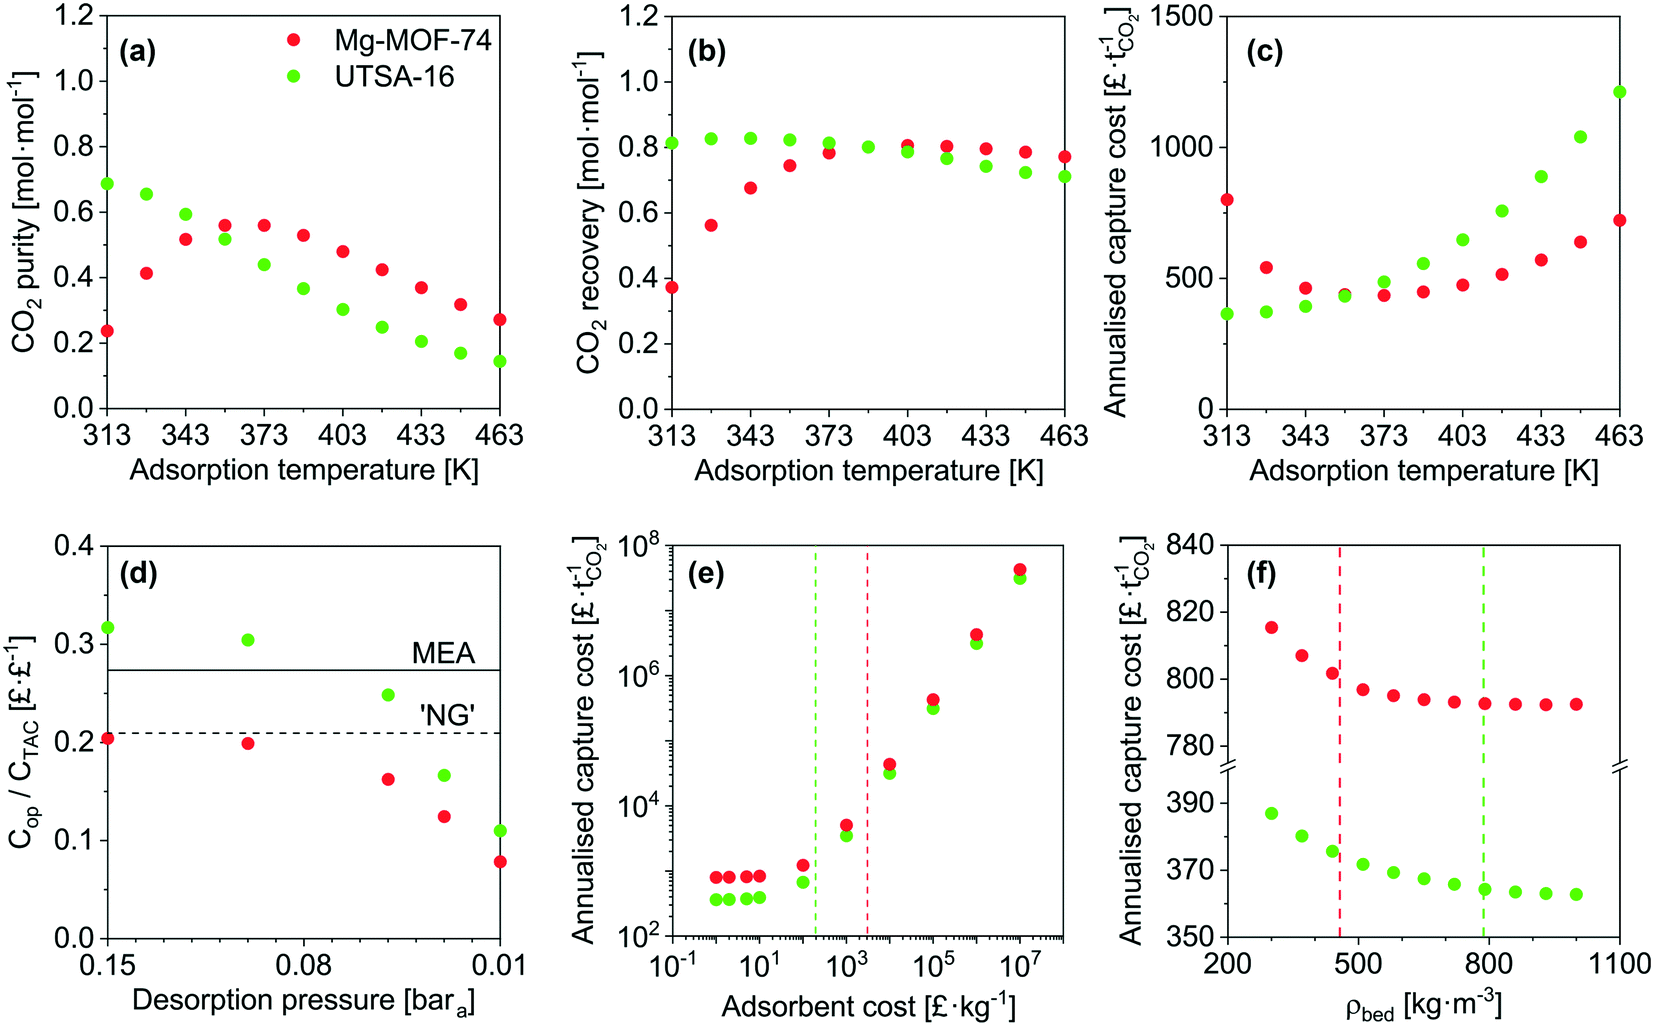 | ||
| Fig. 3 Evaluation of the effect of process parameters on separation performance and cost for Mg-MOF-74 (red) and UTSA-16 (green). Influence of adsorption temperature on: (a) CO2 purity, (b) CO2 recovery, and (c) capture cost. (d) Influence of desorption pressure on annual fraction of operating costs, where ‘NG’ represents Cansolv. (e) Influence of adsorbent cost on capture cost. (f) Influence of adsorbent density on capture cost. All for the NGCC scenario. All at 0.01 bara desorption pressure, except (d). | ||
Fig. 3d shows the fraction of operating costs over total annual costs as a function of desorption pressure. This fraction reduces with decreasing desorption pressure and is solely due to the increasing capital costs due to the vacuum requirements. A range of adsorbents, including Mg-MOF-74, displays a maxima, caused by vacuum pump capital costs. Higher desorption pressures reduce the suction flow rate of the vacuum pump selected. Consequently, a greater number of pumps are needed to achieve the required flow rate. Data for the other adsorbents is included in Fig. S21.†
Fig. 3e presents the influence of adsorbent cost. As other significant capital costs contribute to the process, the cost of the adsorbent does not become significant until 50–100 £ kg−1. In systems where adsorption is currently applied, e.g. air separation and H2 production, the capital costs are significantly lower, so the cost of the adsorbent can impact the separation cost. However, for post-combustion capture, the current MOF cost target value71 of 10 US$ kg−1 does not have to be reached to minimise the separation cost. It should be noted that this cost was proposed by the US DOE for CH4 storage in vehicles, however, it seems to have propagated through the community. We determined the cost of UTSA-16 (196 £ kg−1, vertical line on the plot) and Mg-MOF-74 (3070 £ kg−1) using prices for bulk chemical supply from common scientific suppliers and yields reported in the literature. We calculated the cost of zeolite 13X (66 £ kg−1) following the same method. Using the latter cost as an indicator of economies of scale to the industrial 13X price of 1.5 £ kg−1, this implies that UTSA-16 might be produced at a cost of 5 £ kg−1. The largest limitation in the synthesis of UTSA-16 is the metal source, cobalt acetate, as all other raw materials are readily available at scale. It may therefore be worth investigating the possibility of isoreticular chemistry for UTSA-16, and whether a more accessible metal source such as Zn2+ or Fe2+ is possible while maintaining similar adsorption properties.
Quantitative results for the impact of adsorbent density on cost are shown in Fig. 3f. As addressed during the sensitivity analysis, the cost increases as the adsorbent density decreases. The benefits of a dense adsorbent are seen for UTSA-16. For Mg-MOF-74, significant cost reductions are not necessarily attainable even if pelletisation were used to increase density. This is ultimately due to the poor CO2 recovery of Mg-MOF-74. The recovery defines the total mass of CO2 that is captured from the feed, and the working capacity defines the amount of adsorbent required to capture that amount of CO2. Hence, the poor recovery implies a small mass of adsorbent. As the density increases, the vessel volume required to store that adsorbent reduces. A point is reached for Mg-MOF-74 such that it is not possible to reduce the number or size of the vessels further while still meeting the velocity and pressure drop requirements.
Finally, we evaluated the impact of feed flow rate on the approximate site area required for the plant. We conducted this study in the context of the NGCC scenario and using USTA-16 properties. As seen in Fig. 4, the 400 MWe case calls for an area of ≈18000 m2. This area only accounts for the number of adsorption columns and vacuum pumps required, while allowing a 0.5× spacing between the equipment items. Once all other equipment items such as compressors, heat exchangers, pumps, and OBL plant is included, the total area may be 1.5–2× this value. The default comparison to a range of stadia has also been included. Jest aside, reduction in the plant area is paramount in the successful implementation of adsorption for post-combustion capture. Efforts should be placed towards process intensification and improvements in mechanical vacuum generation technology.
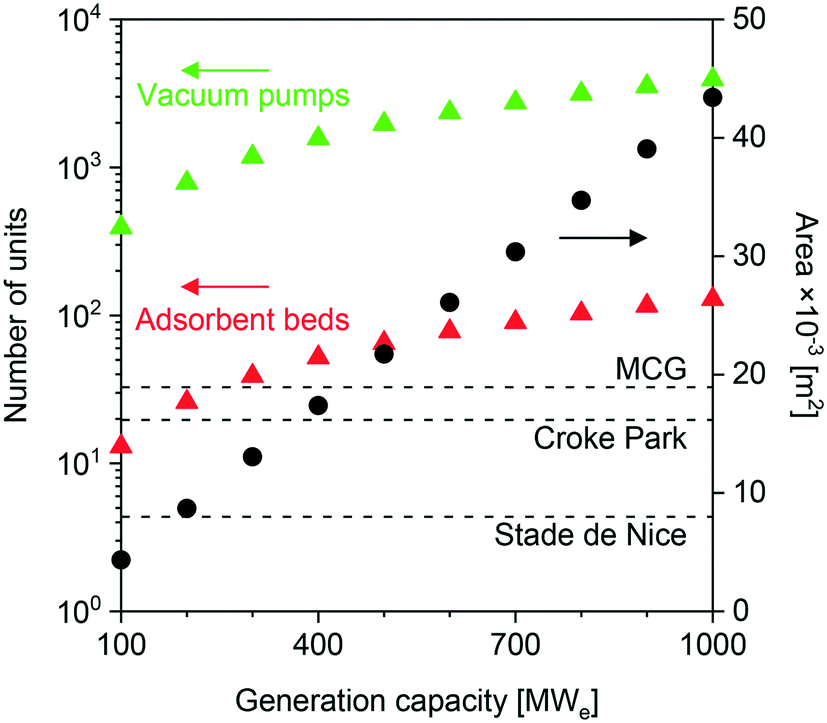 | ||
| Fig. 4 Area occupied by vacuum pumps and adsorption columns as a function of power generation capacity (flue gas flow rate) for the NGCC scenario, using UTSA-16 as the adsorbent. | ||
Sensitivity analysis
As previously mentioned, there may be some uncertainty in the adsorbent physical properties as they are not experimentally measured or verified values but estimated ones. To investigate the implications of inaccuracies in bed density, void fraction, and heat capacity, we carried out a sensitivity analysis over a ±30% range for each property while keeping the others constant (Fig. 5 and S13 to S15†). Due to the interrelated nature of adsorption processes, we investigated the effect of the three physical property inputs for both Mg-MOF-74 and UTSA-16 at two desorption pressures. Upon first observation, variations in adsorbent density and void fraction do not have significant influence on any of the three performance metrics, while heat capacity does to some extent.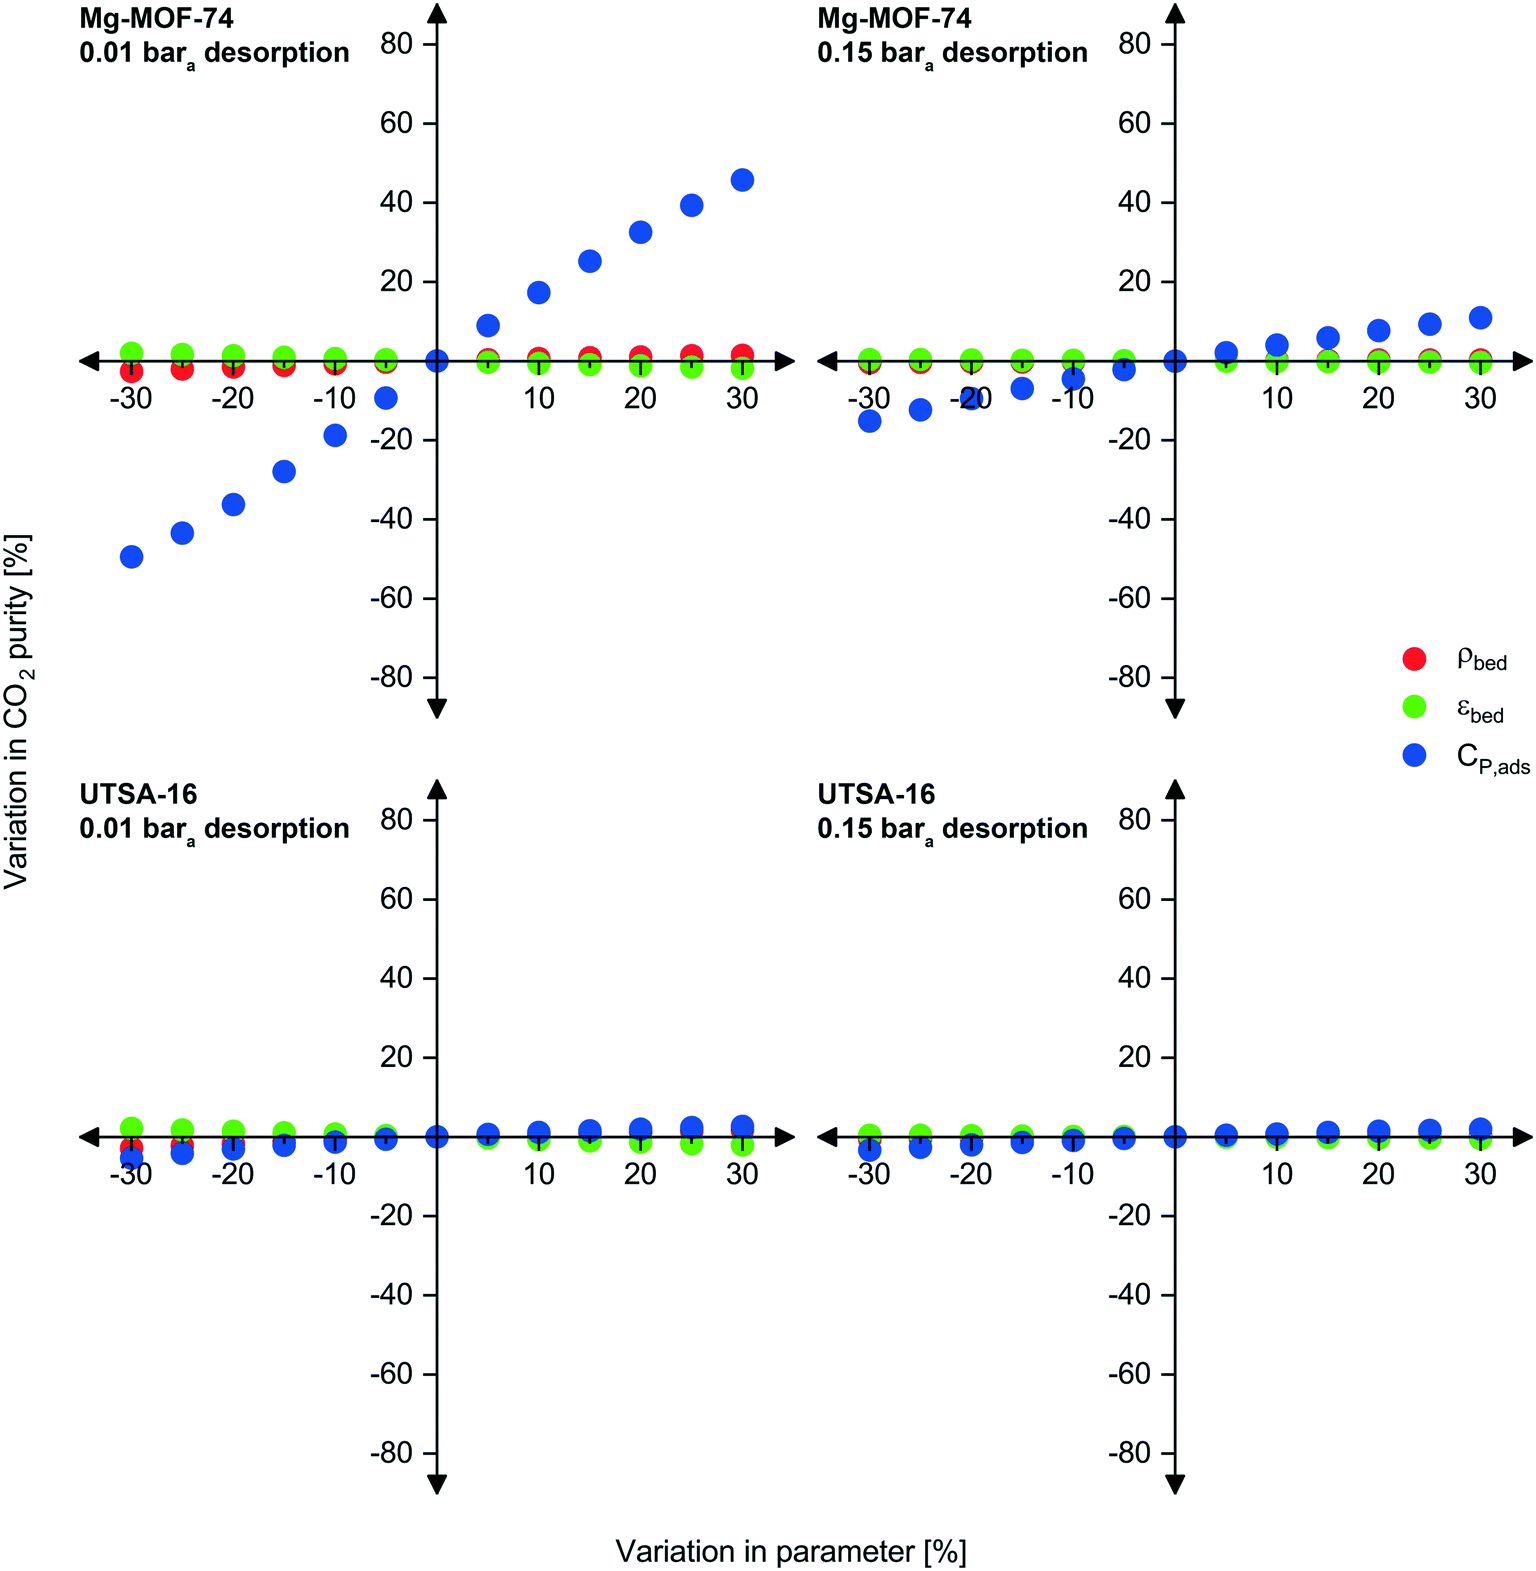 | ||
| Fig. 5 Sensitivity analysis of adsorbent physical properties (density, void fraction, and heat capacity) on CO2 purity for Mg-MOF-74 (top) and UTSA-16 (bottom) at 0.01 bara desorption (left) and 0.15 bara desorption (right). | ||
We now examine these observations in greater detail. The density and void fraction both contribute to the total amount of void space present in the bed for a given mass of adsorbent. The void space impacts the dilution of the desorbed product gas (CO2) by the feed gas occupying the void space. Therefore, in general, a larger void volume results in poorer product purity. This is seen for all scenarios presented below, a reduction in void fraction improves CO2 purity, and vice versa. An increase in density also improves CO2 purity. The largest impacts are observed at the lower desorption pressure. Although a lower desorption pressure recovers more CO2 from the adsorbent positively contributing to purity, the lower pressures also recover more of the approximately 96% N2 present in the void space.
Unlike density and void space, variations in the heat capacity significantly affect the performance of Mg-MOF-74 at 0.01 bara. The effect is not as severe at higher desorption pressures, nor is it significant for UTSA-16. To explain this observation, we compare the adsorbents and operating conditions. The first contribution is due to the difference in enthalpy of adsorption between the two adsorbents. Mg-MOF-74 has an enthalpy of adsorption at zero loading for CO2 of at least 47 kJ mol−1,17,72 whereas UTSA-16 is ≈32–35 kJ mol−1.73 If the actual heat capacity is lower than the estimated value (negative x-values), the bed experiences a larger temperature swing for a given energy input/output. As these swings are already large for Mg-MOF-74, a further increase has even worse implications on the CO2 purity and recovery, reducing the working capacity even further. The reverse applies for the improvements in purity and recovery seen in the right direction of the axis, a higher adsorbent heat capacity limits the temperature swing. The contribution of desorption pressure to this observation is related to the working capacity/amount desorbed. At higher desorption pressures, fewer moles of gas desorb, thus requiring smaller thermal energy input from the surroundings to do so; therefore, variations in heat capacity are less significant. As the amount desorbed is not a linear function of pressure (logarithmic isotherm shape), the influence of heat capacity does not have a linear relationship with desorption pressure.
In some cases, these effects combine in a beneficial (and convoluted manner), such as the CO2 recovery for UTSA-16 at 0.15 bara (Fig. S14†). The feed required to complete one cycle decreases due to the lower heat capacity of the adsorbent resulting in a greater temperature swing of the bed. However, a natural feedback loop exists where desorption becomes more difficult as it proceeds, due to the concurrent reduction in temperature. As desorption is taking place at a higher pressure, the working capacity of CO2 is not significantly reduced as a balance is met between higher temperature change from reduced heat capacity, and lower temperature change due to higher desorption pressure. As CO2 recovery is defined as the ratio of CO2 product to total CO2 feed, this culminates in higher CO2 recovery. This is not observed for all adsorbents and is normally caused by the combination of heat of adsorption, and the relative amounts of gas removed from the void space and from the adsorbent. This is seen in the effect of void fraction on CO2 recovery for UTSA-16 at 0.15 bara desorption. A lower void fraction results in lower CO2 recovery, which suggests that a reasonable portion of the ‘working capacity’ is coming from the feed CO2 occupying the void space, rather than what is collected from the adsorbent.
Considering now capture cost, lower densities increase costs due to: (i) the larger size of the vessels needed to accommodate the mass of adsorbent, and (ii) the greater amount of vacuum capacity required. In general, a lower void fraction reduces capital costs since the adsorbent occupies a greater portion of the adsorption vessel volume and requires reduced vacuum capacity. The UTSA-16 result for 0.15 bara desorption represents an exception. Due to the aforementioned reduction in recovery, a greater mass of adsorbent is required to capture the given feed flow rate, resulting in higher capital costs for vessels and adsorbent.
Overall, variations in the adsorbent density and void fraction do not influence significantly the performance and costs of the capture process. Heat capacity, on the other hand, may have an impact for adsorbents with high enthalpies of adsorption, such as Mg-MOF-74. We note that these implications remain relative. For instance, although an improvement of ≈46% can be seen in the CO2 purity at 0.01 bara if the heat capacity were underestimated by 30%, the ultimate outcome of this is that the CO2 purity increases from 23.7% mol to 34.5% mol, which remains low.
Optimising adsorbent properties
Having developed a reasonable understanding of the process and the factors which influence process performance, we will now direct our attention to the adsorbents themselves. Our goal here is to identify and quantify the adsorbents characteristics needed to push the performance and capture cost towards the targets. This theoretical exercise, conducted on Mg-MOF-74 and USTA-16, will provide directions to chemists and materials scientists in the design and synthesis of highly performing adsorbents. This has been attempted by others to a certain extent,30,49,74,75 where hypothetical adsorbents (or isotherms) are proposed to optimise separation performance. Aside from the impact on process economics, which the majority do not address, we propose some synthesis routes by which the optimum properties could be obtained. We note that limiting the analysis to the extreme cases of Mg-MOF-74 and USTA-16 will not necessarily exclude any of the MOFs from the original list. Indeed, Mg-MOF-74 has large surface area and porosity and strong open metal centres, whereas UTSA-16 is a small pore adsorbent with low(er) porosity and more moderate enthalpy of adsorption. Thus, the majority of the other adsorbents should be incorporated in that range.Adsorption isotherms provide a reflection of an adsorbent's physical and chemical properties. Assuming our ability to tune the adsorption properties of the adsorbent in any way desired, we can investigate the influence of various aspects of the adsorbent/isotherm. In the model, we described the adsorption isotherms by the dual-site Langmuir isotherm (eqn (9)).
 | (9) |
First, we artificially increased the CO2 capacity by multiplying m (eqn (9)) by a factor and we quantified the impact on the CO2 purity, recovery and capture cost (Fig. 6a–c). This exercise somewhat equals to increasing the selectivity of the adsorbent by increasing CO2 capacity. In nearly every instance, increasing the CO2 capacity of each adsorbent even by a factor of 20 has negligible impact. UTSA-16's CO2 purity slightly improves up to a factor of 4, due to an increased working capacity. Beyond that, thermal effects offset the increase in CO2 capacity. Improving the working capacity results in less adsorbent mass requirements and thereby a drop in cost. However, this effect remains small and restricted to low multiplication factor.
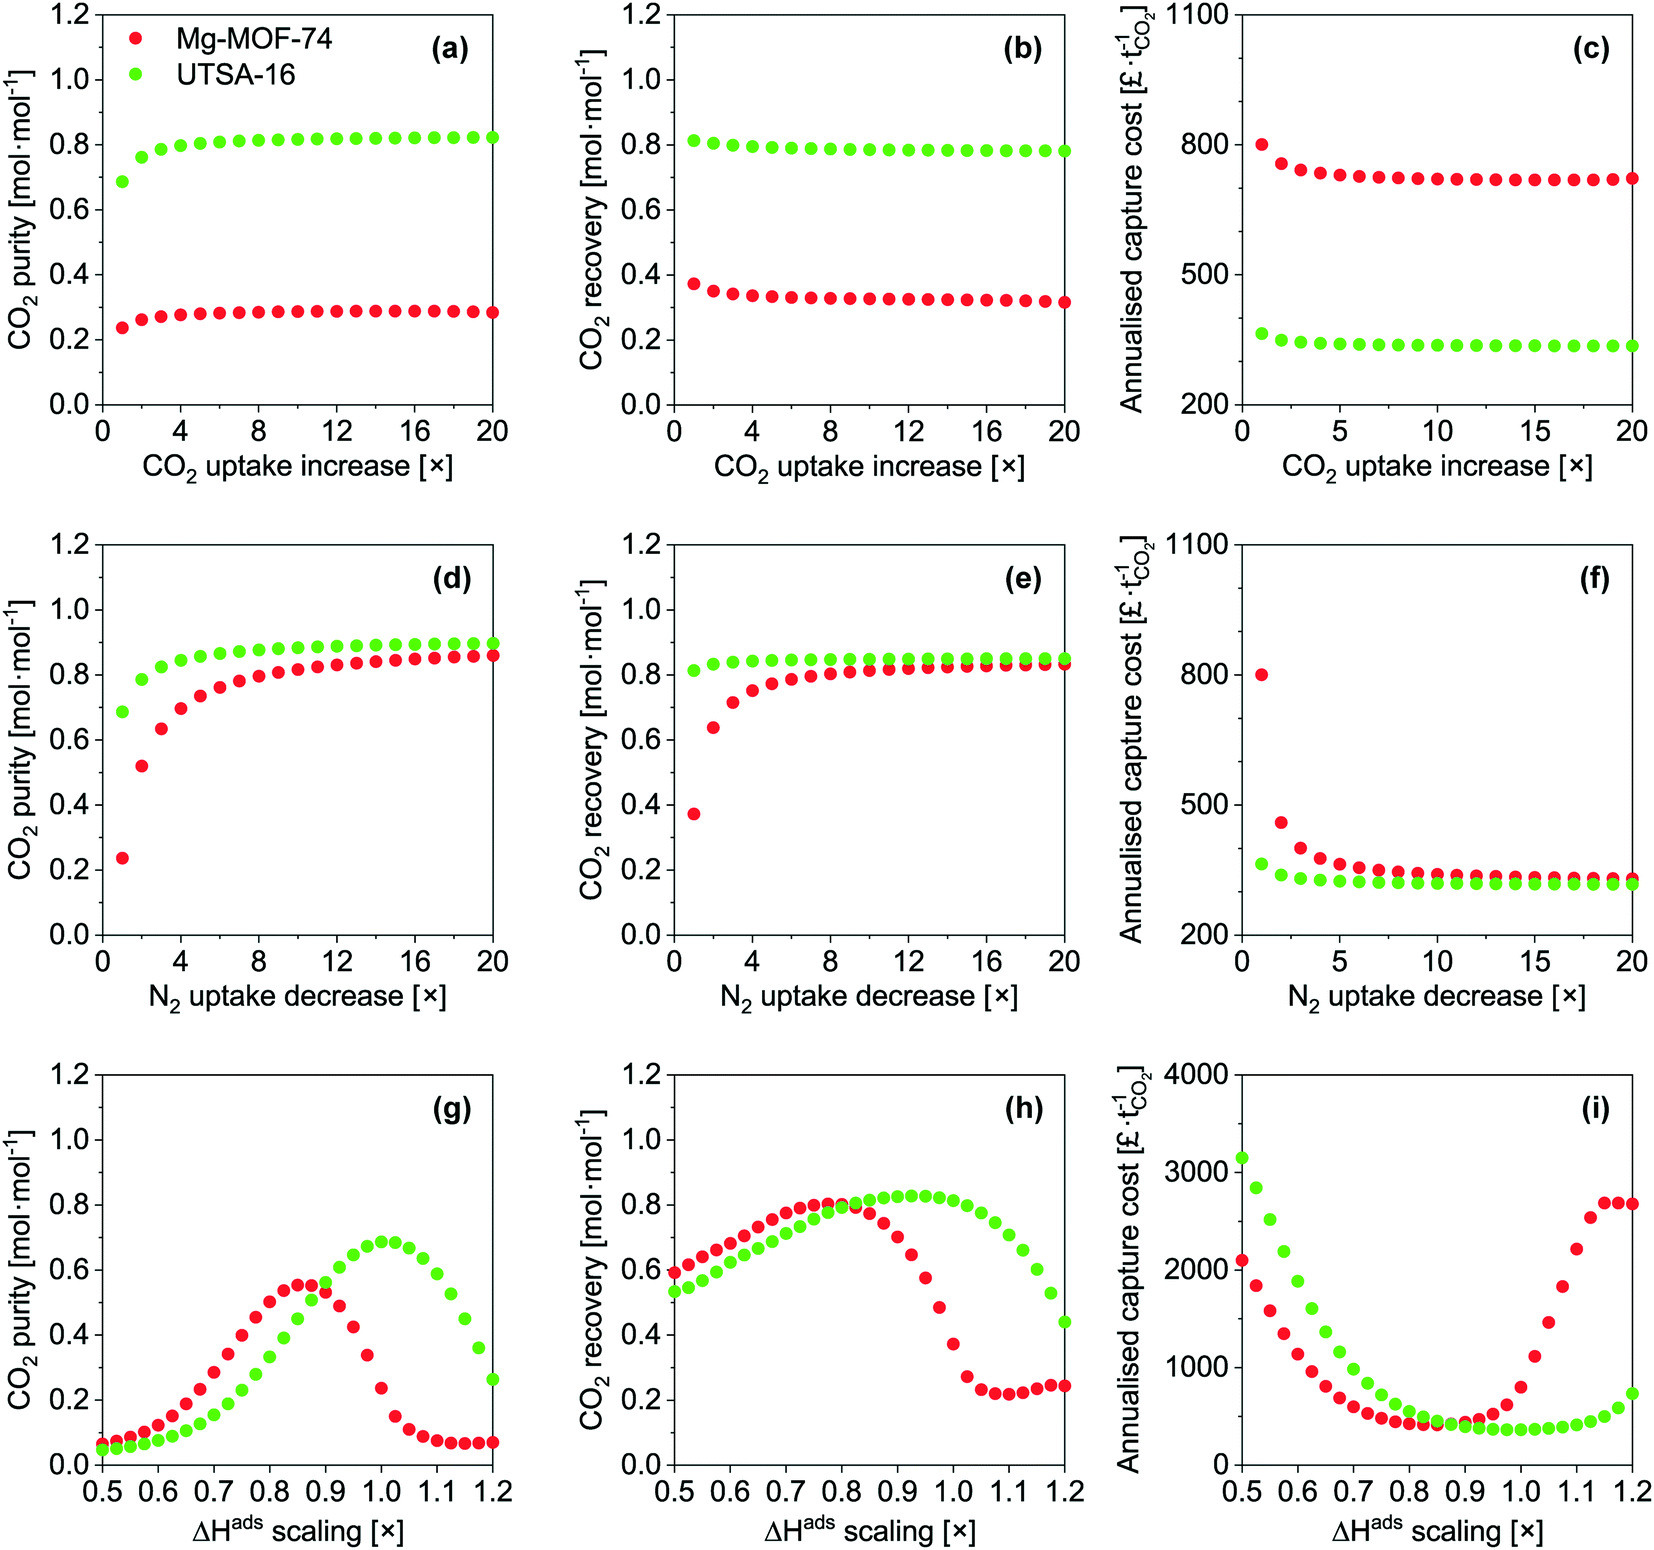 | ||
| Fig. 6 Influence of increasing CO2 uptake (top, a–c), decreasing N2 adsorption (middle, d–f), and enthalpy of adsorption (bottom, g–i) for Mg-MOF-74 (red) and UTSA-16 (green) on CO2 purity (left), CO2 recovery (middle), and capture cost (right) for the NGCC scenario. | ||
Next, we investigated the implications of reducing N2 capacity (Fig. 6d–f). This was achieved by dividing the corresponding m parameters in eqn (9) by a factor. As before, this can be thought of improving the selectivity by reducing N2 adsorption. This area has received little to no attention in the literature. We observe significant gains for the three outputs for the two MOFs, though the extent of improvement is less pronounced for UTSA-16. CO2 purity improves due to a reduction in co-adsorption. The relative gain in CO2 purity for UTSA-16 is not as large since the baseline sample does not adsorb significant amounts of N2. Reducing N2 adsorption improves CO2 recovery for Mg-MOF-74. The N2 working capacity on Mg-MOF-74 is rather high since Mg-MOF-74 adsorbs a significant amount of N2 considering the partial pressure of N2 for this application (Fig. 2). In fact, the working capacity of N2 is higher than CO2, as indicated by the working selectivity values less than unity (Fig. S9 to S12†). The energetics of N2 adsorption and desorption result in bed temperature swings. Reducing the portion of the temperature swing attributed to N2 adsorption improves the CO2 working capacity, and thus the recovery. This factor also enhances CO2 purity. The improvements in recovery for Mg-MOF-74 culminate in significant capture cost reductions due to the smaller adsorbent mass required. For UTSA-16, CO2 purity improves for the same reasons mentioned above. The effect is not seen for CO2 recovery due to significantly different N2 adsorption characteristics of the baseline materials.
Finally, we assessed the effects of scaling the enthalpy of adsorption by varying ΔH (eqn (9)) for both CO2 and N2 by the same factor. We present the results in Fig. 6g–i. For CO2 purity, the maximum for Mg-MOF-74 is at ≈0.858×, and for UTSA-16 is at ≈1.01×. Taking the ΔHads values referred to earlier, the optimum values become ≈40 kJ mol−1 for CO2 on Mg-MOF-74, and the baseline value of ≈32–35 kJ mol−1 for UTSA-16. The overall trend in CO2 purity as a function of enthalpy of adsorption is due to the trade-off between two scenarios. At lower ΔH, the isotherm is insufficiently steep to adsorb a useful amount at these low partial pressures, while at higher ΔH, the isotherm becomes too steep and working capacity suffers. The optimum value would therefore shift towards lower ΔH for higher feed concentrations with all other factors being equal. As the CO2 recovery is a function of total feed amount, the influence of ΔH is multifaceted. A change in ΔH influences the amount adsorbed at a given partial pressure. Lower ΔH reduces the total amount adsorbed, thus the recovery is not impacted as dramatically as purity. At higher ΔH, the total amount adsorbed increases, while the amount that can be recovered decreases, resulting in a sharp decline in recovery. The minima in cost align with the maxima in recovery as a given mass of adsorbent is more productive, requiring less infrastructure. At lower ΔH, the capture cost increases due to poor working capacity attributed to the low amount adsorbed, requiring more adsorbent and vessels. At higher ΔH, poor working capacity arising from severe thermal effects increases cost.
Having assessed the effect of tuning various adsorbent properties, the question becomes: is this form of omnipotent control even possible? To some extent it may be. Increasing CO2 adsorption capacity while operating in a physisorption regime would likely be attainable by increasing adsorbent surface area. The drawback to this is that N2 adsorption capacity would correspondingly increase due to the non-selective nature of raw surface area. Selectively decreasing N2 adsorption may be possible by reducing pore aperture, creating a molecular sieving style effect. Small pore MOFs with lower surface areas are uncommon and is an area which could benefit from additional research. Control over the ΔH may be possible for both MOFs investigated here. Considering that the unsaturated metal sites of Mg-MOF-74 contribute most to the high adsorption enthalpy, two potential avenues arise. The first avenue is using other metal analogues of M-MOF-74 to modulate the M–CO2 interactions and steric effects. This has been reported by Queen et al.76 and based on this study, Co-, Fe-, Mn-, and Zn-MOF-74 may be more suitable than Mg-MOF-74. Partially metal substituted forms have also been developed,77 and such techniques may yield finer control. The second avenue is the grafting of organic molecules to the unsaturated metal sites.78–80 The approach could be applied to control the enthalpy of adsorption by using mono or single-ended amines such as ethylamine for the most significant reduction, and functionalised forms such as aminoethanethiol, or ethanolamine for intermediate cases. An uncommon feature of UTSA-16 is the presence of charge-balancing cations (K+) in the structure. A family of MOFs known as ZMOFs (zeolite like MOFs) also demonstrates this feature.81,82 This feature could be exploited to influence the adsorbate–adsorbent interactions as is common in zeolites,83–86 for instance via exchange with Li+ ions.87 Li+ zeolites exhibit the strongest adsorbate–adsorbent interactions due to the high charge density of the Li+ ion. A complete ion exchange would increase the heat of adsorption of UTSA-16. Whether this has the counter-effect of increasing the accessible pore size and N2 adsorption remains to be seen. The authors also found that the Cs+ form displayed the highest enthalpy of adsorption, which is contrary to the order displayed in zeolites. This area seems to warrant further investigation and rigorous gas adsorption studies.
The ideal isotherm
The previous section naturally leads to the question: what combination of CO2 and N2 isotherms are required to achieve maximum performance for the given scenarios? In response, we applied the model to generate a dataset by sweeping over a range of isotherm input parameters. Similar work has been previously undertaken,30,74 however, we assess a range of flue gas sources over a wider range of isotherms, as well as considering capture cost. To reduce computation and data processing time, we used a single-site Langmuir isotherm (eqn (10)) in place of the dual-site Langmuir isotherm (eqn (9)), thereby reducing the number of isotherm input parameters from 12 to 6. To further reduce the number of input parameters, we made assumptions making use of the physical interpretation of the Langmuir isotherm model. Firstly, the saturation capacity, m, is made equal for both nCO2 and nN2 since the number of adsorption sites is constant for a given adsorbent. The parameter b0 is related to the entropy of adsorption and assuming that the adsorbed phase is liquid-like allows the application of Trouton's rule,88 fixing the value of b0 to e−10.5 for both CO2 and N2. These assumptions allow the adsorption of CO2 and N2 to be described by three input parameters: mmax, ΔHCO2, and ΔHN2. Therefore, in effect, the amount adsorbed at a given pressure is defined by the value of ΔH. From the Langmuir isotherm theory, this is because a higher ΔH means a larger energy barrier must be overcome for the adsorbate to return to the gas phase. We swept the parameters over the following range, 1 ≤ mmax ≤ 16 mol kg−1, 24 ≤ ΔHCO2 ≤ 60 kJ mol−1, and 11 ≤ ΔHN2 ≤ 20 kJ mol−1, in steps of 1, 2, and 1, respectively. We fixed the adsorbent physical properties throughout this process to the values of UTSA-16: bed density = 787 kg m−3, total void fraction = 0.61, and heat capacity = 878 J kg−1 K−1. Including the variation of these parameters over a useful range would exponentially increase the number of data points and make data presentation unsightly. It may also be an unnecessary complication given the sensitivity analysis on physical properties discussed around Fig. 3. The desorption pressure was fixed at 0.01 bara for all cases. | (10) |
Although the use of the single-site Langmuir isotherm means that some measured type-I adsorption isotherms cannot be fit very accurately, our aim is to uncover the relationship between the isotherm characteristics and process performance. For reference, the values of the three parameters for Mg-MOF-74 and UTSA-16 are provided in Table 2. Mg-MOF-74's CO2 isotherms cannot be accurately fit with the single-site model, however, the range between 0 ≤ P ≤ 0.40 bara and T ≥ 303 K displays good fitting performance. This is fortunate as it matches the range relevant to this work.
| Parameter | Mg-MOF-74 | UTSA-16 |
|---|---|---|
| m max [mol kg−1] | 7.54 | 4.16 |
| ΔHCO2 [kJ mol−1] | 34.6 | 30.4 |
| ΔHN2 [kJ mol−1] | 21.3 | 17.8 |
The outputs for CO2 purity, recovery, and capture cost are shown in Fig. 7 for all four scenarios. We first discuss CO2 purity. The regions of good performance (red & grey) increase in size as the feed concentration increases indicating an easier separation. Taking the 11 kJ mol−1 plane, the region defined by the yellow-green transition around ΔHCO2 of 48 kJ mol−1 remains mostly unchanged when increasing CO2 concentration. This represents the limitation imposed by thermal effects of the bed and regenerability. Even if the N2 adsorption is negligible, a steep CO2 isotherm will hamper performance. The regions in the lower left (low ΔHCO2, high mmax) also increase in size with increasing CO2 concentration. In the regions of low ΔHCO2, a high capacity (mmax) is required in order to have an appreciable adsorption and working capacity at low feed concentrations. Hence, as the feed concentration increases, adsorbents with lower capacity also become feasible alternatives. For the 17 and 20 kJ mol−1 planes, the good performance regions increase noticeably in size with feed CO2 concentration. This increased allowance for N2 adsorption from a pure-component isotherm perspective stems from the lower N2 partial pressure in the feed. For the cement and steel scenarios, the dark blue–violet–black regions exhibit lower CO2 purities than the feed concentration. This stems from high N2 adsorption combined with poor CO2 working capacity.
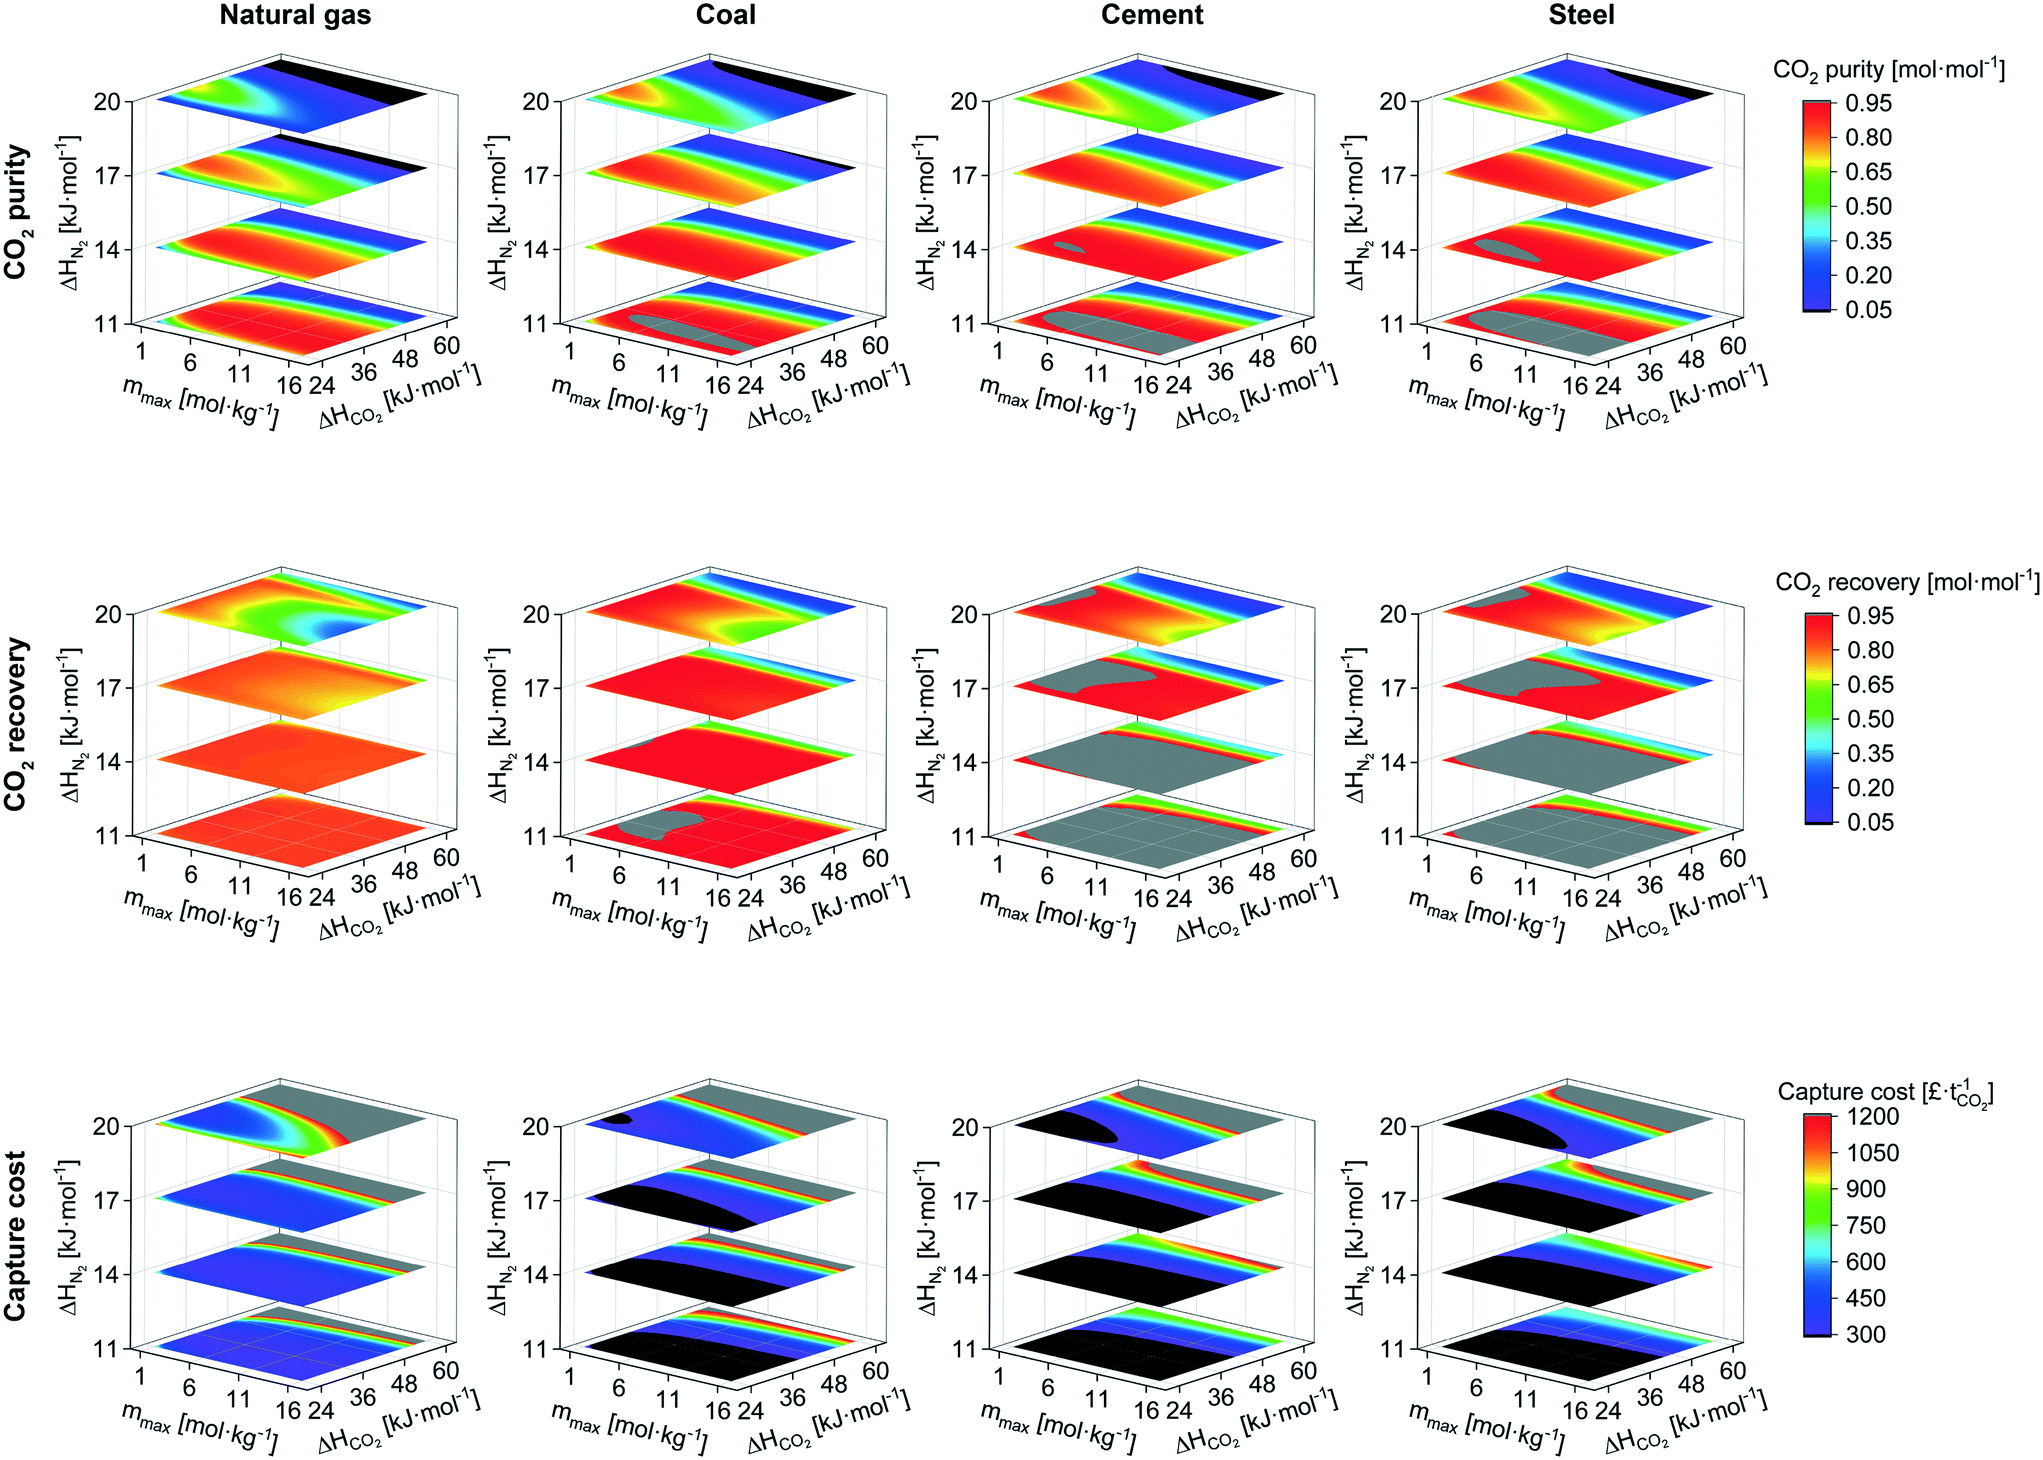 | ||
| Fig. 7 Contour plots displaying the influence of CO2 and N2 isotherms on CO2 purity and recovery, and capture cost for the four post-combustion scenarios investigated. Only selected ΔHN2 layers are shown for greater clarity. | ||
We now look at the variation in CO2 recovery, i.e. the ratio between the CO2 obtained in the product relative to the total CO2 fed to the process. At the lower CO2 concentrations, there are fewer regions of good recovery. Additionally, there is an appreciable amount of N2 adsorption due to its comparatively high partial pressure. The ad- and desorption of CO2 is not the sole contributor to the thermal effects of the bed, all species do. High, or increased, adsorption of N2 leads to worse recovery of CO2 as its desorption is hampering CO2 desorption. This is reflected in two ways, any vertical line through the planes of ΔHN2 has reducing CO2 recovery as N2 adsorption increases, and a given ΔHN2 plane has reducing CO2 recovery as mmax increases.
The capture cost contours highlight the areas of best CO2 working capacity and recovery. Cross-scenario comparisons are not straightforward due to the differences in feed flow rate. The regions of lowest cost (black) increase in size with feed CO2 concentration, somewhat expected due to the increasing ease of separation, driven mostly by improvements in CO2 working capacity. If CO2 working capacity did not have a significant effect, the regions of lowest cost would align with those of highest CO2 recovery. In this model, as CO2 purity is proportional to CO2 working capacity, we observe similarities between the regions of lowest cost and highest purity (red & grey) for a given scenario.
We now return to our initial aim to define the ideal isotherm. In the framework of the single-site Langmuir isotherm, the parameter mmax would be proportional to the specific surface area (pore size and porosity), and the ΔH parameters to the respective adsorbate–adsorbent interactions (surface chemistry). It becomes possible to determine whether there is an isotherm type, and hence material properties, that are most suited for these separations. The utility of this exercise is to guide material development and enable a binary (yes/no) initial assessment of an adsorbent with minimal experimental input. Taking the natural gas scenario as an example, we generated a plot of all the isotherms achieving a CO2 purity of 85% mol (Fig. 8). We observe no trend or commonality between the CO2 isotherms that result in good process performance. Therefore, we cannot simply recommend a particular isotherm shape (and corresponding molecular scale properties), or CO2 capacity, which yields good performance, further highlighting the limitations of using CO2 adsorption capacity as a performance metric. It could be said in general that, given the N2 loading of UTSA-16 at 273.15 K and 1 bara is 0.28 mol kg−1, N2 adsorption greater than this would render the adsorbent unsuitable for post-combustion capture using PVSA. For these styles of separations (i.e. post-combustion capture using adsorption), the co-adsorption of N2 has the greatest influence on process performance. Consequently, efforts should be directed towards minimizing N2 adsorption and this is in-line with previous work.30,74
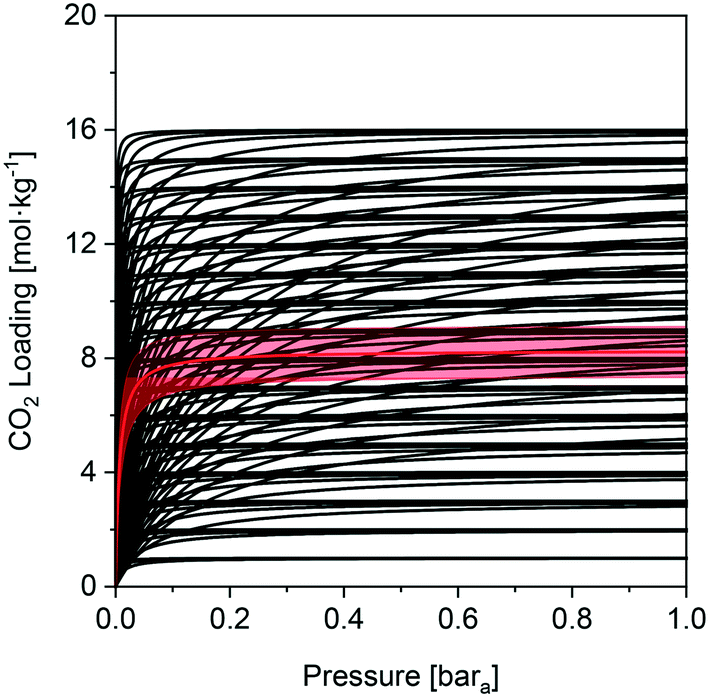 | ||
| Fig. 8 Representation of CO2 isotherms that correspond to a CO2 purity ≥85% mol for the NGCC scenario. The red line indicates the ‘average’ isotherm, with the shaded region showing the 99% confidence interval. Calculated for 273.15 K. | ||
Prima facie, for the NGCC scenario, one cannot achieve CO2 purities ≥95% mol within the bounds investigated. However, the choice of adsorption cycle impacts the attainable purity for a given adsorbent, as discussed earlier. Zeolite 13X for the coal scenario at 0.01 bara desorption returned an 84% mol CO2 purity. Separate studies showed that purities ≥95% mol and recoveries ≥90% mol are achievable using 13X.60,61 Hence, using zeolite 13X as a reference, we hypothesise that isotherms with CO2 purity values ≥85% mol could achieve the purity and recovery targets in a more complex cycle. The validity of this assumption depends on the concentration of CO2 in the feed gas. At feed concentrations equal to or greater than for the coal combustion case (12.5% mol), there is little concern. At lower feed concentrations, it becomes more difficult to achieve the purity and recovery targets even with a more complex cycle. We could not locate experimental work or rigorous simulations for a PVSA process for post-combustion capture from natural gas. Therefore, we cannot quantitatively describe the uncertainty, or make an equivalent comparison for the natural gas scenario. In the absence of a sounder reference, we assume that adsorbents or isotherms which display CO2 purity results ≥85% mol will achieve the required purity and recovery for CCS applications, albeit at a higher cost.
Establishing a surrogate model
Considering our previous analysis, we developed a surrogate model to simplify the evaluation of adsorbents. A surrogate model (i.e. black-box model) consists of one or more algebraic expressions fit to data, which enables regression of that data. The data generated in the previous section serves as the input, or training, data for the model. The data was fit using ALAMO.89 ALAMO generates ‘data-driven’ surrogate models by combining multiple function types to fit the data using its solver, BARON. This surrogate model is meant to be used by researchers to quickly evaluate the performance of their adsorbents. We supply it here as ESI.† An example of the goodness-of-fit for the natural gas scenario is shown in Fig. 9 by means of parity plots for three output variables. The complete results of the statistical analysis for all the scenarios are provided in the ESI† (Fig. S22 to S33). Given the robust goodness-of-fit of the surrogate model, we are confident that any adsorbent that is within the evaluated/swept bounds will be represented accurately.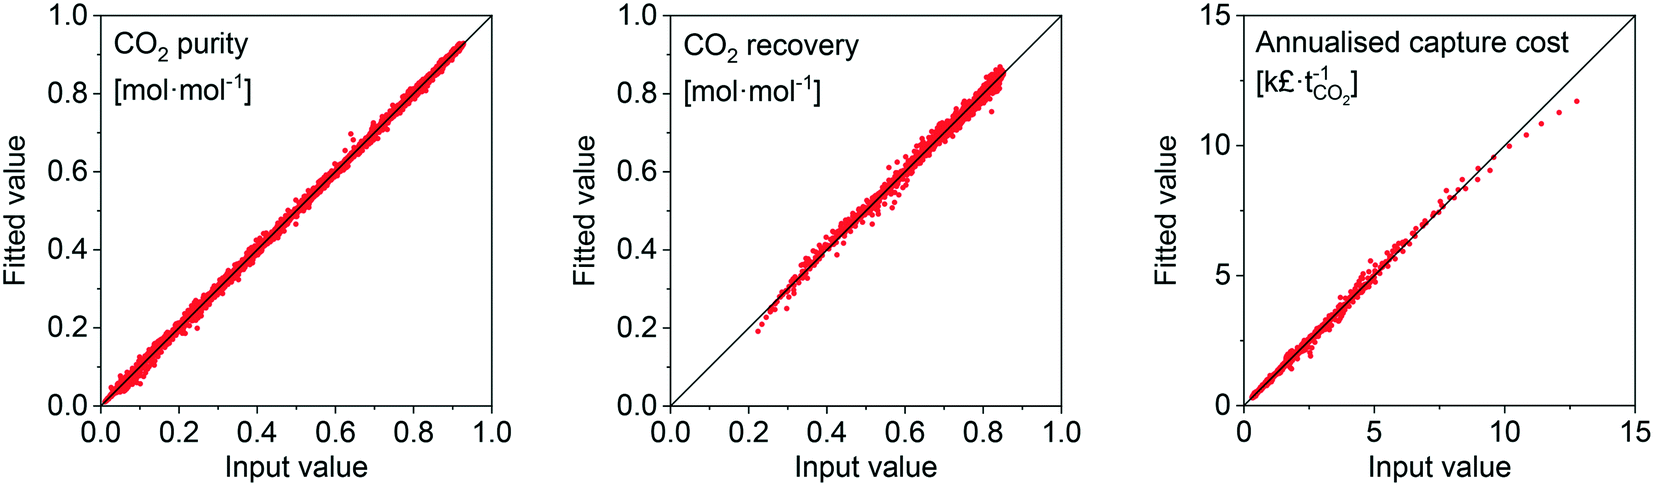 | ||
| Fig. 9 Parity plots of surrogate model fits for the natural-gas scenario data points to indicate the goodness-of-fit. | ||
A surrogate model advantageously provides reasonable estimate of an adsorbent's performance, without the need to implement the complete model. To make use of the surrogate model, the user must measure CO2 and N2 isotherms at three temperatures and fit to the single-site Langmuir isotherm (eqn (10)). We note that this equation may not perfectly fit the measured isotherm data (usually CO2 data). However, as discussed earlier, as long as the data points in the pressure and temperature range of interest can be fit accurately, there are no ill-effects. While the number of isotherms needed may seem large, they are key to obtain a reliable evaluation of any adsorbent so the thermal effects can be elucidated. The other concern may be the adsorbent physical properties, as mentioned the data points are generated using the physical properties for UTSA-16. We addressed the implications of this assumption in the sensitivity analysis (Fig. 5). For an initial evaluation to gauge whether an adsorbent warrants detailed investigation, the repercussions are not severe.
Conclusions
We have screened 22 MOFs along with two zeolites and an activated carbon for CO2/N2 separation in four different CO2 capture scenarios, i.e.: NGCC, pulverised coal power plant, cement plant and integrated steel mill. The screening ‘metrics’ involved CO2 purity, CO2 recovery and capture cost (OPEX and CAPEX). Of the 22 MOFs evaluated, UTSA-16 performs the best. Its low N2 uptake and less steep isotherms prevent product dilution by co-adsorbed N2 and promote regenerability. UTSA-16's performance aligns with that of zeolite 13X. Mg-MOF-74 represents the worst choice of adsorbent for the targeted separation over all scenarios, due to its high adsorption enthalpy and high N2 adsorption capacity. In our model, the performance displayed by UTSA remains below the targets in terms of purity and recovery, yet cycle optimisation would likely allow reaching these targets. Nonetheless, the process footprint requirements – at least 18000 m2 is required for the natural gas scenario – represent an area of concern, imposing limitations on, or discounts, retrofit possibilities. In addition, the cost of the separation remains generally high compared to the use of amine-based solvents. Interestingly, we have found that the cost of the adsorbent significantly impacts that of the process only if it is above 50 £ kg−1. A sensitivity analysis on adsorbent physical properties was also carried out to understand the impacts of uncertainty on these parameters. In general, uncertainties in heat capacity have the greatest influence on results, however, the magnitude is variable depending on the situation.
In the quest to identify optimum adsorbent characteristics that give best performance for CO2 purity and recovery, and capture cost, we have ‘optimised’ UTSA-16 and Mg-MOF-74. Reducing N2 adsorption has the greatest impact in increasing CO2 purity and recovery, and reducing capture cost. This should be a key area of research in materials development in the future. In addition, we have shown that an optimum heat of adsorption exists. Values cannot be too low such that the isotherm has little capacity at low CO2 partial pressures such as those experienced in post-combustion capture, and it cannot be too high such that the working capacity and regenerability is hampered.
Finally, we have attempted to design an ‘ideal adsorbent’ by numerically screening all isotherms defined in a given range. Ultimately, it was not possible to define a single isotherm, or a group of similar isotherms, that meet the CO2 purity and recovery requirements. However, we have used the data to develop a surrogate model and allow readers to swiftly evaluate their adsorbents for the four scenarios investigated without needing to implement the full model. This model requires users to input CO2 and N2 isotherms of their materials at 3 different temperatures each, in order to determine CO2 purity and recovery.
The natural progression from here is to consider TSA given the technology advancements in the area, and the development of an associated model is underway to understand and evaluate TSA processes for post-combustion capture.
Conflicts of interest
There are no conflicts to declare.Acknowledgements
We thank Mr. Wouter Arts for his efforts in surveying the literature for available isotherm data. We are grateful to the EPSRC for providing the funding to undertake this research via the UK Carbon Capture and Storage Research Centre (UKCCSRC, grant EP/P026214/1).References
- K. Sumida, S. Horike, S. S. Kaye, Z. R. Herm, W. L. Queen, C. M. Brown, F. Grandjean, G. J. Long, A. Dailly and J. R. Long, Hydrogen storage and carbon dioxide capture in an iron-based sodalite-type metal–organic framework (Fe-BTT) discovered via high-throughput methods, Chem. Sci., 2010, 1, 184 RSC.
- P. Nugent, V. Rhodus, T. Pham, B. Tudor, K. Forrest, L. Wojtas, B. Space and M. Zaworotko, Enhancement of CO2 selectivity in a pillared pcu MOM platform through pillar substitution, Chem. Commun., 2013, 49, 1606 RSC.
- Q.-Q. Dang, C.-Y. Liu, X.-M. Wang and X.-M. Zhang, Novel Covalent Triazine Framework for High-Performance CO2 Capture and Alkyne Carboxylation Reaction, ACS Appl. Mater. Interfaces, 2018, 10, 27972–27978 CrossRef CAS PubMed.
- V. Guillerm, Ł. J. Weseliński, M. Alkordi, M. I. H. Mohideen, Y. Belmabkhout, A. J. Cairns and M. Eddaoudi, Porous organic polymers with anchored aldehydes: a new platform for post-synthetic amine functionalization en route for enhanced CO2 adsorption properties, Chem. Commun., 2014, 50, 1937 RSC.
- W. Lu, D. Yuan, J. Sculley, D. Zhao, R. Krishna and H.-C. Zhou, Sulfonate-Grafted Porous Polymer Networks for Preferential CO2 Adsorption at Low Pressure, J. Am. Chem. Soc., 2011, 133, 18126–18129 CrossRef CAS PubMed.
- Y. Zeng, R. Zou and Y. Zhao, Covalent Organic Frameworks for CO2 Capture, Adv. Mater., 2016, 28, 2855–2873 CrossRef CAS.
- D.-H. Park, K. S. Lakhi, K. Ramadass, M.-K. Kim, S. N. Talapaneni, S. Joseph, U. Ravon, K. Al-Bahily and A. Vinu, Energy Efficient Synthesis of Ordered Mesoporous Carbon Nitrides with a High Nitrogen Content and Enhanced CO2 Capture Capacity, Chem. - Eur. J., 2017, 23, 10753–10757 CrossRef CAS.
- A. Alabadi, S. Razzaque, Y. Yang, S. Chen and B. Tan, Highly porous activated carbon materials from carbonized biomass with high CO2 capturing capacity, Chem. Eng. J., 2015, 281, 606–612 CrossRef CAS.
- J. Chen, J. Yang, G. Hu, X. Hu, Z. Li, S. Shen, M. Radosz and M. Fan, Enhanced CO2 Capture Capacity of Nitrogen-Doped Biomass-Derived Porous Carbons, ACS Sustainable Chem. Eng., 2016, 4, 1439–1445 CrossRef CAS.
- R. Krishna and J. M. van Baten, A comparison of the CO2 capture characteristics of zeolites and metal–organic frameworks, Sep. Purif. Technol., 2012, 87, 120–126 CrossRef CAS.
- P. Harlick and F. Tezel, Equilibrium Analysis of Cyclic Adsorption Processes: CO2 Working Capacities with NaY, Sep. Sci. Technol., 2005, 40, 2569–2591 CrossRef CAS.
- D.-X. Xue, A. J. Cairns, Y. Belmabkhout, L. Wojtas, Y. Liu, M. H. Alkordi and M. Eddaoudi, Tunable Rare-Earth fcu-MOFs: A Platform for Systematic Enhancement of CO2 Adsorption Energetics and Uptake, J. Am. Chem. Soc., 2013, 135, 7660–7667 CrossRef CAS PubMed.
- A. Phan, C. J. Doonan, F. J. Uribe-Romo, C. B. Knobler, M. O'Keeffe and O. M. Yaghi, Synthesis, Structure, and Carbon Dioxide Capture Properties of Zeolitic Imidazolate Frameworks, Acc. Chem. Res., 2010, 43, 58–67 CrossRef CAS PubMed.
- S. Salehi and M. Anbia, High CO2 Adsorption Capacity and CO2/CH4 Selectivity by Nanocomposites of MOF-199, Energy Fuels, 2017, 31, 5376–5384 CrossRef CAS.
- A. Demessence, D. M. D'Alessandro, M. L. Foo and J. R. Long, Strong CO2 Binding in a Water-Stable, Triazolate-Bridged Metal−Organic Framework Functionalized with Ethylenediamine, J. Am. Chem. Soc., 2009, 131, 8784–8786 CrossRef CAS PubMed.
- J. Liu, P. K. Thallapally, B. P. McGrail, D. R. Brown and J. Liu, Progress in adsorption-based CO2 capture by metal–organic frameworks, Chem. Soc. Rev., 2012, 41, 2308–2322 RSC.
- S. R. Caskey, A. G. Wong-Foy and A. J. Matzger, Dramatic Tuning of Carbon Dioxide Uptake via Metal Substitution in a Coordination Polymer with Cylindrical Pores, J. Am. Chem. Soc., 2008, 130, 10870–10871 CrossRef CAS PubMed.
- Z. Zhao, Z. Li and Y. S. Lin, Adsorption and Diffusion of Carbon Dioxide on Metal−Organic Framework (MOF-5), Ind. Eng. Chem. Res., 2009, 48, 10015–10020 CrossRef CAS.
- A. O. Yazaydın, R. Q. Snurr, T.-H. Park, K. Koh, J. Liu, M. D. LeVan, A. I. Benin, P. Jakubczak, M. Lanuza, D. B. Galloway, J. J. Low and R. R. Willis, Screening of Metal−Organic Frameworks for Carbon Dioxide Capture from Flue Gas Using a Combined Experimental and Modeling Approach, J. Am. Chem. Soc., 2009, 131, 18198–18199 CrossRef PubMed.
- E. S. Kikkinides, R. T. Yang and S. H. Cho, Concentration and recovery of carbon dioxide from flue gas by pressure swing adsorption, Ind. Eng. Chem. Res., 1993, 32, 2714–2720 CrossRef CAS.
- K. T. Chue, J. N. Kim, Y. J. Yoo, S. H. Cho and R. T. Yang, Comparison of Activated Carbon and Zeolite 13X for CO2 Recovery from Flue Gas by Pressure Swing Adsorption, Ind. Eng. Chem. Res., 1995, 34, 591–598 CrossRef CAS.
- W.-K. Choi, T.-I. Kwon, Y.-K. Yeo, H. Lee, H. K. Song and B.-K. Na, Optimal operation of the pressure swing adsorption (PSA) process for CO2 recovery, Korean J. Chem. Eng., 2003, 20, 617–623 CrossRef CAS.
- S. P. Reynolds, A. D. Ebner and J. A. Ritter, Stripping PSA Cycles for CO2 Recovery from Flue Gas at High Temperature Using a Hydrotalcite-Like Adsorbent, Ind. Eng. Chem. Res., 2006, 45, 4278–4294 CrossRef CAS.
- P. Xiao, J. Zhang, P. Webley, G. Li, R. Singh and R. Todd, Capture of CO2 from flue gas streams with zeolite 13X by vacuum-pressure swing adsorption, Adsorption, 2008, 14, 575–582 CrossRef CAS.
- J. A. Delgado, M. A. Uguina, J. L. Sotelo, V. I. Águeda, A. Sanz and P. Gómez, Numerical analysis of CO2 concentration and recovery from flue gas by a novel vacuum swing adsorption cycle, Comput. Chem. Eng., 2011, 35, 1010–1019 CrossRef CAS.
- Z. Liu, C. A. Grande, P. Li, J. Yu and A. E. Rodrigues, Multi-bed Vacuum Pressure Swing Adsorption for carbon dioxide capture from flue gas, Sep. Purif. Technol., 2011, 81, 307–317 CrossRef CAS.
- R. Haghpanah, A. Majumder, R. Nilam, A. Rajendran, S. Farooq, I. A. Karimi and M. Amanullah, Multiobjective Optimization of a Four-Step Adsorption Process for Postcombustion CO2 Capture Via Finite Volume Simulation, Ind. Eng. Chem. Res., 2013, 52, 4249–4265 CrossRef CAS.
- Y. Shen, Y. Zhou, D. Li, Q. Fu, D. Zhang and P. Na, Dual-reflux pressure swing adsorption process for carbon dioxide capture from dry flue gas, Int. J. Greenhouse Gas Control, 2017, 65, 55–64 CrossRef CAS.
- G. N. Nikolaidis, E. S. Kikkinides and M. C. Georgiadis, An Integrated Two-Stage P/VSA Process for Postcombustion CO2 Capture Using Combinations of Adsorbents Zeolite 13X and Mg-MOF-74, Ind. Eng. Chem. Res., 2017, 56, 974–988 CrossRef CAS.
- B. J. Maring and P. A. Webley, A new simplified pressure/vacuum swing adsorption model for rapid adsorbent screening for CO2 capture applications, Int. J. Greenhouse Gas Control, 2013, 15, 16–31 CrossRef CAS.
- G. D. Pirngruber, L. Hamon, S. Bourrelly, P. L. Llewellyn, E. Lenoir, V. Guillerm, C. Serre and T. Devic, A Method for Screening the Potential of MOFs as CO2 Adsorbents in Pressure Swing Adsorption Processes, ChemSusChem, 2012, 5, 762–776 CrossRef CAS PubMed.
- L. Joss, M. Gazzani, M. Hefti, D. Marx and M. Mazzotti, Temperature Swing Adsorption for the Recovery of the Heavy Component: An Equilibrium-Based Shortcut Model, Ind. Eng. Chem. Res., 2015, 54, 3027–3038 CrossRef CAS.
- M. Hefti, L. Joss, Z. Bjelobrk and M. Mazzotti, On the potential of phase-change adsorbents for CO2 capture by temperature swing adsorption, Faraday Discuss., 2016, 192, 153–179 RSC.
- V. Subramanian Balashankar, A. K. Rajagopalan, R. de Pauw, A. M. Avila and A. Rajendran, Analysis of a Batch Adsorber Analogue for Rapid Screening of Adsorbents for Postcombustion CO2 Capture, Ind. Eng. Chem. Res., 2019, 58, 3314–3328 CrossRef CAS.
- P. A. Webley, A. Qader, A. Ntiamoah, J. Ling, P. Xiao and Y. Zhai, A New Multi-bed Vacuum Swing Adsorption Cycle for CO2 Capture from Flue Gas Streams, Energy Procedia, 2017, 114, 2467–2480 CrossRef CAS.
- H. Wu, W. Zhou and T. Yildirim, High-capacity methane storage in metal-organic frameworks M2(dhtp): the important role of open metal sites, J. Am. Chem. Soc., 2009, 131, 4995–5000 CrossRef CAS PubMed.
- in CRC Handbook of Chemistry and Physics, ed. J. R. Rumble, CRC Press/Taylor & Francis, Boca Raton, FL, 100th edn (Internet Version 2019), 2019 Search PubMed.
- B. T. Goodman, W. V. Wilding, J. L. Oscarson and R. L. Rowley, Use of the DIPPR Database for Development of Quantitative Structure−Property Relationship Correlations: Heat Capacity of Solid Organic Compounds †, J. Chem. Eng. Data, 2004, 49, 24–31 CrossRef CAS.
- J. Park, J. D. Howe and D. S. Sholl, How Reproducible Are Isotherm Measurements in Metal–Organic Frameworks?, Chem. Mater., 2017, 29, 10487–10495 CrossRef CAS.
- R. Han, K. S. Walton and D. S. Sholl, Does Chemical Engineering Research Have a Reproducibility Problem?, Annu. Rev. Chem. Biomol. Eng., 2019, 10, 43–57 CrossRef PubMed.
- S. Mohammad, J. Fitzgerald, R. L. Robinson and K. A. M. Gasem, Experimental Uncertainties in Volumetric Methods for Measuring Equilibrium Adsorption, Energy Fuels, 2009, 23, 2810–2820 CrossRef CAS.
- Y. Gensterblum, P. van Hemert, P. Billemont, A. Busch, D. Charriére, D. Li, B. M. Krooss, G. de Weireld, D. Prinz and K.-H. A. A. Wolf, European inter-laboratory comparison of high pressure CO2 sorption isotherms. I: Activated carbon, Carbon, 2009, 47, 2958–2969 CrossRef CAS.
- Y. Gensterblum, P. van Hemert, P. Billemont, E. Battistutta, A. Busch, B. M. Krooss, G. De Weireld and K.-H. A. A. Wolf, European inter-laboratory comparison of high pressure CO2 sorption isotherms II: Natural coals, Int. J. Coal Geol., 2010, 84, 115–124 CrossRef CAS.
- IEA Greenhouse Gas R&D Programme (IEA GHG), CO2 Capture in the Cement Industry, 2008.
- IEA Greenhouse Gas R&D Programme (IEA GHG), Iron and Steel CCS Study (Techno-Economics Integrated Steel Mill), 2013.
- D. J. Brennan, Process Industry Economics: An International Perspective, IChemE, Rugby, UK, 1997 Search PubMed.
- D. J. Brennan and K. A. Golonka, New Factors for Capital Cost Estimation in Evolving Process Designs, Chem. Eng. Res. Des., 2002, 80, 579–586 CrossRef CAS.
- P.-E. Just, Advances in the development of CO2 capture solvents, Energy Procedia, 2013, 37, 314–324 CrossRef CAS.
- M. T. Ho, G. W. Allinson and D. E. Wiley, Reducing the Cost of CO2 Capture from Flue Gases Using Pressure Swing Adsorption, Ind. Eng. Chem. Res., 2008, 47, 4883–4890 CrossRef CAS.
- N. Susarla, R. Haghpanah, I. A. Karimi, S. Farooq, A. Rajendran, L. S. C. Tan and J. S. T. Lim, Energy and cost estimates for capturing CO2 from a dry flue gas using pressure/vacuum swing adsorption, Chem. Eng. Res. Des., 2015, 102, 354–367 CrossRef CAS.
- D. E. Garrett, Chemical Engineering Economics, van Nostrand Reinhold, New York, 1989 Search PubMed.
- M. R. M. Abu-Zahra, J. P. M. Niederer, P. H. M. Feron and G. F. Versteeg, CO2 capture from power plants, Int. J. Greenhouse Gas Control, 2007, 1, 135–142 CrossRef CAS.
- A. Raksajati, M. T. Ho and D. E. Wiley, Reducing the Cost of CO2 Capture from Flue Gases Using Aqueous Chemical Absorption, Ind. Eng. Chem. Res., 2013, 52, 16887–16901 CrossRef CAS.
- M. Vaccarelli, R. Carapellucci and L. Giordano, Energy and Economic Analysis of the CO2 Capture from Flue Gas of Combined Cycle Power Plants, Energy Procedia, 2014, 45, 1165–1174 CrossRef CAS.
- G. Manzolini, E. Sanchez Fernandez, S. Rezvani, E. Macchi, E. L. V. Goetheer and T. J. H. Vlugt, Economic assessment of novel amine based CO2 capture technologies integrated in power plants based on European Benchmarking Task Force methodology, Appl. Energy, 2015, 138, 546–558 CrossRef CAS.
- K. Li, W. Leigh and P. Feron, H. Yu and M. Tade, Systematic study of aqueous monoethanolamine (MEA)-based CO2 capture process: Techno-economic assessment of the MEA process and its improvements, Appl. Energy, 2016, 165, 648–659 CrossRef CAS.
- G. Guandalini, M. C. Romano, M. Ho, D. Wiley, E. S. Rubin and J. C. Abanades, A sequential approach for the economic evaluation of new CO2 capture technologies for power plants, Int. J. Greenhouse Gas Control, 2019, 84, 219–231 CrossRef CAS.
- J. A. Mason, K. Sumida, Z. R. Herm, R. Krishna and J. R. Long, Evaluating metal–organic frameworks for post-combustion carbon dioxide capture via temperature swing adsorption, Energy Environ. Sci., 2011, 4, 3030 RSC.
- Z. Zhang, S. Xian, Q. Xia, H. Wang, Z. Li and J. Li, Enhancement of CO2 Adsorption and CO2/N2 Selectivity on ZIF-8 via Postsynthetic Modification, AIChE J., 2013, 59, 2195–2206 CrossRef CAS.
- R. Haghpanah, R. Nilam, A. Rajendran, S. Farooq and I. A. Karimi, Cycle synthesis and optimization of a VSA process for postcombustion CO2 capture, AIChE J., 2013, 59, 4735–4748 CrossRef CAS.
- D. Diagne, M. Goto and T. Hirose, Parametric Studies on CO2 Separation and Recovery by a Dual Reflux PSA Process Consisting of Both Rectifying and Stripping Sections, Ind. Eng. Chem. Res., 1995, 34, 3083–3089 CrossRef CAS.
- A. Agarwal, L. T. Biegler and S. E. Zitney, A superstructure-based optimal synthesis of PSA cycles for post-combustion CO2 capture, AIChE J., 2009, 56, 1813–1828 CrossRef.
- G. T. Rochelle, in Absorption-Based Post-combustion Capture of Carbon Dioxide, Elsevier, 2016, pp. 35–67 Search PubMed.
- E. S. Rubin, S. Yeh, M. Antes, M. Berkenpas and J. Davison, Use of experience curves to estimate the future cost of power plants with CO2 capture, Int. J. Greenhouse Gas Control, 2007, 1, 188–197 CrossRef CAS.
- M. M. F. Hasan, E. L. First, F. Boukouvala and C. A. Floudas, A multi-scale framework for CO2 capture, utilization, and sequestration: CCUS and CCU, Comput. Chem. Eng., 2015, 81, 2–21 CrossRef CAS.
- C. Kolster, E. Mechleri, S. Krevor and N. Mac Dowell, The role of CO2 purification and transport networks in carbon capture and storage cost reduction, Int. J. Greenhouse Gas Control, 2017, 58, 127–141 CrossRef CAS.
- A. Masala, J. G. Vitillo, G. Mondino, C. A. Grande, R. Blom, M. Manzoli, M. Marshall and S. Bordiga, CO2 Capture in Dry and Wet Conditions in UTSA-16 Metal–Organic Framework, ACS Appl. Mater. Interfaces, 2017, 9, 455–463 CrossRef CAS PubMed.
- V. K. Chuikina, A. V. Kiselev, L. V. Mineyeva and G. G. Muttik, Heats of adsorption of water vapour on NaX and KNaX zeolites at different temperatures, J. Chem. Soc., Faraday Trans. 1, 1976, 72, 1345 RSC.
- K. N. Son, T.-M. J. Richardson and G. E. Cmarik, Equilibrium Adsorption Isotherms for H2O on Zeolite 13X, J. Chem. Eng. Data, 2019, 64, 1063–1071 CrossRef CAS.
- Inventys Inc., Technology, http://inventysinc.com/technology/, (accessed 14 July 2019).
- US Department of Energy, MOVE Program Overview, https://arpa-e.energy.gov/sites/default/files/documents/files/MOVE_ProgramOverview.pdf, (accessed 28 July 2019).
- Z. Bao, L. Yu, Q. Ren, X. Lu and S. Deng, Adsorption of CO2 and CH4 on a magnesium-based metal organic framework, J. Colloid Interface Sci., 2011, 353, 549–556 CrossRef CAS PubMed.
- A. Masala, F. Grifasi, C. Atzori, J. G. Vitillo, L. Mino, F. Bonino, M. R. Chierotti and S. Bordiga, CO2 Adsorption Sites in UTSA-16: Multitechnique Approach, J. Phys. Chem. C, 2016, 120, 12068–12074 CrossRef CAS.
- A. K. Rajagopalan and A. Rajendran, The effect of nitrogen adsorption on vacuum swing adsorption based post-combustion CO2 capture, Int. J. Greenhouse Gas Control, 2018, 78, 437–447 CrossRef CAS.
- R. Zhao, S. Deng, S. Wang, L. Zhao, Y. Zhang, B. Liu, H. Li and Z. Yu, Thermodynamic research of adsorbent materials on energy efficiency of vacuum-pressure swing adsorption cycle for CO2 capture, Appl. Therm. Eng., 2018, 128, 818–829 CrossRef CAS.
- W. L. Queen, M. R. Hudson, E. D. Bloch, J. A. Mason, M. I. Gonzalez, J. S. Lee, D. Gygi, J. D. Howe, K. Lee, T. A. Darwish, M. James, V. K. Peterson, S. J. Teat, B. Smit, J. B. Neaton, J. R. Long and C. M. Brown, Comprehensive study of carbon dioxide adsorption in the metal–organic frameworks M2(dobdc) (M = Mg, Mn, Fe, Co, Ni, Cu, Zn), Chem. Sci., 2014, 5, 4569–4581 RSC.
- Y. Jiao, C. R. Morelock, N. C. Burtch, W. P. Mounfield, J. T. Hungerford and K. S. Walton, Tuning the Kinetic Water Stability and Adsorption Interactions of Mg-MOF-74 by Partial Substitution with Co or Ni, Ind. Eng. Chem. Res., 2015, 54, 12408–12414 CrossRef CAS.
- S. Choi, T. Watanabe, T.-H. Bae, D. S. Sholl and C. W. Jones, Modification of the Mg/DOBDC MOF with Amines to Enhance CO2 Adsorption from Ultradilute Gases, J. Phys. Chem. Lett., 2012, 3, 1136–1141 CrossRef CAS PubMed.
- X. Su, L. Bromberg, V. Martis, F. Simeon, A. Huq and T. A. Hatton, Postsynthetic Functionalization of Mg-MOF-74 with Tetraethylenepentamine: Structural Characterization and Enhanced CO 2 Adsorption, ACS Appl. Mater. Interfaces, 2017, 9, 11299–11306 CrossRef CAS PubMed.
- T. M. McDonald, W. R. Lee, J. A. Mason, B. M. Wiers, C. S. Hong and J. R. Long, Capture of Carbon Dioxide from Air and Flue Gas in the Alkylamine-Appended Metal–Organic Framework mmen-Mg2(dobpdc), J. Am. Chem. Soc., 2012, 134, 7056–7065 CrossRef CAS PubMed.
- F. Nouar, J. Eckert, J. F. Eubank, P. Forster and M. Eddaoudi, Zeolite- like Metal−Organic Frameworks (ZMOFs) as Hydrogen Storage Platform: Lithium and Magnesium Ion-Exchange and H2-(rho-ZMOF) Interaction Studies, J. Am. Chem. Soc., 2009, 131, 2864–2870 CrossRef CAS PubMed.
- G. Calleja, J. A. Botas, M. Sánchez-Sánchez and M. G. Orcajo, Hydrogen adsorption over Zeolite-like MOF materials modified by ion exchange, Int. J. Hydrogen Energy, 2010, 35, 9916–9923 CrossRef CAS.
- D. W. Breck, Zeolite Molecular Sieves: Structure, Chemistry and Use, John Wiley & Sons Inc., New York, 1974 Search PubMed.
- R. M. Barrer and R. M. Gibbons, Zeolitic carbon dioxide: energetics and equilibria in relation to exchangeable cations in faujasite, Trans. Faraday Soc., 1965, 61, 948 RSC.
- J. Zhang, R. Singh and P. A. Webley, Alkali and alkaline-earth cation exchanged chabazite zeolites for adsorption based CO2 capture, Microporous Mesoporous Mater., 2008, 111, 478–487 CrossRef CAS.
- K. S. Walton, M. B. Abney and M. Douglas LeVan, CO2 adsorption in Y and X zeolites modified by alkali metal cation exchange, Microporous Mesoporous Mater., 2006, 91, 78–84 CrossRef CAS.
- X. Zhang, Z. Chen, X. Yang, M. Li, C. Chen and N. Zhang, The fixation of carbon dioxide with epoxides catalyzed by cation-exchanged metal-organic framework, Microporous Mesoporous Mater., 2018, 258, 55–61 CrossRef CAS.
- A. L. Myers and F. Siperstein, Characterization of adsorbents by energy profile of adsorbed molecules, Colloids Surf., A, 2001, 187–188, 73–81 CrossRef CAS.
- Z. T. Wilson and N. V. Sahinidis, The ALAMO approach to machine learning, Comput. Chem. Eng., 2017, 106, 785–795 CrossRef.
Footnote |
| † Electronic supplementary information (ESI) available: Descriptions of the adsorption and absorption models, dual-site Langmuir isotherm parameters and physical properties of the adsorbents investigated, supplementary results, the digitised isotherm data, and a surrogate model for the readers' use. See DOI: 10.1039/c9me00102f |
| This journal is © The Royal Society of Chemistry 2020 |