Controlling the physical and electrochemical properties of block copolymer-based porous carbon fibers by pyrolysis temperature†
Zhengping
Zhou
 a,
Tianyu
Liu
 a,
Assad U.
Khan
 a and
Guoliang
Liu
 *ab
*ab
aDepartment of Chemistry, Virginia Tech, Blacksburg, VA 24061, USA. E-mail: gliu1@vt.edu
bMacromolecules Innovation Institute and Academy of Integrated Science-Division of Nanoscience, Virginia Tech, Blacksburg, VA 24061, USA
First published on 15th July 2019
Abstract
Block copolymer-based porous carbon fibers are emerging materials for electrochemical energy conversion and storage. Pyrolysis temperature governs the properties of carbons. To design porous carbon fibers with tunable pore size, surface area, heteroatom content, electrical conductivity, and electrochemical performance, block copolymer poly(acrylonitrile-block-methyl methacrylate) (PAN-b-PMMA) was converted to porous carbon fibers via self-assembly, stabilization, and pyrolysis at temperatures ranging from 600 to 1200 °C. An increase in the pyrolysis temperature increases the total pore volume, specific surface area, and graphitic level, but decreases the amounts of nitrogen and oxygen heteroatoms, as well as the electrical resistance. As electrochemical supercapacitor electrodes, the porous carbon fibers pyrolyzed at 800 °C exhibit the highest gravimetric capacitance, owing to the balanced structural, chemical, and physical properties. The porous carbon fibers pyrolyzed at 600 °C have the highest heteroatom content to induce pseudocapacitance, but their capacitance and rate capability are the lowest due to the poorest electrical conductivity. In contrast, the porous carbon fibers pyrolyzed at 1200 °C show the best rate capability because of the highest electrical conductivity, the largest pore volume, the lowest diffusion resistance, and the best electron/ion transport. This work systematically reveals the thermal processing principles of porous carbon fibers with controlled structural, physical and electrochemical properties. The findings provide a guideline for designing block copolymer-based porous carbon fibers for electrochemical energy conversion and storage.
Design, System, ApplicationEffective utilization of block copolymer-based porous carbon fibers for energy storage requires deliberate control over their properties such as porosity, surface area, surface chemistry, and electron/ion conductivity. Herein we elucidate the correlations between pyrolysis temperature of block copolymers and properties of porous carbon fibers. Our findings serve as design principles for synthesizing porous carbon fibers from block copolymers. The porous carbon fibers with well-controlled properties are expected to enable applications in energy storage, catalysis, separation, filtration, and desalination. |
1. Introduction
Carbon fibers are attractive electrode materials in supercapacitors under extreme conditions due to their excellent flexibility, high electrical conductivity, and superior mechanical strength.1–6 A supercapacitor7–9 comprises two electrodes infiltrated with an electrolyte and separated by a separator.10 Supercapacitors store electrical energy via electrosorption of ions on the electrode surfaces and/or surface redox reactions associated with oxidized/reduced species. Porous materials, which have large surface areas for ion sorption or redox reactions, are at the heart of supercapacitor electrodes. However, conventional carbon fibers lack well-defined pores and cannot meet the demands of supercapacitors for high energy density.Most existing research of carbon fibers5,12 focuses on enhancing the capacitive performances by tuning the porous structure,13–16 as well as increasing the specific surface area, electrical conductivity,17–19 and heteroatom doping levels.20–23 For example, Ra et al. created sub-nanometer pores in carbon fibers after pyrolysis and CO2 activation at temperatures ranging from 700 to 1000 °C.17 The pyrolysis temperature and subsequent activation strongly influenced the specific surface areas and the concentrations of nitrogen- and oxygen-containing surface functionalities. Similar to CO2 activation, the chemical activation of carbon fibers with strong alkaline or acidic compounds (e.g., KOH and HNO3)20,24 substantially increased the number of micropores but yielded limited mesopores. Another drawback of the chemical activation is its propensity to damage the fiber integrity. Steam is a milder activation agent than KOH and HNO3 for carbon fiber activation. The steam-activated carbon fibers showed a high specific surface area of 1230 m2 g−1 and a capacitance of 173 F g−1 at 10 mA g−1.18 Inorganic salts (e.g., ZnCl2 and SnCl2)14,19 and nanoparticles (e.g., SiO2)16,25,26 were also used as hard templates to generate mesopores, but they typically required highly corrosive and acutely toxic chemicals (e.g., HF) to remove the incorporated templates. Besides controlling the porous structure, doping carbon fibers with heteroatoms (e.g., oxygen, nitrogen, fluorine, and phosphorus)27,28 is effective in enhancing the capacitive performance, because the dopants introduce pseudocapacitance,21,22,29 improve charge mobility on carbon surfaces, and increase electrolyte wettability. However, high-temperature pyrolysis17 and chemical activations,1 which are necessary for producing carbon fibers with low electrical resistance and high surface area, largely reduce the number of the doped heteroatoms. To avoid the time-consuming and complicated post-synthesis processes and to preserve the fiber integrity, porous carbon fibers were prepared from polymer blends such as polyacrylonitrile (PAN) mixed with polymethyl methacrylate (PMMA).13,30 The mesopore volume is tunable by the ratio of the two polymers, but the control over the mesopore size and uniformity remains challenging.
Different from the previously reported porous carbon fibers with non-uniform pores, our recently developed block copolymer-derived porous carbon fibers contain uniform and interconnected mesopores and micropores.31 Briefly, as shown in Fig. 1, poly(acrylonitrile-block-methyl methacrylate) (PAN-b-PMMA) block copolymer was electrospun into fibers. The polymer fibers were thermally annealed and oxidized to form microphase-separated uniform PMMA domains in a PAN matrix. Subsequently, the fibers were subjected to pyrolysis to remove PMMA and generate uniform mesopores, while the PAN matrix was converted into porous carbon fibers. The resulting porous carbon fibers showed outstanding electrochemical energy storage capacitance as supercapacitor electrodes31 and as hosts for pseudocapacitive materials.32 However, the relationships of the pyrolysis temperature with the electrochemical properties are yet to be explored. It remains unknown how to utilize the processing conditions, in particular, pyrolysis temperature, to design porous carbon fibers with tunable properties, such as surface area, porous structures, electron/ion conductivity, and heteroatom doping levels. To address this question, here we systematically investigate the structural, chemical, and physical properties of block copolymer-based porous carbon fibers after pyrolysis at various temperatures (Fig. 1c). By simply tuning the pyrolysis temperature, we control the porosity, graphitic level, heteroatom doping level, and thus electrochemical performance of porous carbon fibers.
2. Experimental
2.1 Materials and preparation of porous carbon fibers
PAN-b-PMMA was synthesized by reversible addition–fragmentation chain transfer polymerization in dimethyl sulfoxide (DMSO) as a solvent, following our previously reported procedures.31 PAN-b-PMMA had a number average molecular weight of 111-b-62 kDa and a polydispersity index of 1.14. The block copolymer served as the precursor for synthesizing porous carbon fibers. N,N-Dimethylformamide (DMF; ≥99.7%) and DMSO (≥99.9%) were obtained from Sigma-Aldrich and used without further purification. The block copolymer precursor was dissolved in DMF (14 wt%). The solution was then electrospun into block copolymer fibers at a voltage of 18 kV, a feeding rate of 1.5 ml per hour, and a tip-to-collector distance of ∼20 cm. The as-spun fibers were transferred into a tube furnace, heated up at a rate of 1 °C min−1, and stabilized at 280 °C for 8 hours in the air. The stabilized fibers were again heated at a rate of 10 °C min−1 and pyrolyzed at various temperatures of 600 to 1200 °C for 1 hour under nitrogen. After carbonization, the resulting porous carbon fibers were used as electrodes in supercapacitors.2.2 Physical characterizations
The morphologies of the block copolymer and porous carbon fibers were characterized using scanning electron microscopy (SEM, LEO Zeiss 1550) and transmission electron microscopy (TEM, FEI Titan 300). All SEM images were collected at an accelerating voltage of 2 kV and a working distance of 2 to 4 mm. To prepare for TEM characterization, the porous carbon fibers were first dispersed in acetone and then drop-cast on a carbon grid (200 mesh). Bright-field TEM images were collected at an accelerating voltage of 300 kV. Small angle X-ray scattering (SAXS) measurements were performed under vacuum on a Bruker N8 Horizon (Cu Kα radiation, λ = 1.54 Å). The scattering intensities were recorded with a 2-dimensional VÅNTEC-500TM detector under a voltage of 50 kV and a current of 1 mA. The crystallographic structures of the porous carbon fibers were analyzed using a powder X-ray diffractometer (XRD, MiniFlex 600, Rigaku, Cu Kα radiation, λ = 1.54 Å). For XRD characterization, the porous carbon fibers were grounded into powder and mounted on an Al sample holder. Data were collected with a step size of 0.05° in a 2θ range of 10° to 80°. Raman spectra in the range of 1000 to 1800 cm−1 were collected using a WITec alpha500 Raman spectrometer in combination with a confocal Raman microscope. A 633 nm laser was used as the excitation source. To determine the specific surface areas and pore-size distributions of the porous carbon fibers, N2 and CO2 adsorption–desorption isotherms were collected at 77.4 and 273.2 K, respectively, using a Micromeritics-3Flex pore analyzer. The isotherms were used to calculate the surface areas using the Brunauer–Emmett–Teller (BET) method and the pore-size distribution using non-local density functional theory (NLDFT). The total and micropore surface areas were calculated based on the linear relative pressure range of P/P0 = 0.01 to 0.1. X-ray photoelectron spectroscopy (XPS) spectra were collected on a PHI VersaProbe III system with Al Kα X-ray radiation (hν = 1486.6 eV). Binding energies were calibrated using adventitious C 1s peak at 284.8 eV. The electrolyte contact angles of the porous carbon fiber mats were measured with an optical goniometer (KINO Industry Co. Ltd.). The fluid for the contact angle measurement was a 6 M KOH aqueous solution. The bulk resistivities of porous carbon fiber mats were determined using a four-point probe system (JANDEL RM3-AR) with a probe spacing of 0.1 cm.2.3 Electrochemical measurements
The supercapacitor electrodes consisted of porous carbon fibers sandwiched between two pieces of nickel foam. Prior to electrochemical measurements, the as-fabricated electrodes were soaked in a 6 M KOH aqueous electrolyte for 6 h to allow the infiltration of the electrolyte into porous carbon fibers. The mass loading of porous carbon fibers was at least 1 mg. All electrochemical experiments were conducted in a two-electrode configuration. Both electrochemical impedance spectroscopy (EIS) and cyclic voltammetry (CV) experiments were carried out on a PARSTAT 4000+ electrochemical workstation (Princeton Applied Research, AMETEK Inc.) at room temperature. The EIS data was collected in a frequency range from 100 kHz to 0.1 Hz with a perturbation of 10 mV. CV curves were obtained in a potential range of 0 to 0.8 V at 50 mV s−1. Galvanostatic charge and discharge (GCD) measurements of the supercapacitors were performed within the same potential range as CV by a battery test system (model 580, Scribner Associates Inc.). Gravimetric capacitances (C, F g−1) of supercapacitor electrodes derived from GCD curves were calculated according to the following formula:33,34 | (1) |
3. Results and discussion
3.1 Structures of porous carbon fibers
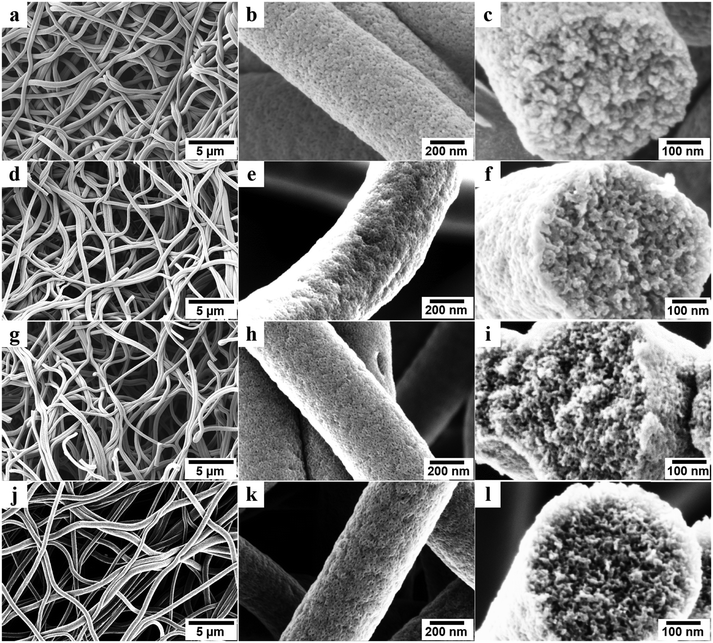
To prepare porous carbon fibers, PAN-b-PMMA was electrospun into fibers from a DMF solution at a concentration of 14 wt% (Fig. S1a†). The fibers had rough surfaces and their average diameter was about 900 nm (Fig. S1b†). Upon thermal annealing at 280 °C in air, the block copolymer formed microphase-separated PMMA domains in a matrix of PAN (Fig. S1c and d†). Subsequently, the block copolymer fibers were converted to porous carbon fibers via pyrolysis at various temperatures. The pyrolysis temperature played an important role in determining the structural, chemical, physical, and electrical properties of the porous carbon fibers. In our previous report,31 we have systematically investigated the morphologies of PAN-b-PMMA fibers after electrospinning, after oxidization, and after pyrolysis using small-angle X-ray scattering (SAXS) and fast Fourier transform (FFT). The results demonstrated that the as-electrospun PAN-b-PMMA fibers were devoid of any distinct features, while the oxidized fibers exhibited disorderly arranged PMMA domains in a PAN matrix. After pyrolysis, the block copolymer fibers preserved the microphase-separated morphology, but the domain size shrank.Scanning electron microscope (SEM) images revealed the structures of porous carbon fibers after pyrolysis (Fig. 2). The average diameter of the porous carbon fibers decreased from ∼900 to ∼520 nm after pyrolysis at 600 °C (Fig. 2a) and changed insignificantly as the pyrolysis temperature was increased (Fig. 2d, g, and j). The pyrolysis of PAN-b-PMMA is in agreement with the previous reports,35,36 where the PMMA block was fully decomposed and the weight loss of PAN was associated with its dehydrogenation and carbonization. As shown in the SEM images (Fig. 2b, e, h, and k), the pyrolysis in a temperature range of 600 to 1200 °C removed all the PMMA domains and produced uniform mesopores in the carbon fibers. All carbon fibers had rough surfaces and were intact even after pyrolysis at 1200 °C because of the high PAN volume fraction (64%) in the block copolymer.
Cross-sectional SEM images revealed the internal structures of the porous carbon fibers (Fig. 2c, f, i, and l). All porous carbon fibers had irregularly shaped but uniformly distributed mesopores. The internal interconnected mesopores penetrated through the entire carbon fibers. The formation of the interconnected porous structure is attributed to the poor ordering of PAN-b-PMMA into well-defined cylindrical or gyroidal structures, as well as the stabilization and crosslinking of PAN upon thermal annealing.1,37,38 According to the previous reports,14,23,35,36 thermal annealing at 280 °C in air stabilized PAN and converted it to cyclized network structures, which reduced the polymer chain mobility and resulted in a bicontinuous disordered structure throughout the fibers.1,36–40 As shown in our previous report,31 the highly interconnected porous structure is favorable for effective ion diffusion41,42 and may show exceptional electrochemical energy storage performance.43
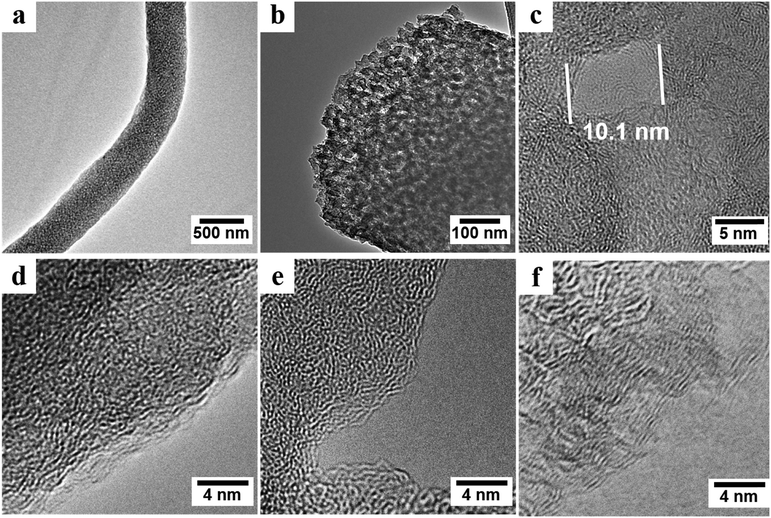
High-resolution transmission electron microscopy (HRTEM) confirmed the removal of PMMA and the conversion of PAN-b-PMMA into porous carbon fibers after pyrolysis (Fig. 3). The porous carbon fibers had a large number of interconnected mesopores, as shown by the gray channels in Fig. 3a and b. A typical mesopore showed a pore size of ∼10 nm and each pore was surrounded by layers of carbon (Fig. 3c). In supercapacitor electrodes, such porous carbon structures are favorable because the mesopores not only act as ion buffering reservoirs but also shorten the pathways for ions to diffuse from the mesopores to the micropores.7,44,45 Noteworthy, after pyrolysis at 800 °C, the layered carbon structure began to form inside and on the edges of the carbon fibers, but overall the carbon structure was disordered and randomly curled (Fig. 3c and d).46 After pyrolysis at 1000 °C, the carbon structure changed from amorphous to slightly graphitic (Fig. 3e). As the pyrolysis temperature was further increased to 1200 °C (Fig. 3f), the carbon exhibited aligned lattice fringes at the edge of the carbon fibers. The high pyrolysis temperatures led to the graphitic carbon and thus improved electrical conductivity (Fig. 8e).47 The carbon structure is expected to be increasingly ordered when the pyrolysis temperature is further increased,47,48 according to the previous reports on carbon fibers derived from PAN.47,49,50
3.2 Mesopore spacing and graphitic structure
Small angle X-ray scattering (SAXS) was used to investigate the changes in the mesoporous structures (Fig. 4a). All SAXS spectra of the porous carbon fibers showed broad peaks rather than sharp and distinct peaks, indicating that the structures lacked a high degree of order due to the crosslinking of PAN. Because PAN was crosslinked and formed cyclized structures during thermal annealing, the block copolymer could not form well-defined structures such as cylinders or gyroids. The broad peaks suggest that the center-to-center spacings of the mesopores have relatively wide distributions.1,51 Based on the ranges of the characteristic scattering peaks, we estimated the ranges of the center-to-center spacings in all porous carbon fibers (Table 1). The mesopore spacing decreased from the range of 25–33 nm to the range of 21–27 nm, as the pyrolysis temperature was increased from 600 to 1200 °C. In the high wave vector (q) range, the scattering intensity (I) and q followed the Porod's law,52i.e., I ∼ qx. The power-law index (x) increased continuously from −3.86 to −3.02 when the pyrolysis temperature was increased from 600 to 1200 °C, indicating that the surfaces of the porous carbon fibers became increasingly fractal and rough.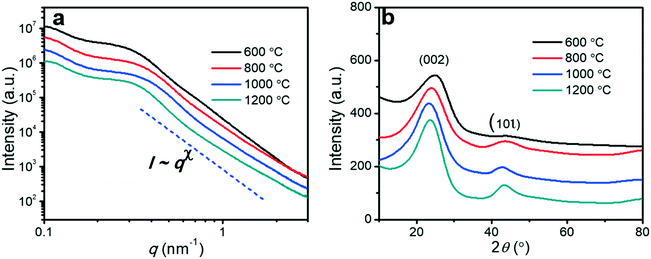 | ||
| Fig. 4 (a) SAXS spectra of the porous carbon fibers after pyrolysis at various temperatures. (b) XRD profiles of the porous carbon fibers after pyrolysis at various temperatures. The diffraction peaks at ∼24° and ∼43° were assigned to the crystallographic carbon planes (002) and (10ι), respectively.1 The carbon fibers showed broad (002) and (10ι) peaks. | ||
| Pyrolysis temperature | β (002) (radian) | β (10ι) (radian) | d 002 (nm) | L a (nm) | L c (nm) | x | q * (nm−1) | d cc (nm) |
|---|---|---|---|---|---|---|---|---|
| Note: La: lateral size; Lc: crystallite size; d002: interplanar spacing of the (002) planes; x: the power index of Porod's law, I ∼ qx; q*: characteristic wave vector of small angle X-ray scattering; dcc: center-to-center spacing based on dcc = 2π/q*. | ||||||||
| 600 °C | 0.26 | 0.28 | 0.36 | 1.10 | 0.53 | −3.86 | 0.19–0.25 | 33–25 |
| 800 °C | 0.14 | 0.11 | 0.37 | 2.73 | 0.98 | −3.43 | 0.22–0.31 | 29–20 |
| 1000 °C | 0.13 | 0.08 | 0.38 | 4.05 | 1.06 | −3.22 | 0.23–0.30 | 27–21 |
| 1200 °C | 0.10 | 0.08 | 0.38 | 3.64 | 1.36 | −3.02 | 0.23–0.30 | 27–21 |
The effect of pyrolysis temperature on the graphitic structure of the porous carbon fibers was further corroborated by powder X-ray diffraction (XRD) (Fig. 4b). The diffraction peaks at ∼24° and ∼43° were assigned to the crystallographic planes of carbon (002) and (10ι), respectively.1 The (10ι) referred to the overlapping diffraction peaks (100) and (101).53 The carbon fibers after pyrolysis at 600 °C exhibited a broad and weak diffraction (002) peak at ∼24° but no apparent peaks at ∼43°, suggesting that the carbon fibers only had a low degree of graphitization and crystallinity. When the pyrolysis temperature was increased to 800 °C, the diffraction (002) peak became sharp, and a broad diffraction (10ι) peak appeared, indicating an increasing degree of graphitization. As the pyrolysis temperature was increased, the peaks became stronger and their full-width half-maximum (FWHM) decreased (Table 1). The angle (θ, in radians) of (002) peak was used to calculate the interplanar spacing (d002) according to Bragg's law (eqn (2)), while the FWHM values (β, in radians) of (10ι) and (002) peaks were used to calculate the lateral size (La) and the crystallite size (Lc), respectively, according to Debye–Scherrer equation (eqn (3) and (4)).54,55
d002 = λ/2![[thin space (1/6-em)]](https://www.rsc.org/images/entities/char_2009.gif) sin sin![[thin space (1/6-em)]](https://www.rsc.org/images/entities/char_2009.gif) θ θ | (2) |
 | (3) |
 | (4) |
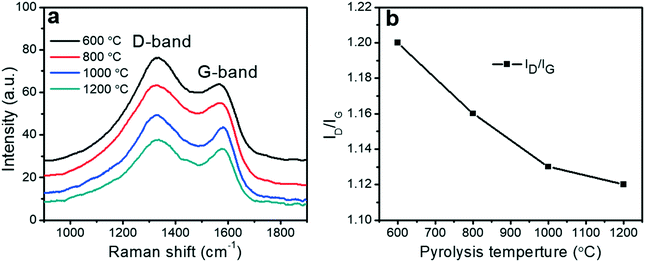
Raman spectroscopy provided information about the degree of graphitization of the porous carbon fibers. Raman spectra of all porous carbon fibers revealed two distinct peaks at ∼1560 to 1600 cm−1 (“G-band”) and at ∼1310 to 1350 cm−1 (“D-band”), corresponding to the ordered graphitic structures and disordered domains, respectively59 (Fig. 5a). The calculated intensity ratio of “D-band” to “G-band” (ID/IG) was summarized in Fig. 5b. The intensity ratio (ID/IG) decreased with the pyrolysis temperature, indicating that the disordered domains transformed to increasingly ordered graphitic structures. Among the conditions tested here, the porous carbon fibers after pyrolysis at 1200 °C had the highest graphitic level, in agreement with the high-resolution TEM images that showed the largest amount of layered carbon. The high pyrolysis temperature led to ordered graphitic structures and orientated crystallites along the fiber axis.49
3.3 Porosity analyses
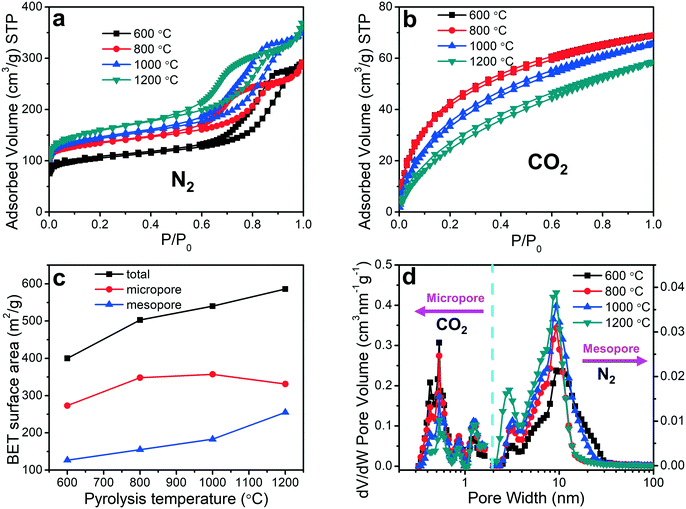
The pore sizes and surface areas of the porous carbon fibers were characterized by adsorption–desorption isotherms using both nitrogen at 77.4 K (Fig. 6a) and carbon dioxide at 273.2 K (Fig. 6b). The porous carbon fibers after pyrolysis at 1200 °C had the highest total Brunauer–Emmett–Teller (BET) surface area of 586 m2 g−1 and the largest total pore volume of 0.570 cm3 g−1 (Fig. 6c and Table 2), which are attributed to the well-developed porous structures and the removal of the heteroatoms. The heteroatoms were removed as gases such as N2, H2, NH3, H2O, HCN, and CO2,60 and the loss of these volatile gases was known to enhance the surface areas.61 Specifically, the mesopore surface area increased monotonically with the increasing pyrolysis temperature (Fig. 6c and Table 2), but the micropore surface area peaked at 1000 °C (Table 2). The mesopore volume increased from 0.310 cm3 g−1 at 800 °C (69% of total pores) to 0.437 cm3 g−1 at 1200 °C (77% of total pores). The micropore volume decreased from 0.140 cm3 g−1 at 800 °C (31% of total pores) to 0.134 cm3 g−1 at 1200 °C (23% of total pores). The decreasing micropore volume agreed with the increasing graphitic level, which was resulted from a decreasing number of defective carbon structures and annulation of the micropores. The small micropore volume at 600 °C is attributed to the low loss of heteroatoms.| Pyrolysis temperature | S BET (m2 g−1) | S micro (m2 g−1) | S meso (m2 g−1) | V total pore (cm3 g−1) | V micropore (cm3 g−1) | V mesopore (cm3 g−1) |
|---|---|---|---|---|---|---|
| 600 °C | 400 | 273 | 127 | 0.451 | 0.103 | 0.348 |
| 800 °C | 503 | 348 | 155 | 0.450 | 0.140 | 0.310 |
| 1000 °C | 540 | 357 | 183 | 0.546 | 0.139 | 0.407 |
| 1200 °C | 586 | 331 | 255 | 0.570 | 0.134 | 0.437 |
The pore size distributions of the micropores and mesopores were evaluated based on the CO2 and N2 adsorption isotherms, respectively, using non-local density functional theory (Fig. 6d). The mesopore size decreased slightly from 10.1 to 9.3 nm when the pyrolysis temperature was increased from 600 to 800 °C, but it did not change significantly above 800 °C (Fig. 6d). The micropore size distributions, however, exhibited different behaviors. Regardless of the pyrolysis temperature, multiple peaks showed up and all the peak positions remained unchanged. Interestingly, the volume of the micropores with less than 1 nm in pore width decreased with the increasing pyrolysis temperature, but that of the micropores larger than 1 nm showed an opposite trend.
3.4 Nitrogen and oxygen heteroatoms
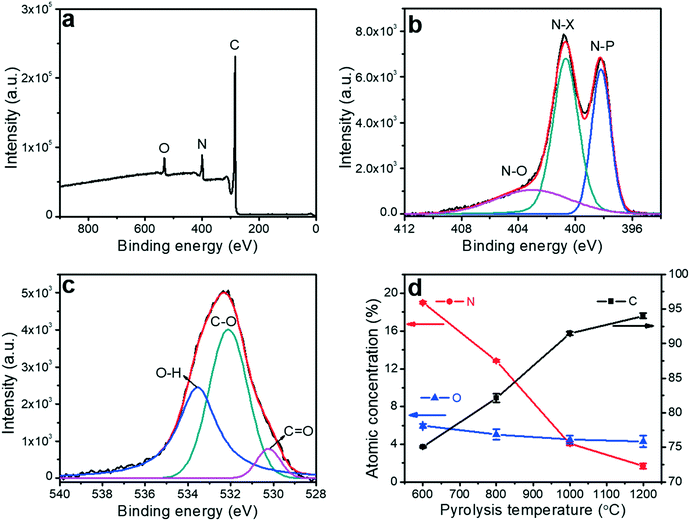
X-ray photoelectron spectroscopy (XPS) was utilized to analyze the impact of the pyrolysis temperature on the chemical composition of the porous carbon fibers, which confirmed the removal of the heteroatoms. XPS survey exhibited three peaks at ∼533.1, 401.0 and 284.8 eV corresponding to O 1s, N 1s, and C 1s, respectively (Fig. 7 and S2 to S5†). No sulfur peaks were observed indicating that the sulfur-containing end-groups in PAN-b-PMMA were completely removed by homolytic cleavage of C–S bonds during pyrolysis.62 The N 1s spectrum was deconvoluted to three peaks at 398.1, 400.4 and 403.2 eV (Fig. 7b and S3†), corresponding to pyridinic nitrogen (N–P), pyridonic/pyrrolic nitrogen (N–X), and pyridine oxide (N–O), respectively.63 As the pyrolysis temperature was increased to 800 °C (Fig. S3b†), the N–P peak was weaker than the N–X peak, and the latter became dominant. At higher pyrolysis temperatures, the N–P peak continued weakening and almost disappeared at 1200 °C (Fig. S3d†). Additionally, the atomic concentrations of N–P, N–X, and N–O groups all decreased with the increasing pyrolysis temperature (Fig. S6†). The increasing pyrolysis temperature contributed to further carbonization of the precursor and graphitization of the carbon, resulting in reduced contents of nitrogen and oxygen. Most nitrogen and oxygen were released as gaseous N2, NH3, H2O, and CO2, which induced the formation of a large number of micropores. Elemental analysis (Table S2†) based on XPS showed that the atomic percentage of nitrogen decreased from 19.0% to 1.7% and oxygen from 6.0% to 4.3%, as the pyrolysis temperature was increased from 600 to 1200 °C (Fig. 7d).The optimization of the heteroatom contents in the porous carbon fibers is crucial for improving the supercapacitor performance. Previous reports show that heteroatoms enhance the mobility of negative charges on carbon materials.1,22 The surface heteroatoms also act as active pseudocapacitive sites and lead to enhanced electrochemical performance. In addition to the charge mobility, we have analyzed electrolyte wettability of the porous carbon fibers by measuring the contact angles. After pyrolysis of the polymer fibers at 600 °C, 800 °C, and 1000 °C, aliquots of 6 M KOH aqueous solution were dispensed and completely spread on the resulting porous carbon fiber mats (Fig. S7a to c†). However, on the mat of the porous carbon fibers after pyrolysis at 1200 °C, the contact angle was ∼92° (Fig. S7d†). The large contact angle is attributed to the absence of nitrogen and oxygen heteroatoms and the high graphitic level of the carbons.
3.5 Electron and ion transport
Electrochemical impedance spectroscopy (EIS) is a principal method for evaluating the capacitive behaviors of electrode materials, such as resistivity, ion transport, and electron transport. The EIS measurements can (i) elucidate the kinetics at the interface between the porous carbon fibers and the electrolyte, (ii) acquire insight into the effect of pyrolysis temperature on the capacitive and resistive elements, and (iii) characterize the contributions of porous structures and heteroatoms to the overall capacitance. Fig. 8a shows the Nyquist plots of the porous carbon fibers after pyrolysis at various temperatures. Except the porous carbon fibers pyrolyzed at 600 °C, most carbon fibers featured nearly vertical lines in the low-frequency region, indicating nearly ideal capacitive behaviours. Compared to the porous carbon fibers pyrolyzed at low temperatures, the porous carbon fibers at high temperatures had high graphitic levels and thus efficient electron transport in the electrode. Meanwhile, the large pore volumes also facilitated ion transport. In the high-frequency region, all porous carbon fibers after pyrolysis at 800 °C and above showed semicircles. The semicircle describes the impedance of electrochemical reactions associated with charge transfer on the porous carbon fibers. A small semicircle means a small charge transfer resistance (Rct). Among the porous carbon fibers after pyrolysis at 800 °C, 1000 °C and 1200 °C, the porous carbon fibers after pyrolysis at 800 °C showed the smallest semicircle, suggesting the lowest Rct (Fig. 8e and Table 3). The low charge transfer resistance was attributed to the high densities of electrochemically active functional groups (i.e., nitrogen and oxygen heteroatoms) on the carbon surfaces. In addition, these heteroatoms provided negative charges to attract oppositely charged ions to the carbon surfaces, further facilitating the charge transfer process. Due to a large bulk resistivity, the porous carbon fibers after pyrolysis at 600 °C showed no small semicircle in the high-frequency region (Fig. 8a inset).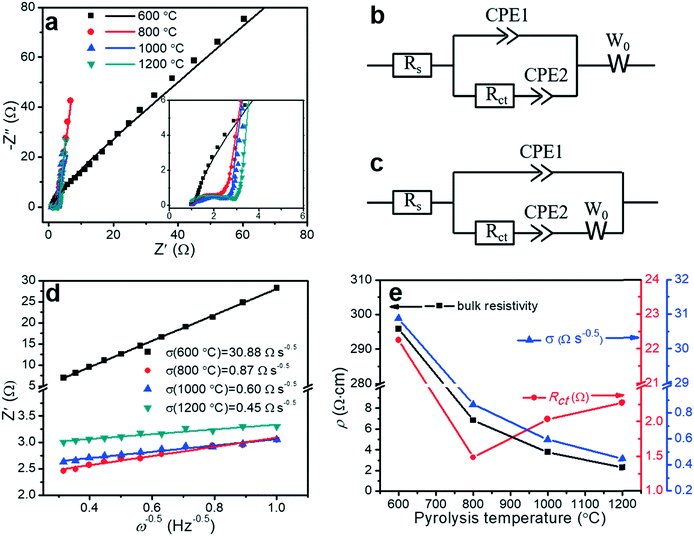 | ||
| Fig. 8 Electrochemical characterization of porous carbon fibers. (a) Nyquist plots in a frequency range between 100 kHz and 0.1 Hz with a perturbation of 10 mV. The inset displays the middle- and high-frequency ranges. The solid symbols are experimental data and the lines are the best fitting curves. (b and c) Equivalent circuit models2 for fitting the Nyquist plots of the porous carbon fibers that were carbonized at (b) 800 °C, 1000 °C, and 1200 °C, and (c) 600 °C. Rs: equivalent series resistance (ESR) of the cells combining the electrolyte resistance, internal resistance of electrodes, and interface resistance between the electrode and current collector. Rct: charge transfer resistance associated with the faradic reactions of N and O heteroatoms on the carbon surface. CPE1: constant phase element representing the electrochemical double-layer capacitance at the interfaces of electrode and electrolyte; CPE2: constant phase element of the faradic reaction. W0: Warburg impedance, representing the ion diffusion resistance. Constant phase elements instead of ideal capacitors are used because of the inhomogeneities of porous electrode surfaces in electrochemical capacitors.11 (d) Linear regression on the real part of impedance (Z′) versus the −1/2 power of angular frequency (ω−0.5) in the frequency range of 1–10 Hz. (e) Bulk resistivity (ρ), charge transfer resistance (Rct) and ion diffusion resistance (σ) as a function of the pyrolysis temperature. | ||
| Pyrolysis temperature | R s (Ω) | R ct (Ω) | σ (Ω s−0.5) | ρ (Ω cm) |
|---|---|---|---|---|
| 600 °C | 1.04 | 22.26 | 30.88 | 295.79 ± 7.12 |
| 800 °C | 1.00 | 1.49 | 0.87 | 6.83 ± 0.27 |
| 1000 °C | 0.96 | 2.04 | 0.60 | 3.79 ± 0.11 |
| 1200 °C | 0.76 | 2.28 | 0.45 | 2.28 ± 0.10 |
Taking into account the electrochemical reactions of the heteroatoms, the Nyquist plots were fitted by two equivalent circuit models with a set of resistors and capacitors in series or parallel (Fig. 8b and c). In a typical charge–discharge cycle, three ion/electron transport processes determine the electrochemical properties of the porous carbon fibers: (i) charge transport in the electrodes (defined by the series resistance, Rs), (ii) charge transfer involving faradic active sites of N and O heteroatoms (defined by the charge transfer resistance, Rct), and (iii) ion diffusion (defined by the Warburg diffusion coefficient, W0). The only difference between the two models is the arrangement of W0. For the porous carbon fibers produced by pyrolysis at 800 °C, 1000 °C, and 1200 °C, the Nyquist plots were well fitted by the equivalent circuit model in Fig. 8b. In this circuit model, W0 was connected in series with both CPE1 and CPE2, indicating that ion diffusion affected both the electrical double layer capacitive (CPE1) and pseudocapacitive (CPE2) processes.2 The Nyquist plot of the porous carbon fibers obtained at 600 °C, however, could not be fitted using the same model. Differently, W0 was connected in series with CPE2 only, and the ion diffusion affected primarily the pseudocapacitive reactions and little the double-layer capacitance (Fig. 8c). Because of a high bulk resistivity (295.79 Ω cm, Table 3), the electrical resistivity dominated and W0 became insignificant in the double-layer capacitive process (CPE1). In the pseudocapacitive process (CPE2), the ion diffusion resistance and charge transfer resistance were comparable,2 and W0 was connected in series with Rct and CPE2. In other words, in the porous carbon fibers pyrolyzed at 600 °C, the poor electrical conductivity greatly impeded the electron transport and thus the ion diffusion has a negligible effect on CPE1. In other porous carbon fibers, the electron transport was so efficient thanks to the high electrical conductivities, and thus the ion diffusion became significant.
The Warburg element (W0) is associated with the transition from the high- to the middle-frequency regions in the Nyquist plot.64 In this transition region, the Nyquist plots showed Warburg diffusion lines with a slope of ∼1, and these lines indicated the resistances of electrolyte ions to diffuse in the electrodes. A short Warburg line corresponds to a high ion diffusion efficiency.10 In the frequency range of 1 to 10 Hz, the real resistance (Z′) was linear to the −1/2 power of the angular frequency (ω−0.5), and the slope represented the ion diffusion resistance (σ) (Fig. 8d).65 The interconnected mesopores served as ion reservoirs and significantly shortened the ion diffusion distances, and thus reduced the ion diffusion resistance. When the pyrolysis temperature was increased, the mesopore volume increased as evidenced by the adsorption–desorption isotherms (Fig. 6 and Table 2). As a result, the ion diffusion resistance decreased accordingly (Fig. 8e). Similarly, the bulk resistivity decreased with the increasing pyrolysis temperature. The decrease in the bulk resistivity was mainly attributed to the increasing graphitic level (Fig. 3 and 5) and graphitic domain size (Fig. 4b and Table 1). After pyrolysis at 1200 °C, the porous carbon fibers had the lowest ion diffusion resistance of 0.45 Ω s−0.5 and bulk resistivity of 2.28 Ω cm. The low ion diffusion resistance and bulk resistivity are crucial for high rate capability of the porous carbon fibers as supercapacitor electrodes.
3.6 Performance as supercapacitor electrodes
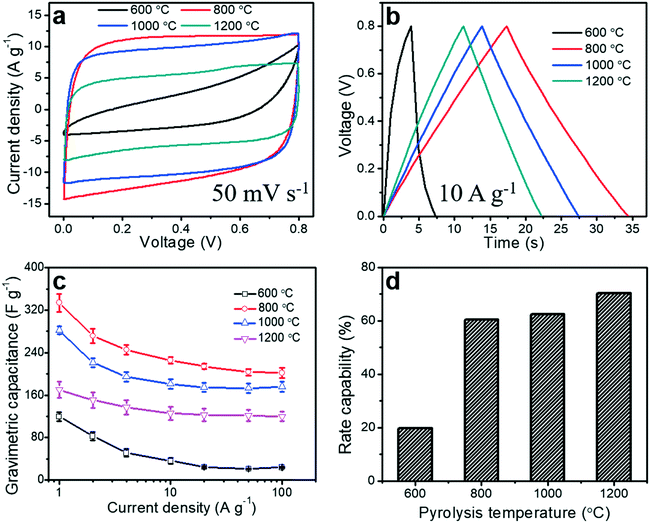
To evaluate the electrochemical performance of the porous carbon fibers as supercapacitor electrodes, we conducted cyclic voltammetry (CV) measurements. CV curves were obtained in a voltage window of 0 to 0.8 V at a scan rate of 50 mV s−1 (Fig. 9a). Most of the porous carbon fibers exhibited nearly rectangular CV curves (Fig. 9a), indicating a nearly ideal capacitive behaviour and efficient electrolyte ion transport throughout the porous carbon fibers, except the carbon fibers pyrolyzed at 600 °C. The carbon fibers pyrolyzed at 600 °C exhibited a distorted CV curve, suggesting a relatively large resistance and inefficiency of electrolyte ions to reach the internal carbon surfaces. This large resistance was a combination of the large bulk resistance, charge transfer resistance, and ion diffusion resistance (Fig. 8 and Table 3). The CV curves of the porous carbon fibers after pyrolysis at 800 °C encircled the largest area, suggesting the highest specific capacitance. This largest capacitance is because of its well-balanced porous structures, relatively rich heteroatoms, and low charge transfer resistance. As the pyrolysis temperature was increased from 800 to 1200 °C, the encircled area decreased, largely due to the reduced pseudocapacitance from the decreasing numbers of nitrogen and oxygen heteroatoms (Fig. 7 and Table S2†). The galvanostatic charge and discharge (GCD) profiles of all the porous carbon fibers were asymmetric at a current density of 1 A g−1 (Fig. S8†), because of the existence of irreversible electrochemical reactions. As the pyrolysis temperature was increased, the GCD profiles of the porous carbon fibers became increasingly symmetric and showed a triangular shape, which is suggestive of either fast charge/discharge kinetics or a decreasing portion of pseudocapacitance. The GCD curves of the porous carbon fibers pyrolyzed at 800–1200 °C showed symmetric triangular shapes at a high current density of 10 A g−1 (Fig. 9b), indicating excellent coulombic efficiencies owing to low ion diffusion and charge transfer resistances. The low ion diffusion resistance and charge transfer resistance also helped with the rate capability of porous carbon fibers at high current densities. In particular, the porous carbon fibers pyrolyzed at 800 °C exhibited the longest discharging time and thus the highest gravimetric capacitance, in agreement with the CV analysis.Gravimetric capacitances of all porous carbon fibers at various current densities ranging from 1 to 100 A g−1 were calculated according to eqn (1) and summarized in Fig. 9c. At 1 A g−1, the gravimetric capacitance of the porous carbon fibers pyrolyzed at 800 °C was 334 F g−1, which was much higher than that of the porous carbon fibers pyrolyzed at 1000 °C (282 F g−1) and nearly twice that of the porous carbon fibers pyrolyzed at 1200 °C (170 F g−1). As the pyrolysis temperature was increased from 800 °C to 1200 °C, the gravimetric capacitance decreased by ∼49% at 1 A g−1, although the specific surface area increased by 14%, that is, from 503 to 586 m2 g−1. The decreasing capacitance is attributed to the reduced pseudocapacitance associated with the decreasing amounts of nitrogen and oxygen heteroatoms.66
Lastly, an ideal supercapacitor should have a high rate capability. As the current density was increased from 1 to 100 A g−1, the gravimetric capacitances of all porous carbon fibers decreased (Fig. 9c), due to the limited time for ion diffusion inside the micropores. With a large ion diffusion resistance, porous carbon fibers pyrolyzed at 600 °C showed the poorest rate capability of ∼20% (Fig. 9d). As the pyrolysis temperature was increased to 800 °C, porous carbon fibers showed an improved rate capability of ∼60%. After pyrolysis at 1200 °C, porous carbon fibers had the lowest ion diffusion resistance and the highest rate capability of ∼70% (Fig. 9d). Additionally, the porous carbon fibers pyrolyzed at 800, 1000, and 1200 °C exhibited excellent cyclic stability, retaining more than 98% of the initial capacitances after 5000 charge–discharge cycles at a high current density of 100 A g−1 (Fig. S9†). SEM confirmed that the porous structures in the carbon fibers were well preserved after 5000 cycles (Fig. S10†).
4. Conclusions
In summary, the pyrolysis temperature of PAN-b-PMMA governed the porosity, graphitic level, heteroatom content, and electron/ion conductivity of porous carbon fibers. After pyrolysis, the microphase-separated PMMA domains were removed and the PAN matrix formed porous carbon fibers with highly interconnected uniform mesopores. Increasing pyrolysis temperature from 600 to 1200 °C did not notably change the shape of porous carbon fibers, interplanar spacing of internal carbon layers, and multi-modal micropore sizes, but increased the surface area, pore volume, and graphitic level. The graphitic level and graphitic crystalline size increased because the disordered carbon transformed to ordered graphitic carbon. On the contrary, the mesopore size, mesopore center-to-center spacing, and heteroatom doping levels (both nitrogen and oxygen) decreased with the increasing pyrolysis temperature.We also characterized the electrochemical properties of porous carbon fibers in binder-free and conductive additive-free supercapacitors. Bulk resistivity and ion diffusion resistance decreased with increasing pyrolysis temperatures because of the increasing graphitic level and pore volume, respectively. After pyrolysis at 600 °C, the porous carbon fibers had the lowest capacitance and the poorest rate capability due to their poor electrical conductivity. After pyrolysis at 800 °C, the porous carbon fibers exhibited an optimal gravimetric capacitance, owing to the balanced structural, chemical, physical, and electrical properties, such as well-defined porous structures, relatively rich heteroatoms, low charge transfer resistance, and high electron and ion conductivities. After pyrolysis at 1200 °C, the porous carbon fibers had the lowest bulk resistivity and ion diffusion resistance, thus they exhibited the highest rate capability as supercapacitor electrodes.
Our systematic study elucidates the correlations between the block copolymer pyrolysis temperature and the porous carbon fiber porosity, graphitic level, heteroatom content, and conductivity. The findings herein are important for designing the porous carbon fibers for electrochemical energy conversion and storage, catalysis, separation, and filtration. We anticipate to further enhance the electrochemical energy storage performances of block copolymer-based porous carbon fibers by rationally designing block copolymer precursors (tunable parameters include molecular weight, volume fraction, and composition), improving the carbon fiber properties (such as surface area, porosity, and heteroatom content), and optimizing the device components (such as electrolytes). In addition, the stabilization temperature and time could also play a role in determining the structural and physical properties of the block copolymer-based porous carbon fibers, such as the pore size, pore size distribution, doping, carbon crystallinity, and so on. Future studies are needed to fully elucidate the correlations among the stabilization conditions (e.g., temperature, time, and possibly pressure), structural evolution, physical properties, and electrochemical performance of the block copolymer-based porous carbon fibers.
Conflicts of interest
There are no conflicts to declare.Acknowledgements
We acknowledge the use of facilities in the Institute for Critical Technology and Applied Science (ICTAS), Virginia Tech. We appreciate Dr. Stephen M. Martin for providing access to the SAXS characterization and the Surface Analysis Laboratory at Virginia Tech for XPS acquisition. Funding: this material is based upon work supported by the Air Force Office of Scientific Research under award number FA9550-17-1-0112 through the Young Investigator Program. The access of XPS instrument in Surface Analysis Laboratory is supported by the National Science Foundation under Grant No. CHE-1531834.References
- M. Zhong, E. K. Kim, J. P. McGann, S.-E. Chun, J. F. Whitacre, M. Jaroniec, K. Matyjaszewski and T. Kowalewski, J. Am. Chem. Soc., 2012, 134, 14846–14857 CrossRef CAS PubMed.
- J. Kang, J. Wen, S. H. Jayaram, A. Yu and X. Wang, Electrochim. Acta, 2014, 115, 587–598 CrossRef CAS.
- M. Inagaki, Y. Yang and F. Kang, Adv. Mater., 2012, 24, 2547–2566 CrossRef CAS PubMed.
- L. Hao, X. Li and L. Zhi, Adv. Mater., 2013, 25, 3899–3904 CrossRef CAS.
- S. M. Bhaway, Y.-M. Chen, Y. Guo, P. Tangvijitsakul, M. D. Soucek, M. Cakmak, Y. Zhu and B. D. Vogt, ACS Appl. Mater. Interfaces, 2016, 8, 19484–19493 CrossRef CAS PubMed.
- M. MInus and S. Kumar, JOM, 2005, 57, 52–58 CrossRef CAS.
- M. Salanne, B. Rotenberg, K. Naoi, K. Kaneko, P. L. Taberna, C. P. Grey, B. Dunn and P. Simon, Nat. Energy, 2016, 1, 16070 CrossRef CAS.
- X. Lang, A. Hirata, T. Fujita and M. Chen, Nat. Nanotechnol., 2011, 6, 232 CrossRef CAS PubMed.
- L.-Q. Mai, A. Minhas-Khan, X. Tian, K. M. Hercule, Y.-L. Zhao, X. Lin and X. Xu, Nat. Commun., 2013, 4, 2923 CrossRef.
- M. D. Stoller, S. Park, Y. Zhu, J. An and R. S. Ruoff, Nano Lett., 2008, 8, 3498–3502 CrossRef CAS PubMed.
- J. Bisquert, Phys. Chem. Chem. Phys., 2000, 2, 4185–4192 RSC.
- X. Lu, C. Wang, F. Favier and N. Pinna, Adv. Energy Mater., 2017, 7, 1601301 CrossRef.
- C. Kim, Y. I. Jeong, B. T. N. Ngoc, K. S. Yang, M. Kojima, Y. A. Kim, M. Endo and J.-W. Lee, Small, 2007, 3, 91–95 CrossRef CAS PubMed.
- G.-H. An and H.-J. Ahn, Carbon, 2013, 65, 87–96 CrossRef CAS.
- Y. Sun, R. B. Sills, X. Hu, Z. W. Seh, X. Xiao, H. Xu, W. Luo, H. Jin, Y. Xin, T. Li, Z. Zhang, J. Zhou, W. Cai, Y. Huang and Y. Cui, Nano Lett., 2015, 15, 3899–3906 CrossRef CAS.
- D. Lee, J.-Y. Jung, M.-J. Jung and Y.-S. Lee, Chem. Eng. J., 2015, 263, 62–70 CrossRef CAS.
- E. J. Ra, E. Raymundo-Piñero, Y. H. Lee and F. Béguin, Carbon, 2009, 47, 2984–2992 CrossRef CAS.
- C. Kim and K. S. Yang, Appl. Phys. Lett., 2003, 83, 1216–1218 CrossRef CAS.
- C. Kim, B. T. N. Ngoc, K. S. Yang, M. Kojima, Y. A. Kim, Y. J. Kim, M. Endo and S. C. Yang, Adv. Mater., 2007, 19, 2341–2346 CrossRef CAS.
- T. Le, Y. Yang, Z. Huang and F. Kang, J. Power Sources, 2015, 278, 683–692 CrossRef CAS.
- L.-F. Chen, X.-D. Zhang, H.-W. Liang, M. Kong, Q.-F. Guan, P. Chen, Z.-Y. Wu and S.-H. Yu, ACS Nano, 2012, 6, 7092–7102 CrossRef CAS PubMed.
- J. Zhou, J. Lian, L. Hou, J. Zhang, H. Gou, M. Xia, Y. Zhao, T. A. Strobel, L. Tao and F. Gao, Nat. Commun., 2015, 6, 8503 CrossRef CAS PubMed.
- E. Raymundo-Piñero, F. Leroux and F. Béguin, Adv. Mater., 2006, 18, 1877–1882 CrossRef.
- Y. Dong, H. Lin, D. Zhou, H. Niu, Q. Jin and F. Qu, Electrochim. Acta, 2015, 159, 116–123 CrossRef CAS.
- L. Ji, Z. Lin, A. J. Medford and X. Zhang, Carbon, 2009, 47, 3346–3354 CrossRef CAS.
- X. Huang, L.-J. Zhou, D. Voiry, M. Chhowalla, X. Zou and T. Asefa, ACS Appl. Mater. Interfaces, 2016, 8, 18891–18903 CrossRef CAS.
- Y. Meng, D. Voiry, A. Goswami, X. Zou, X. Huang, M. Chhowalla, Z. Liu and T. Asefa, J. Am. Chem. Soc., 2014, 136, 13554–13557 CrossRef CAS PubMed.
- Z. Qiang, Y.-M. Chen, Y. Xia, W. Liang, Y. Zhu and B. D. Vogt, Nano Energy, 2017, 32, 59–66 CrossRef CAS.
- X. Yang, D. Wu, X. Chen and R. Fu, J. Phys. Chem. C, 2010, 114, 8581–8586 CrossRef CAS.
- Y. Yu, L. Gu, C. Zhu, P. A. van Aken and J. Maier, J. Am. Chem. Soc., 2009, 131, 15984–15985 CrossRef CAS.
- Z. Zhou, T. Liu, A. U. Khan and G. Liu, Sci. Adv., 2019, 5, eaau6852 CrossRef.
- T. Liu, Z. Zhou, Y. Guo, D. Guo and G. Liu, Nat. Commun., 2019, 10, 675 CrossRef.
- M. D. Stoller and R. S. Ruoff, Energy Environ. Sci., 2010, 3, 1294–1301 RSC.
- C. Zhong, Y. Deng, W. Hu, J. Qiao, L. Zhang and J. Zhang, Chem. Soc. Rev., 2015, 44, 7484–7539 RSC.
- Z. Zhou and G. Liu, Small, 2017, 13, 1603107 CrossRef.
- K. Yan, L.-B. Kong, Y.-H. Dai, M. Shi, K.-W. Shen, B. Hu, Y.-C. Luo and L. Kang, J. Mater. Chem. A, 2015, 3, 22781–22793 RSC.
- J. M. Leiston-Belanger, J. Penelle and T. P. Russell, Macromolecules, 2006, 39, 1766–1770 CrossRef CAS.
- M. Lazzari, D. Scalarone, C. Vazquez-Vazquez and M. A. López-Quintela, Macromol. Rapid Commun., 2008, 29, 352–357 CrossRef CAS.
- F. Ran, K. Shen, Y. Tan, B. Peng, S. Chen, W. Zhang, X. Niu, L. Kong and L. Kang, J. Membr. Sci., 2016, 514, 366–375 CrossRef CAS.
- J. Bae, S. J. Park, O. S. Kwon and J. Jang, Chem. Commun., 2013, 49, 5456–5458 RSC.
- M. Sevilla and A. B. Fuertes, ACS Nano, 2014, 8, 5069–5078 CrossRef CAS PubMed.
- S. Dutta, A. Bhaumik and K. C. W. Wu, Energy Environ. Sci., 2014, 7, 3574–3592 RSC.
- C. G. Arges, Y. Kambe, H. S. Suh, L. E. Ocola and P. F. Nealey, Chem. Mater., 2016, 28, 1377–1389 CrossRef CAS.
- P. Simon and Y. Gogotsi, Nat. Mater., 2008, 7, 845 CrossRef CAS.
- A. C. Forse, J. M. Griffin, C. Merlet, J. Carretero-Gonzalez, A.-R. O. Raji, N. M. Trease and C. P. Grey, Nat. Energy, 2017, 2, 16216 CrossRef.
- M. Ghazinejad, S. Holmberg, O. Pilloni, L. Oropeza-Ramos and M. Madou, Sci. Rep., 2017, 7, 16551 CrossRef.
- M. S. A. Rahaman, A. F. Ismail and A. Mustafa, Polym. Degrad. Stab., 2007, 92, 1421–1432 CrossRef CAS.
- J. Xiao, F. Li, Q. Zhong, J. Huang, B. Wang and Y. Zhang, J. Anal. Appl. Pyrolysis, 2016, 117, 64–71 CrossRef CAS.
- Z. Zhou, C. Lai, L. Zhang, Y. Qian, H. Hou, D. H. Reneker and H. Fong, Polymer, 2009, 50, 2999–3006 CrossRef CAS.
- E. Frank, L. M. Steudle, D. Ingildeev, J. M. Spörl and M. R. Buchmeiser, Angew. Chem., Int. Ed., 2014, 53, 5262–5298 CrossRef CAS.
- K. Kim, M. W. Schulze, A. Arora, R. M. Lewis, M. A. Hillmyer, K. D. Dorfman and F. S. Bates, Science, 2017, 356, 520–523 CrossRef CAS.
- G. Porod, Small angle X-ray scattering, Academic Press, New York, 1982 Search PubMed.
- S.-S. Tzeng, Carbon, 2006, 44, 1986–1993 CrossRef CAS.
- M.-A. Kim, D. Jang, S. Tejima, R. Cruz-Silva, H.-I. Joh, H. C. Kim, S. Lee and M. Endo, Sci. Rep., 2016, 6, 22988 CrossRef CAS.
- M. K. Shin, B. Lee, S. H. Kim, J. A. Lee, G. M. Spinks, S. Gambhir, G. G. Wallace, M. E. Kozlov, R. H. Baughman and S. J. Kim, Nat. Commun., 2012, 3, 650 CrossRef PubMed.
- F. Zheng, Y. Yang and Q. Chen, Nat. Commun., 2014, 5, 5261 CrossRef CAS PubMed.
- A. R. Boccaccini, J. Cho, J. A. Roether, B. J. C. Thomas, E. Jane Minay and M. S. P. Shaffer, Carbon, 2006, 44, 3149–3160 CrossRef CAS.
- R. Andrews, D. Jacques, D. Qian and E. C. Dickey, Carbon, 2001, 39, 1681–1687 CrossRef CAS.
- T. Kowalewski, N. V. Tsarevsky and K. Matyjaszewski, J. Am. Chem. Soc., 2002, 124, 10632–10633 CrossRef CAS PubMed.
- B. Saha and G. C. Schatz, J. Phys. Chem. B, 2012, 116, 4684–4692 CrossRef CAS PubMed.
- J. Sun, G. Wu and Q. Wang, J. Appl. Polym. Sci., 2005, 97, 2155–2160 CrossRef CAS.
- H. Willcock and R. K. O'Reilly, Polym. Chem., 2010, 1, 149–157 RSC.
- D. Bhattacharjya, H. Y. Park, M. S. Kim, H. S. Choi, S. N. Inamdar and J. S. Yu, Langmuir, 2014, 30, 318–324 CrossRef CAS PubMed.
- C. Masarapu, H. F. Zeng, K. H. Hung and B. Wei, ACS Nano, 2009, 3, 2199–2206 CrossRef CAS PubMed.
- Y. Yuan, C. Zhan, K. He, H. Chen, W. Yao, S. Sharifi-Asl, B. Song, Z. Yang, A. Nie, X. Luo, H. Wang, S. M. Wood, K. Amine, M. S. Islam, J. Lu and R. Shahbazian-Yassar, Nat. Commun., 2016, 7, 13374 CrossRef CAS PubMed.
- D. Hulicova-Jurcakova, M. Seredych, G. Q. Lu and T. J. Bandosz, Adv. Funct. Mater., 2009, 19, 438–447 CrossRef CAS.
Footnote |
| † Electronic supplementary information (ESI) available. See DOI: 10.1039/c9me00066f |
| This journal is © The Royal Society of Chemistry 2020 |


