 Open Access Article
Overview of sterilization methods for UHMWPE through surface analysis†
Melissa
Machado Rodrigues
 *a,
Estela K.
Kerstner Baldin
ab,
Cristian Padilha
Fontoura
 *a,
Leonardo Mathias
Leidens
 a,
Rodrigo Antônio
Barbieri
c,
Rafaele
Frassini
d,
Célia
de Fraga Malfatti
b,
Mariana
Roesch-Ely
d,
Carlos Alejandro
Figueroa
 a and
Cesar
Aguzzoli
 a
a
aÁrea do Conhecimento de Ciências Exatas e Engenharias, PPGMAT, Universidade de Caxias do Sul, Caxias do Sul, RS 95070-560, Brazil. E-mail: cpfontoura@ucs.br; melissa1807@gmail.com
bLaboratório de Pesquisa em Corrosão (LAPEC), Universidade Federal do Rio Grande do Sul (UFRGS), Porto Alegre 9500, RS 91501-970, Brazil
cLaboratório Central de Microscopia – LCMIC, Universidade de Caxias do Sul, Caxias do Sul, RS 95070-560, Brazil
dInstituto de Biotecnologia, Universidade de Caxias do Sul, Caxias do Sul, RS 95070-560, Brazil
First published on 13th October 2020
Abstract
The sterilization process is essential for the use of biomaterials in the human body in order to avoid contamination. However, the effect of such required pretreatment on the surface must be also evaluated since some modifications may cause a shortened lifespan of this material or changes in properties of interest. Moreover, improvements in sterilization techniques may even enhance properties while the surface is cleaned. The thorough understanding of the effect that the sterilization processes have on the surface of ultra-high molecular weight polyethylene (UHMWPE), widely used biomaterial in orthopedic joint prosthesis, is, therefore, a key study since some modifications during traditional sterilization could be a major problem for patients who have undergone arthroplasty surgery. This work brings a comprehensive study on sterilization techniques already available and extensively used (hydrogen peroxide plasma, ethylene oxide, steam autoclave) and a comparison with results obtained for recently developed cold plasma-based sterilization technique. The effects of the processes have been extensively compiled by data obtained for thermal analysis, nanoscale wear and friction, physicochemical, topographical, wettability, and in vitro cytotoxicity experiments. An overall outlook on the set of samples points out to cold plasma oxidation (CPO) being an adequate and potential candidate for improving wear resistance, while maintaining thermal stability and a restrained adhesion of L929 cells, provoked by its hydrophilicity and larger surface area.
1. Introduction
Ultra-high molecular weight polyethylene (UHMWPE) is the most used biomaterial in orthopedic joint prosthesis, with its use dating back to the 1960s’.1–3 UHMWPE has a semicrystalline structure, with around half of polymeric chains organized in the form of crystalline lamellae and the other half in a crosslinked amorphous phase.4This feature is occasioned by its glass transition temperature Tg = −80 °C and melting point Tmelt = 135 °C, both of which allow the unique viscosity. Furthermore, the amorphous behavior allows other ideal properties for biomedical use, such as chemical inertness, low friction coefficient and a low wear rate.2,4,5 However, sterilization processes are mandatory, in order to eliminate microbial life before implantation.2,6
Nowadays, there are several methods for sterilizing such materials such as ethylene oxide (EtO),6 hydrogen peroxide plasma (HPP), steam autoclave (SA) and cold plasma oxidation (CPO) – reflecting the lack of scientific consensus over which of the methods is best suiting, considering long-term effects on patients.7,8
Autoclave sterilization is one of the most commons techniques that ensure complete decontamination in a fast, economical and reliable way. It consists of pressurized chamber with water vapor and programmed cycles that go up to a temperature of 134 °C and a controlled time. Polymers are, however, thermosensitive to such techniques and polymeric chains may degrade by hydrolysis or lose stability during asepsis cycles, compromising application in joint arthroplasty.6
Another technique being employed for over five decades to neutralize bacteria, viruses and spores in heat-sensitive products is ethylene oxide (EtO).7,9 This process occurs by the gaseous diffusion of a mixture of ethylene oxide and carbon dioxide or other inert compounds near the surface of parts, through a certain period of time. This happens usually within a few hours and its efficiency depends on conditions such as humidity, time and temperature.7,10 Polymers with a low melting point can be sterilized through this technique as long as an aeration is carried out afterwards, from 12 to 24 hours, to guarantee a complete release of residual gas.6,10 This additional aeration procedure is necessary, as EtO releases undesirable toxic waste.10,11 Also, unwanted physicochemical modifications may take place.6 It is also reported that EtO is mutagenic and carcinogenic and, therefore, is a risk to human health.10,11 EtO also requires high safety standards and high cost, restricting its use in most common lab facilities.12
A popular alternative is a low temperature plasma process. This method has been employed in UHMWPE since the 1990s and consists of sample exposition to reactive species generated by gas ionization, which will allow pathogen elimination.13,14 Plasma is generated by a radiofrequency (RF) source that provides a stable glow discharge, with biocide effects attributed to the ultraviolet radiation from it.14–16 In this process, plasma is considered the complementary detoxifying agent of the main agent – like hydrogen peroxide (HPP) or another gas mixture of them (CPO).13 Plasma sterilization is fast and guarantees no toxicity.11,13,17,18 A drawback, however, is how selective plasma-induced modification happens in semicrystalline materials: etching happens at a higher rate in amorphous regions, thus increasing surface crystallinity.19,20
In the last 10 years, a great number of failure reports involving polymeric pieces in arthroplasty applications have been published.10,21,22 The main factor behind this is described as oxidative degradation of the material, induced by sterilization processes.22–25 Overall, sterilization processes remain a major problem when it comes to the use of polymeric materials in biomedical applications, since the employed energy induces rapid aging, oxidation and other surface phenomena that lead to materials fragilization. In practice, this means that a recipient of a load bearing polymeric part may be subjected to implant mechanical failure or problems with the formation of debris that accumulate around the tibial, patellar and acetabular components, causing bone inflammation and degradation. Oxidative degradation also influences wear and shortening the life span of the implanted UHMWPE.9
Therefore, four different sterilization techniques were used in UHMWPE samples and characterized in terms of their physicochemical, mechanical and biological properties. The results obtained were compared, with the purpose of verifying which of these processes is the most adequate to provide a complete material sterilization, without harming the physical–chemical and mechanical characteristics of the sterilized material. The sterilization techniques applied in this study were hydrogen peroxide plasma (HPP), ethylene oxide (EtO), steam autoclave (SA) and cold plasma oxidation (CPO).
2. Materials and methods
2.1. Sample preparation
The samples used in this work were obtained from a 6.9 mm thick UHMWPE plate (Braskem, Brazil). They were cut into 1.75 mm × 1.75 mm and cleaned in ultrasonic bath – containing 10 minutes in Extran (MA 02, liquid neutral, 50 g L−1 in H2O – Supelco) and 20 minutes in distilled water. UHMWPE samples without sterilization treatment were called “pristine”.2.2. Sterilization processes
Sterilization processes used in UHMWPE are described, along with their acronyms, as follows: cold plasma oxidation (CPO); ethylene oxide (EtO); hydrogen peroxide plasma (HPP) and steam autoclave (SA). Table 1 gives a description of all procedures used in the different sterilization processes performed.| Process | Place where sterilization was performed | Sterilization protocol |
|---|---|---|
| a Company A and B are institutions specialized in sterilization processes. Their names are protected for commercial reasons. | ||
| CPO26 | LESTT, Universidade de Caxias do Sul – UCS (Caxias do Sul, Brazil) | The plasma configuration used was hollow cathode with 13.56 MHz radiofrequency power source (for plasma generation), 1 mbar (working pressure), 27 W power, 20% volume oxygen content, hydrogen content by volume of 80% within 15 min in room temperature. |
| EtO27 | Company Aa (Caxias do Sul, Brazil) | Pressure of 0.65 atm, at temperature of 55 °C, for 180 minutes with gas (Chemogas) composed of 90% ethylene oxide and 10% carbon dioxide. |
| HPP27 | Company Ba (Caxias do Sul, Brazil) | A Sterrad NX sterilizer (Johnson and Johnson) was used for a period of 28 minutes. Temperature during the sterilization cycle ranged from 45 °C to 55 °C. ANVISA certified parameters. |
| SA27 | Company Aa (Caxias do Sul, Brazil) | Autoclave used is the Baumer brand, 050500001 series, horizontal model HI-VAC Plus, with a capacity of 0.56 m3. The conditions used were as follows: temperature of 134 °C; pressure of 0.70 atm; and 7 minutes of exposure. |
Hereafter, UHMWPE samples sterilized by different processes were named as follows: pristine (UHMWPE without sterilization), CPO (UHMWPE sterile cold plasma oxidation); EtO (UHMWPE sterile ethylene oxide); HPP (UHMWPE sterile hydrogen peroxide plasma) and SA (UHMWPE sterile steam autoclave).
2.3. UHMWPE characterization before and after sterilization processes
The samples in pristine form, CPO, EtO, HPP and SA were characterized for their physicochemical, thermal, mechanical and biological properties.The values of degree of crystallinity were estimated by the method of fitting the areas of crystalline peaks and amorphous phases, followed by the calculation of the ratio between crystalline and amorphous portions. This was carried out with the aid of the native software of the equipment used for the obtention of diffraction patterns.
 | (1) |
 is the fusion enthalpy of 100% crystalline polymer (
 for UHMWPE).
2.4. UHMWPE biological characterization before and after sterilization processes
The samples were characterized for their biological behavior. The purpose of this study was to verify the effect that different sterilization treatments performed on the surface of UHMWPE have on cytotoxicity and cell adhesion.3. Results and discussion
The present section exhibits the results and following insight on data for the studied sterilization methods. A correlation of the outcomes with existing literature was made to provide an overview of the processes.3.1. Surface wettability (WCA)
Surface wettability is an important property to be studied in biomaterials it that directly influences biocompatibility, growth and cell adhesion.31,32 In case of UHMWPE used as a substitute for joint cartilage, the hydrophilic characteristic is essential for a good interaction with bone cells,32 with surface modification being often employed.31,33,34Table 2 shows the calculated average of the WCA results obtained in the pristine, CPO, EtO, HPP and SA samples as well as the standard deviation values.One can observe, in Table 2, that all the sterilization treatments performed at UHMWPE altered the surface wettability when compared to the sample without any treatment (pristine). All sterile samples presented values of WCA between 72° and 88°, indicating hydrophilicity characteristics (WCA < 90°) which is opposite to the 102° result of the pristine sample, agreeing with preceding results.26,35 In particular, an investigation31 studied the changes that occurred on the surface of the UHMWPE after the plasma-assisted microwave Electron Cyclotron Resonance (ECR) and the effect that these changes cause in relation to the interaction with bone cells. The results obtained indicated the change of the hydrophobic surface (UHMWPE without treatment) to hydrophilic (after treatment). In addition, the author proves in his experiments that UHMWPE with hydrophilic characteristics has a better adhesion of bone cells.31 In Section 3.9, further explanation will be presented regarding the effect that the WCA results have on the cell adhesion test.
3.2. Surface roughness
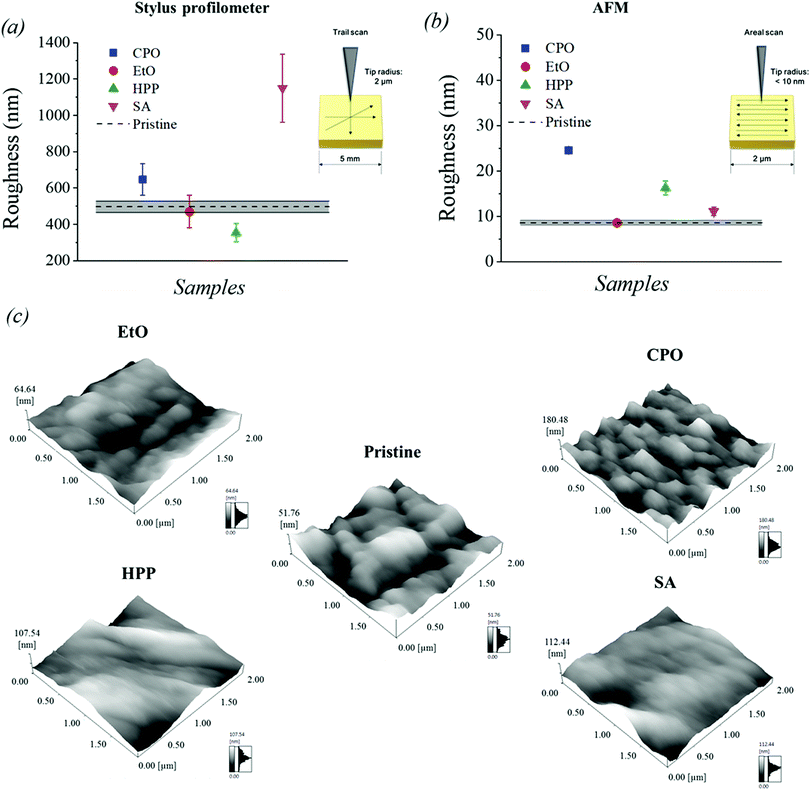
Surface roughness is a major criterion for assessing biomaterials in terms of biocompatibility, due to their ability of providing a prediction model for cellular and bacterial adhesion.1,2,7 Many works have correlated this property with cell adhesion and biocompatibility, with no universal consensus yet achieved; rather, materials are individually considered depending on their class, surface energy, and application.36–38In this work, the average roughness (Ra) of the samples sterilized by different techniques was measured by stylus profilometry and AFM. The results and standard deviation obtained are shown in Fig. 1, where the three-dimensional profiles acquired by AFM are also displayed. The results presented indicate that the UHMWPE surface is highly susceptible to topography modification after carrying out the different sterilization processes, since the results of the average roughness obtained (Ra) showed significant changes when compared to pristine. The sample sterilized by ethylene oxide (EtO) was the one that showed roughness results close to that of the pristine sample. More pronounced microgrooves are visible in CPO samples, which indicates a stronger plastic deformation as consequence of plasma ion bombardment effects of etching and cross-linking.39
According to a study that investigated the effect of surface roughness on cell growth and adhesion,40 an increase in cell growth is perceived on the roughest surfaces. However, this increase in cell growth was observed in all rough samples, regardless of the Ra obtained. A more specific approach on this point will be discussed in Section 3.9 of this paper.
3.3. ATR-FTIR
To determine the effect that different sterilization treatments have on the surface of the UHMWPE, in terms of functional groups, FTIR spectroscopy analysis was performed. As the treatments can affect only a few nm below the UHMWPE surface, FTIR spectroscopy was evaluated in ATR mode. The vibrational spectra obtained from the pristine sample and samples sterilized by different treatments were normalized and can be seen in Fig. 2a. Fig. 2b highlights two regions of interest for the functional oxidation groups.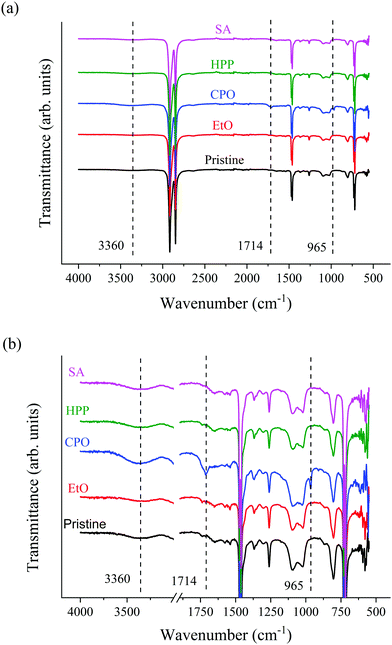 | ||
| Fig. 2 (a) ATR-FTIR spectra for the set of samples and (b) ATR-FTIR spectra normalized of the samples. | ||
Fig. 2a shows some very intense and characteristic absorption peaks of the UHMWPE at 721, 1482, 2846 and 2913 cm−1 which correspond, respectively, to the vibration in the plane of the –CH2 connection, flexion vibration –CH2, symmetrical elongation –CH2 and non-symmetric stretching vibration –CH2.18,31
With the regions of the spectra highlighted (Fig. 2b), it is possible to observe, in details, where the functional oxidation groups appear. The absorption band in 3360 cm−1, which refers to OH is observed for CPO.32 When comparing the spectra for the different conditions, no other significant modification on surface functional groups is observed,6 apart from CPO sample. A distinctive peak for C![[double bond, length as m-dash]](https://www.rsc.org/images/entities/char_e001.gif)
![[thin space (1/6-em)]](https://www.rsc.org/images/entities/char_2009.gif) C around 965 cm−1 could be observed for CPO sample, which is attributed to trans-vinylene unsaturation, due to ionization that leads to detachment of hydrogen molecule. The transmittance or absorbance perceived in ATR-FTIR spectra for this peak is linearly proportional to dose level.9,17 Also, trans-vinylene declines at very high oxidation levels, indicating that, probably, this is an unoxidized or mildly oxidized UHMWPE.11 The peak for C
C around 965 cm−1 could be observed for CPO sample, which is attributed to trans-vinylene unsaturation, due to ionization that leads to detachment of hydrogen molecule. The transmittance or absorbance perceived in ATR-FTIR spectra for this peak is linearly proportional to dose level.9,17 Also, trans-vinylene declines at very high oxidation levels, indicating that, probably, this is an unoxidized or mildly oxidized UHMWPE.11 The peak for C![[double bond, length as m-dash]](https://www.rsc.org/images/entities/char_e001.gif) O stretching at the band 1714 cm−1 indicates oxidation, which is high on surface level, but decays gradually into the sample's core3,23 and has been associated with plasma treated UHMWPE.4 Although the CPO sample showed oxidation bands, they were not intense enough to harm the bulk sample, as can be seen in the presented TGA and nanoscratch results.
O stretching at the band 1714 cm−1 indicates oxidation, which is high on surface level, but decays gradually into the sample's core3,23 and has been associated with plasma treated UHMWPE.4 Although the CPO sample showed oxidation bands, they were not intense enough to harm the bulk sample, as can be seen in the presented TGA and nanoscratch results.
3.4. Crystallinity analysis
UHMWPE is a semicrystalline material, composed of a combination of amorphous and crystalline phases – the crystalline phase is made of chains folded into oriented lamellae and crystals displaying orthorhombic structure. In a previous work,41 an exhaustive revision of UHMWPE structure and mechanical performance is discussed. One of the hypotheses raised, concerning its crystallinity, tells us that changes in amorphous regions, conveyed from increase in temperature (during the sterilization processes), will have a negative effect on mechanical properties14,24,42 being correlated to oxidation in retrieved implants.43 Also, fatigue strength has been associated with higher crystallinity, being lamellar thickness a parameter for such behavior.41,44,45 Increased surface crystallinity has also been linked to a decrease in friction responses at both microscale and nanoscale, along with increase in scratch and wear resistance.46Sterilization methods studied in our work have been vastly used in clinical applications, therefore, the evaluation of the crystallinity of UHMWPE after performing the sterilization processes is essential to check if there has been a change in its structure that may have a negative effect on its mechanical properties.
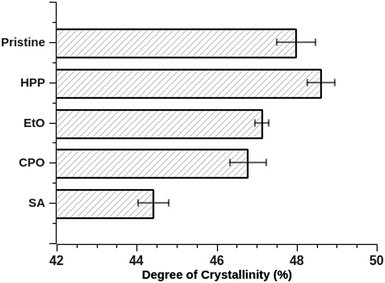
DSC and XRD analyses deliver an understanding on the degree of crystallinity of semicrystalline samples, despite the fact that results for crystallinity degree are mismatched between the two techniques – once DSC is a dynamic measurement (over a temperature profile) and XRD is measured with a constant temperature. Fig. 3 presents the DSC curves for the set of samples with three cycles (heating, cooling and heating cycles, respectively). A few parallels can be remarked from the curves and are summarized in Table 3: the DSC results showed an increase in crystallinity for all sterilization methods, which means that the heating provided by the DSC technique influences the phase reduction amorphous form of UHMWPE and consequently in increasing its crystalline phase.47,48 Similar values for pristine condition are available in the literature.47,49
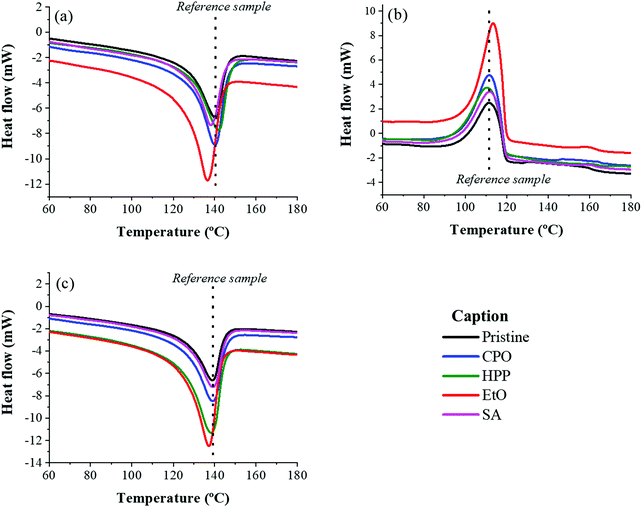 | ||
| Fig. 3 DSC curves for the three cycles (a) first heating cycle, (b) cooling cycle and (c) second heating cycle for the set of samples. | ||
| Sample | T g (°C) | T m (°C) | % X, first heating cycle | % X, second heating cycle |
|---|---|---|---|---|
| Pristine | 111.39 | 140.50 | 33.65 | 32.87 |
| CPO | 111.58 | 141.78 | 44.42 | 42.02 |
| EtO | 113.42 | 136.57 | 51.58 | 53.63 |
| HPP | 110.34 | 140.13 | 39.17 | 52.35 |
| SA | 111.74 | 138.08 | 35.60 | 36.41 |
For XRD, the results for all but one (SA) of the methods displayed a very proximate degree of crystallinity. The diffraction patterns can be viewed in ESI† as Fig. A1. However, the sample treated by SA exhibited a crystallinity index that stands out from the others. It is known that high-pressure processes carried out at elevated temperatures contribute to increase in crystallinity of UHMWPE,50 but this was not the case for SA samples, which showed a marked decrease in crystallinity, in relation to the other samples. A major disadvantage of XRD measurements is how the results are influenced by the topography, which means that a variable roughness can fool the analysis of the diffraction peak, inducing more errors.
3.5. Thermal analysis
Thermal analysis (Fig. 5) was performed to investigate the oxidative stability of the material after the sterilization processes. If there is a chemical change (such as a change in the crystalline structure of the material) after the sterilization processes and which may affect the material's stability, it is possible to verify these changes by analyzing the resistance of the sample to forced oxidation.TGA is a suitable characterization of oxidative stability in UHMWPE,51 being widely used in recent studies,52,53 serving here as a way to compare the sterilization processes with pristine conditions in terms of their thermal stability. According to the results presented in Fig. 5, the degradation behavior of the samples (percentage of mass loss) is observed when subjected to temperature increase. The onset of thermal degradation does not vary significantly among curves, attesting that the presence of C–O or C![[double bond, length as m-dash]](https://www.rsc.org/images/entities/char_e001.gif) O groups was limited.54 Mass loss rates were higher for all sterilized samples compared to the counterpart virgin condition, indicating slightly less thermally stable bulk for the set of samples. Over this analysis, CPO presented a similar stability compared to the pristine sample. It is worth mentioning that the CPO sample showed oxidation bands in the analysis of ATR-FTIR, while also displaying the greatest stability in relation to the material's original condition. The presented results confirm that the process of sterilization by CPO oxidizes the sample just superficially, without damaging its bulk properties. Conversely, HPP presented a more divergent curve, meaning an intense splitting in the chain. This same condition showed a small increase in its crystallinity (Fig. 4), which is in line with the response obtained in the TGA thermograms.
O groups was limited.54 Mass loss rates were higher for all sterilized samples compared to the counterpart virgin condition, indicating slightly less thermally stable bulk for the set of samples. Over this analysis, CPO presented a similar stability compared to the pristine sample. It is worth mentioning that the CPO sample showed oxidation bands in the analysis of ATR-FTIR, while also displaying the greatest stability in relation to the material's original condition. The presented results confirm that the process of sterilization by CPO oxidizes the sample just superficially, without damaging its bulk properties. Conversely, HPP presented a more divergent curve, meaning an intense splitting in the chain. This same condition showed a small increase in its crystallinity (Fig. 4), which is in line with the response obtained in the TGA thermograms.
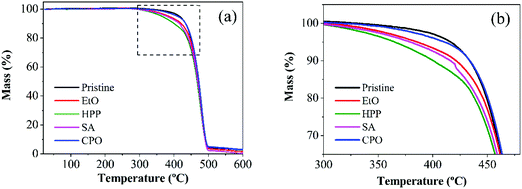 | ||
| Fig. 5 TGA thermograms for the set of samples (a) from initial mass to its full degradation and (b) the threshold for the diverging mass loss rates, amplified from inset in (a). | ||
3.6. Nano-scratch
Fig. 6a–e show the nanoscratch behavior of pristine, EtO, CPO, HPP, and SA samples, respectively, where the friction force is related to the plastic deformation induced on sample surfaces. One can note that the differences among the samples are only the sterilization process, which acts basically on surface. The signal oscillation for friction force in pristine, EtO and SA samples are due to surface irregularities. The friction force behavior is quite similar among pristine, EtO, HPP, and SA samples. However, such friction force achieves the highest values for the CPO sample. By looking at the worn surfaces of all samples, the plastic deformation is also quite similar. Indeed, the width of all trails seem to be roughly the same. As above discussed, the bulk properties were not modified at all and just chemical surface properties were affected after different sterilization processes, an expected outcome for these procedures.55 Therefore, the wear behavior should be the same, as shown by the results, and oxidized organic functions (–OH and![[double bond, length as m-dash]](https://www.rsc.org/images/entities/char_e001.gif) CO) increase the friction force in the case of the CPO sample.56 One can notice that higher friction forces should improve posterior integration to other biosystems.57,58
CO) increase the friction force in the case of the CPO sample.56 One can notice that higher friction forces should improve posterior integration to other biosystems.57,58
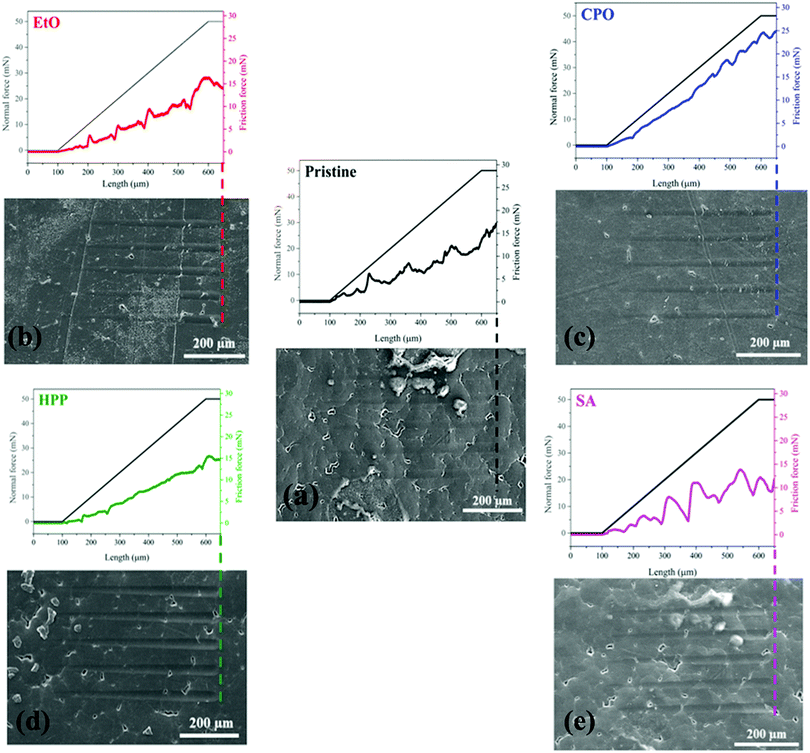 | ||
| Fig. 6 Friction and plastic deformation behaviors for different treated samples where pristine is (a), EtO (b), CPO (c), HPP (d) and SA (e). | ||
3.7. Lateral force microscopy (LFM)
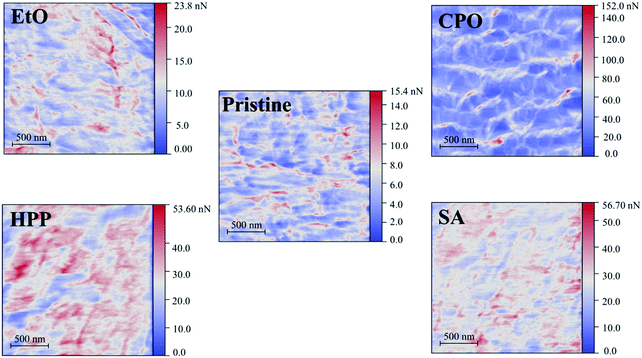
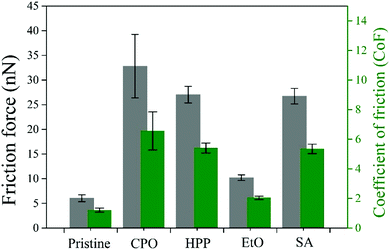
Fig. 7 presents the friction force maps obtained by LFM as well as Fig. 8 present the average friction force to each PE sample. The increase in nanoscale friction force is noticeable in all sterilized samples. This indicates a surface modification tailored by the sterilization processes, which can be claimed from the replacing topography and functional groups set over the material. This nanoscale result complements the previous discussion with microwear since sterilization processes seem to change surface properties when compared to pristine condition. The graph in Fig. 8 gives a prompt remark on these features: CPO has a greater friction force in comparison to other processes, while HPP and SA are subjected to roughly the same friction force and EtO is front to an exceptionally smaller friction force. For CPO, the high friction force is in consonance with previously discussed nanoscratch trails, where it displayed, by a wide margin, the greater friction force amongst all samples. This is also resonant with hydrophilic behavior of CPO and HPP samples – both submitted to glow discharges, from which these features entail.26 Moreover, the AFM topography maps for CPO, differently from all other samples, showed in Fig. 1c, and in consonance with friction maps, seemed to present a different surface pattern. This could be an additional factor to friction and hydrophilicity,59 for example, and might be result of the plasma effect during sterilization.393.8. Cytotoxicity
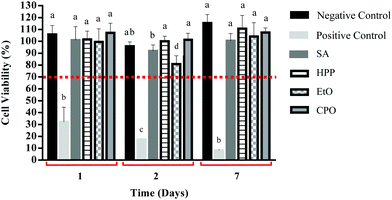
The cytotoxicity of the sterilized samples was evaluated by the method of converting MTT to formazan crystals through viable cells. This assay is widely used to measure the cytotoxic potential of drugs in established cell lines or in primary or secondary cultures.60 The comparative results of the cytotoxic effect of the CPO, EtO, HPP and SA samples with the negative and positive control are shown in Fig. 9.The data show a small decrease in cell viability of the EtO sample after two days of incubation. However, after 7 days of incubation, an increase in cell viability of this same sample was observed. When comparing the results obtained with the negative control (normalized as 100% viability), it was observed that all sterile samples did not display cytotoxicity, and are in line with the standards established by ISO 10993-12 and ISO 10993-5-2009-2, which considers a cut off of 70% for cytotoxic materials.
3.9. Cellular adhesion and spreading
L929 mouse fibroblasts leverage on surface topography and surface chemistry to either adhere or spread over the material (Fig. 10).4 In this set, CPO surfaces showed mostly round shaped fibroblasts, indicating poor cellular adhesion. High resolution SEM images can be viewed in Fig. A2–A5 (ESI†).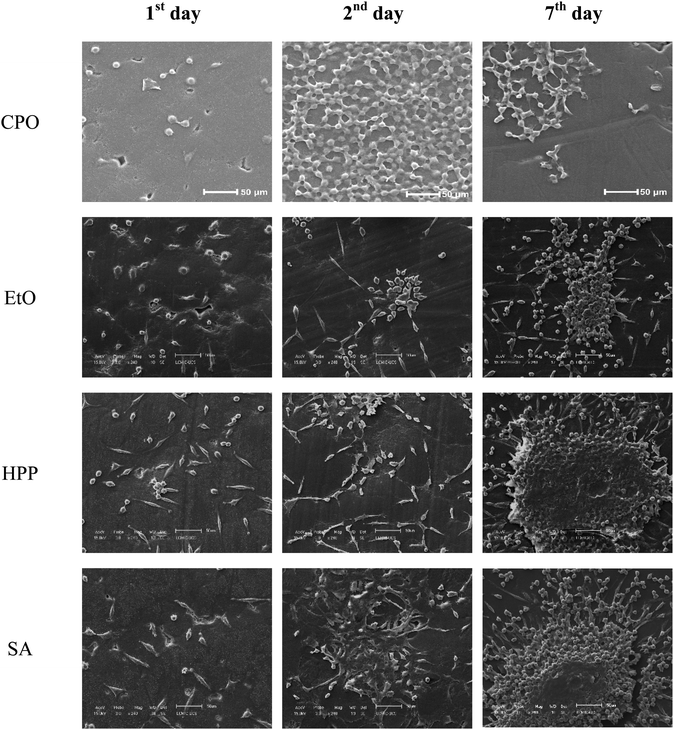 | ||
| Fig. 10 Scanning electron microscopy images of CPO, EtO, HPP and SA samples after 1, 2 and 7 days of incubation. | ||
For most samples, cell adhesion intensified from 1st to 2nd and then to 7th day, with the exception of CPO, in which cells did not show signs of good adhesion once cytoplasm remained shrunken.
Cell adhesion is a process triggered by protein adsorption, among other features, – and wettability can be a good indicator of how adhesion will take place, as they foresee how such proteins, fibronectin and albumin, may interact with substrate.
That being said, studies have once and again discussed how hydrophilicity gives a preference pathway for cellular adhesion in different types of cells, e.g., lipophilic properties of cells may be repelled by a high surface energy. The underlying effects to be taken into account are also dependent on the application of a said workpiece. In orthopedics, much is said about a concomitant effect of enhancing osteoblast activity, while avoiding fibroblastic adhesion,61,62 the latter which may lead to myofibroblast differentiation and, therefore, unwanted fibrous response. In a nutshell, CPO has a mostly inert, like pure UHMWPE,18 surface towards L929 cells.
Overall, HPP and SA sterilized samples showed cluster of cells after a week of incubation, while CPO and EtO more disperse cell proliferation over this period. This, however, does not indicate cytotoxicity, but rather how surface chemistry is affecting cell adhesion. CPO has significant modification from incoming ultraviolet radiation – with effects on its scratch resistance, crystallinity – while the other conditions had decline in thermal stability instead. This way, different cellular adhesion and proliferation behavior is readily expected, considering that all samples were incubated using the same protocol condition.
Cold plasma oxidation is mentioned as having a long-lasting hydrophilic effect on UHMWPE,26 and this is possibly incoming from additional groups introduced into the samples’ surfaces, seen in FTIR results – that could be credited as to why cell adhesion decreases over time,26,32,63 a converse phenomenon observed to that on the rest of the samples. Another impacting factor would be the surface texture, especially on the micro-scale, where cell adhesion phenomena occurs – and also AFM results indicate a much rougher surface for CPO samples, leading to a hindering of L929 cell spreading.64 Overall, biocompatibility aspects were not compromised in the different treatments, once cells adapted to all conditions in a different way.
4. Conclusion
The investigation of sterilization in implants is an ongoing science, as each day new geometries, sizes and pre-processes are applied to UHMWPE. Along with these constraints, each patient will have its own loading over these bearing surfaces. As in recent years, conventional gamma radiation has been dropped by many manufacturers of polyethylene prosthesis, alternatives have surged such as the gas plasma and ethylene oxide.Our study displayed a variety of possible outcomes for various antioxidant stabilizer-free sterilization processes, pointing out favorable characteristics on the developed method of cold plasma sterilization. As a surface property, friction has shown signs of improvement through nanoscratch tests in CPO samples, which means a better interaction between surfaces, while its thermal degradation behavior, a bulk property observed in TGA, remained mostly similar to pristine condition. ATR-FTIR displayed that cold plasma had the greatest effect on modifying the surfaces on the set of samples, as seen by the addition of new trans-vinylene functional groups and C![[double bond, length as m-dash]](https://www.rsc.org/images/entities/char_e001.gif) C, responsible for the long-lasting stability in wettability of these samples, which can also be inferred by the LFM results, where friction coefficient outclassed the remaining processes and cell adhesion and distribution parameters, where the lipophilic behavior of L929 cells is converse to the surface's nature.
C, responsible for the long-lasting stability in wettability of these samples, which can also be inferred by the LFM results, where friction coefficient outclassed the remaining processes and cell adhesion and distribution parameters, where the lipophilic behavior of L929 cells is converse to the surface's nature.
Conflicts of interest
There are no conflicts to declare.Acknowledgements
The authors are grateful to the following divisions at the University of Caxias do Sul (UCS): Materials Graduate Program (PPGMAT), the Biotechnology Institute (IB), and the Microscopy Center (LCMic). MMR, EKKB, CAF, and CA are CNPq fellows. CPF and LML are CAPES fellows. RF is FAPERGS/CAPES fellow. This study was financed in part by the Coordenação de Aperfeiçoamento de Pessoal de Nível Superior – Brasil (CAPES) – Finance Code – 001, and INCT-INES (CNPq).References
- S. S. Kumar and S. S. Hiremath, Surf. Topogr.: Metrol. Prop., 2019, 7, 1–20 Search PubMed.
- N. J. Hallab, K. J. Bundy, K. O’Connor, R. L. Moses and J. J. Jacobs, Tissue Eng., 2001, 7, 55–70 CrossRef CAS.
- J. Fu, E. Oral and O. K. Muratoglu, in UHMWPE Biomaterials for Joint Implants, ed. J. Fu, ZM. Jin and J. Wang, Springer, 2019, pp. 115–150 Search PubMed.
- C. Meng, Y. Chen, M. Xie, Z. Yu and B. Yang, J. Biomed. Mater. Res., Part A, 2018, 106, 321–332 CrossRef CAS.
- ASTM F2625-10, ASTM Stand., DOI: http://10.1520/F2625-07.2.
- L. Costa, M. P. Luda, L. Trossarelli, E. M. Brach Del Prever, M. Crova and P. Gallinaro, Biomaterials, 1998, 19, 659–668 CrossRef CAS.
- T. J. Kinnari, J. Esteban, N. Zamora, R. Fernandez, C. López-Santos, F. Yubero, D. Mariscal, J. A. Puertolas and E. Gomez-Barrena, Clin. Microbiol. Infect., 2010, 16, 1036–1041 CrossRef CAS.
- Y. H. An, F. I. Alvi, Q. Kang, M. Laberge, M. J. Drews, J. Zhang, M. A. Matthews and C. R. Arciola, Int. J. Artif. Organs, 2005, 28, 1126–1137 CrossRef CAS.
- G. Bertoli, I. M. Gindri, P. O. Cubillos, C. R. M. Roesler and G. V. Salmoria, Int. J. Adv. Des. Manuf. Technol., 2019, 101, 235–241 CrossRef.
- M. C. Tanzi, S. Farè and G. Candiani, in Foundations of Biomaterials Engineering, ed. M. C. Candiani, T. Silvia and F. Gabriele, Elsevier Ltd, 2019, pp. 289–328 Search PubMed.
- O. K. Muratoglu and W. H. Harris, J. Biomed. Mater. Res., 2001, 56, 584–592 CrossRef CAS.
- T. Lorson, M. Ruopp, A. Nadernezhad, J. Eiber, U. Vogel, T. Jungst and T. Lühmann, ACS Omega, 2020, 5, 6481–6486 CrossRef CAS.
- M. C. Sobieraj and C. M. Rimnac, J. Mech. Behav. Biomed. Mater., 2009, 2, 433–443 CrossRef CAS.
- S. M. Kurtz, M. L. Villarraga, M. P. Herr, J. S. Bergström, C. M. Rimnac and A. A. Edidin, Biomaterials, 2002, 23, 3681–3697 CrossRef CAS.
- S. Lerouge, A. C. Fozza, M. R. Wertheimer, R. Marchand and L. Yahia, Plasmas Polym., 2000, 5, 31–46 CrossRef CAS.
- I. A. Soloshenko, V. V. Tsiolko, V. A. Khomich, A. I. Shchedrin, A. V. Ryabtsev, V. Y. Bazhenov and I. L. Mikhno, Plasma Phys. Rep., 2000, 26, 792–800 CrossRef.
- P. Fulin, D. Pokorny, M. Slouf, M. Nevoralova, T. Vackova, J. Dybal and J. Pilar, BMC Musculoskeletal Disord., 2014, 15, 1–8 CrossRef.
- G. Kaklamani, N. Mehrban, J. Chen, J. Bowen, H. Dong, L. Grover and A. Stamboulis, Biomed. Mater., 2010, 5, 1–10 Search PubMed.
- H. Aboltakhty, A. Rashidi, M. E. Yazdanshenas and S. Shahidi, Orient. J. Chem., 2018, 34, 301–313 CrossRef CAS.
- K. N. Pandiyaraj, V. Selvarajan, R. R. Deshmukh and M. Bousmina, Surf. Coat. Technol., 2008, 202, 4218–4226 CrossRef CAS.
- C. Y. Hu and T. R. Yoon, Biomater. Res., 2018, 22, 1–12 CrossRef.
- V. Sharma, S. Bose, B. Kundu, S. Bodhak, D. Mitun, V. K. Balla and B. Basu, ACS Biomater. Sci. Eng., 2020, 6, 1462–1475 CrossRef CAS.
- J. Fu, B. N. Doshi, E. Oral and O. K. Muratoglu, Polymer, 2013, 54, 199–209 CrossRef CAS.
- F. Ansari, M. D. Ries and L. Pruitt, J. Mech. Behav. Biomed. Mater., 2016, 53, 329–340 CrossRef CAS.
- P. Taddei, S. Affatato, M. Rocchi, C. Fagnano and M. Viceconti, J. Mol. Struct., 2008, 875, 254–263 CrossRef CAS.
- M. M. Rodrigues, C. P. Fontoura, C. S. C. Garcia, S. T. Martins, J. A. P. Henriques, C. A. Figueroa, M. Roesch-Ely and C. Aguzzoli, Mater. Sci. Eng., C, 2019, 102, 264–275 CrossRef CAS.
- E. K. K. Baldin, C. Garcia, J. A. P. Henriques, M. R. Ely, E. J. Birriel, R. N. Brandalise and C. D. F. Malfatti, J. Mater. Res., 2018, 33, 161–177 CrossRef CAS.
- F. Alam, M. Choosri, T. K. Gupta, K. M. Varadarajan, D. Choi and S. Kumar, Mater. Sci. Eng., B, 2019, 241, 82–91 CrossRef CAS.
- E. Gnecco, R. Pawlak, M. Kisiel, T. Glatzel and E. Meyer, in Nanotribology and Nanomechanics: An Introduction, ed. B. Bhushan, Springer, 4th edn, 2017 Search PubMed.
- D. Nečas and P. Klapetek, Cent. Eur. J. Phys., 2012, 10, 181–188 Search PubMed.
- S. E. More, J. R. Dave, P. K. Makar, S. V. Bhoraskar, S. Premkumar, G. B. Tomar and V. L. Mathe, Appl. Surf. Sci., 2020, 506, 144665 CrossRef CAS.
- A. Chaichi, A. Prasad, L. Kootta Parambil, S. Shaik, A. Hemmasian Ettefagh, V. Dasa, S. Guo, M. L. Osborn, R. Devireddy, M. M. Khonsari and M. R. Gartia, ACS Biomater. Sci. Eng., 2019, 5, 2147–2159 CrossRef CAS.
- A. J. T. Teo, A. Mishra, I. Park, Y. J. Kim, W. T. Park and Y. J. Yoon, ACS Biomater. Sci. Eng., 2016, 2, 454–472 CrossRef CAS.
- M. Shimel, I. Gouzman, E. Grossman, Z. Barkay, S. Katz, A. Bolker, N. Eliaz and R. Verker, Adv. Mater. Interfaces, 2018, 5, 1800295 CrossRef.
- K. Wu, S. P. Douglas, G. Wu, A. J. MacRobert, E. Allan, C. E. Knapp and I. P. Parkin, J. Mater. Chem. B, 2019, 7, 3310–3318 RSC.
- E. Biazar, M. Heidari, A. Asefnejad and N. Montazeri, Int. J. Nanomed., 2011, 6, 631–639 CrossRef CAS.
- S. Migita, S. Okuyama and K. Araki, J. Appl. Biomater. Funct. Mater., 2016, 14, 65–69 Search PubMed.
- D. P. Oliveira, A. Palmieri, F. Carinci and C. Bolfarini, Mater. Sci. Eng., C, 2015, 51, 248–255 CrossRef CAS.
- S. M. M. Spyrides, F. S. Alencastro, E. F. Guimaraes, F. L. Bastian and R. A. Simao, Surf. Coat. Technol., 2019, 378, 124990 CrossRef CAS.
- F. Lüthen, R. Lange, P. Becker, J. Rychly, U. Beck and J. G. B. Nebe, Biomaterials, 2005, 26, 2423–2440 CrossRef.
- M. C. Sobieraj and C. M. Rimnac, J. Mech. Behav. Biomed. Mater., 2009, 2, 433–443 CrossRef CAS.
- S. M. Kurtz, The UHMWPE Handbook: Ultra-High Molecular Weight Polyethylene in Total Joint Replacement, 2004 Search PubMed.
- S. Tone, M. Hasegawa, G. Pezzotti, L. Puppulin and A. Sudo, Acta Biomater., 2017, 55, 455–465 CrossRef.
- K. S. Simis, A. Bistolfi, A. Bellare and L. A. Pruitt, Biomaterials, 2006, 27, 1688–1694 CrossRef CAS.
- Y. F. Huang, J. Z. Xu, J. Y. Xu, Z. C. Zhang, B. S. Hsiao, L. Xu and Z. M. Li, J. Mater. Chem. B, 2014, 2, 971–980 RSC.
- K. S. Kanaga Karuppiah, A. L. Bruck, S. Sundararajan, J. Wang, Z. Lin, Z. H. Xu and X. Li, Acta Biomater., 2008, 4, 1401–1410 CrossRef CAS.
- C. M. dos Santos, B. C. da Silva, E. H. Backes, L. S. Montagna, L. A. Pessan and F. R. Passador, Mater. Res., 2018, 21, 1–11 Search PubMed.
- J. Fu, J. Shen, G. Gao, Y. Xu, R. Hou, Y. Cong and Y. Cheng, J. Mater. Chem. B, 2013, 1, 4727–4735 RSC.
- M. Ahmad, M. U. Wahit, M. R. A. Kadir, K. Z. M. Dahlan and M. Jawaid, J. Polym. Eng., 2013, 33, 599–614 CAS.
- S. Sambasivan, D. A. Fischer and S. M. Hsu, J. Vac. Sci. Technol., A, 2007, 25, 932–937 CrossRef CAS.
- M. J. Martínez-Morlanes, F. J. Medel, M. D. Mariscal and J. A. Puértolas, Polym. Test., 2010, 29, 425–432 CrossRef.
- L. Melk and N. Emami, Composites, Part B, 2018, 146, 20–27 CrossRef CAS.
- W. Duan, M. Wu, J. Han and Z. Ni, RSC Adv., 2020, 10, 4175–4188 RSC.
- H. Wang, L. Xu, J. Hu, M. Wang and G. Wu, Radiat. Phys. Chem., 2015, 115, 88–96 CrossRef CAS.
- J. Horakova, M. Klicova, J. Erben, A. Klapstova, V. Novotny, L. Behalek and J. Chvojka, ACS Omega, 2020, 5, 8885–8892 CrossRef CAS.
- S. R. Bakshi, K. Balani, T. Lalia, J. Tercero and A. Agarwal, JOM, 2007, 59, 50–53 CrossRef CAS.
- S. M. Kurtz, C. M. Rimnac, L. Pruitt, C. W. Jewett, V. Goldberg and A. A. Edidin, Biomaterials, 2000, 21, 283–291 CrossRef CAS.
- A. A. Edidin, L. Pruitt, C. W. Jewett, D. J. Crane, D. Roberts and S. M. Kurtz, J. Arthroplasty, 1999, 14, 616–627 CrossRef CAS.
- M. M. Rodrigues, C. P. Fontoura, A. E. Dotta Maddalozzo, L. M. Leidens, H. G. Quevedo, K. dos, S. Souza, J. da Silva Crespo, A. F. Michels, C. A. Figueroa and C. Aguzzoli, Composites, Part B, 2020, 189, 107909 CrossRef CAS.
- J. van Meerloo and G. J. L. K. J. Cloos, in Cancer Cell Culture: Methods and Protocols, ed. I. Cree, Humana Press, 2011, pp. 151–159 Search PubMed.
- A. Cohen, P. Liu-Synder, D. Storey and T. J. Webster, Nanoscale Res. Lett., 2007, 2, 385–390 CrossRef CAS.
- E. Fadeeva, S. Schlie, J. Koch and B. N. Chichkov, J. Adhes. Sci. Technol., 2010, 24, 2257–2270 CrossRef CAS.
- I. Y. Grubova, M. A. Surmeneva, V. V. Shugurov, N. N. Koval, I. I. Selezneva, S. M. Lebedev and R. A. Surmenev, J. Med. Biol. Eng., 2016, 36, 440–448 CrossRef.
- T. S. Demina, M. G. Drozdova, M. Y. Yablokov, A. I. Gaidar, A. B. Gilman, D. S. Zaytseva-Zotova, E. A. Markvicheva, T. A. Akopova and A. N. ZelenetskiI, Plasma Processes Polym., 2015, 12, 710–718 CrossRef CAS.
Footnote |
| † Electronic supplementary information (ESI) available: Fig. A1: Diffraction patterns used for the estimation of crystallinity on the set of samples. Fig. A2: High resolution scanning electron microscopy images of the CPO samples after 1, 2 and 7 days of incubation. Fig. A3: High resolution scanning electron microscopy images of the EtO samples after 1, 2 and 7 days of incubation. Fig. A4: High resolution scanning electron microscopy images of the HPP samples after 1, 2 and 7 days of incubation. Fig. A5: High resolution scanning electron microscopy images of the SA samples after 1, 2 and 7 days of incubation. See DOI: 10.1039/d0ma00772b |
| This journal is © The Royal Society of Chemistry 2020 |


