
 Open Access Article
 This Open Access Article is licensed under a Creative Commons Attribution-Non Commercial 3.0 Unported Licence
A colorimetric sensing platform based on self-assembled 3D porous CeGONR nanozymes for label-free visual detection of organophosphate pesticides†
Liyun
Lin
 *a,
Huifang
Ma
a,
Chunliang
Yang
a,
Wuhai
Chen
a,
Shaodong
Zeng
*a and
Yuefang
Hu
b
*a,
Huifang
Ma
a,
Chunliang
Yang
a,
Wuhai
Chen
a,
Shaodong
Zeng
*a and
Yuefang
Hu
b
aAgricultural Products Processing Research Institute, Chinese Academy of Tropical Agricultural Sciences, Zhanjiang 524001, Guangdong, China. E-mail: liyyunlin@163.com; shaodongzeng@163.com
bCollege of Materials and Chemical Engineering, Hezhou University, Hezhou 542899, Guangxi, China
First published on 12th October 2020
Abstract
Analytical methods for detecting organophosphorus pesticides (OPs) with high sensitivity as well as on-site screening are urgently required to guarantee food safety and protect ecosystems. Herein, we developed a Ce(III)-driven self-assembled strategy to fabricate nanocomposites (CeGONRs) by a facile method. We used multiple characterization techniques and revealed that CeGONRs form a 3D porous structure and possess high surface-to-volume ratios, mixed valence, and multiple catalytic sites. We have also demonstrated that high-performance CeGONRs have nanozyme catalytic ability and revealed their synergistic catalytic mechanism. As a proof of concept, we investigated the excellent catalytic property of the CeGONRs by catalyzing the oxidation of a 3,3′,5,5′-tetramethylbenzidine (TMB) substrate to produce a blue color. Furthermore, based on the acetylcholinesterase (AChE) enzyme inhibition method, upon the addition of AChE and acetylthiocholine (ATCh), the blue becomes colorless; OPs inhibited the activity of AChE, and prevented the generation of thiocholine (TCh), accompanied by no color change. The CeGONR nanozyme-based sensing platform was used successfully for the colorimetric detection of OPs. OPs were detected at 3.43 ng mL−1 (0.0034 ppb) and the linear range was from 0.012 to 3.50 μg mL−1. The corresponding LOD for chlorpyrifos was measured to be lower than 2 ppb that is below the maximum residue limit (MRL) adopted by the national food safety standard of China. The color change was observable by the naked eye and successfully applied to paper-based disposable test strip screening for OPs; satisfactory results were also obtained using cabbage samples. The rational design of CeGONRs sheds light on the catalytic mechanism and provides a versatile approach for constructing artificial enzymes that can be potentially used for a rapid, on-site, paper-based visual screening of a large number of samples.
1. Introduction
Organophosphate pesticides (OPs) contain toxic components and are the largest class of pesticides.1 OPs are also established as having neurological toxicity by regulatory organizations specializing in human exposure. OPs are known to be the most toxic pesticides, and they have also been misused as chemical warfare agents; they are also difficult to degrade even at very low concentrations. Given their widespread use, but dangerous consequences for consumers when they persist in food products, there is clearly a public health need to rapidly monitor a huge variety of agricultural foods for OP contamination.Currently, analytical techniques for OPs heavily rely on chromatographic methods and mass spectrometry for accurate quantification. However, the chromatographic and mass spectrometry methods are not suitable for rapid screening of samples on-site due to requirements for costly instruments and specially trained personnel. Recently developed sensitive methods including surface-enhanced Raman scattering (SERS), fluorescence (FL), electrochemical sensing, immunoassays, and chemiluminescence strategies, to some extent, have overcome these disadvantages.2–4 Despite the usefulness of these methods, there are still many hindrances to be overcome such as: difficult procedures; the time and cost required; the need for specialized equipment; and none of the methods being suitable for real-time rapid analysis under field, warehousing, or point-of-sale conditions. Thus, there is an urgent demand for rapid and easy to use on-site analytical methods to screen for OPs.5,6
The recent decades have seen the emergence of various classes of artificial enzymes that can equal or exceed the catalytic performance of natural enzymes without limitations such as lack of durability or poor performance under diverse environmental conditions. Nanozyme-catalytic nanomaterials represent one of the most promising areas in this field.7 Nanozymes have been used as the basis for multiple colorimetric sensing platforms that enable the highly sensitive detection of analytes based on color changes that can be observed by the naked eye.8 Thus, numerous metal oxide-based particles (Fe3O4 NPs, CeO2 NPs, V2O5 NPs, and MnO2 NPs), carbon-based materials (carbon nanotubes, carbon dots, and GOs), transition-metal dichalcogenides (TMDs), and metal–carbon composite based nanomaterials with high stability and low cost have been used as nanozymes.9–17 A colorimetric method was constructed for detecting paraoxon based on an inhibiting effect of thiocholine on enzymatic etching of gold nanorods.18 A novel colorimetric platform based on GeO2 nanozymes was proposed for detecting paraoxon based on the blocking of enzymatic active.19 An all-in-one enzyme-inorganic hybrid nanoflower based high-performance artificial enzyme cascade system was established as a sensitive and affordable lab-on-paper biosensor enabling dual-modal readout (electrochemical and colorimetric signal) for on-site monitoring of OPs.20 Even though these enzyme-based detection methods have been successfully utilized for the detection of OPs, most of these nanozymes are zero-dimensional (0D), 1D or 2D.
Furthermore, their use in colorimetric assay has been delayed due to various limitations, for example, their low-dimensional surface. The utilization efficiency of 0D NPs and 2D planar catalyst materials is usually low because of agglomeration, which deeply embeds abundant active sites on the surface, making them unfavorable for both mass transfer and electron transfer.21 The 0D Pt NPs, Mn3O4 NPs, Cu NCs, and Ag NPs, and 2D MnO2 nanosheet materials are usually unstable and prone to deactivation due to exposure.21,22 For example, MnO2, Co3O4 NPs, and Cu NCs are inactivated after solvent exposure or contact with acidic, reducing substances; Au nanorods and gold/silver core/shell nanorods are etched easily by H2O2 and protonated TMB (TMB2+).23,24
To overcome these disadvantages, the reported approaches of doping elements, changing morphology or decreasing the size of NPs could partially improve the catalytic activity.25 However, these methods either involve complex synthetic processes or there are problems of aggregation, which lead to inadequate extents of process control and compromised enzymatic activity. Furthermore, additional coatings and bioconjugation usually block the active sites of nanozymes, which gives rise to a loss of catalytic activity.
3D structure nanozyme materials possess large surface areas and unsaturated metal sites, and they usually exhibit excellent catalytic activity. But some MOF materials have poor water solubility and single catalytic sites. Previous studies have reported that Fe-based MOF nanozymes only possess FeIII sites and thus display weak catalytic activity.26 It is noteworthy that most nanozyme materials have been fabricated as single-components, with limited catalytic sites. Therefore, enhancing the catalytic activity of nanozymes, while maintaining more accessible active sites, remains a considerable challenge. Overcoming many of these challenges requires developing 3D architectures that should in theory result in enormous surface-to-volume ratios that would enable obvious large increases in efficiency for catalysis applications.21
Ion-driven self-assembly is an efficient strategy for designing nanostructures.27 An assembled nanoscale composite can possess structure-controlled optical and electronic properties, and the potential for morphological diversity extends the functions of the material in sensing applications.28 These ideas motivated us to combine highly flexible and easy-to-manipulate nanostructures like nanoribbons with a catalytically attractive cation component to make nanozyme materials that could be arranged as a 3D porous structure.29 Cerium oxide nanoparticles (nanoceria) possess the characteristic of mixed valence states and act as electron sponges: Ce4+ quickly oxidizes a substrate and is reduced to Ce3+, which is then “spontaneously” recycled back to Ce4+via a redox switch mechanism, and the high mobility of surface oxygen is responsible for the oxidase like activity.30,31 This would, in theory, address the aforementioned issues of catalyst deactivation, but nanoceria are known to have low surface-to-volume ratios. Graphene oxide nanoribbons (GONRs) are 1D narrow strips of materials with high aspect ratios featuring bent junctions that have unique electromagnetic properties allowing us to fully engineer their morphological and catalytic activity.32 According to their unique edge structure, topological defects, and abundant oxygen-containing functional groups, we imagined that a Ce ion-driven self-assembly process could allow for a controllable fabrication approach to integrate the individual building blocks of a potentially high-performance 3D porous nanozyme material with high surface-to-volume ratios, multiple valences, and diverse catalytic sites.32,33
Herein, we developed a Ce(III)-driven self-assembled synthetic strategy to fabricate bicomponent nanocomposites by using single-walled carbon nanotubes (SWCNTs) as raw materials (Scheme 1). We used multiple characterization techniques and revealed that CeGONRs form a 3D porous structure and possess high surface-to-volume ratios, mixed valence, and multiple catalytic sites. We also demonstrated that the high-performance CeGONRs have an intrinsic nanozyme catalytic ability and revealed its synergistic catalytic mechanism. As a proof of concept, we investigated the excellent nanozyme catalytic property of the CeGONRs by catalyzing the oxidation of a TMB substrate. Furthermore, based on the AChE enzyme inhibition method, the CeGONR nanozyme was used successfully for colorimetric detection and paper-based naked eye visible screening of OPs in samples.
 | ||
| Scheme 1 Schematic illustration of the synthesis route for the CeGONRs using SWCNTs as the precursor and visualized colorimetric detection of organophosphorus pesticides. | ||
2. Experimental
2.1 Reagents and instruments
All chemicals were of analytical reagent grade and used without further purification. SWCNTs (OD 1–2 nm, length 5–30 μm) were purchased from XFNANO, Inc. (Nanjing, China). Ce(NO3)3·6H2O, CH3COONa, CH3COOH, 3,3′,5,5′-tetramethylbenzidine (TMB), acetylcholinesterase (AChE) and acetylcholine chloride (ATCh) were obtained from Sigma-Aldrich. Pesticide standards were purchased from Tianjin Municipal Ministry of Agriculture Environmental Quality Supervision and Inspection Center (Tianjin, China). Ultrapure water was produced with a Millipore purification system.UV-vis absorption spectra were recorded on a Cary 60 spectrophotometer (Agilent, USA). X-Ray diffraction (XRD) patterns were obtained using an X’Pert PRO diffractometer (PANalytical, Netherlands) with Cu Kα radiation. X-Ray photoelectron spectroscopy (XPS) was conducted on a Thermo ESCALAB 250XI electron spectrometer (Thermo, USA) with 150 W Al Kα radiation. Fourier transform infrared (FT-IR) spectra were obtained using a PE Spectrum One FT-IR spectrometer (PE, USA). Thermogravimetric analysis (TGA) was performed using a LABSYS evo TGDSC/DTA instrument (Setaram Instrumentation, France). Scanning electron microscopy (SEM) was carried out using an FEI Quanta 200 FEG SEM (Philips, Netherlands). Transmission electron microscopy (TEM) images were taken using a JEOL JEM2100 microscope operating at 200 kV. The surface area experiment was performed using an ASAP-2020 system from Micromeritics.
2.2 Preparation of GONRs
GONRs were prepared using a previously published protocol with minor modifications.34,35 Briefly, SWCNTs (20 mg) were dispersed in concentrated sulfuric acid (H2SO4, 80 mL, 25% by volume) and mildly sonicated for 15 min, then they were treated with potassium permanganate (KMnO4, 100 mg, 500 wt% by quality) and sonicated for another 15 min. The reaction mixture was stirred at room temperature for 1 h and then heated to 55–70 °C for an additional 1 h. Detailed steps are presented in the ESI.†2.3 Synthesis of 3D CeGONRs
CeGONRs were synthesized using a simple procedure. A measured amount of Ce(NO3)3·6H2O (0.1–1.0 mM) was added into 10 mL of a 0.2 mg mL−1 GONR aqueous suspension under slow stiring, then the pH value was adjusted to 10.0 with NaOH and the mixture was left to stand undisturbed for 3 h at room temperature. Finally, the obtained 3D black solution was washed with distilled water, then freeze-dried for further use.2.4 Catalytic activity assay of CeGONRs
The catalytic activity was investigated using the catalytic oxidation of the chromogenic substrate TMB to produce a blue color. Specifically, 200 μL of the CeGONR dispersion (0.1 mg mL−1), 2200 μL of NaAc buffer (0.2 M, pH 4.0), and 600 μL of TMB solution (different concentrations) were added to the system. The solution was then mixed thoroughly and incubated at 45 °C for 15 min. The CeGONRs were then separated by centrifugation for reuse, and the supernatant was collected for further use. The catalytic activity was evaluated using enzyme kinetics theory and methods. Detailed steps can be found in the ESI.†2.5 Colorimetric detection of chlorpyrifos
In a typical detection, 10 μL of chlorpyrifos solutions at different concentrations was mixed with 10 μL of AChE solutions (1.0 U mL−1). After a 15 min reaction at 37 °C, 10 μL of ATCh solution (10 mM) and 50 μL of PBS buffer (10 mM, pH 7.5) were added, and the mixture was incubated for 20 min at 37 °C. Finally, 30 μL of the supernatant at step 2.4 was added, and the solution was then mixed thoroughly and incubated for another 15 min. The absorption spectrum was then recorded at 654 nm. Detailed steps are provided in the ESI.†3. Results and discussion
3.1 Preparation mechanism and morphology of GONRs and CeGONRs
Ion-driven self-assembly was used as a convenient and economic method to obtain CeGONR nanocomposites. GONRs were synthesized by longitudinally unzipping SWCNTs.34,35 In the assembly process, Ce(III) interconnected with the GONRs that contained plenty of epoxy (C–O–C), hydroxyl (–OH), carbonyl (C![[double bond, length as m-dash]](https://www.rsc.org/images/entities/char_e001.gif) O), and carboxyl groups (–COOH), which can act as catalytic sites.36 Ce(III) was partly oxidized in situ, then co-deposited on GONRs and formed nanoceria.33 The NPs function not only as another efficient catalytic center, but also as a “glue” connecting the GONRs through a process of 1D to 3D self-assembly (Fig. 1A). The 3D porous structure permits easy substrate approach and greatly increases the adsorption of substrate molecules. TEM images showed statistically significant narrow and soft-edged strips, and we therefore concluded that we had successfully synthesized 1D narrow strip GONRs (Fig. S1, ESI†). Furthermore, the diameters of the GONRs in the 3–7 nm range can be used to define the obtained GONRs from longitudinal cutting of SWCNTs.
O), and carboxyl groups (–COOH), which can act as catalytic sites.36 Ce(III) was partly oxidized in situ, then co-deposited on GONRs and formed nanoceria.33 The NPs function not only as another efficient catalytic center, but also as a “glue” connecting the GONRs through a process of 1D to 3D self-assembly (Fig. 1A). The 3D porous structure permits easy substrate approach and greatly increases the adsorption of substrate molecules. TEM images showed statistically significant narrow and soft-edged strips, and we therefore concluded that we had successfully synthesized 1D narrow strip GONRs (Fig. S1, ESI†). Furthermore, the diameters of the GONRs in the 3–7 nm range can be used to define the obtained GONRs from longitudinal cutting of SWCNTs.
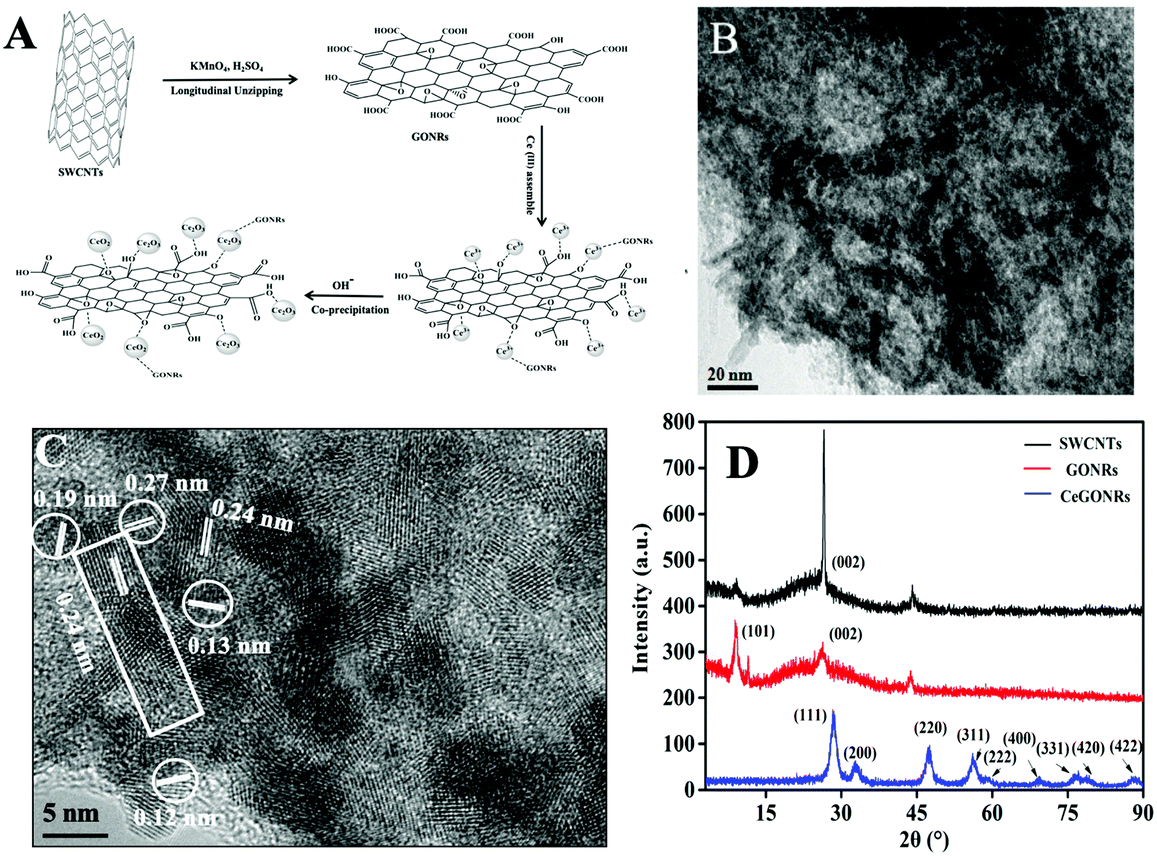 | ||
| Fig. 1 (A) Mechanism of CeGONR synthesis; (B) TEM and (C) HRTEM images of CeGONRs; (D) X-ray diffraction analysis of SWCNTs, GONRs and CeGONRs. | ||
To characterize the morphology of the nanocomposites, we examined them using electron microscopy techniques. The TEM images (Fig. 1B) revealed nanoceria particulates anchored onto the surfaces of thin, elongated 1D GONRs, interconnected with different GONRs. These findings suggest that the narrow radial GONRs act as building blocks to produce a porous 3D material. By measuring 174 particles, the diameter was determined to range from 3 to 6 nm. Subsequent HR-TEM analysis (Fig. 1C) further revealed crystal lattice spacing values of 0.24 nm for the (112) planes of the GONRs;35 and 0.12, 0.13, 0.19, and 0.27 nm values were attributed, respectively, to nanoceria correspondding to the (420), (400), (220), and (200) planes.14 These dimensions of the lattice fringes shown in Fig. 1C support an elongated distinct crystal lattice with spacing corresponding to GONRs (rectangle) and to nanoceria (circle), thus indicating the successful fusion of the nanoceria with GONRs.
The XRD patterns characterized the crystal phase and the structural information for the CeGONR nanocomposites is shown in Fig. 1D. The high diffraction peak at 26.5° 2θ can be assigned to pristine SWCNTs, attributable to the (002) facets.34 For the oxidation product, GONRs, the peak was weaker and an obvious diffraction peak appeared at 10.4° corresponding to the (101) facets.34,35 This indicated a change in the crystal phase after unravelling the nanotube. There were two peaks corresponding to the (002) and the (101) planes of GONRs, suggesting that they possessed favorable crystalline structures.
For CeGONRs, the peaks at 28.52, 32.68, 47.56, 56.12, 59.54, 69.18, 76.38, 79.16, and 87.98° were allocated to typical nanoceria diffraction peaks, indicating that Ce elements existed in the form of nanoceria.37 The lack of obvious peaks for GONRs observed in the XRD pattern of the CeGONR nanocomposites indicated that the crystalline phase was destroyed during the self-assembly process. These diffraction peaks can be indexed to the (111), (200), (220), (311), (222), (400), (331), (420), and (422) planes of nanoceria, which are well-matched to the crystal lattice spacings obtained in the HR-TEM image (the 2θ value corresponding to the (112) plane obvious in the HR-TEM overlaps with the (111) plane of nanoceria between 25–29 in the XRD pattern).34,38,39 This observation is concrete evidence of the reaction between the nanoribbons and Ce(III) bound with the O atom containing groups on the GONRs via Ce–O bonds.
3.2 Component characterization of GONRs and CeGONRs
Interestingly, obvious particles were observed to scatter uniformly upon the 3D materials, which might act as active sites for the catalyst (Fig. 2A). SEM images show elongated GONRs in the bottom-up assemblage of the porous materials. Typical energy dispersive X-ray (EDX) analysis (Fig. 2B) also revealed the presence of Ce elements. In the EDX spectrum, C, O, and Ce peaks were clearly observed, which further indicated the successful assembly of nanoceria and GONRs. Raman spectroscopy (Fig. S2, ESI†) was conducted to study the SWCNTs, GONRs, and CeGONRs, which exhibited a peak at 490 cm−1, which was assigned to Ce–O vibrations.36 The D-band and G-band details are shown in the ESI.†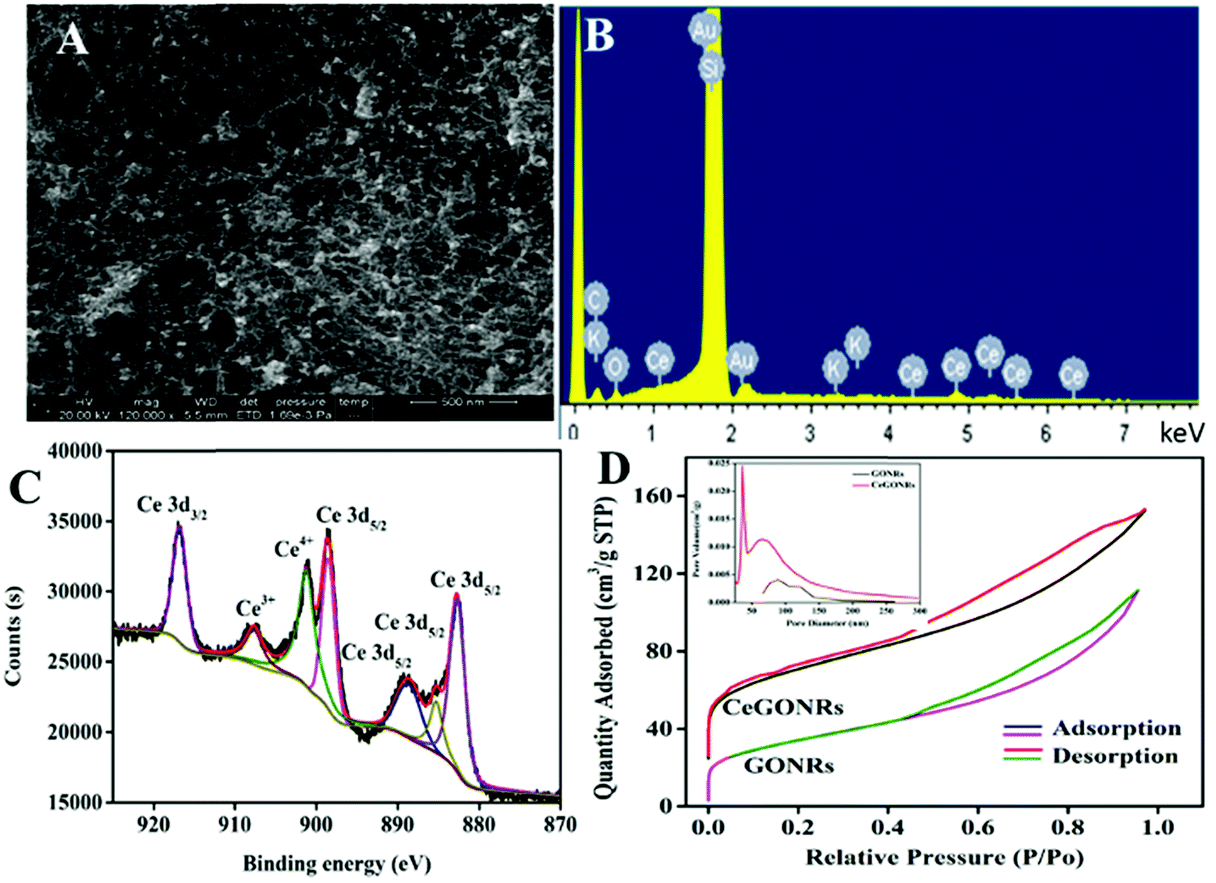 | ||
| Fig. 2 (A) SEM and (B) EDX images of CeGONRs; (C) Ce 3d XPS spectrum of CeGONRs; (D) N2 adsorption/desorption isotherm curves and (inset) pore-size distributions of the GONRs and CeGONRs. | ||
XPS spectra can efficiently characterize the surface properties of nanocomposites. All the expected elements had peaks of C 1s, O 1s, and Ce 3d at 284.1, 531.1, and 900.1 eV (Fig. S3A, ESI†). The high-resolution C 1s spectrum of CeGONRs (Fig. S3C, ESI†) was used for chemical state analysis where the signal was deconvoluted to peaks at 284.7, 285.8, and 289.1 eV that can be respectively ascribed to C–C/CC bonding, C–O bonding, and CO bonding.40 In comparison with the GONRs (Fig. S3B, ESI†), C–O showed many weak peak intensities. These results suggested that most oxygen-containing groups were reduced by cerium ions. The Ce 3d spectra (Fig. 2C) indicated the existence of a mixed valence state (Ce3+/Ce4+) in the CeGONR nanocomposites. The peaks at 881.6, 889.03, 898.1, 907.8, and 916.1 eV were assigned to Ce4+ while the peaks at 884.6 and 903.2 eV were associated with Ce3+.38 The mixed valence state nanoceria responded dynamically to catalytic activity due to the Ce4+ and Ce3+ redox switch.
The nanoporous features of the nanocomposite were investigated using N2 adsorption/desorption isotherms (Fig. 2D). The Brunauer–Emmett–Teller (BET) surface area and pore volume were measured, and the GONRs were found to have a low BET surface area (112 m2 g−1) and Barrett–Joyner–Halenda (BJH) pore volume (0.17 cm3 g−1). Conversely, the CeGONRs possessed a large BET surface area (267 m2 g−1) and pore volume (0.57 cm3 g−1). The isothermal adsorption/desorption curve exhibited a typical IV isotherm with a type H3 hysteresis loop, evidence of the existence of micro- and mesopores. The pore size distribution of the 3D CeGONR material was mainly centered at the mesoporous level, as shown in Fig. 2D (inset). This is beneficial for rapid electron and ion transport resulting in enhanced catalytic performance of the CeGONR nanocomposite compared to its counterparts.
3.3 Peroxidase-like activity and catalytic mechanism of CeGONRs
To further verify their unique catalytic activities, TMB was selected as a chromogenic substrate; upon oxidation, it develops a blue color (tetramethylbiphenyl hydrazine, ox-TMB). CeGONRs can catalyze the fast oxidation (within minutes) of TMB. A blue color can be seen by the naked eye and detected in a UV/Vis spectrum (Fig. 3A). For comparison, we tested the activity of the CeO2 NPs and GONRs under the same conditions, which generated relatively light blue colors (Fig. 3A, inset photo) indicating a weaker catalytic ability. The CeGONRs showed better catalytic activity than GONRs or CeO2 NPs alone. The reaction conditions were evaluated to investigate the optimal enzyme activities. Different Ce3+/GONR ratios affected the catalytic activities, and the optimal Ce3+ content was 0.25 mM (Fig. S4A, ESI†). The optimal pH (Fig. S4B, ESI†) was found to be 4.0 and the optimal temperature was 45 °C (Fig. S4C, ESI†), which are close to the values for a natural enzyme.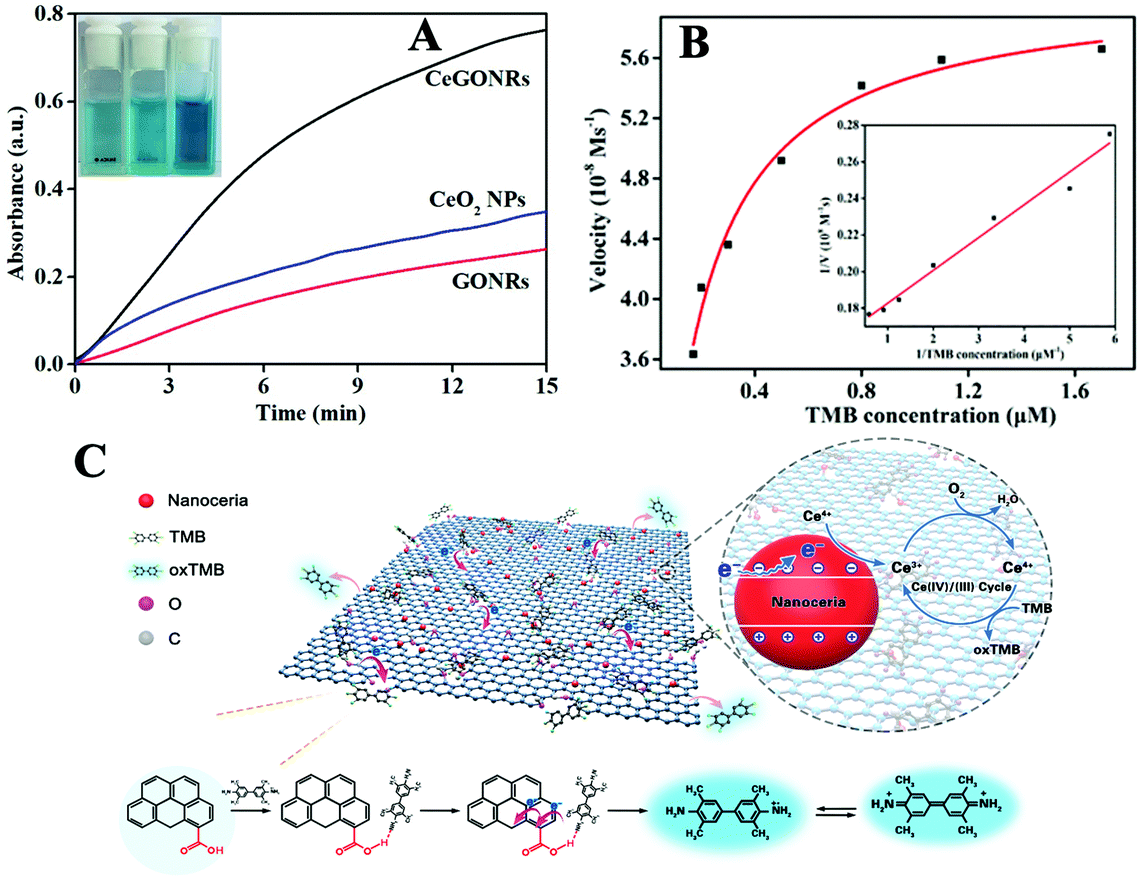 | ||
| Fig. 3 (A) The time-dependent absorbance changes in the absence (pink) or presence of catalysts of GONRs, CeO2 NPs, and CeGONRs; inset photo from left to right: GONRs + TMB, CeO2 NPs + TMB, and CeGONRs + TMB. (B) Steady-state kinetic assay of CeGONRs; insets: Lineweaver–Burk plots of the double reciprocal of the Michaelis–Menten equation; (C) schematic representation of the possible catalytic mechanism of CeGONRs. | ||
Typical Michaelis–Menten curves were observed in a suitable range of TMB concentrations (Fig. 3B). The maximum initial velocity (Vmax) and Michaelis–Menten constant (Km) for CeGONRs were calculated to be 0.109 μM and 60.8 nM s−1, respectively, compared to previously reported CeO2 with Km and Vmax values of 269 μM and 11.4 nM s−1 (Table S1, ESI†). The derived Km value was significantly lower than that for HRP. The smaller the value of Km, the stronger the affinity between the enzyme and the substrate. This result suggests that the CeGONRs had a higher affinity for and catalytic activity toward TMB. This may have been due to a higher density of catalytically active centers with low steric hindrance. Additionally, the excellent electron transfer and adsorption ability of the GONRs enhanced the affinity. In general, the efficiency of CeGONRs was due to the synergistic effect of GONRs and nanoceria. The double reciprocal plot (Fig. 3B, inset) was a straight line, indicating that the CeGONRs first bound to and reacted with TMB before releasing the product ox-TMB.
A possible mechanism is shown in Fig. 3C. On the one hand, the active sites in GONRs are likely to be ketonic carbonyl groups (–CO).41–43 These catalytic sites afford enhanced kinetics for the trapping and the activation of CeGONRs by electron transport. TMB molecules were absorbed closely on the surface of the CeGONRs. The primary amine group of TMB binds to the oxygen-containing groups (see Fig. 3C, taking –COOH as an example).44 At the same time, the anchored amine is oxidized, and the resulting amine radial cation is blue in color. On the other hand, in the catalytic process, the mixed valence state (Ce3+/Ce4+) redox switch system of the CeGONRs was recycled, causing an increase in electron density and mobility.45 Additionally, the mobility of surface oxygens is responsible for the catalytic oxidation of TMB. This endowed the CeGONRs nanocomplex with high catalytic efficiency.31,46
TGA was conducted to investigate the thermal stability of the catalysts, see Fig. S5A (ESI†). The CeGONRs showed two steps of major weight loss as temperature increased. The mass loss at around 100 °C was due to the removal of adsorbed water while the mass loss at around 700 °C can be ascribed to the decomposition of labile oxygen functional groups.35 In effect, the CeGONRs were stable up to 700 °C. This quality would be very useful in a harsh environment such as one with extremely high temperature (a batch industrial production, for instance). The proposed assembly material appeared to be highly reusable. Fig. S5B (ESI†) shows the result of five times of reuse, after which the CeGONRs were still stable and recyclable. To this effect, the proposed material is highly energy-efficient. The XRD of CeGONRs after five catalytic reactions still exhibited their characteristic peaks; therefore, we concluded that CeGONRs were reusable catalysts (see Fig. S5C, ESI†).
3.4 Visual colorimetric detection of chlorpyrifos
Among OPs, chlorpyrifos (CP) is of highest concern not only due to its wide usage in agricultural areas but also due to its neurological toxicities. We therefore used CP as a model. The detection mechanism of this platform is based on the inhibition capability of CP toward the activity of AChE, preventing the production of TCh, which depletes ox-TMB. A naked eye visual detection method for CP can be constructed according to the solution color. As illustrated in Fig. 4A, in the presence of TMB, CeGONRs produce a blue color product, ox-TMB. The CeGONRs can then be separated for reuse. However, if CP is present, the activity of AChE is inhibited, accompanied by slight or no color changes. AChE or ATCh alone with CP results in no detectable color changes. | ||
| Fig. 4 (A) UV-vis absorption spectra and visual color changes of solutions in different reaction systems, inset photo from left to right: TMB, CeGONRs + TMB + AChE + ATCh, CeGONRs + TMB + ATCh, CeGONRs + TMB + OPs, CeGONRs + TMB + AChE, and CeGONRs + TMB + AChE + ATCh + OPs. (B) UV-vis absorption spectra and visual color changes of reaction system for different concentrations of CP; inset: visual color changes of solutions with CP concentrations ranging from 0 to 3.5 μg mL−1. (C) Linear calibration plot for CP. (D) Colorimetric response toward OPs and other pesticides or possible coexisting substances; inset: visual color changes of solution. (E) The test strips for visual detection of OPs. The concentrations of CP are 0, 0.012, 0.10, 0.50, 1.0, 1.5, 2.0, 2.5, 3.0, and 3.5 μg mL−1, respectively. | ||
The sensitivity of this platform is also dependent on AChE concentration, temperature and time. Experimental results show that the optimal AChE concentration (Fig. S6A, ESI†), temperature (Fig. S6B, ESI†) and time (Fig. S6C, ESI†) are 1.0 U mL−1, 37 °C, and 15 min, respectively. Fig. 4B shows a typical CP concentration response curve under optimal conditions. CP was detected at 3.43 ng mL−1, the linear range was from 0.012 to 3.50 μg mL−1 (Fig. 4C), and the color change was observable by the naked eye (Fig. 4B, inset). A comparison of different methods for detecting OPs is listed in Table S2 (ESI†). The LOD of this nanoplatform was comparable to that of other nanoprobe-based assays. Additionally, compared with most OP detection nanoprobes, the CeGONRs were simple to make, reusable and label-free. Selectivity experimental results exhibited high selectivity for OPs and the sensor was unperturbed by the coexistence of other types of pesticides (Fig. 4D). An addition experiment was carried out for a recovery test on cabbage samples. The recovery of CP was between 95 and 105% (Table S3, ESI†). The spiking experiment results were consistent with that of HPLC-MS (Fig. S7, ESI†), suggesting the potential applicability of the CeGONR nanozymes-based platform for CP detection in agricultural samples.
3.5 Detection of OPs using test strips
Considering the advantages of easy storage and disposal, as well as in situ use, paper-based sensors serve as attractive platforms for rapid screening.47,48 The color change of the test strip (from pale to dark blue) can be observed with the naked eye (Fig. 4E). The visual detection limit of ∼3.43 ng mL−1 was estimated as the lowest detection concentration of CP (much lower than the maximum residue limits of 0.25 μg mL−1 for CP), which can be noted by independent observers. These results suggest that the CeGONR nanozyme-based strip device with cost-effective, simple operation, and portable features will be a highly promising platform for convenient on-site detection of OPs.4. Conclusions
In summary, we reported the facile and rapid synthesis of 3D porous CeGONR nanocomposites, and explored their intrinsic nanozyme catalytic activities. The 3D porous nanocomposite catalysts had high surface-to-volume ratios, multiple valences, and diverse catalytic sites. Benefiting from the good synergistic catalytic activities of the building blocks, ease of preparation, and excellent stability and reproducibility, CeGONRs were applied to visual colorimetric detection of chlorpyrifos down to 3.43 ng mL−1. The color change could be observed by the naked eye and successful application to paper-based test strips was achieved; satisfactory results were also obtained in cabbage samples. This work demonstrates that an ion-driven self-assembled synthetic strategy is effective for the fabrication of artificial enzymes. Therefore, we expect that CeGONRs hold great promise for use as sensors, or as high-performance nanozymes for screening and catalysis.Conflicts of interest
There are no conflicts to declare.Acknowledgements
Financial support from the Natural Science Foundations of Hainan Province (No. 219QN290) and the Central Public-Interest Scientific Institution Basal Research Fund for the Chinese Academy of Tropical Agricultural Sciences (No. 1630122017020) is gratefully acknowledged.Notes and references
- K. Thorat, S. Pandey, S. Chandrashekharappa, N. Vavilthota, A. A. Hiwale, P. Shah, S. Sreekumar, S. Upadhyay, T. Phuntsok and M. Mahato, Sci. Adv., 2018, 4, eaau1780 CrossRef CAS.
- J. Wu, S. Li and H. Wei, Nanoscale Horiz., 2018, 3, 367–382 RSC.
- X. Yan, H. Li and X. Su, TrAC, Trends Anal. Chem., 2018, 103, 1–20 CrossRef CAS.
- P. Gai, S. Zhang, W. Yu, H. Li and F. Li, J. Mater. Chem. B, 2018, 6, 6842–6847 RSC.
- T. Han and G. Wang, J. Mater. Chem. B, 2019, 7, 2613–2618 RSC.
- H. Ouyang, Q. Lu, W. Wang, Y. Song, X. Tu, C. Zhu, J. N. Smith, D. Du, Z. Fu and Y. Lin, Anal. Chem., 2018, 90, 5147–5152 CrossRef CAS.
- H. Wei and E. Wang, Chem. Soc. Rev., 2013, 42, 6060–6093 RSC.
- L. Peng, B. L. Li, C. W. Zhou, N. B. Li, M. I. Setyawati and H. L. Zou, Appl. Mater. Today, 2018, 11, 166–188 CrossRef.
- Y. Huang, J. Ren and X. Qu, Chem. Rev., 2019, 119, 4357–4412 CrossRef CAS.
- L. Gao, J. Zhuang, L. Nie, J. Zhang, Y. Zhang, N. Gu, T. Wang, J. Feng, D. Yang and S. Perrett, Nat. Nanotechnol., 2007, 2, 577 CrossRef CAS.
- A. Karimi, S. Andreescu and D. Andreescu, ACS Appl. Mater. Interfaces, 2019, 11, 24725–24734 CrossRef CAS.
- S. Ghosh, P. Roy, N. Karmodak, E. D. Jemmis and G. Mugesh, Angew. Chem., 2018, 130, 4600–4605 CrossRef.
- N. Singh, M. A. Savanur, S. Srivastava, P. D'Silva and G. Mugesh, Angew. Chem., Int. Ed., 2017, 56, 14267–14271 CrossRef CAS.
- X. I. Pereira-Hernández, A. DeLaRiva, V. Muravev, D. Kunwar, H. Xiong, B. Sudduth, M. Engelhard, L. Kovarik, E. J. Hensen and Y. Wang, Nat. Commun., 2019, 10, 1358 CrossRef.
- S. Zhang, D. Zhang, X. Zhang, D. Shang, Z. Xue, D. Shan and X. Lu, Anal. Chem., 2017, 89, 3538–3544 CrossRef CAS.
- D. Jiang, D. Ni, Z. T. Rosenkrans, P. Huang, X. Yan and W. Cai, Chem. Soc. Rev., 2019, 48, 3683–3704 RSC.
- R. Jin, Z. Xing, D. Kong, X. Yan, F. Liu, Y. Gao, P. Sun, X. Liang and G. Lu, J. Mater. Chem. B, 2019, 7, 1230–1237 RSC.
- L. Saa, R. Grinyte, A. Sánchez-Iglesias, L. M. Liz-Marzán and V. Pavlov, ACS Appl. Mater. Interfaces, 2016, 8, 11139–11146 CrossRef CAS.
- X. Liang and L. Han, Adv. Funct. Mater., 2020, 2001933 CrossRef CAS.
- R. Jin, D. Kong, X. Zhao, H. Li, X. Yan, F. Liu, P. Sun, D. Du, Y. Lin and G. Lu, Biosens. Bioelectron., 2019, 141, 111473 CrossRef CAS.
- C. Zhu, H. Li, S. Fu, D. Du and Y. Lin, Chem. Soc. Rev., 2016, 45, 517–531 RSC.
- C.-W. Yen, H. de Puig, J. O. Tam, J. Gómez-Márquez, I. Bosch, K. Hamad-Schifferli and L. Gehrke, Lab Chip, 2015, 15, 1638–1641 RSC.
- X. Ma, Z. Chen, P. Kannan, Z. Lin, B. Qiu and L. Guo, Anal. Chem., 2016, 88, 3227–3234 CrossRef CAS.
- Z. Gao, K. Deng, X.-D. Wang, M. Miró and D. Tang, ACS Appl. Mater. Interfaces, 2014, 6, 18243–18250 CrossRef CAS.
- Y. Sang, Y. Huang, W. Li, J. Ren and X. Qu, Chem. – Eur. J., 2018, 24, 7259–7263 CrossRef CAS.
- H. Lv, H. Zhao, T. Cao, L. Qian, Y. Wang and G. Zhao, J. Mol. Catal. A: Chem., 2015, 400, 81–89 CrossRef CAS.
- G. M. Whitesides and B. Grzybowski, Science, 2002, 295, 2418–2421 CrossRef CAS.
- I. L. Medintz, A. R. Clapp, H. Mattoussi, E. R. Goldman, B. Fisher and J. M. Mauro, Nat. Mater., 2003, 2, 630–638 CrossRef CAS.
- H. Cheng, Y. Huang, G. Shi, L. Jiang and L. Qu, Acc. Chem. Res., 2017, 50, 1663–1671 CrossRef CAS.
- N. Daelman, M. Capdevila-Cortada and N. López, Nat. Mater., 2019, 18, 1215–1221 CrossRef CAS.
- A. Hayat, J. Cunningham, G. Bulbul and S. Andreescu, Anal. Chim. Acta, 2015, 885, 140–147 CrossRef CAS.
- L. Xue, Y. Li, X. Liu, Q. Liu, J. Shang, H. Duan, L. Dai and J. Shui, Nat. Commun., 2018, 9, 1–8 CrossRef.
- L. Ye, X. Duan, S. Wu, T.-S. Wu, Y. Zhao, A. W. Robertson, H.-L. Chou, J. Zheng, T. Ayvalı and S. Day, Nat. Commun., 2019, 10, 1–10 CrossRef CAS.
- D. V. Kosynkin, A. L. Higginbotham, A. Sinitskii, J. R. Lomeda, A. Dimiev, B. K. Price and J. M. Tour, Nature, 2009, 458, 872–876 CrossRef CAS.
- A. M. Dimiev, A. Khannanov, I. Vakhitov, A. Kiiamov, K. Shukhina and J. M. Tour, ACS Nano, 2018, 12, 3985–3993 CrossRef CAS.
- H. B. Yang, J. Miao, S.-F. Hung, J. Chen, H. B. Tao, X. Wang, L. Zhang, R. Chen, J. Gao and H. M. Chen, Sci. Adv., 2016, 2, e1501122 CrossRef.
- D. Esrafilzadeh, A. Zavabeti, R. Jalili, P. Atkin, J. Choi, B. J. Carey, R. Brkljača, A. P. O’Mullane, M. D. Dickey and D. L. Officer, Nat. Commun., 2019, 10, 1–8 CrossRef.
- S. Zhang, Z.-Q. Huang, Y. Ma, W. Gao, J. Li, F. Cao, L. Li, C.-R. Chang and Y. Qu, Nat. Commun., 2017, 8, 1–11 CrossRef.
- C. Lan, J. Zhao, L. Zhang, C. Wen, Y. Huang and S. Zhao, RSC Adv., 2017, 7, 18658–18667 RSC.
- H.-P. Cong, X.-C. Ren, P. Wang and S.-H. Yu, ACS Nano, 2012, 6, 2693–2703 CrossRef CAS.
- C. Su, M. Acik, K. Takai, J. Lu, S.-j. Hao, Y. Zheng, P. Wu, Q. Bao, T. Enoki and Y. J. Chabal, Nat. Commun., 2012, 3, 1298 CrossRef.
- H. Sun, A. Zhao, N. Gao, K. Li, J. Ren and X. Qu, Angew. Chem., Int. Ed., 2015, 54, 7176–7180 CrossRef CAS.
- H. Wang, P. Li, D. Yu, Y. Zhang, Z. Wang, C. Liu, H. Qiu, Z. Liu, J. Ren and X. Qu, Nano Lett., 2018, 18, 3344–3351 CrossRef CAS.
- C. Su, M. Acik, K. Takai, J. Lu, S.-j. Hao, Y. Zheng, P. Wu, Q. Bao, T. Enoki and Y. J. Chabal, Nat. Commun., 2012, 3, 1–9 Search PubMed.
- I. Celardo, J. Z. Pedersen, E. Traversa and L. Ghibelli, Nanoscale, 2011, 3, 1411–1420 RSC.
- A. Asati, S. Santra, C. Kaittanis, S. Nath and J. M. Perez, Angew. Chem., 2009, 121, 2344–2348 CrossRef.
- X. Yan, H. Li, T. Hu and X. Su, Biosens. Bioelectron., 2017, 91, 232–237 CrossRef CAS.
- C. Jiang, B. Liu, M. Y. Han and Z. Zhang, Small Methods, 2018, 2, 1700379 CrossRef.
Footnote |
| † Electronic supplementary information (ESI) available. See DOI: 10.1039/d0ma00594k |
| This journal is © The Royal Society of Chemistry 2020 |