 Open Access Article
A novel NIR fluorescent probe for fast detection and imaging of methionine sulfoxide reductase A in lysosome of living cells†
Jin
Gong
ab,
Chang
Liu
a,
Songtao
Cai
ab,
Song
He
a,
Liancheng
Zhao
ab and
Xianshun
Zeng
 *ab
*ab
aTianjin Key Laboratory for Photoelectric Materials and Devices, School of Materials Science & Engineering, Tianjin University of Technology, Tianjin, 300384, China. E-mail: xshzeng@tjut.edu.cn
bSchool of Materials Science and Engineering, Harbin Institute of Technology, Harbin, 150001, China
First published on 2nd September 2020
Abstract
Methionine sulfoxide reductases (Msrs) play special roles in protecting proteins from oxidative damage caused by reactive species and repairing MetSO residues in proteins/peptides. However, current probes for Msrs fail to target lysosomes and exhibit a relatively slow response and short emission wavelengths (less than 580 nm). Herein, we reported a novel lysosome-targeted NIR fluorescent probe RBSO for fast detection and imaging Msr A by extending the linear π-conjugated system of the probe via the SNArH reaction. As expected, RBSO exhibited high selectivity and high sensitivity for the rapid detection of Msr A in real-time via a specific Msr A-triggered methylsulfinyl reduction reaction. Importantly, RBSO was cell-membrane permeable and capable of specifically distributing in lysosomes, and thus detects Msr A in real-time there, providing a potential tool for monitoring Msr A activity in lysosomes of living cells.
Introduction
The methyl chains of methionine (Met) in proteins/peptides are among the most susceptible to oxidation by reactive oxygen species (hydrogen peroxide and hypochlorous acid), reactive nitrogen species and enzymes, leading to the formation of methionine sulfoxide (MetSO) residues.1 Meanwhile methylthio groups in many drugs and natural compounds can also be oxidized to methylsulfinyl groups.2 Oxidation of Met can disrupt the structure and function of proteins, and play a significant role in the development of diseases associated with oxidative damage protein accumulation, including aging-related neurodegenerative diseases (Alzheimer's and Parkinson's diseases) and cancer.3 Since Met has a chiral center at sulfur, it produces two different diastereomers, methionine-S-sulfoxide (Met-S-SO) epimer and methionine-R-sulfoxide (Met-R-SO) epimer. Methionine sulfoxide reductase (Msr), an important enzyme responsible for the reduction of free and protein-bound MetSO to Met, plays a special role in protecting proteins from oxidative damage caused by reactive species and repairing MetSO residues in proteins/peptides.4 Msrs have a wide range of substrate specificities and can reduce various methyl sulfoxide-containing molecules, ranging from protein-bound MetSO residues to several small molecules, such as dimethyl sulfoxide, sulforaphane and methionine sulfoxide.5 Msr A and Msr B are two major isoforms of the Msr family and specifically reduce the Met-S-SO epimer and Met-R-SO epimer, respectively, and the genes for these two proteins are located within the same operon in many bacteria.6 The physiological electron donor for Msrs is the thioredoxin (Trx) system which, in vitro, can be replaced by 1,4-dithiothreitol (DTT) or 1,4-dithioerythritol (DTE).7 Although Msr plays an important role in the regulating a variety of cellular events, the lack of effective tools to detect their activity hinders further exploration of the enzymes under physiological or pathophysiological conditions.In recent years, small molecule fluorescent probe technology has attracted much more attention due to its high selectivity, high sensitivity, simplicity of implementation, real-time, in situ detection, etc.8 Generally, the intramolecular charge transfer (ICT) mechanism is a versatile strategy for designing fluorescent probes.9 Up to now, all three reported paradigmatic fluorescent probes for monitoring Msr activity were developed by the reduction induced ICT mechanism (Scheme 1).10 However, they still bear some limitations, such as the short emission wavelengths (less than 580 nm), the slow reduction of Msr probes (30 min) and non-organelle targeting, which limit their biological imaging applications.10 The development of probes capable of detecting analytes in the near-infrared (NIR) region (>650 nm) is particularly important for imaging applications because it can avoid auto-fluorescence interference of biological backgrounds, increase tissue penetration depth, and reduce photodamage to living samples.11 In addition, there are few reports on the distribution of Msr A in cells, and opinions about its distribution are diverse. Vougier et al. believed that Msr A was located in the mitochondria and cytoplasm by purifying the rat liver.12 Gladyshev's group found that Msr A was mainly distributed in the cytoplasm.13 Therefore, the design and development of organelle-targeted NIR fluorescent probes for real-time monitoring Msrs activity in vivo is important for exploring enzyme production and transfer processes.
Moskovitz's group has shown that mammalian Msr A has high enzymatic activity against p-tolylmethyl sulfoxide in vitro, while the substitution of methyl with the phenyl group completely suppresses the catalytic activity, probably due to the excessive steric hindrance of the substrate.14 In addition, our group has revealed that rectilinearly extended π-conjugate of the rhodamine scaffold by engaging a unique intramolecular nucleophilic substitution of aromatic hydrogen (SNArH) strategy effectively enlarged the emission wavelength.15 Herein, we reported a novel lysosome-targeted NIR fluorescent probe RBSO for fast detection and imaging Msr A by extending the linear π-conjugated system of the probe via the SNArH reaction. As expected, RBSO exhibited high selectivity and high sensitivity for the rapid detection of Msr A in real-time via a specific Msr A-triggered methylsulfinyl reduction reaction. Importantly, RBSO was cell-membrane permeable and capable of specifically distributing in lysosomes, and thus detects Msr A in real-time there, providing a potential tool for monitoring Msr A activity in lysosomes of living cells.
Results and discussion
Molecular synthesis
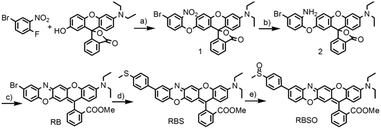
Probe RBSO was synthesized according to the procedures in Scheme 2. As shown in Scheme 2, the key intermediate RB was synthesized starting from 4-bromo-1-fluoro-2-nitrobenzene and 3′-(diethylamino)-7′-hydroxyspiro[isobenzofuran-1(3H),9′-[9H]xanthen]-3-one through three steps with a moderate yield. The detailed reaction reagents and conditions are depicted in Scheme 2. By using a Suzuki coupling reaction in the presence of 4-methylthiophenylboronic acid, compound RBS was yielded as a light blue compound (78%). Followed by the oxidation of the sulfur group in compound RBS by using m-CPBA as an oxidizing reagent in dry dichloromethane, probe RBSO was obtained in 76% yield. The structures of all synthetic compounds were confirmed by HRMS and NMR, and detailed data are presented in the ESI.†Sensitivity studies
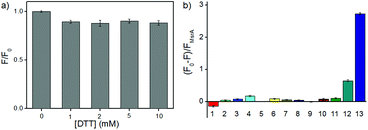
With RBSO in hand, we first investigated whether the electron donor DTT could cause interferences in the assay because some molecules with a methyl sulfoxide group can be directly reduced by DTT. Different high concentration DTT (0, 1, 2, 5, 10 mM) and RBSO (10 μM) were interacted at 37 °C (50 mM PBS, pH = 7.4), respectively, and the ratio of the fluorescence intensity (F/F0) was used to assess the effect of DTT on the probe. As shown in Fig. 1a, there were no interferences in the DTT concentration range of 1–10 mM, indicating that the highly reductive DTT did not respond significantly to the probe and could be used as the electron donor in the next assay. The concentration was fixed at 5 mM in the following assays because DTT could cause negligible fluorescence signal changes at this concentration and was consistent with previous work.10In order to test the in vitro response of RBSO as a potential Msr A sensor, emission spectra were recorded in the presence of various reducing species under the same conditions. As shown in Fig. S16 (ESI†), the absorption maximum of RBSO at 596 nm and the fluorescence intensity of RBSO at 684 nm decreased remarkably after addition of DTT and Msr A, and furthermore exhibited a large Stokes shift at 88 nm. Meanwhile, the ratio of the fluorescence intensity of the probe at 684 nm ((F0 − F)/FMsrA) was significantly enhanced (Fig. 1b). This spectral phenomenon can be ascribed to the reduction of the methyl sulfoxide to the methyl sulfide group by Msr A, which enabled the transformation of an electron-withdrawing group to an electron-donating group and thus induced the ICT process. In contrast, no significant fluorescence signal change occurred when other thiol substances or reducing substances were added under the same conditions, including bovine serum albumin (BSA), DTT, Cys, GSH, glutathione reductase/NADH (GR/NADH), Hcy, vitamin c (Vc), ethanethiol, Trx, tris(2-carboxyethyl)phosphine (TCEP) and DTT/Msr B. Thus, the above-described results showed that RBSO could be specifically reduced by Msr A, resulting in an obvious fluorescence signal change. To verify the response mechanism of RBSO towards Msr A, high performance liquid chromatography (HPLC) and high-resolution mass spectra (HRMS) experiments were conducted. As shown in Fig. S17 (ESI†), an intense peak at m/z 613.2169 corresponding to RBS was distinct, providing reliable evidence for the Msr A-induced reduction. At the same time, this hypothesis was confirmed by HPLC, where a HPLC chromatograph of the pure RBSO showed a retention time of 4.07 min, and a new peak of RBSO treated with DTT and Msr A appeared clearly at a retention time of 6.21 min (Fig. S18, ESI†). The new peak corresponds to the formation of RBS because the retention time of the standard sample RBS is 6.21 min.
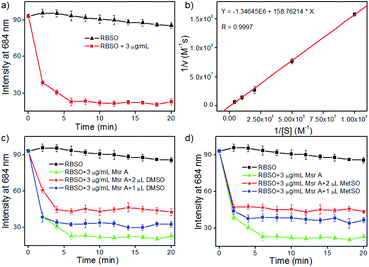
Subsequently, in order to explore whether the probe could be used to monitor Msr A in real-time, time-dependent fluorescent responses of RBSO to enzyme were evaluated under physiological environments. After the addition of different concentrations (0 and 3 μg mL−1) of Msr A under the same conditions, the fluorescence intensity of the probe at 684 nm was recorded and is depicted in Fig. 2a. As shown in Fig. 2a, in the absence of Msr A, the fluorescence intensity of the probe at 684 nm remained substantially constant within 20 minutes, indicating that RBSO had high photo-stability. In contrast, upon addition of Msr A (3 μg mL−1), the fluorescence intensity of the probe at 684 nm rapidly decreased and reached a plateau within about 8 min, suggesting that RBSO could be used as an effective candidate for monitoring Msr A in real-time under physiological environments.
The Km and Kcat values are also key parameters for probes, so we subsequently calculated the Km and Kcat of RBSO under physiological environments. As shown in Fig. 2b, the Km (72 μM) and Kcat (6.2 s−1) values of RBSO can be calculated by the Michaelis–Menten kinetics. Gratifyingly, compared with the Km and Kcat of other fluorescent probes reported, the properties of RBSO have been further improved. As shown in Table S1, the response time of RBSO is 8 minutes, while other probes required 30, 60 and 360 minutes, respectively, implying that the response time has been greatly improved. Furthermore, by comparing the reduction rates of different probes by Msr A, it was found that the reduction rate of RBSO was almost 10 times that of others reported.10 The above results demonstrated that RBSO can function as a highly selective fluorescent probe for Msr A, and has the potential for monitoring Msr A activity in real-time.
In addition, in order to further confirm that Msr A consumes RBSO, different doses of dimethyl sulfoxide (DMSO) and methionine sulfoxide (MetSO) were utilized to inhibit the reduction of RBSO. According to the literature,16 the presence of DMSO and MetSO inhibited the reduction of probes due to the competition between the sulfoxide groups of DMSO and MetSO. The corresponding time-dependent fluorescence responses of RBSO to enzymes in the presence of DMSO and MetSO are described in Fig. 2c and d, respectively. Compared to the treatment with pure Msr A, upon the addition of different concentrations of DMSO or MetSO under the same conditions, they had obvious interference with signal response to Msr A, indicating that the presence of DMSO or MetSO affect the consumption of the probe. Furthermore, the effects of pH on the reaction system were investigated (Fig. S19, ESI†), which revealed that RBSO functioned well under physiological conditions. Collectively, the above-described results suggested that RBSO could be used as a practical probe for the specific detection of Msr A in real-time under physiological environments.
Cell imaging
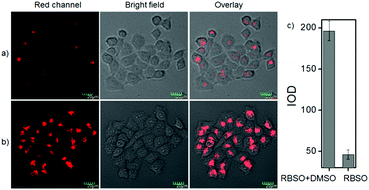
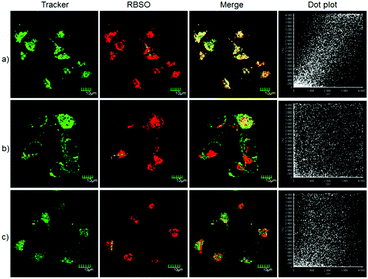
To examine the feasibility of using RBSO as an imaging reagent to map the activity of Msr A, cell imaging applications of RBSO for monitoring Msr A in living cells were carried out. Prior to cell imaging assays, standard MTT assay was performed to assess the cytotoxicity of RBSO in human cervix carcinoma HeLa cells. As shown in Fig. S20 (ESI†), HeLa cells treated with various concentrations of RBSO (0, 1, 3, 5, 10, and 20 μM) for 24 h showed high cell viability (no less than 80%), indicating that the probe has fairly low toxicity to living cells, and thus, RBSO is suitable as an imaging reagent. Subsequently, imaging experiments of RBSO for monitoring Msr A in living cells were conducted. Since the cells contain Msr A, there is no need to add Msr A in cell imaging experiments. HeLa cells were incubated with RBSO (0.1 μM) for 30 minutes, and then washed three times with PBS to remove excess probes. As shown in Fig. 3a, weak red fluorescence signals were observed in the red channel. In contrast, when the HeLa cells were pretreated with DMSO (10 μL), a significant enhancement of the fluorescence signal in the red channel was observed because the reduction of RBSO was obviously inhibited (Fig. 3b). Compared with the controlled cells, the relative decrease of fluorescence signals is about 4-fold (Fig. 3c). The results indicated that RBSO was membrane permeable and could be used for imaging Msr A in living cells.By carefully observing the overlay images of the red channel and the bright field, non-uniform intracellular fluorescence signals were noticed, implying that RBSO was likely to target organelles. Therefore, in order to verify whether RBSO has the desired organelle localization properties, we utilized commercial targeting reagents Lyso-Tracker Green (Lyso), Mito-tracker Green (Mito), and ER-Tracker Green (ER) to explore the organelle-targeting of RBSO. Surprisingly, a high Pearson's coefficient (0.93) and overlap coefficient (0.93) were found in the intensity scatter plot of the green channel and red channel, suggesting that RBSO distributed mainly in lysosomes. In addition, the intensity scatter plot allowed us to highlight the corresponding yellow pixels on simulated images in accordance with the overlay image (Fig. 4a), and the changes in the intensity profiles in the linear region of interest across the cell were synchronous in the two channels (Fig. S21, ESI†). According to that reported previously,17 moderate alkalinity of the nitrogen atom is critical for its specific localization in acidic lysosomes. Once RBSO diffuses into lysosomes and is protonated, it becomes more hydrophilic and is retained in the lysosomes. In contrast, an obvious difference of the location between the fluorescence from other trackers (Mito and ER) and RBSO was observed (Fig. 4b and c). Similarly, low Pearson's coefficients and overlap coefficients were found in the intensity scatter plot, implying that RBSO does not accumulate in these organelles. These results suggest that RBSO can be used as an efficient organelle-targetable NIR probe for lysosomal Msr A imaging in living cells. Taken together, considering its low cytotoxicity and the excellent performance in cell imaging, the probe may be operated well in monitoring the activity of Msr A in the lysosome of living cells.
Conclusions
In summary, we designed and synthesized a novel lysosome-targeted NIR fluorescent probe RBSO for fast detection and imaging Msr A by extending the linear π-conjugated system of the probe via the SNArH reaction. As expected, RBSO exhibited high selectivity and high sensitivity for the specific detection of Msr A in real-time via a specific reduction reaction. Importantly, RBSO was cell-membrane permeable and capable of specifically distributing in lysosomes, and thus detects Msr A in real-time there, providing a potential tool for monitoring Msr A activity in lysosomes of living cells.Experimental
Synthetic procedures
Cell culture and fluorescence imaging
HeLa cells were cultured in DMEM medium supplemented with 10% (v/v) fetal bovine serum and penicillin/streptomycin (100 μg mL−1) in an atmosphere of 5% CO2 at 37 °C. Then, HeLa cells were seeded in a 24-well plate, cultured in an incubator for 2 hours to adhere to the plate, and then subjected to fluorescence imaging experiments. In the treated group, the cells were incubated with RBSO (0.1 μM) for 30 min. In the controlled group, the cells were pre-incubated with DMSO for half an hour. Then, the probe was added and incubated for an additional half an hour. For co-localization experiments, RBSO (0.1 μM) was incubated with 200 nM of Mito-Tracker Green (Mito), Lyso-Tracker Green (Lyso), and ER-Tracker Green (ER) for 30 minutes, respectively. Fluorescence imaging experiments were performed on a confocal laser scanning microscope after washing three times with PBS buffer.Conflicts of interest
There are no conflicts to declare.Acknowledgements
This work was sponsored by the National Natural Science Foundation of China (NNSFC 21907075 and 21272172) and the Natural Science Foundation of Tianjin City (19JCZDJC32400 and 18JCQNJC75900).Notes and references
- (a) H. Weissbach, F. Etienne, T. Hoshi, S. H. Heinemann, W. T. Lowther, B. Matthews, G. John, C. Nathan and N. Brot, Arch. Biochem. Biophys., 2002, 397, 172 Search PubMed; (b) S. Boschi-Muller, A. Gand and G. Branlant, Arch. Biochem. Biophys., 2008, 474, 266 Search PubMed; (c) A. Kaya, B. C. Lee and V. N. Gladyshev, Antioxid. Redox Signaling, 2015, 23, 814 Search PubMed.
- (a) C. Beedham, Pharm. World Sci., 1997, 19, 255 Search PubMed; (b) R. Bentley, Chem. Soc. Rev., 2005, 34, 609 Search PubMed; (c) T. Lynch and A. Price, Am. Fam. Physician, 2007, 76, 391 Search PubMed.
- (a) S. P. Gabbita, M. Y. Aksenov, M. A. Lovell and W. R. Markesbery, J. Neurochem., 1999, 73, 1660 Search PubMed; (b) E. R. Stadtman, J. Moskovitz and R. L. Levine, Antioxid. Redox Signaling, 2003, 5, 577 Search PubMed; (c) F. Liu, J. Hindupur, J. L. Nguyen, K. J. Ruf, J. Zhu, J. L. Schieler, C. C. Bonham, K. V. Wood, V. J. Davisson and J. C. Rochet, Free Radical Biol. Med., 2008, 45, 242 Search PubMed.
- (a) H. Weissbach, L. Resnick and N. Brot, Biochim. Biophys. Acta, 2005, 1703, 203 Search PubMed; (b) J. A. Imlay, Annu. Rev. Biochem., 2008, 77, 755 Search PubMed; (c) A. Hansel, S. H. Heinemann and T. Hoshi, Biochim. Biophys. Acta, Proteins Proteomics, 2005, 1703, 239 Search PubMed; (d) L. Tarrago, Z. Peterfi, B. C. Lee, T. Michel and V. N. Gladyshev, Nat. Chem. Biol., 2015, 11, 332 Search PubMed.
- (a) F. Etienne, L. Resnick, D. Sagher, N. Brot and H. Weissbach, Biochem. Biophys. Res. Commun., 2003, 312, 1005 Search PubMed; (b) D. B. Oien and J. Moskovitz, Curr. Top. Dev. Biol., 2008, 80, 93 Search PubMed.
- (a) N. Brot, L. Weissbach, J. Werth and H. Weissbach, Proc. Natl. Acad. Sci. U. S. A., 1981, 78, 2155 Search PubMed; (b) W. T. Lowther, N. Brot, H. Weissbach and B. W. Matthews, Biochemistry, 2000, 39, 13307 Search PubMed; (c) R. Grimaud, B. Ezraty, J. K. Mitchell, D. Lafitte, C. Briand, P. J. Derrick and F. Barras, J. Biol. Chem., 2001, 276, 48915 Search PubMed.
- (a) E. R. Stadtman, Arch. Biochem. Biophys., 2004, 423, 2 Search PubMed; (b) X. H. Zhang and H. Weissbach, Biol. Rev. Cambridge Philos. Soc., 2008, 83, 249 Search PubMed; (c) L. Tarrago, E. Laugier, M. Zaffagnini, C. Marchand, P. Le Maréchal, N. Rouhier, S. D. Lemaire and P. Rey, J. Biol. Chem., 2009, 284, 18963 Search PubMed.
- (a) A. P. D. Silva, H. Q. N. Gunaratne, T. Gunnlaugsson, A. J. M. Huxley, C. P. McCoy, J. T. Rademacher and T. E. Rice, Chem. Rev., 1997, 97, 1515 Search PubMed; (b) J. Yin, Y. Hu and J. Y. Yoon, Chem. Soc. Rev., 2015, 44, 4619 Search PubMed; (c) X. Chen, Y. Zhou, X. Peng and J. Yoon, Chem. Soc. Rev., 2010, 39, 2120 Search PubMed; (d) L. Niu, Y. Chen, L. Wu, C. Tung and Q. Yang, Chem. Soc. Rev., 2015, 44, 6143 Search PubMed; (e) Y. Tang, D. Lee, J. Wang, G. Li, J. Yu, W. Lin and J. Yoon, Chem. Soc. Rev., 2015, 44, 5003 Search PubMed; (f) L. He, B. Dong, Y. Liu and W. Lin, Chem. Soc. Rev., 2016, 45, 6449 Search PubMed; (g) J. Gong, C. Liu, X. Jiao, S. He, L. Zhao and X. Zeng,, Microchem. J., 2020, 158, 105191 Search PubMed; (h) J. Gong, C. Liu, X. Jiao, S. He, L. Zhao and X. Zeng, Org. Biomol. Chem., 2020, 18, 5238 Search PubMed; (i) H. Liu, L. Chen, C. Xu, Z. Li, H. Zhang, X. Zhang and W. Tan, Chem. Soc. Rev., 2018, 47, 7140 Search PubMed; (j) Y. Yue, F. Huo, F. Cheng, X. Zhu, T. Mafireyi, R. M. Strongin and C. Yin, Chem. Soc. Rev., 2019, 48, 4155 Search PubMed; (k) Y. Tang, Y. Ma, J. Yin and W. Lin, Chem. Soc. Rev., 2019, 48, 4036 Search PubMed.
- (a) B. Valeur and I. Leray, Coord. Chem. Rev., 2000, 205, 3 Search PubMed; (b) A. P. de Silva, H. Q. N. Gunaratne, T. Gunnlaugsson, A. J. M. Huxley, C. P. McCoy, J. T. Rademacher and T. E. Rice, Chem. Rev., 1997, 97, 1515 Search PubMed; (c) S. Cai, C. Liu, X. Jiao, S. He, L. Zhao and X. Zeng, Org. Biomol. Chem., 2020, 18, 1148 Search PubMed; (d) S. Cai, C. Liu, X. Jiao, L. Zhao and X. Zeng, J. Mater. Chem. B, 2020, 8, 2269 Search PubMed; (e) H. Li, Y. Li, Q. Yao, J. Fan, W. Sun, S. Long, K. Shao, J. Du, J. Wang and X. Peng, Chem. Sci., 2019, 10, 1619 Search PubMed; (f) N. Kaur, S. Chopra, G. Singh, P. Raj, A. Bhasin, S. K. Sahoo, A. Kuwar and N. Singh, J. Mater. Chem. B, 2018, 6, 4872 Search PubMed; (g) T. Chen, Z. Chen, R. Liu and S. Zheng, Org. Biomol. Chem., 2019, 17, 6398 Search PubMed.
- (a) L. Zhang, S. Peng, J. Sun, J. Yao, J. Kang, Y. Hu and J. Fang, Chem. Sci., 2017, 8, 2966 Search PubMed; (b) N. Makukhin, V. Tretyachenko, J. Moskovitz and J. Míšek, Angew. Chem., 2016, 128, 12919 Search PubMed; (c) L. Zhang, S. Peng, J. Sun, R. Liu, S. Liu and J. Fang, Chem. Commun., 2019, 55, 1502 Search PubMed; (d) M. Xiang, H. Huang, X. Liu, Z. Tong, C. Zhang, F. Wang, R. Yu and J. Jiang, Anal. Chem., 2019, 91, 5489 Search PubMed.
- (a) Z. Q. Guo, S. Park, J. Yoon and I. Shin, Chem. Soc. Rev., 2014, 43, 16 Search PubMed; (b) R. Weissleder and V. Ntziachristos, Nat. Med., 2003, 9, 123 Search PubMed; (c) C. Liu, Q. Wang, X. Jiao, H. Yao, S. He, L. Zhao and X. Zeng, Dyes Pigm., 2019, 160, 989 Search PubMed; (d) C. Liu, X. Jiao, Q. Wang, K. Huang, S. He, L. Zhao and X. Zeng, Chem. Commun., 2017, 53, 10727 Search PubMed.
- A. Kaya, A. Koc, B. C. Lee, D. E. Fomenko, M. Rederstorff, A. Krol, A. Lescure and V. N. Gladyshev, Biochemistry, 2010, 49, 8618 Search PubMed.
- S. Vougier, J. Mary and B. Friguet, Biochem. J., 2003, 373, 531 Search PubMed.
- J. Moskovitz, H. Weissbach and N. Brot, Proc. Natl. Acad. Sci. U. S. A., 1996, 93, 2095 Search PubMed.
- (a) Q. Wang, K. Huang, S. Cai, C. Liu, X. Jiao, S. He, L. Zhao and X. Zeng, Org. Biomol. Chem., 2018, 16, 7163 Search PubMed; (b) J. Gong, C. Liu, X. Jiao, S. He, L. Zhao and X. Zeng,, J. Mater. Chem. B, 2020, 8, 2343 Search PubMed.
- D. Brunell, H. Weissbach, P. Hodder and N. Brot, Assay Drug Dev. Technol., 2010, 8, 615 Search PubMed.
- (a) L. Wang, Y. Xiao, W. Tian and L. Deng, J. Am. Chem. Soc., 2013, 135, 2903 Search PubMed; (b) Q. Zhou, B. Xin, Y. Wang, C. Li, Z. Chen, Q. Yu, Z. Huang and M. Zhu, Chem. Commun., 2018, 54, 3617 Search PubMed.
- J. Qin, H. Yao, S. He and X. Zeng, RSC Adv., 2016, 6, 75570 Search PubMed.
Footnote |
| † Electronic supplementary information (ESI) available. See DOI: 10.1039/d0ma00489h |
| This journal is © The Royal Society of Chemistry 2020 |


