 Open Access Article
Creative Commons Attribution 3.0 Unported Licence
Lithium-ion battery performance enhanced by the combination of Si thin flake anodes and binary ionic liquid systems†
Kei
Hosoya
a,
Toshiki
Kamidaira
a,
Tetsuya
Tsuda
 *a,
Akihito
Imanishi
b,
Masakazu
Haruta
 c,
Takayuki
Doi
 c,
Minoru
Inaba
c and
Susumu
Kuwabata
*a
aDepartment of Applied Chemistry, Graduate School of Engineering, Osaka University, 2-1 Yamada-oka, Suita, Osaka 565-0871, Japan. E-mail: kuwabata@chem.eng.osaka-u.ac.jp; ttsuda@chem.eng.osaka-u.ac.jp
bDepartment of Chemistry, Graduate School of Engineering Science, Osaka University, 1-3 Machikaneyama, Toyonaka, Osaka 560-8531, Japan
cDepartment of Molecular Chemistry and Biochemistry, Doshisha University, 1-3 Tatara Miyakodani, Kyotanabe, Kyoto 610-0321, Japan
First published on 5th June 2020
Abstract
The use of ionic liquid (IL)-based electrolytes is one of the methods for solving various problems that pertain to large-capacity anodes, such as Si and Li, for next-generation lithium ion batteries (LIBs). There is insufficient information about the combination of such anodes and IL electrolytes. In the present study, a Si thin flake, which is one of the promising Si anode active materials, and binary IL electrolytes, 83.3–16.7 mol% 1-ethyl-3-methylimidazolium (bis((fluorosulfonyl)amide)) ([C2mim][FSA])–lithium bis(trifluoromethanesulfonyl)amide (Li[TFSA]), 83.3–16.7 mol% [C2mim][FSA]–lithium (bis((fluorosulfonyl)amide)) (Li[FSA]), and 50.0–50.0 mol% [C2mim][FSA]–Li[FSA], were used for collecting various information on the battery performance, morphology variation of the Si thin flake, and chemical species in the solid electrolyte interface (SEI) layer. Operando scanning electron microscopy (SEM) and ex situ X-ray photoelectron spectroscopy (XPS) revealed that the SEI layer composition depends on the Li salt species and that their molar fractions in the binary IL electrolytes strongly affect the morphology variation in the Si thin flakes during the charge process. When the favorable Li conductive components, e.g., LiF and Li3N, were abundantly contained in the SEI layer, the charge and discharge behavior of the Si thin flake anode was greatly improved. The best battery performance was obtained by the combination of the Si thin flake composite anode and the 50.0–50.0 mol% [C2mim][FSA]–Li[FSA]. Discharge capacity above 1100 mA h g−1 was achieved even after 500 cycles under the charge and discharge conditions at a 3C rate.
Introduction
A secondary battery with high capacity and favorable rate capability that exceeds the current Li-ion battery (LIB), which consists of a graphite anode and a lithium-transition metal oxide cathode, is expected to be the future energy storage device supporting smart grid communities, electric vehicles, and Internet of Things (IoT) technology.1,2 One such battery is the Si anode type LIB as Si has a very high theoretical capacity (3579 mA h g−1), which is comparable to that of the Li metal anode (3860 mA h g−1). However, during the charge–discharge processes, the Si anode suffers from a dramatic volume change that often causes Si pulverization accompanied by the conductive path loss, resulting in the rapid fading of battery capacity. Several approaches for overcoming this issue have already been proposed. Nanoscale morphology designs of Si materials, such as nanowires,3,4 nanotubes,5 thin films,6 and thin flakes,7,8 are highly effective. Recently, it was revealed by in situ and operando scanning electron microscopy (SEM)9 that the addition of flexibility to the Si material by nanoscale material tailoring is an important factor for suppressing the degradation. Another approach for improving capacity fading is to use organic additives, such as 4-fluoroethylene carbonate (FEC) and vinylene carbonate (VC), as a component of the battery electrolyte. For example, the capacity retention rate was improved from 17% without an additive to 60% with FEC and 74% with VC due to the variation in chemical species and their compositions in the solid electrolyte interface (SEI), which form a physicochemically stable and good Li-ion conducting SEI layer on the Si anode.10Ionic liquids (ILs), which are liquid salts at room temperature, have great potential as advanced electrolytes for LIBs because of their various unique properties including wide electrochemical window, negligible vapor pressures, nonflammability, and good thermal stability.11,12 In particular, bis((fluorosulfonyl)amide) anion ([FSA]−)-based IL electrolytes have been widely used for Si anode LIBs, as [FSA]− contributes to the formation of a favorable SEI layer onto the Si anode.13–16 However, there is insufficient information on the effect of the Li(I) and [FSA]− concentration in the IL electrolyte on the battery performance although it is known that the aqueous and organic battery electrolytes become more favorable at higher Li salt concentrations (in many cases, up to 50 mol%).17–21
In the present study, in order to improve the cycle characteristics and high-rate charge–discharge performance of the Si anode LIBs, the effects of the Li salt species, Li[FSA], and lithium bis((trifluorosulfonyl)amide) (Li[TFSA]), and their molar fraction in the binary electrolytes of 1-ethyl-3-methylimidazolium (bis((fluorosulfonyl)amide)) ([C2mim][FSA])–Li[FSA] and [C2mim][FSA]–Li[TFSA] on the Si thin flake composite anode are examined by evaluating the battery performance and analyzing the battery reactions through operando SEM9,22 and ex situ X-ray photoelectron spectroscopy (XPS). The combination of the Si anode and IL electrolyte is proposed for designing a high-performance Si anode LIB that has the potential to be the future of energy storage devices.
Experimental
Preparation and evaluation of Si composite anode LIBs
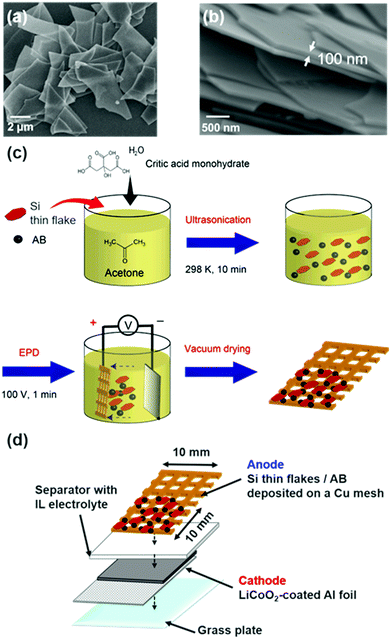
A Si thin flake (Si-LeafPowder®, OIKE & Co., Ltd (Japan)), with vertical and horizontal sizes of 3–5 μm (Fig. 1a) and a thickness of 100 nm (Fig. 1b), was used as an active anode material. A composite electrode containing an 83.3 wt% Si thin flake, a 5.6 wt% conductive additive (Ketjen Black (KB), EC600JD, Lion Corp. (Japan)), and a 11.1 wt% water soluble binder (carboxymethyl cellulose sodium salt (NaCMC), Nacalai Tesque (Japan)) was prepared by the procedure used in a previous study.7 The mass loading of the Si-LPs on the current collector was 0.4–0.5 mg cm−2. CR2032-type coin full cells were constructed by stacking the Si composite anode, a polyolefin separator (Nippon Sheet Glass Co., Ltd (Japan)), and a LiCoO2 composite cathode with an Al foil current collector (3.0 mA h cm−2, Hohsen (Japan)) in an Ar-filled glove box (Omni-Lab, Vacuum Atmospheres Co. (USA), O2 and H2O < 1 ppm). The quantitative ratio between the cathode and the anode materials was set so that the actual capacity of the LiCoO2 electrode was more than twice the theoretical capacity of the Si composite electrode. The electrolytes used were binary IL systems: 83.3–16.7 mol% [C2mim][FSA]–Li[TFSA]; 83.3–16.7 mol% [C2mim][FSA]–Li[FSA]; and 50.0–50.0 mol% [C2mim][FSA]–Li[FSA]. These electrolytes were prepared by adding a given amount of Li[TFSA] (Morita Chemical Industries Co., Ltd (Japan)) or Li[FSA] (Nippon Shokubai Co., Ltd (Japan)) to [C2mim][FSA] (Kanto Chemical Co., Inc. (Japan)) in an Ar-filled glove box. The charge–discharge tests were conducted at 298 K in a constant current/constant voltage (CC/CV) mode between −3.88 and −2.40 V (vs. LiCoO2) using a battery test system (HJ1001SD8, Hokuto Denko (Japan)). The cut-off current for the CV mode was 1/10, the same as that for the CC mode. Unless otherwise noted, the discharge capacity per Si weight is represented as mA h g−1 in this paper.Characterization of the SEI layer formed on Si anodes
A SEI layer formed on Si anodes was characterized by an XPS system (AXIS Ultra DLD, Kratos (UK)). Ex situ XPS analyses were conducted using the Si thin flake composite anodes after five charge–discharge processes. The process was performed in CC mode of 1/2C in the coin-type full cell described above. The resultant Si anodes were rinsed with a battery-grade diethyl carbonate (DEC, Wako (Japan)) in an Ar-filled glove box. XPS measurements were carried out using an airtight transfer vessel to prevent contamination from moisture and oxygen in air.Preparation of Si anodes for operando SEM observations
A binder-free Si thin flake anode with a conductive additive (acetylene black (AB), Strem Chemicals (USA)) was prepared using an electrophoretic deposition (EPD) method, as depicted in Fig. 1c.9,23 The solution for the EPD process was a dry acetone solution containing a 1.00 g L−1 Si thin flake, 0.40 g L−1 AB, and 1.00 g L−1 citric acid monohydrate (Wako (Japan)) which was sonicated for 20 min prior to use. A Cu mesh (20 mesh, Nilaco Co. (Japan))and a Pt plate were used as the anode and cathode, respectively. A voltage of 100 V was applied between the electrodes that were set 2 cm apart, for 60 s to carry out EPD. Si thin flakes and AB co-deposited Cu mesh electrodes were dried at 353 K under a vacuum over 6 hours to strengthen the adhesion of the Si materials.Operando SEM experiments
An operando SEM observation of the binder-free Si anodes was performed using a two-electrode type full cell with a mesh-type anode, a LiCoO2 composite cathode with an Al foil current collector (3.0 mA h cm−2, Hohsen (Japan)), and glass microfiber filter separators (GF/A, Whatman (UK)) with IL electrolytes (Fig. 1d). The three types of binary ILs described above were used as the electrolyte. A commonly used SEM observation system (S-3400N, Hitachi (Japan)) was converted into an operando system by equipping a feed-through terminal, which enables electrochemical measurements in the SEM chamber, with an original SEM system. All the operando experiments were conducted in the vacuum chamber of the SEM system.24 The variation in morphology in the Si anode during the charge–discharge processes in CC/CV mode was observed by a secondary electron image mode. The charge–discharge rate was 1/2C. The cut-off voltages were −3.88 and −2.40 V (vs. LiCoO2), and at the cut-off voltages, the cut-off current was maintained until the 1/20C rate was achieved. The electrochemical experimental conditions were controlled with a potentiostat/galvanostat (VersaSTAT 4, Princeton Applied Research (USA)).Results and discussion
Performance of Si thin flake composite anode LIBs with different binary IL electrolytes
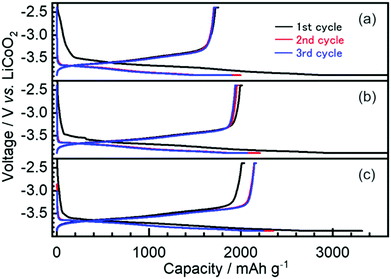
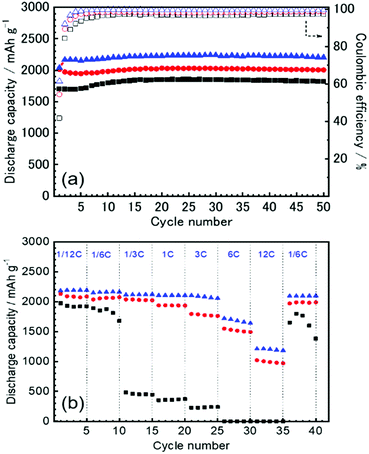
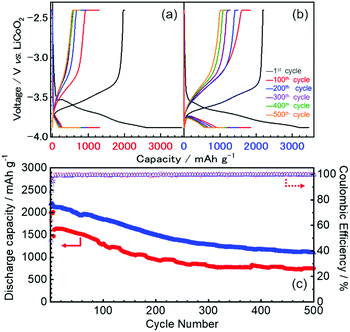
The first three cycles of the charge–discharge profiles recorded at the Si thin flake composite anodes in the coin-type cells with (a) 83.3–16.7 mol% [C2mim][FSA]–Li[TFSA], (b) 83.3–16.7 mol% [C2mim][FSA]–Li[FSA], and (c) 50.0–50.0 mol% [C2mim][FSA]–Li[FSA] IL electrolytes are shown in Fig. 2. In each charge–discharge curve, distinct plateaus related to the lithiation/delithiation reactions for the Si thin flake appeared. The curves slightly varied with the IL electrolyte conditions. Under the same Li salt molar fraction (Fig. 2a and b), a better discharge capacity was obtained in the 83.3–16.7 mol% [C2mim][FSA]–Li[FSA] electrolyte (ca. 1900 mA h g−1 at third cycle). Under a higher Li[FSA] molar fraction condition, i.e., 50.0–50.0 mol% [C2mim][FSA]–Li[FSA], the highest discharge capacity of over 2100 mA h g−1 was obtained at the third cycle. In fact, similar experiments were also carried out using the 50.0–50.0 mol% [C2mim][FSA]–Li[TFSA] electrolyte, but a reversible lithiation reaction was not observed due to the unstable SEI layer formed on the Si anode, as reported by Ishikawa et al.13 in a previous paper. These results suggest that [FSA]− is deeply involved in the improvement of cell performance. Fig. 3a indicates the cyclability of the Si anode up to 50 cycles in the three promising electrolytes. As expected from Fig. 2, the highest discharge capacity (2200 mA h g−1 at 50th cycle) and coulomb efficiency (>99.5%) were obtained in the 50.0–50.0 mol% [C2mim][FSA]–Li[FSA] electrolyte. The discharge capacity at different current rates is shown in Fig. 3b. The rate characteristics greatly depend on the IL electrolyte species. In the 83.3–16.7 mol% [C2mim][FSA]–Li[TFSA] electrolyte, a large capacity drop appeared at 1/3C, whereas most of the capacity was maintained in the two binary IL electrolytes containing Li[FSA] even at 1C. Surprisingly, in the 50.0–50.0 mol% [C2mim][FSA]–Li[FSA] electrolyte, outstanding discharge capacities over 2100 mA h g−1 were obtained at 3C. Such superior high rate charge–discharge behavior was caused by both the high Li(I) carrier density (ca. 3.40 mol L−1 at 298 K, cf., ca. 0.91 mol L−1 at 298 K in 83.3–16.7 mol% [C2mim][FSA]–Li[FSA]. [This value was estimated from Table S1 (ESI†) and the molecular weight of the ILs as calculated in ref. 25]) and the electrochemically stable SEI layer formation on the anode.Considering the rate capability shown in Fig. 3b, the binary [C2mim][FSA]–Li[FSA] IL system seems to be the most suitable as the LIB electrolyte. Fig. 4 summarizes the charge–discharge behavior of the Si thin flake composite anodes in the coin-type cell with 83.3–16.7 mol% and 50.0–50.0 mol% [C2mim][FSA]–Li[FSA] ILs at a 3C rate. It should be noted that the first five cycles were conducted at 1/6C to form a better SEI layer on the Si anode. Although their discharge capacities differ by ca. 500 mA h g−1, the discharge capacity profile itself is very similar. A higher capacity was attained in the cell with the 50.0–50.0 mol% IL and a favorable discharge capacity of over 1100 mA h g−1 was maintained even after 500 cycles. Except the first five cycles conducted at 1/6C, the average values of the coulomb efficiency were 99.4% and 99.7% for the 83.3–16.7 mol% IL and 50.0–50.0 mol% IL, respectively. These outstanding performances seem to meet the requirements of the LIB industry.
XPS analysis of SEI layers formed on Si thin flake anodes
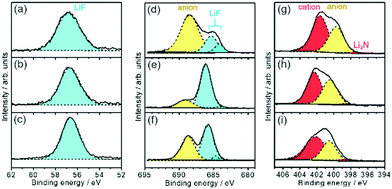
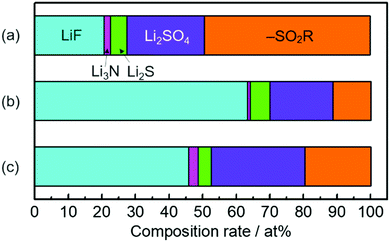
The higher capacity of the Si thin flake composites was achieved in the coin-type full cells with binary [C2mim][FSA]–Li[FSA] IL electrolytes, in particular, 50.0–50.0 mol% [C2mim][FSA]–Li[FSA]. In order to clarify the reason for this, further information on the SEI layer formed on the Si thin flake anode was collected via ex situ XPS for finding out information on the SEI layer formed on a Si anode.26–28 In the IL electrolytes used in the present study, the SEI layer is believed to be generated by the decomposition of FSA and TFSA anions.14,16,29–33Fig. 5 and Fig. S1 (ESI†) show XPS spectra for Li-1s, F-1s, N-1s, and S-2p on the Si composite anodes taken after five charge–discharge cycles. The electrolytes used were 83.3–16.7 mol% [C2mim][FSA]–Li[TFSA], 83.3–16.7 mol% [C2mim][FSA]–Li[FSA], and 50.0–50.0 mol% [C2mim][FSA]–Li[FSA]. The XPS spectra allowed us to deduce the chemical composition of the SEI layers. F-1s and N-1s spectra show the existence of anions and cations30 of each IL but their peak intensity ratio in the N-1s spectra suggests that their appearance was due to residual ILs at the SEI surface. Li-1s and F-1s spectra provide LiF16 as a component of the SEI layer. However, the deconvolution of the LiF peak in the F-1s spectrum results in the appearance of two peaks, implying that there are LiF components staying in different chemical environments as previously reported.16 Both components are clearly observed for the SEI prepared in IL containing Li[TFSA] but in the SEI layer prepared in the electrolyte containing only [FSA]− the LiF component with a higher binding energy is dominant. Such differences suggest that the chemical environment around LiF, which makes the binding energy stronger, is more easily created if only [FSA]− is present in the electrolyte. The deconvolution of the N-1s spectrum provides an ill-defined spectrum assignable to Li3N (398.1 eV), which is known as one of the SEI components having high Li-ion conductivity.30,31 The fact that the abundance of Li3N was the highest in the SEI layer prepared in 50.0–50.0 mol% [C2mim][FSA]–Li[FSA] (see Fig. 6 and Table S2, ESI†), indicates that such SEI composition is important to get a higher performance out of the full cell with this IL electrolyte, as will be discussed later. Besides, –SO2R (168.9 eV and 170.1 eV),33 Li2SO4 (167.2 and 168.1 eV),16,33 and Li2S based components (162.1–165.3 eV),16 that have no clear role on battery performance improvement, were also confirmed (Fig. S1, ESI†).Fig. 6 shows the relationship between the chemical species and their composition ratios contained in the SEI layers generated in each IL electrolyte. The detailed data are given in Table S2 (ESI†) and their physical properties are summarized in Table S3 (ESI†). In 83.3–16.7 mol% [C2mim][FSA]–Li[TFSA], the composition rate of Li-ion conductive chemical species, i.e., LiF and Li3N, contained in the SEI layer is less than 23 at%. Meanwhile, when [C2mim][FSA]–Li[FSA] was used, LiF, having favorable Li ion conductivity and a high shear modulus, became the major component in the SEI layer. At higher Li[FSA] concentration in the IL system, the abundance ratio of Li3N, which has both a superior Li ion conductivity and mechanical strength, slightly increased, while that of LiF decreased. Interestingly, the Li ion conductivity for Li3N is more than 150 times higher than that for LiF.
Operando SEM observation of Si thin flake anodes
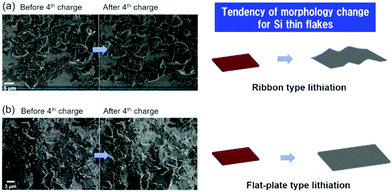
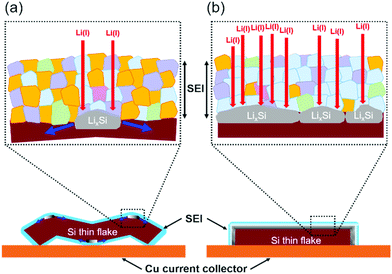
Fig. 7 shows the SEM images of the binder-free Si thin flake anode taken in the LIB full cells with the 83.3–16.7 mol% [C2mim][FSA]–Li[TFSA] and 83.3–16.7 mol% [C2mim][FSA]–Li[FSA] IL electrolytes before and after the 4th charge process. Here, we also conducted the same experiment in the 50.0–50.0 mol% [C2mim][FSA]–Li[FSA] IL, however it was difficult to obtain clear SEM images because the SEM image quality of the IL-covered specimen strongly depends on the density of the ILs, i.e., at higher density, the image quality degrades.34 As indicated in Table S1 (ESI†), the 50.0–50.0 mol% electrolyte has a higher density than the other two electrolytes. Thus, only two results obtained in the 83.3–16.7 mol% IL electrolytes including the movies by operando SEM observation during the charge process (Movies S1 and S2, ESI†) are further discussed in this paper. As shown in a previous paper, there are two types of changes in morphology, ribbon type lithiation and flat-plate type lithiation, during the charge process of the Si thin flakes.9 In this study, operando SEM observations reveal that the lithiation behavior depends on the IL electrolyte species. In the 83.3–16.7 mol% [C2mim][FSA]–Li[TFSA] electrolyte, many wrinkles appeared after the lithiation (ribbon type lithiation, Fig. 7a). On the other hand, when 83.3–16.7 mol% [C2mim][FSA]–Li[FSA] was used as the electrolyte, and even though the Si flakes were temporarily bent during the lithiation process, they eventually expanded in the two-dimensional direction with almost no wrinkles after the process (flat-plate type lithiation, Fig. 7b). Considering these new findings obtained from the ex situ XPS and the operando SEM observation, when the major components in the SEI layer are good Li ion conductors with a sufficient shear modulus (e.g., LiF and Li3N), that is, [C2mim][FSA]–Li[FSA] IL is used as an electrolyte, the change in morphology tends to be controlled by the flat-plate type lithiation. This means that the lithiation process uniformly proceeds during the charge process due to the SEI layer containing more LiF and Li3N components. This is the reason why the Si thin flake composite anode LIB cell with [C2mim][FSA]–Li[FSA] shows an interesting battery performance. In contrast, the outstanding rate capability obtained with the 50.0–50.0 mol% [C2mim][FSA]–Li[FSA] electrolyte is due to the effect of both higher Li(I) carrier density and higher abundance ratio of Li3N, which has a very high Li(I) conductivity (1 × 10⁻³ S cm−1 at 300 K,35cf. LiF: 6 × 10⁻⁶ S cm−1 at 323 K36), in the SEI layer.Based on the findings of this study, schematic illustrations of a plausible lithiation mechanism on the Si thin flake in the binary [C2mim][FSA]–Li[TFSA] and [C2mim][FSA]–Li[FSA] IL electrolytes are depicted in Fig. 8. Blue, pink, purple, green, and orange parts indicate the chemical components of LiF, Li3N, Li2SO4, Li2S, and sulfone contained in the SEI layer, respectively. In cases where the [C2mim][FSA]–Li[TFSA] electrolyte is used, favorable Li(I) conductive components, LiF and Li3N, do not distribute uniformly in the SEI layer as they are not the major components. This caused an inhomogeneous lithiation of the Si thin flakes and thus, the morphology is a ribbon-like structure (Fig. 8a). Meanwhile, in the [C2mim][FSA]–Li[FSA] electrolyte, since the major components are LiF and Li3N, Li(I) can uniformly diffuse via those components to the Si flakes and the lithiation reaction proceeds homogeneously. Consequently, the Si thin flakes isotropically expand during the charge process (Fig. 8b). It should be remembered that these components also have a desirable shear which can contribute to the improvement of the SEI layer strength.
Conclusions
The effects of the Li salt species, Li[FSA] and Li[TFSA], and their molar fraction in the binary [C2mim][FSA]–Li[FSA] and [C2mim][FSA]–Li[TFSA] IL electrolytes on the Si thin flake composite anode were investigated by evaluating the battery performance and analyzing the battery reactions. Among the LIB full cells prepared in this study, the best combination of the Si thin flake composite anode and the binary 50.0–50.0 mol% [C2mim][FSA]–Li[FSA] IL electrolyte, achieved a discharge capacity of 1100 mA h g−1 even after 500 cycles at 3C rate. The combinatorial analysis by ex situ XPS analysis and operando SEM observation revealed the reasons behind the Si thin flake composite anode LIB full cells with [C2mim][FSA]–Li[FSA] showing outstanding battery performances, such as good cyclability and high rate capability. The differences of morphological variations in Si thin flakes during the charge process are attributable to the chemical species contained in the SEI layer and their abundance ratios. The approach reported in this paper can effectively enhance the battery performance through the combination of active materials and IL electrolytes and is a novel LIB design methodology.Conflicts of interest
There are no conflicts to declare.Acknowledgements
This research was partially supported by the Advanced Low Carbon Technology Research and Development Program (ALCA) for Specially Promoted Research for Innovative Next Generation Batteries (SPRING) (grant number JPMJAL1301), the Japan Science and Technology Agency (JST) and the JST-MIRAI program (grant number JPMJMI17E9). The silicon thin flakes (Si LeafPowder®) were provided by OIKE & Co., Ltd (Kyoto, Japan).References
- R. Schmuch, R. Wagner, G. Hörpel, T. Placke and M. Winter, Nat. Energy, 2018, 3, 267–278 CrossRef CAS.
- M. Armand and J. M. Tarascon, Nature, 2008, 451, 652–657 CrossRef CAS PubMed.
- C. K. Chan, H. Peng, G. Liu, K. McIlwrath, X. F. Zhang, R. A. Huggins and Y. Cui, Nat. Nanotechnol., 2008, 3, 31–35 CrossRef CAS PubMed.
- M. Ge, J. Rong, X. Fang and C. Zhou, Nano Lett., 2012, 12, 2318–2323 CrossRef CAS PubMed.
- H. Wu, G. Chan, J. W. Choi, I. Ryu, Y. Yao, M. T. McDowell, S. W. Lee, A. Jackson, Y. Yang, L. Hu and Y. Cui, Nat. Nanotechnol., 2012, 7, 310–315 CrossRef CAS PubMed.
- J. Graetz, C. C. Ahn, R. Yazami and B. Fultz, Electrochem. Solid-State Lett., 2003, 6, A194 CrossRef CAS.
- M. Saito, T. Yamada, C. Yodoya, A. Kamei, M. Hirota, T. Takenaka, A. Tasaka and M. Inaba, Solid State Ionics, 2012, 225, 506–509 CrossRef CAS.
- T. Okubo, M. Saito, C. Yodoya, A. Kamei, M. Hirota, T. Takenaka, T. Okumura, A. Tasaka and M. Inaba, Solid State Ionics, 2014, 262, 39–42 CrossRef CAS.
- C.-Y. Chen, T. Sano, T. Tsuda, K. Ui, Y. Oshima, M. Yamagata, M. Ishikawa, M. Haruta, T. Doi, M. Inaba and S. Kuwabata, Sci. Rep., 2016, 6, 36153 CrossRef CAS PubMed.
- M. Haruta, R. Hioki, T. Moriyasu, A. Tomita, T. Takenaka, T. Doi and M. Inaba, Electrochim. Acta, 2018, 267, 94–101 CrossRef CAS.
- D. R. MacFarlane, N. Tachikawa, M. Forsyth, J. M. Pringle, P. C. Howlett, G. D. Elliott, J. H. Davis, M. Watanabe, P. Simon and C. A. Angell, Energy Environ. Sci., 2014, 7, 232–250 RSC.
- M. Armand, F. Endres, D. R. MacFarlane, H. Ohno and B. Scrosati, Nat. Mater., 2009, 8, 621–629 CrossRef CAS PubMed.
- T. Sugimoto, Y. Atsumi, M. Kono, M. Kikuta, E. Ishiko, M. Yamagata and M. Ishikawa, J. Power Sources, 2010, 195, 6153–6156 CrossRef CAS.
- B. Philippe, R. Dedryvere, M. Gorgoi, H. Rensmo, D. Gonbeau and K. Edstrom, J. Am. Chem. Soc., 2013, 135, 9829–9842 CrossRef CAS PubMed.
- E. Markevich, G. Salitra, A. Rosenman, Y. Talyosef, D. Aurbach and A. Garsuch, RSC Adv., 2014, 4, 48572–48575 RSC.
- D. Molina Piper, T. Evans, K. Leung, T. Watkins, J. Olson, S. C. Kim, S. S. Han, V. Bhat, K. H. Oh, D. A. Buttry and S. H. Lee, Nat. Commun., 2015, 6, 6230 CrossRef PubMed.
- J. Wang, Y. Yamada, K. Sodeyama, E. Watanabe, K. Takada, Y. Tateyama and A. Yamada, Nat. Energy, 2017, 3, 22–29 CrossRef.
- Y. Yamada, K. Usui, K. Sodeyama, S. Ko, Y. Tateyama and A. Yamada, Nat. Energy, 2016, 1, 16129 CrossRef CAS.
- J. Qian, W. A. Henderson, W. Xu, P. Bhattacharya, M. Engelhard, O. Borodin and J. G. Zhang, Nat. Commun., 2015, 6, 6362 CrossRef CAS PubMed.
- K. Yoshida, M. Nakamura, Y. Kazue, N. Tachikawa, S. Tsuzuki, S. Seki, K. Dokko and M. Watanabe, J. Am. Chem. Soc., 2011, 133, 13121–13129 CrossRef CAS PubMed.
- Y. Yamada, K. Furukawa, K. Sodeyama, K. Kikuchi, M. Yaegashi, Y. Tateyama and A. Yamada, J. Am. Chem. Soc., 2014, 136, 5039–5046 CrossRef CAS PubMed.
- T. Tsuda, K. Hosoya, T. Sano and S. Kuwabata, Electrochim. Acta, 2019, 319, 158–163 CrossRef CAS.
- Y. Yang, D. Chen, B. Liu and J. Zhao, ACS Appl. Mater. Interfaces, 2015, 7, 7497–7504 CrossRef CAS PubMed.
- T. Tsuda, T. Kanetsuku, T. Sano, Y. Oshima, K. Ui, M. Yamagata, M. Ishikawa and S. Kuwabata, Microscopy, 2015, 64, 159–168 CrossRef CAS PubMed.
- A. F. Armand, Jr., L. A. King, J. A. Levisky and J. S. Wilkes, J. Phys. Chem., 1984, 88, 2609–2614 CrossRef.
- B. Philippe, R. Dedryvère, M. Gorgoi, H. Rensmo, D. Gonbeau and K. Edström, Chem. Mater., 2013, 25, 394–404 CrossRef CAS.
- A. Kohandehghan, P. Kalisvaart, K. Cui, M. Kupsta, E. Memarzadeh and D. Mitlin, J. Mater. Chem. A, 2013, 1, 12850 RSC.
- L. Chen, K. Wang, X. Xie and J. Xie, J. Power Sources, 2007, 174, 538–543 CrossRef CAS.
- G. M. A. Girard, M. Hilder, N. Dupre, D. Guyomard, D. Nucciarone, K. Whitbread, S. Zavorine, M. Moser, M. Forsyth, D. R. MacFarlane and P. C. Howlett, ACS Appl. Mater. Interfaces, 2018, 10, 6719–6729 CrossRef CAS PubMed.
- M. Olschewski, R. Gustus, O. Höfft, A. Lahiri and F. Endres, J. Phys. Chem. C, 2017, 121, 2675–2682 CrossRef CAS.
- F. Buchner, M. Bozorgchenani, B. Uhl, H. Farkhondeh, J. Bansmann and R. J. Behm, J. Phys. Chem. C, 2015, 119, 16649–16659 CrossRef CAS.
- S. Uchida, U. Imamura and M. Ishikawa, Electrochemistry, 2018, 86, 29–31 CrossRef CAS.
- S. Xiong, K. Xie, E. Blomberg, P. Jacobsson and A. Matic, J. Power Sources, 2014, 252, 150–155 CrossRef CAS.
- T. Tsuda, E. Mochizuki, S. Kishida, K. Iwasaki, K. Tsunashima and S. Kuwabata, PLoS One, 2014, 9, e91193 CrossRef PubMed.
- U. v. Alpen, A. Rabenau and G. H. Talat, Appl. Phys. Lett., 1977, 30, 621–623 CrossRef.
- C. Li, L. Gu and J. Maier, Adv. Funct. Mater., 2012, 22, 1145–1149 CrossRef CAS.
Footnote |
| † Electronic supplementary information (ESI) available: Additional data (Fig. S1, Tables S1–S3, and Movies S1 and S2) and captions for Movies. See DOI: 10.1039/d0ma00296h |
| This journal is © The Royal Society of Chemistry 2020 |

