 Open Access Article
Creative Commons Attribution 3.0 Unported Licence
A low-cost and Li-rich organic coating on a Li4Ti5O12 anode material enabling Li-ion battery cycling at subzero temperatures†
Nicolas
Delaporte
a,
Pascale
Chevallier
b,
Sylviane
Rochon
a,
Gilles
Lajoie
a,
Jean-Christophe
Daigle
a,
Vincent
Gariepy
a,
Daniel
Clément
a,
René
Veillette
a,
Marie-Claude
Mathieu
a,
Manon
Provencher
a,
Michel L.
Trudeau
a and
Karim
Zaghib
 *a
*a
aCenter of Excellence in Transportation, Electrification and Energy Storage, 1806 Bd. Lionel-Boulet, Varennes, QC, Canada. E-mail: Zaghib.Karim@hydro.qc.ca
bResearch center of the CHU de Québec – Laval University, St François d’Assise, 10 Espinay St., Quebec city, QC, Canada
First published on 22nd June 2020
Abstract
In this paper, we report the surface modification of the Li4Ti5O12 (LTO) anode material with a freshly prepared Li-rich PTCLi4 organic molecule using a spray-dryer technique. In addition, burning the resulting powder yielded an electrode material with a few-nanometer-thick carbon coating. For comparison, carbon-coated LTO powder was prepared with graphene oxide (GO) using the same protocol. Organic molecules were first characterized using FTIR, XPS, TGA, XRD, and SEM methods. PTCLi4-coated LTO powders were observed via SEM and the corresponding EDX mapping as well as micro-Raman and XPS spectroscopic analyses confirmed the efficient surface coverage of the anode material. After the burning, a graphitic-like carbon coating with an ID/IG of approximately 0.76 and a thickness of a few nanometers was confirmed by TEM observations. Thermogravimetric analyses revealed that the content of carbon varied from 0.3 to 1.5 wt%, depending on the reaction conditions and material used (i.e., PTCLi4 or GO). Interestingly, electrochemical cycling at 25 °C of PTCLi4-coated LTO electrodes gave rise to superior performance compared to that of the pristine electrode, especially at high C-rates, and carbon-coated electrodes showed intermediate performance. Most importantly, the good cyclability of PTCLi4-coated LTO electrodes was observed with a specific capacity of 145 mA h g−1 after 100 cycles at a C/2 rate with an average coulombic efficiency of 100%. XPS analyses performed on aged electrodes revealed a low degradation of the electrolyte with a lower concentration of LiF on the surface of the PTCLi4-coated LTO electrodes. Finally, the cycling of LTO electrodes demonstrated the potential of using the PTCLi4 coating to increase the Li-ion transfer at the electrode–electrolyte interface at subzero temperatures. In fact, the PTCLi4-coated LTO electrode delivered almost the same specific capacity at a C/2 rate when cycled at –20 °C as the pristine electrode cycled at 25 °C.
1. Introduction
Since the introduction of Li-ion batteries to the market by Sony in 1991,1 the use of this battery has proliferated; now, owing to radical changes in the environment, electrical vehicle (EV) and energy storage (ES) are becoming increasingly popular for limiting greenhouse gas emissions and climate change. Therefore, many materials have been investigated to enhance the performance of cells, irrespective of the operational conditions or different uses.It is believed that lithium titanium oxide (LTO) is an ideal candidate material to meet all the requirements for a battery system, including safety, long cycle life, and rapid charging/discharging.2–7 However, one aspect remains as an obstacle preventing the realization of its full potential, namely, the intrinsic limitations of LTO, such as its low electrical conductivity and poor electrochemical performance temperatures below 0 °C. LTO is an insulator material and several strategies have been explored to overcome its low ionic and electronic conductivities, including carbon coating,8–13 the miniaturization of particles,14–19 and doping.20,21 However, despite these efforts, the low-temperature performance is still inadequate and can be a source of danger,22 especially when low-temperature electrolytes are used.6,22
Many groups have proposed alternative strategies to enhance ionic conductivity and lithium diffusion. Controlling the nature of the binder is one of the economical ways to enhance the electrochemical performance of electrodes at high C-rates and low temperatures. For example, poly(acrylic acid) neutralized with Li can effectively reduce the resistance of an electrode, enhancing its adhesion and the cycle life.23–25 Another recurrent problem is the inability to effectively disperse carbon and active particles and create a uniform solid electrolyte interface (SEI) on active particles.26–28 The perfect covering of all single LTO particles reported by Daigle et al.13 dramatically enhanced the cell performance, leading to an efficient access to all active particles by the electrolyte that maximized the deliverable capacity of the LTO anode. Covering LTO particles with polymers3,29 was effective to prevent gas evolution during cell operation; however, the polymer acts as a barrier and impedes lithium diffusion, thereby adversely affecting fast charge/discharge performance. In addition, the polymer is often not electrochemically active and does not contribute to the cell performance. Organic molecules demonstrated faster lithium ion transfer, as observed in organic electrodes.30–32 Therefore, the incorporation of electrochemically active organic molecules at the surface of LTO should be an interesting trend of research. Based on these observations, the use of single and active organic molecules, which can be well dispersed on active electrode particles by physical absorption (effective covering of the surface) must be suitable for achieving high-performance anode materials at high C-rates and low temperatures.
In this work, we realized a Li-rich organic coating on the surface of the LTO anode material to increase its electrochemical performance at subzero temperatures by enhancing the Li-ion transfer at the electrode–electrolyte interface. A semiconducting perylene-based PTCLi4 molecule was synthesized and coated on the surface of LTO using a spray-dryer technique. First, the successful synthesis of an organic molecule was verified using FTIR, XPS, TGA, XRD, and SEM analyses. In parallel, the heat-treatment under an argon atmosphere of the resulting powder as well as graphene oxide (GO)-coated LTO yielded carbon-coated LTO materials. TEM, XPS, and micro-Raman investigations revealed that the LTO particles were surrounded by a nanometer-thick carbon layer in both cases, except that large GO sheets were observed for burned GO-coated LTO powder, thereby providing enhanced electronic conductivity for this composite. Carbon contents ranging from 0.3 to 1.5 wt%, depending on the reaction conditions and material used (i.e., PTCLi4 or GO), were quantified by TGA. The electrochemical performance of the PTCLi4-coated LTO electrodes at 25 °C was better than that of the electrodes made with the same materials after burning, whereas the GO-coated LTO gave the best results. Interestingly, the good cyclability of the PTCLi4-coated LTO electrodes was observed, as they delivered 145 mA h g−1 after 100 cycles at a C/2 rate with an average coulombic efficiency of 100%. XPS analyses performed on aged electrodes revealed less electrolyte degradation with a lower concentration of LiF on the surface of the PTCLi4-coated LTO electrodes. Finally, the potential of using the PTCLi4 coating to increase the Li-ion transfer at the electrode–electrolyte interface at subzero temperatures was confirmed, as the PTCLi4-coated LTO electrode delivered almost the same specific capacity, at a C/2 rate when cycled at −20 °C, as the pristine electrode cycled at 25 °C.
2. Experimental section
2.1 Syntheses of organic molecules
2.2 Organic coating on LTO particles
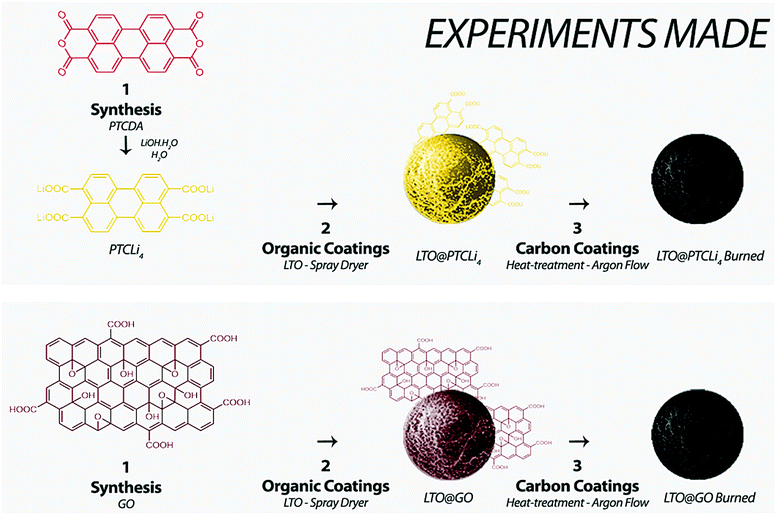
An LTO anode material (POSCO Company) was covered with 2, 3, 4, or 5 wt% of PTCLi4 or GO powder by spray-drying, as shown in Scheme 1. To this end, 20 g of LTO powder was suspended in 100 mL of deionized water and intensively dispersed using a sonotrode for 30 min. In parallel, a mass of GO or PTCLi4 corresponding to 2, 3, 4, or 5 wt% that of LTO was dispersed in 100 mL of deionized water using the same method. The two solutions were then combined and completed to 250 mL before being pumped and spray-dried. Spray-drying was performed on a Buchi B-290 mini spray-dryer. The inlet and outlet temperatures were set to 220 and 117 °C, respectively. During the entire process, the aspirator was functioning at 100% capacity. The sample solution was pumped at 10 mL min−1 and the spray gas flow in the nozzle was set to 742 L h−1.The surface-modified powders are named LTO@X% PTCLi4 or LTO@X% GO, depending on the nature and quantity (X wt%) of organic molecules used in the preparation.
2.3 Carbon coating on LTO particles
After applying organic coatings on an LTO material, heat-treatment was carried out to generate a carbon coating on the anode material (see Scheme 1). The powder was heat-treated in a tubular furnace for 4 h at 800 °C (+10 °C min−1 from ambient temperature to 800 °C) under an argon atmosphere. The carbon-coated powders are named LTO@X% PTCLi4 burned or LTO@X% GO burned, depending on the nature and quantity (X wt%) of organic molecules used in the preparation.2.4 Preparation of reduced graphene oxide
Reduced graphene oxide (r-GO) was prepared by the heat-treatment of GO powder in a tubular furnace under a nitrogen atmosphere at 800 °C for 4 h. A highly volatile dark powder was obtained.2.5 Characterizations
TGA curves of the synthesized organic molecules and coated LTO powders were recorded using a TGA 550 model (TA instruments) with a heating rate of 10 °C min−1 and an air flow rate of 90 mL min−1 from 30 to 700 °C.FTIR measurements were performed on a Bruker Vertex 70 spectrometer equipped with a smart ATR accessory.
Micro-Raman surface analyses were performed with a HORIBA LabSpec 5 apparatus with a laser excitation wavelength of 532 nm.
XRD analyses were performed using a SmartLab X-ray diffractometer (Rigaku) with Co Kα1 radiation (λ1 = 1.78892 Å). Data were collected between 10° and 80°, with a step size of 0.02° and a scan speed of 3.04° min−1, using a D/tex Ultra 250 detector.
The chemical compositions (5 nm deep) of the different LTO and organic powders as well as the electrode surface before and after long-cycling coin-cell experiments were investigated by XPS, using a PHI 5600-ci spectrometer (Physical Electronics). The main XPS chamber was maintained at a base pressure of <8 × 10⁻⁹ Torr. A standard aluminum X-ray source (Al Kα = 1486.6 eV) was used to record the survey spectra (1400–0 eV, 10 min) and magnesium was used to obtain high-resolution spectra, both without charge neutralization. The detection angle was set at 45° with respect to the normal of the surface and the analyzed area was 0.5 mm2. The curve fitting of the high-resolution spectra of C 1s, O 1s, F 1s, Li 1s, Ti 2p, and P 2p was performed by means of a least-squares minimization procedure, using Gaussian–Lorentzian functions and a Shirley-type background. For surface analyses of electrodes after cycling, the coin cells were carefully dismantled in an argon-filled glove-box and the LTO electrodes were extracted and washed several times with DMC before being packaged in a glass vial under an argon atmosphere.
PTCLi4 powder was observed using a FlexSEM 1000 scanning electron microscope (Hitachi High-Technologies Corporation) placed in a dry room. Prior to the analysis, samples were dried at 80 °C under vacuum for several hours. Secondary electron (SE) images are obtained at an accelerating voltage of 5 kV and a working distance of approximately 5–6 mm.
Tescan Mira SEM was used to evaluate the structural morphology of bare and PTCLi4-covered LTO powders. EDX (Oxford X80) analyses were performed to quantify the major carbon concentration on the samples, as well as to produce colored atomic distributions of Ti, O, and C on sample secondary particles.
TEM images of carbon-coated LTO materials were obtained using an HF3300 microscope (Hitachi High-Technologies Corporation) operating at 300 kV. The chemical composition was assessed using an electron energy loss spectroscopy (EELS) GIF Quantum system obtained from Gatan, Inc. Samples were dispersed in ethanol and drop-casted on QUANTIFOIL® holey carbon films prior to the analysis.
Adsorption isotherms were measured using a QuadraSorb Station 3 instrument (version 5.04, Quantachrome Instruments). Pristine and PTCLi4-coated LTO powders were characterized using nitrogen as an adsorbent at 77.3 K. The volume of gas adsorbed was recorded at relative pressures (P/P0) ranging from 4 × 10⁻² to 1. The N2 adsorption data were used to calculate the Brunauer–Emmett–Teller (BET) specific surface area (SBET) as well as the total pore volume. The pore size distribution was calculated by simulating the isotherms using density functional theory (DFT) and Monte-Carlo calculations.
2.6 Electrochemical performance evaluation
![[thin space (1/6-em)]](https://www.rsc.org/images/entities/char_2009.gif) :
:![[thin space (1/6-em)]](https://www.rsc.org/images/entities/char_2009.gif) diethyl carbonate (DEC) (3
diethyl carbonate (DEC) (3![[thin space (1/6-em)]](https://www.rsc.org/images/entities/char_2009.gif) :
:![[thin space (1/6-em)]](https://www.rsc.org/images/entities/char_2009.gif) 7) electrolyte in an argon-filled glove-box (O2 < 10 ppm).
7) electrolyte in an argon-filled glove-box (O2 < 10 ppm).
Galvanostatic cycling. LTO half-cells were cycled between 1.2 and 2.5 V vs. Li/Li+ for five cycles at different cycling rates ranging from C/10 to 5C, where 1C corresponds to a constant current of 165 mA g−1. The experiments were performed at ambient temperature (i.e., 25 °C), 0, and −20 °C.
Long-term cycling for 100 cycles was performed at a C/2 rate between 1.2 and 2.5 V vs. Li/Li+ with the unmodified and PTCLi4-modified LTO electrodes. Every 20 cycles, the cycling rate is increased to C/10 for one cycle.
Electrochemical impedance spectroscopy. Electrochemical impedance spectroscopy measurements were performed at an open-circuit voltage (OCV) after fully charging the cell to 2.5 V vs. Li/Li+ at a C/2 rate for the unmodified and PTCLi4-modified LTO electrodes. Measurements were performed with an amplitude of 10 mV and a frequency range of 1 MHz to 10 mHz after the 1st and the 100th cycles at C/2. Experimental data were fitted using the Z-fit tool within the EC-Lab software package (V11.12). Additional measurements were recorded at 1.55 V vs. Li/Li+ after one charge/discharge cycle at a C/10 rate.
3. Results and discussion
3.1 Characterization of organic molecules after their synthesis
![[double bond, length as m-dash]](https://www.rsc.org/images/entities/char_e001.gif) O carboxylate stretching mode. After the reaction with the strong LiOH base, the band shifted to ≈1595 cm−1 as usually observed for PTCLi4 molecules.34–36 Other characteristic IR bands such as the aromatic C
O carboxylate stretching mode. After the reaction with the strong LiOH base, the band shifted to ≈1595 cm−1 as usually observed for PTCLi4 molecules.34–36 Other characteristic IR bands such as the aromatic C![[double bond, length as m-dash]](https://www.rsc.org/images/entities/char_e001.gif) C stretching of the perylene structure at 1551 cm−1, aromatic C–H stretching around 3050–3100 cm−1, and C
C stretching of the perylene structure at 1551 cm−1, aromatic C–H stretching around 3050–3100 cm−1, and C![[double bond, length as m-dash]](https://www.rsc.org/images/entities/char_e001.gif) O stretching at 1435 cm−1 are also observed, in good agreement with a recent study on the PTCLi4 anode material.37 The well-ordered structures of PTCDA and PTCLi4 were confirmed by XRD analysis. The corresponding XRD patterns, presented in Fig. 1b, are similar to those reported for these two organic molecules and confirm the successful lithiation of the PTCDA precursor.37,38 A SEM image of the synthesized molecule, shown in Fig. 1c, revealed that PTCLi4 powder was composed of large agglomerates of well-crystalized needle-like particles, in accordance with the peaks obtained by XRD analysis. Finally, XPS analysis was used to verify the chemical formula of the PTCLi4 molecule and the corresponding C 1s, O 1s, and Li 1s core level spectra are shown in Fig. 1. A characteristic peak for the C
O stretching at 1435 cm−1 are also observed, in good agreement with a recent study on the PTCLi4 anode material.37 The well-ordered structures of PTCDA and PTCLi4 were confirmed by XRD analysis. The corresponding XRD patterns, presented in Fig. 1b, are similar to those reported for these two organic molecules and confirm the successful lithiation of the PTCDA precursor.37,38 A SEM image of the synthesized molecule, shown in Fig. 1c, revealed that PTCLi4 powder was composed of large agglomerates of well-crystalized needle-like particles, in accordance with the peaks obtained by XRD analysis. Finally, XPS analysis was used to verify the chemical formula of the PTCLi4 molecule and the corresponding C 1s, O 1s, and Li 1s core level spectra are shown in Fig. 1. A characteristic peak for the C![[double bond, length as m-dash]](https://www.rsc.org/images/entities/char_e001.gif) C bonds of the perylene structure appeared at 285 eV on the C 1s core level spectrum (Fig. 1d), and the presence of –COOLi is demonstrated by a small peak at around 289 eV. On the O 1s core level spectrum (Fig. 1e), C
C bonds of the perylene structure appeared at 285 eV on the C 1s core level spectrum (Fig. 1d), and the presence of –COOLi is demonstrated by a small peak at around 289 eV. On the O 1s core level spectrum (Fig. 1e), C![[double bond, length as m-dash]](https://www.rsc.org/images/entities/char_e001.gif) O and C–O peaks are observed at approximately 532 and 534 eV, respectively. Lithium is also detected in a small amount, as shown in Fig. 1f, and its atomic concentration as well as those of carbon and oxygen are reported in Table 1. The complete lithiation of the PTCDA molecule (uptake of four Li atoms) seems to be successfully achieved, as 66, 22.2, and 11.8% of carbon, oxygen, and lithium atoms were obtained which are very close to the theoretical values of 66.7, 22.2 and 11.1%.
O and C–O peaks are observed at approximately 532 and 534 eV, respectively. Lithium is also detected in a small amount, as shown in Fig. 1f, and its atomic concentration as well as those of carbon and oxygen are reported in Table 1. The complete lithiation of the PTCDA molecule (uptake of four Li atoms) seems to be successfully achieved, as 66, 22.2, and 11.8% of carbon, oxygen, and lithium atoms were obtained which are very close to the theoretical values of 66.7, 22.2 and 11.1%.
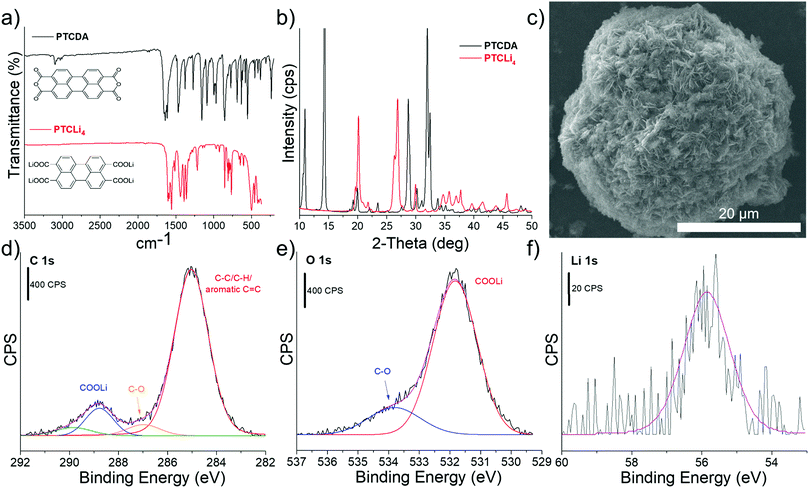 | ||
Fig. 1 (a) FTIR spectra and (b) XRD patterns of PTCDA (—) and PTCLi4 ( ) organic molecules. (c) SEM image and (d) C 1s, (e) O 1s, and (f) Li 1s core level XPS profiles of PTCLi4 powder. ) organic molecules. (c) SEM image and (d) C 1s, (e) O 1s, and (f) Li 1s core level XPS profiles of PTCLi4 powder. | ||
| Atomic concentration (%) | |||||||
|---|---|---|---|---|---|---|---|
| C 1s | O 1s | Li 1s | Ti 2p | P 2p | F 1s | ||
| a Parentheses indicate theoretical values. | |||||||
| Powders | PTCLi4a | 66.0 (66.7) | 22.2 (22.2) | 11.8 (11.1) | — | — | — |
| LTO | 26.9 | 57.6 | — | 14.6 | — | — | |
| LTO@2% PTCLi4 | 42.3 | 45.8 | 1.7 | 9.6 | — | — | |
| LTO@5% PTCLi4 | 49.6 | 39.3 | 3.8 | 6.9 | — | — | |
| Electrodes before cycling | LTO | 57.8 | 20.7 | — | 5.8 | — | 15.5 |
| LTO@4% PTCLi4 | 63.3 | 17.4 | — | 4.5 | — | 14.4 | |
| Electrodes after cycling | LTO | 24.6 | 19.9 | — | 1.5 | 2.8 | 51.1 |
| LTO@4% PTCLi4 | 32.1 | 22.0 | — | 0.9 | 2.3 | 42.5 | |
![[double bond, length as m-dash]](https://www.rsc.org/images/entities/char_e001.gif) O stretching vibrations) were demonstrated by a well-separated single peak at 1725 cm−1. Finally, a peak at 1600 cm−1 related to unoxidized sp2 C
O stretching vibrations) were demonstrated by a well-separated single peak at 1725 cm−1. Finally, a peak at 1600 cm−1 related to unoxidized sp2 C![[double bond, length as m-dash]](https://www.rsc.org/images/entities/char_e001.gif) C bonds was also present in the IR spectrum. The XRD pattern of the graphite powder used for the synthesis was compared with that of the GO obtained after chemical oxidation (Fig. 2b). A very intense peak (002) around 2θ = 31° was obtained for the graphite powder, in addition to several smaller peaks corresponding to different crystal planes that are generally observed for this carbon.41 The XRD pattern of the GO powder was characterized by a strong peak (001) around 2θ = 12° with a smaller peak at 2θ = 49°, which are both usually obtained for GO powder synthesized using the Hummers’ method.42 After thermal reduction of GO under flowing N2, a dark r-GO powder was obtained and its corresponding XRD pattern showed a large and flat peak at around 2θ = 29°, which proves the formation of graphene nanosheets.43 TGA data, shown in Fig. 2c, supported these observations. Although graphite powder remained thermally stable up to 650 °C under air, the thermogram of GO powder shows a first mass loss (∼10 wt%) between 40 and 200 °C due to the presence of H2O molecules trapped in the graphene sheets. Then, a major mass loss of 30% between 200 and 240 °C was recorded and attributed to the removal of labile oxygen functional groups on the GO sheets.44 The decomposition of more stable oxygen functionalities was associated with the gradual loss of mass observed between 240 and 525 °C. Above this temperature, the combustion of the carbon skeleton occurred. The r-GO powder was completely burned between 500 and 600 °C, confirming that graphene sheets were successfully synthesized.45
C bonds was also present in the IR spectrum. The XRD pattern of the graphite powder used for the synthesis was compared with that of the GO obtained after chemical oxidation (Fig. 2b). A very intense peak (002) around 2θ = 31° was obtained for the graphite powder, in addition to several smaller peaks corresponding to different crystal planes that are generally observed for this carbon.41 The XRD pattern of the GO powder was characterized by a strong peak (001) around 2θ = 12° with a smaller peak at 2θ = 49°, which are both usually obtained for GO powder synthesized using the Hummers’ method.42 After thermal reduction of GO under flowing N2, a dark r-GO powder was obtained and its corresponding XRD pattern showed a large and flat peak at around 2θ = 29°, which proves the formation of graphene nanosheets.43 TGA data, shown in Fig. 2c, supported these observations. Although graphite powder remained thermally stable up to 650 °C under air, the thermogram of GO powder shows a first mass loss (∼10 wt%) between 40 and 200 °C due to the presence of H2O molecules trapped in the graphene sheets. Then, a major mass loss of 30% between 200 and 240 °C was recorded and attributed to the removal of labile oxygen functional groups on the GO sheets.44 The decomposition of more stable oxygen functionalities was associated with the gradual loss of mass observed between 240 and 525 °C. Above this temperature, the combustion of the carbon skeleton occurred. The r-GO powder was completely burned between 500 and 600 °C, confirming that graphene sheets were successfully synthesized.45
3.2 PTCLi4 coating on the LTO surface
The LTO material was first coated with Li-rich PTCLi4 powder by spray-drying, as described in the experimental section. PTCLi4 is known as a low-cost organic anode material, synthesized from the commercially available PTCDA colorant, and possesses a working potential (∼1.2 V vs. Li/Li+)37 close to that of LTO (∼1.55 V vs. Li/Li+). In addition, PTCDA is a semiconducting material.46,47 For these reasons, the coating of LTO particles with PTCLi4 was of interest to yield a material with a good surface conduction of Li-ions and electrons. In addition, the thin PTCLi4 layer can provide overcharge protection in a full-cell configuration, as its redox potential is lower than that of LTO. For instance, it would be interesting to combine this composite anode material with a LiFePO4 cathode also containing an overcharge protection additive.48 FTIR spectra and thermograms for pristine and PTCLi4-coated LTO powders are shown in Fig. 3a and b, respectively. The FTIR spectrum for bare LTO powder is dominated by a very large and intense peak between 500 and 1000 cm−1, which is typical of Ti–O–Ti stretching vibrations of TiO6 octahedra.49 For the spray-dried samples, characteristic peaks of the PTCLi4 molecule were also observed between 1200 and 1700 cm−1 and their relative intensities in comparison to those of the LTO material increased when the initial amount of PTCLi4 in the solution was increased. Thus, it is worth noting that the conditions under which the LTO/PTCLi4 solutions were spray-dried did not degrade the organic molecule and led to a precisely controlled material deposited on the LTO surface. In fact, the redox molecule remains stable up to 375 °C (see Fig. SI1 in the ESI†), and the inlet temperature was set to 220 °C. Under these conditions, the drop of water was instantly evaporated and the highly water-soluble PTCLi4 molecule gently surrounded the LTO particle, which was in suspension in water. The thermograms in Fig. 3b show that LTO remained stable up to 700 °C under air flow, whereas LTO@PTCLi4 powders presented a mass loss between 375 and 500 °C, which was attributed to the degradation of the PTCLi4 coating. According to the TGA results and considering that a weight loss of 66% for the redox molecule alone was recorded under heating to 550 °C (see thermograms in Fig. SI1, ESI†), it can be calculated that LTO powders were obtained with approximately 2, 3, and 4.9 wt% of PTCLi4, as expected. The method and parameters are well adapted, as the amounts of PTCLi4 in the composite powders corresponded to the quantities of PTCLi4 measured to prepare the solutions. Fig. 3c shows photographs of pristine and PTCLi4-coated LTO powders, as well as the organic molecule. Although a small concentration of the organic molecule was present in the composite powders, they mostly appeared yellow–orange owing to the good coverage of the LTO surfaces, and there was no significant color variation between the PTCLi4 and LTO@5% PTCLi4 samples. SEM observations and the EDX chemical mapping of PTCLi4-coated powder (see Fig. SI2 in the ESI†) revealed that carbon was present everywhere on the surface of the anode material and that the voids between the primary LTO particles are effectively rich in carbon (i.e., PTCLi4).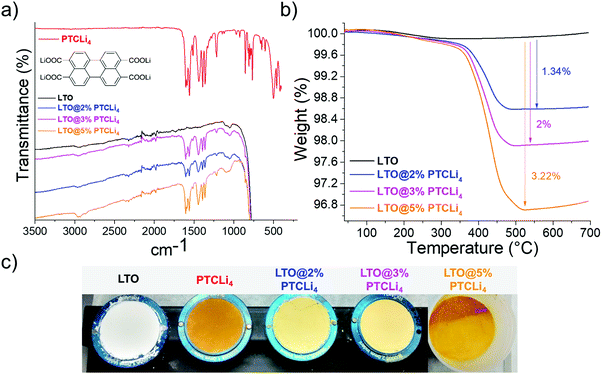 | ||
| Fig. 3 (a) FTIR spectra for the PTCLi4 molecule, uncoated and coated LTO powders with different amounts of PTCLi4. (b) Thermogravimetric curves and (c) photographs of the corresponding LTO powders. | ||
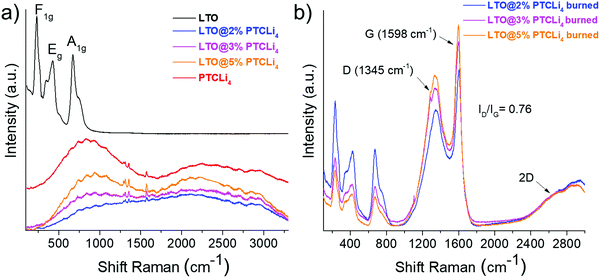
The PTCLi4-coated LTO powders were not observed via TEM due to the high sensibility of organic molecules to the electron beam irradiation.50 Thus, micro-Raman and XPS analyses were chosen to confirm the nanometric coverage of the LTO surface. Raman spectroscopy is a spectroscopic technique generally used to obtain information about vibrational modes of molecules or crystals. In particular, it is very sensitive to the electronic structure of carbon, its degree of hybridization, and the crystal disorder.51 The micro-Raman technique enabled a chemical surface analysis to a depth of a few nanometers and was used to demonstrate the coverage of LTO particles with PTCLi4 and then with carbon obtained from the subsequent heat-treatment. Fig. 4a shows the spectrum of the LTO material (—) that reveals three bands at 240, 430, and 680 cm−1, which are assigned to F1g, Eg, and A1g vibrations of the LTO crystal, respectively.52 PTCLi4 ( ) exhibited a strong photoluminescence effect,53,54 inducing a background with a mountain-like shape and small peaks at 1315, 1355, and 1570 cm−1 were hardly observed but often reported for perylene-based structures, such as the PTCDA precursor. More precisely, the two peaks at 1315 and 1355 cm−1 are attributed to the C–H bonds of the perylene structure, whereas the peak at 1570 cm−1 is associated with C–C bonds.55 When LTO is coated with 2% (
 ), 3% (
 ), and 5% by mass (
 ) of PTCLi4, the general signal for PTCLi4 was conserved, although the peak intensity decreased as the amount of LTO in the composite powder increased. More importantly, the absence of characteristic bands of LTO was consistent with the coverage of its surface by organic materials.
XPS analyses are also performed on pristine and PTCLi4-coated LTO powders, and their C 1s and O 1s core level spectra are shown in Fig. 5. For the bare LTO, carbon was detected on its surface (single peak at 285 eV, Fig. 5a), although this was not expected and was probably due to the adventitious carbon typically found on the surface of most air-exposed samples.55 The O 1s core level spectrum, presented in Fig. 5d, shows an intense peak at approximately 530 eV, which is attributed to the Ti–O bonds of the spinel structure. An additional small peak at 532 eV is obtained due to surface pollution. After surface modification with PTCLi4, the shape of the C 1s and O 1s spectra was strongly affected, which confirmed the efficient coverage of the LTO surface. The peak at 285 eV for PTCLi4-coated LTO materials increased, which is consistent with the presence of aromatic C![[double bond, length as m-dash]](https://www.rsc.org/images/entities/char_e001.gif) C and C–C bonds (see Fig. 5b and c). The appearance of a small peak located at 286–286.5 eV was attributed to the C–O bond of PTCLi4, whereas the one at 289 eV confirmed the detection of –COOLi groups. It is worth noting that these spectra are very similar to those obtained for the PTCLi4 molecule alone (Fig. 1d and e). In the O 1s core level spectra of the PTCLi4-coated LTO samples (see Fig. 5e and f), the contribution of both the organic molecule and LTO was exhibited. However, the intensity of the Ti-O bond peak diminished significantly owing to the nanoscale organic film on its surface. The atomic concentrations of C, O, Ti, and Li for the pristine and coated-LTO powders are shown in Table 1. On the surface of pristine LTO, 26.9% of carbon was present and this amount reached 42.3% and 49.6% for the LTO@2% PTCLi4 and LTO@5% PTCLi4 samples, respectively. At the same time, oxygen and titanium contents decreased as the amount of PTCLi4 in the powder increased. Finally, approximately zero (not quantifiable), 1.7%, and 3.8% of lithium were detected in the LTO, LTO@2% PTCLi4, and LTO@5% PTCLi4 powders, respectively, which confirms the deposition of the organic molecule on the surface of the electrode material.
C and C–C bonds (see Fig. 5b and c). The appearance of a small peak located at 286–286.5 eV was attributed to the C–O bond of PTCLi4, whereas the one at 289 eV confirmed the detection of –COOLi groups. It is worth noting that these spectra are very similar to those obtained for the PTCLi4 molecule alone (Fig. 1d and e). In the O 1s core level spectra of the PTCLi4-coated LTO samples (see Fig. 5e and f), the contribution of both the organic molecule and LTO was exhibited. However, the intensity of the Ti-O bond peak diminished significantly owing to the nanoscale organic film on its surface. The atomic concentrations of C, O, Ti, and Li for the pristine and coated-LTO powders are shown in Table 1. On the surface of pristine LTO, 26.9% of carbon was present and this amount reached 42.3% and 49.6% for the LTO@2% PTCLi4 and LTO@5% PTCLi4 samples, respectively. At the same time, oxygen and titanium contents decreased as the amount of PTCLi4 in the powder increased. Finally, approximately zero (not quantifiable), 1.7%, and 3.8% of lithium were detected in the LTO, LTO@2% PTCLi4, and LTO@5% PTCLi4 powders, respectively, which confirms the deposition of the organic molecule on the surface of the electrode material.
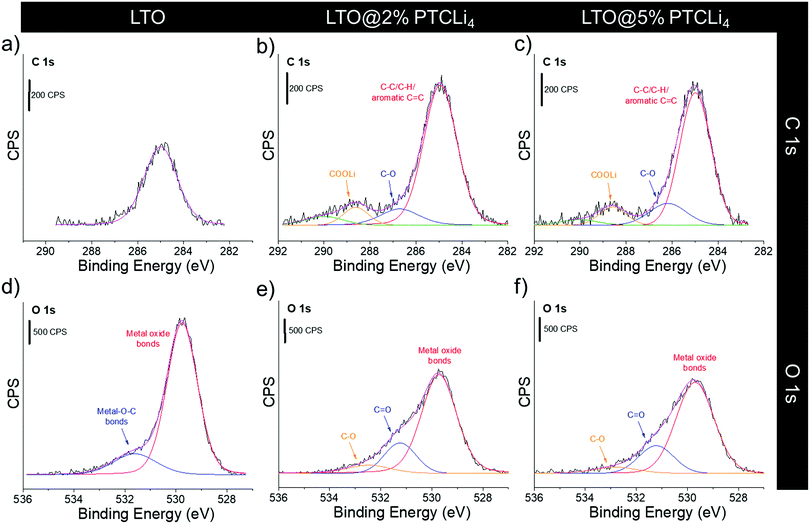 | ||
| Fig. 5 XPS (a–c) C 1s and (d–f) O 1s core level spectra for (a and d) LTO, (b and e) LTO@2% PTCLi4, and (c and f) LTO@5% PTCLi4 powders. | ||
3.3 Graphene oxide coating on the LTO surface
The LTO was also coated with the previously synthesized GO powder using the same technique and conditions as for PTCLi4. This material is widely studied, especially to generate carbon coatings on electrode materials such as LTO.56,57 Because PTCLi4-coated LTO powders can be heat-treated in a second step to generate a carbon coating, we chose to compare the effects of the organic molecules (i.e., GO and PTCLi4) on the deposition of carbon on the LTO surface and their implications for electrochemical performance.Fig. 6 shows the thermal decomposition of different composites made with LTO and various amounts of GO ranging from 2 to 4 wt%. Two clearly discernable mass losses around 150 and 400 °C correspond to the degradation of GO carbon, as explained above (see Fig. 2c). However, these decomposition temperatures are slightly lower than those recorded for pure GO powder, probably owing to a catalyst effect of the transition metal at the LTO surface or because of a structural change in the GO sheets, which were less agglomerated after spray-drying. At 650 °C, the GO was totally degraded and mass losses of approximately 1.6, 2.3, and 2.7% were obtained. These values are lower than the expected losses (2, 3, and 4 wt%, respectively), mainly owing to experimental parameters such as the outlet temperature set to 220 °C. At this temperature, according to the thermogram of GO powder, shown in Fig. 2c, its degradation starts and it is well demonstrated in Fig. 6 that the first mass loss is quite low in comparison to the second at a higher temperature. These results assume that the release of labile oxygen functional groups already began during spray-drying.
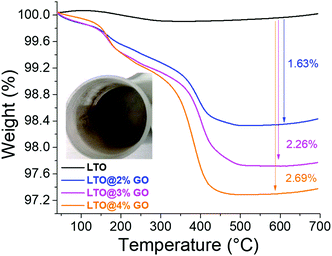 | ||
Fig. 6 Thermogravimetric curves for LTO (—), LTO@2% GO ( ), LTO@3% GO ( ), LTO@3% GO ( ), and LTO@4% GO ( ), and LTO@4% GO ( ) powders. Inset: Optical photograph of LTO@2% GO powder. ) powders. Inset: Optical photograph of LTO@2% GO powder. | ||
3.4 Thermal treatments of GO- and PTCLi4-coated LTO powders
Micro-Raman spectra of PTCLi4-coated LTO powders obtained after burning under an argon atmosphere are presented in Fig. 4b. The spectra appear totally different from those obtained for the same samples before heat-treatment (Fig. 4a) and are consistent with the deposition of a nanometer-thick layer of carbon on the surface of the LTO particles. First, the reappearance of characteristic bands of the LTO crystal is an additional indication that the layer of PTCLi4 was mostly consumed and converted to carbon. The small peaks at 1315, 1355, and 1570 cm−1 were no longer observed, and two intense bands located at 1345 and 1598 cm−1 appeared. These two peaks are often reported for carbon materials such as graphene.58 The peak at 1345 cm−1, generally called the D band (D for disorder), corresponds to the breathing mode of k-point phonons with A1g symmetry. It is associated with disordered carbons or defective graphitic structures and its corresponding intensity increases with the number of defects in the carbon structure obtained.59 The G band (G for graphitic) observed at ∼1598 cm−1 is ascribed to the E2g phonon of sp2-bonded carbon atoms, which is a characteristic feature of graphitic layers.44 The intensity ratio of the D to G bands (ID/IG) was approximately equal to 0.76 for the three LTO@PTCLi4 burned powders. This ratio is particularly low and demonstrates that the carbon layer is mostly composed of perylene stacking to form a structure with a relatively high degree of graphitic carbon on the surface of LTO. In fact, ID/IG ratios of approximately 1, 0.84, and 0.09 were reported for GO, r-GO, and graphite.60 The shape and position of the 2D band at approximately 2660 cm−1 indicate the presence of a graphitic structure composed of few layers of carbon atoms61–63 that is consistent with a thin carbon layer, which will be confirmed by TEM observations (results shown below).In addition, the XPS profiles of burned GO- and PTCLi4-coated LTO powders shown in Fig. SI3 (ESI†) confirm the deposition of a thin carbon layer on the surface of LTO. The C 1s and O 1s spectra are similar for the carbon-coated samples made with either PTCLi4 or GO. Moreover, the small peak observed at 289 eV for PTCLi4-coated LTO powders (see Fig. 5b and c) and attributed to –COOLi bonds disappeared after burning, which is consistent with the degradation of the molecule and its conversion in carbon.
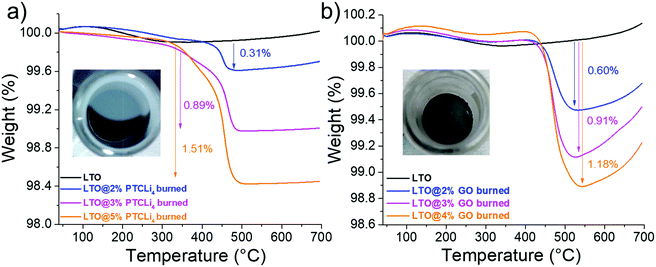
Fig. 7 presents thermogravimetric curves of LTO powders coated with (a) PTCLi4 and (b) GO materials after burning under an argon atmosphere with the same conditions. The inset photographs show carbon-coated LTO powders with approximately the same amount of carbon (about 0.9 wt%) generated from the combustion of PTCLi4 and GO materials. Although the PTCLi4- and GO-coated LTO powders appeared yellow–orange (Fig. 3c) and brown (see photographs in the inset of Fig. 6), respectively, after burning, they were characterized by a grey color typical of a carbon-coated material. The powders were highly hydrophobic, as evidenced by remaining on the surface of water even under stirring, thereby confirming the presence of carbon on the LTO surface. The thermograms obtained under air show that the combustion of the carbon layer was completed around 500 °C for all the samples and approximately 0.3, 0.9, and 1.5 wt% of carbon was obtained for the LTO@PTCLi4 powders coated by 2, 3, and ∼5 wt% of organic molecules, respectively. The degradation of PTCLi4 appeared more important than GO under the same experimental conditions, because higher values of carbon content were obtained for the LTO@GO burned powders with a lower initial content of organic molecules than for the LTO@ PTCLi4 samples.
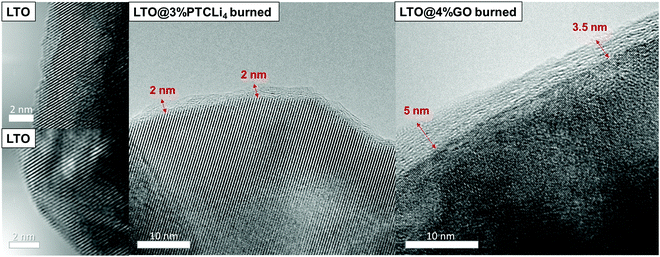
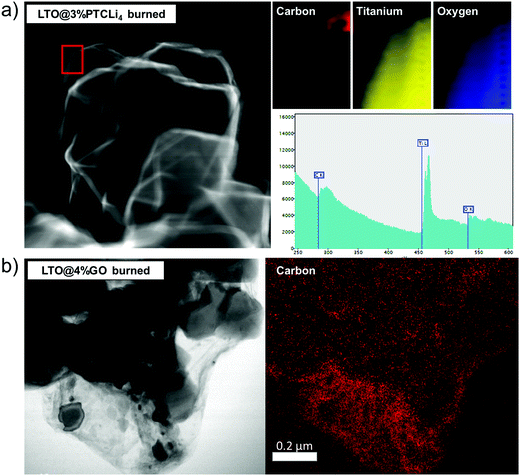
The TEM images presented in Fig. 8 show that the pristine LTO (left side) has a well-defined crystal structure with a succession of (111) planes, confirming that the surface has a typical spinel structure.63,64 For the LTO@3% PTCLi4 burned powder, an additional thin layer was observed on the LTO particle surface and attributed to the carbon layer generated by the decomposition of PTCLi4 molecules. As mentioned above with the Micro-Raman analyses of burned LTO@PTCLi4 samples, the shape of the 2D band suggests that the carbon coating was composed of a few layers of carbon atoms.65 If we take into account the reported value for the thickness of a PTCDA monolayer, which is approximately 0.32 nm,38,66 then the carbon coating should be composed of at least six to seven layers of perylene-like carbon. A rough calculation, considering the largest lattice parameter of the PTCDA monoclinic crystal (P21/c space group, approximately 2 nm),38 quantity of carbon estimated by TGA (0.89 wt%), and the BET surface area for the LTO sample (see Fig. SI4 and Table SI1 in the ESI† for the nitrogen gas adsorption experiment results; SBET(LTO) ∼ 4.7 m2 g−1), yields an estimated uniform carbon coating thickness. However, LTO pores with a diameter below 2 nm are not accessible by the organic molecule and the LTO surface area that can be efficiently covered was only 2.6 m2 g−1 (see Fig. SI4b in the ESI;† pores with a diameter ≤2 nm give rise to a specific surface area of 2.1 m2 g−1). Then, a uniform coverage should lead to a 1.6 nm-thick carbon coating on the LTO material, which is quite close to the thickness observed and estimated by TEM analyses (see Fig. 8, LTO@3% PTCLi4 burned sample). For the LTO@4% GO burned powder, the thickness of the carbon layer was less uniform and thicker (between 3 and 5 nm), owing to the higher amount of carbon estimated by TGA (∼1.2%), which will surely lead to a better electrochemical performance, as shown below. In addition, STEM-EELS analysis for this sample, as presented in Fig. 9b, indicates that the LTO particles and the large graphene sheets are uniformly distributed, enhancing the electronic conductivity of this composite in comparison to pristine LTO. Similar results have been reported for composites made with LTO and GO or r-GO materials.56,57,67 In contrast, the spectrum of the LTO@3% PTCLi4 burned powder and the corresponding C, O, and Ti elemental mappings (see Fig. 9a) clearly show that carbon is present on the extreme surface of the LTO particles and large carbon sheets are not formed in this case. A carbon-coated LTO material synthesized by the thermal decomposition of pitch gave comparable observations.68 Such a carbon-coated material will provide good electronic conductivity owing to the improved electron-transfer on the LTO surface, but the absence of large carbon sheets as observed for the LTO@GO burned sample will limit the electron movement between the LTO particles or agglomerates. Thus, slightly lower electrochemical performance is expected at high C-rates for the LTO@PTCLi4 burned samples in comparison to that for the LTO@GO burned composites.
3.5 Electrochemical performance of LTO electrodes
The spinel-LTO (Li-poor phase) anode material can accommodate up to three lithium ions per formula unit at a potential of 1.55 V vs. Li/Li+.69,70 During the discharge process, associated with the reduction of three Ti4+ atoms, the spinel structure is converted into a Li-rich rock-salt phase, which provides a theoretical capacity of 175 mA h g−1.71,72 LTO has many advantages, such as excellent Li-ion insertion/extraction reversibility, negligible volume expansion during the charge/discharge process, and a flat potential plateau.73 However, owing to its poor electronic conductivity, in the range of 10−8–10−13 S cm−1,74,75 LTO presents low specific capacity and poor capability for high-rate performance. Generally, a practical specific capacity of approximately 150–160 mA h g−1 is obtained, as will be shown below for our batteries. Finally, the shape and the particle sizes of an electrode material strongly influence the performance at low and high C-rates.76 For instance, for high power density applications, nanometric LTO particles are preferred in order to facilitate Li+ ion transport by dramatically reducing the diffusion distance.77 In contrast, for energy demanding applications, micrometric particle size is needed with high tap density. Increasing the tap density to gain higher volumetric energy density is a crucial factor for commercialization.78 We selected an LTO material designed for energy demanding applications and composed of primary particles of nanometer size forming large secondary spherical aggregates of a few micrometers to 20–30 μm in diameter (see SEM images in Fig. SI2, ESI†). Stable capacities at low C-rates were obtained with this material, as shown below, but it hardly cycled at high C-rates, which is consistent with the cycling of micrometric LTO spheres.78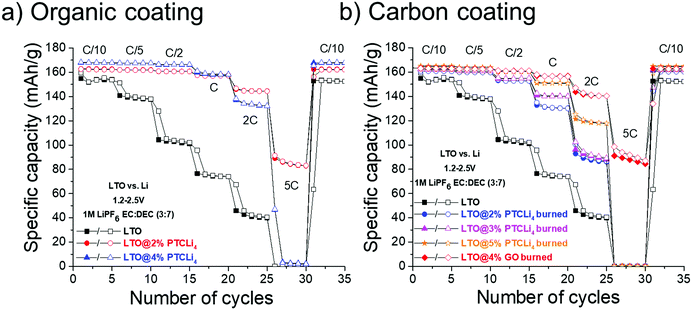 | ||
| Fig. 11 Rate capability obtained for LTO half-cells made with (a) PTCLi4-coated LTO powders and with (b) different carbon-coated LTO materials. Cycling was performed at 25 °C. | ||
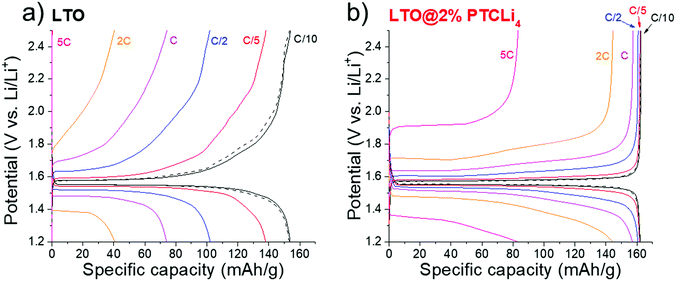
The rate capabilities of different LTO@PTCLi4 burned and LTO@4% GO burned electrodes are presented in Fig. 11b. Typical galvanostatic charge/discharge profiles at different cycling rates for these electrodes are shown in Fig. SI5 (ESI†). First, as explained above, LTO powder with r-GO sheets showed the best performance in comparison to other carbon-coated LTO electrodes made with burned PTCLi4. The dual effect of partial or complete coverage of the LTO surface with a nanometer-thick layer of carbon and the presence of graphene sheets surrounding small agglomerates of LTO particles (see Fig. 9b) led to better electron distribution in the electrode composite in comparison to that in the pristine LTO electrode. LTO@PTCLi4 burned electrodes still gave better results than pristine LTO and the corresponding rate performances were strongly influenced by the quantity of carbon at the LTO surface.68 For example, at 1C rate, approximately 150, 140, and 130 mA h g−1 were obtained for powders with 1.5, 0.9, and 0.3 wt% of carbon, respectively (see thermograms of Fig. 7a for carbon content). These results indicate that the patchy coverage of the LTO surface is obtained for samples with low carbon content, which should be higher than 1.5% by mass to achieve a performance near that obtained with the burned-GO coating.
Interestingly, by comparing Fig. 11a (PTCLi4 coating) with Fig. 11b (carbon coating), it is easily discernable that the PTCLi4-coated LTO electrodes exhibited better electrochemical performance than the burned samples and similar performance as the LTO@4% GO burned electrode. This type of composite shows promise for lowering the fabrication price of high-current-supporting anodes by avoiding the step of thermal treatment at high temperature and under costly inert gas, such as argon. Similar results were reported by Wang et al. for their Li4Ti5O12/PEDOT composite, which showed superior electrochemical performance in comparison to the pristine LTO and burned Li4Ti5O12/PEDOT samples.82 The authors attributed this improvement to the formation of a uniform conducting polymer layer, which shortens the Li-ion diffusion path and improves electronic conductivity on the surface of the anode material. However, the high cost of PEDOT clearly limits its surface modification method to the laboratory scale. In our case, PTCLi4 fulfills the same roles because the perylene stacking, as discussed above, considerably increases the electron motion while the four lithiophilic –COO−Li+ groups favor Li+ ion transfer between the electrolyte and the LTO surface. Recently, a passivation film on a metallic lithium surface consisting of a polymer with the same lithiophilic –COO−Li+ groups has been reported to show effectively uniform Li-ion flux at the electrolyte/electrode interface, thereby avoiding the tip effect and dendrite formation.83 It is worth noting that at high C-rates (from 2C to 5C), the specific capacities for the LTO@4% PTCLi4 electrode were inferior to those for the LTO@2% PTCLi4 anode (see Fig. 11a). This behavior is attributed to the higher quantity of PTCLi4 molecules on the surface of the LTO@4% PTCLi4 material, which is beneficial at low C-rates for improving the electronic conductivity but detrimental at high C-rates.81,84
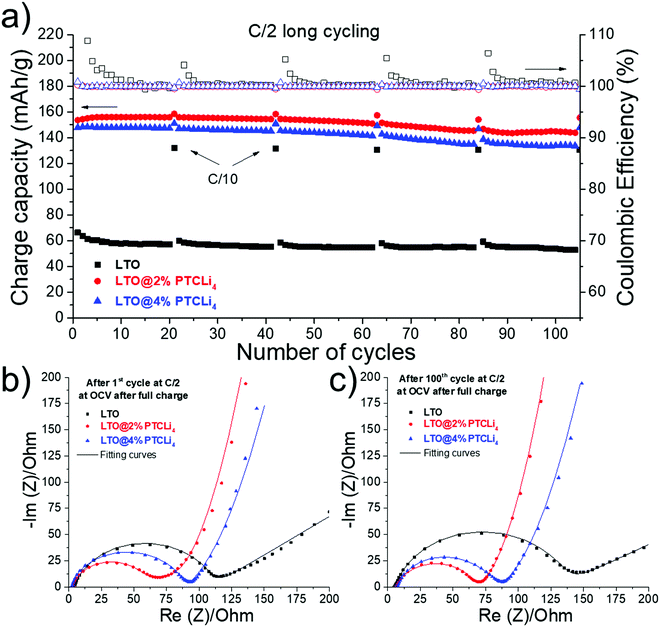
Long-term cycling experiments were carried out at a constant charge/discharge rate of C/2 at 25 °C for the pristine and two PTCLi4-coated LTO electrodes, yielding the results shown in Fig. 12a. First, at this constant current, the initial capacities of 153, 147, and 66 mA h g−1 were obtained for the LTO@2% PTCLi4, LTO@4% PTCLi4, and pristine LTO electrodes, respectively. Throughout the experiment, the surface-modified electrodes showed stable coulombic efficiency with an average value near 100%, whereas the pristine LTO electrode presented significant variations, especially at the beginning of the cycling and after each cycle performed at C/10 (every 20 cycles at C/2). This indicates that side reactions occurred at the bare LTO surface, which are effectively avoided with the PTCLi4-coated material. The organic layer could cover the catalytic active sites of LTO and separate them from the electrolyte as was already reported for carbon64,85 and inorganic coatings.86 Consequently, higher cyclic stability was obtained for modified-LTO, as approximately 94.1 and 91.1% of capacity retention were calculated after 100 cycles at a rate of C/2 for the LTO@2% PTCLi4 and LTO@4% PTCLi4 electrodes, respectively. In comparison, the pristine LTO retained only 78.8% of its initial capacity at the end of the experiment. Electrochemical impedance spectroscopy measurements for the same electrodes recorded after the 1st (Fig. 12b) and 100th cycles (Fig. 12c) at C/2 confirmed that the PTCLi4 layer effectively reduces electrolyte degradation and impedes the formation of a resistive SEI layer on the surface of the anode material. In fact, the charge transfer resistance (RCT) remained quite stable for the PTCLi4-modified LTO electrodes between the beginning and the end of cycling. The RCT value increased from 59 to 61 Ω for the LTO@2% PTCLi4 electrode, whereas a slight decrease was observed for the LTO@4% PTCLi4 sample, with RCT varying from 89 to 80 Ω after 100 cycles. In contrast, the pristine LTO, which is characterized by poor cyclability, also showed a significant increase in the charge transfer resistance, from 109 to 139 Ω. Finally, it is worth noting that the improved rate capability and especially the better cyclability for the PTCLi4-coated electrodes seem to indicate that the organic coating was not solubilized in the electrolyte, as often reported for small organic molecules used as Li-ion redox active materials.87
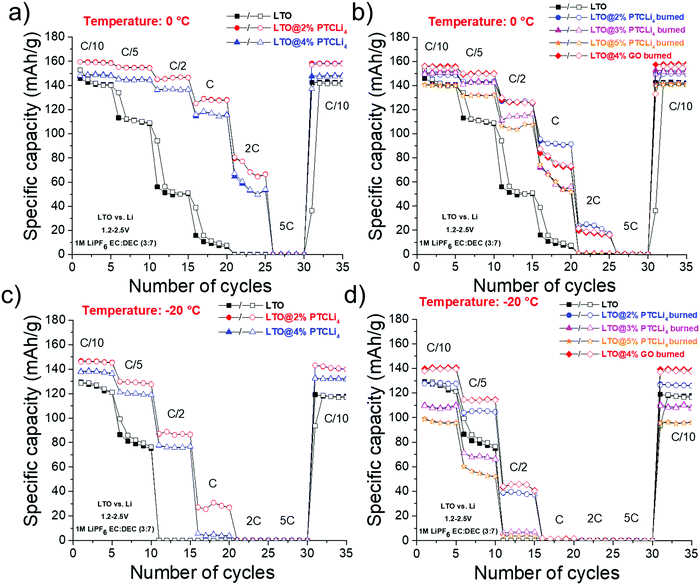
Hence, additional electrochemical tests were performed at 0 and −20 °C to confirm the potential of the PTCLi4 coating to increase the Li+ ion transfer through the electrode/electrolyte interface. Fig. 13a presents the rate capabilities for pristine and PTCLi4-coated LTO electrodes cycled at 0 °C. First, at this temperature, a lower initial capacity at C/10 was obtained for all the batteries; for instance, 165 and 160 mA h g−1 were delivered for the LTO@2% PTCLi4 electrode at 25 and 0 °C, respectively, whereas pristine LTO yielded 155 and 140 mA h g−1 at the same temperatures. Second, a progressive loss of capacity was observed for PTCLi4-coated LTO electrodes up to a cycling rate of 1C, at which 130 mA h g−1 was still delivered with the LTO@2% PTCLi4 electrode. In contrast, for the same rate, the bare LTO anode was not able to cycle and showed a poor rate capability. Finally, at a rate of 2C, an average value of 70 mA h g−1 was obtained for the LTO@2% PTCLi4 electrode. As observed at ambient temperature, the carbon-coated LTO electrodes showed intermediate results at 0 °C (see Fig. 13b), but the performance of the LTO@4% GO burned electrode was strongly affected by a decrease in temperature. In fact, at 25 °C and a rate of 1C, approximately 160 mA h g−1 was delivered by the GO-coated and LTO@2% PTCLi4 electrodes (Fig. 11), whereas at 0 °C, only 75 and 130 mA h g−1 were obtained for the same samples. The better retention of capacity with the increase in the cycling rate for the PTCLi4-coated LTO electrodes was attributed to the enhanced Li+ ion transfer between the electrolyte and the surface of the active material.
Experiments performed at −20 °C showed the same trend, except that the initial discharge capacities at C/10 and the rate performances were more adversely affected by the low temperature. For the PTCLi4-coated electrodes, acceptable initial capacities of 140–145 mA h g−1 were obtained. However, it was observed that carbon-coated electrodes with an excessive content of graphitic carbon (e.g., LTO@3% and 5% PTCLi4 burned electrodes) delivered very low discharge capacities at C/10 (∼100–110 mA h g−1), which are even lower than that obtained for the pristine LTO electrode (125 mA h g−1). Consequently, these batteries showed the poorest electrochemical performance at −20 °C, owing to their high charge-transfer resistance caused by the hindrance of graphene layers with the fast Li+ ion transfer between the electrolyte and the host material. In contrast, the LTO@2% PTCLi4 electrode delivered 90 mA h g−1 at a rate of C/2 and −20 °C, which is similar to that obtained at 25 °C with the pristine LTO electrode.
4. Chemical analysis of the electrode surface before and after cycling
The electrode surfaces before and after long cycling experiments at a rate of C/2 were analyzed and compared using XPS. Fig. 14 shows the C 1s, O 1s, and F 1s core level spectra for the LTO and LTO@4% PTCLi4 electrodes. Before cycling, the C 1s spectra for both the pristine and PTCLi4-coated LTO electrodes (see Fig. 14a) were quite similar and characterized by the peaks of the PVDF binder at 286.5 and 291.7 eV and conductive carbon at 285 eV.100 The O 1s spectrum (Fig. 14b) is dominated by the metal oxide peak at ∼530 eV and a broad and low-intensity peak centered at 532 eV associated with the presence of oxygen-containing species on the carbon surface. Finally, the F 1s core level spectra, shown in Fig. 14c, contain a peak at 688 eV characteristic of the PVDF binder101 and a small shoulder at 685 eV that could be due to the adsorbed or entrapped fluorine.102,103 The atomic concentrations of C, O, Ti, and F determined via XPS are given in Table 1. It is worth noting that a higher concentration of carbon was observed for the LTO@4% PTCLi4 electrode, owing to the coverage of the LTO surface by the organic molecules, which is also consistent with the lower percentage of Ti (4.5%) detected in comparison to the LTO electrode (5.8%).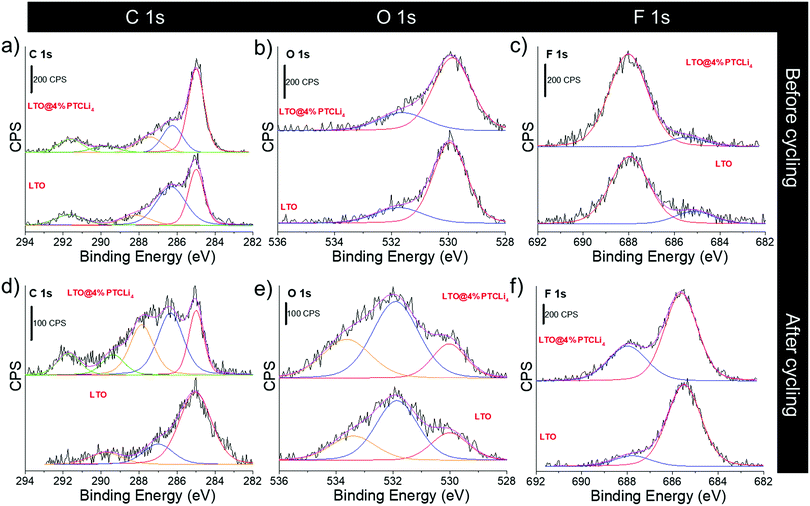 | ||
| Fig. 14 XPS (a and d) C 1s, (b and e) O 1s and (c and f) F 1s core level spectra for the LTO and LTO@4% PTCLi4 electrodes (a–c) before and (d–f) after long cycling experiments at a C/2 rate. | ||
After the long cycling experiments, the C 1s region for the surface of the LTO@4% PTCLi4 electrode (Fig. 14d) displayed additional contributions that were assigned to the species containing C–O–C bonds (286.5 eV), O–C–O, and/or C![[double bond, length as m-dash]](https://www.rsc.org/images/entities/char_e001.gif) O bonds (288 eV)104 as well as a possible contribution from carbonates (Li2CO3 or RCO3Li) at 290 eV.101 All these species, coming from electrolyte degradation, are generally observed at the surface of electrodes after cycling. The atomic concentration of carbon at the surface of the pristine LTO electrode was slightly lower and its environment appeared different from that of the LTO@4% PTCLi4 electrode. For instance, the peak at 292 eV (CF2 from the binder) is no longer visible, and it is probably hidden by the presence of a large amount of LiF on the surface of the film. The O 1s core level spectra for both the electrodes are relatively similar (Fig. 14e). The metal oxide peak at 530 eV is still visible, but with a low intensity that is consistent with the low concentration of Ti detected for the two samples (see Table 1) due to the presence of the passivation layer. In addition, at least two other contributions are observed around 532 and 534 eV, which are attributed to the formation of degradation products containing Li2CO3/C
O bonds (288 eV)104 as well as a possible contribution from carbonates (Li2CO3 or RCO3Li) at 290 eV.101 All these species, coming from electrolyte degradation, are generally observed at the surface of electrodes after cycling. The atomic concentration of carbon at the surface of the pristine LTO electrode was slightly lower and its environment appeared different from that of the LTO@4% PTCLi4 electrode. For instance, the peak at 292 eV (CF2 from the binder) is no longer visible, and it is probably hidden by the presence of a large amount of LiF on the surface of the film. The O 1s core level spectra for both the electrodes are relatively similar (Fig. 14e). The metal oxide peak at 530 eV is still visible, but with a low intensity that is consistent with the low concentration of Ti detected for the two samples (see Table 1) due to the presence of the passivation layer. In addition, at least two other contributions are observed around 532 and 534 eV, which are attributed to the formation of degradation products containing Li2CO3/C![[double bond, length as m-dash]](https://www.rsc.org/images/entities/char_e001.gif) O and O–C
O and O–C![[double bond, length as m-dash]](https://www.rsc.org/images/entities/char_e001.gif) O/C–O–C bonds,105 respectively. In contrast, there is no evidence for the formation of LixPFyOz generated by the degradation of the lithium salt and generally observed around 535 eV.106 However, a small amount of phosphorous was detected via XPS and could be attributed to this type of degradation products. Finally, the most important difference between the pristine and the PTCLi4-coated electrodes is the concentration of fluorine. In fact, fluorine accounts for 51.1% of the atoms present on the surface of the pristine electrode, compared to 42.5% for the modified electrode (see Table 1). The F 1s core level spectra for the two electrodes after cycling are shown in Fig. 14f. It is clear that for the LTO electrode, a higher quantity of LiF (∼685.5 eV) is obtained because the binder peak at 688 eV almost disappeared. This result is in agreement with the increase in the internal resistance observed for the LTO electrode after long-term cycling (Fig. 12c). In fact, LiF is known to exhibit poor electronic conductivity and its formation must be avoided.107 In conclusion, although not expected, the PTCLi4 coating on the LTO material could prevent or reduce the formation of resistive LiF at the surface of the electrode, thus leading to better cyclability and rate performance.
O/C–O–C bonds,105 respectively. In contrast, there is no evidence for the formation of LixPFyOz generated by the degradation of the lithium salt and generally observed around 535 eV.106 However, a small amount of phosphorous was detected via XPS and could be attributed to this type of degradation products. Finally, the most important difference between the pristine and the PTCLi4-coated electrodes is the concentration of fluorine. In fact, fluorine accounts for 51.1% of the atoms present on the surface of the pristine electrode, compared to 42.5% for the modified electrode (see Table 1). The F 1s core level spectra for the two electrodes after cycling are shown in Fig. 14f. It is clear that for the LTO electrode, a higher quantity of LiF (∼685.5 eV) is obtained because the binder peak at 688 eV almost disappeared. This result is in agreement with the increase in the internal resistance observed for the LTO electrode after long-term cycling (Fig. 12c). In fact, LiF is known to exhibit poor electronic conductivity and its formation must be avoided.107 In conclusion, although not expected, the PTCLi4 coating on the LTO material could prevent or reduce the formation of resistive LiF at the surface of the electrode, thus leading to better cyclability and rate performance.
5. Proposed mechanism
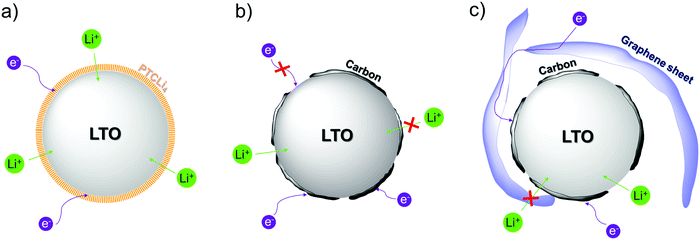
Based on previous explanations for carbon-coated LTO108 and in order to explain our results, we proposed a schematic (see Scheme 2) to depict Li-ion and electron transfers at the surface of the different prepared LTO powders. The carbon coating strongly increases the electronic conductivity at the surface of the LTO anode material and although some particles are not totally covered13 (e− transfer is slowed down, see red crosses in Scheme 2b and c), the electrochemical performance for carbon-coated LTO anodes is better than that obtained with the bare material. In particular, as represented in Scheme 2c, the LTO@GO burned sample possesses a thin layer of carbon on the LTO surface (see Fig. 8) as well as large r-GO sheets (see Fig. 9b) that surround the LTO single particles or agglomerates, leading to a faster electron distribution in the electrode bulk. This difference explains the better results obtained for r-GO-coated LTO in comparison to the LTO@PTCLi4 burned samples at 25 °C. The perylene stacking structure on the surface of PTCLi4-coated LTO increases the electron motion, whereas the ionically conductive channels formed by lithiophilic –COO−Li+ groups led to a faster Li+ desolvation favoring lithium ion transfer between the electrolyte and the LTO surface (Scheme 2a). The combination of both led to superior electrochemical performance to that for pristine LTO at 25 °C but similar performance as that for r-GO-coated LTO because the electronic conductivity is a limiting factor at this temperature. In contrast, when the temperature is decreased, the ionic conductivity and solvation/desolvation processes become limiting factors.89,92,93 Thus, the electrochemical performance for PTCLi4-coated LTO was increasingly better than that of the other carbon-coated materials as the temperature decreased (Fig. 13). In addition, the high graphitization degree of carbon layers, demonstrated by Micro-Raman investigations for burned PTCLi4 (ID/IG = 0.76) and widely reported for the r-GO material,60 limits the Li+ ion diffusion more precisely in the perpendicular direction to graphene layers108,109 (represented with red crosses in Scheme 2b and c). According to the electrochemical results presented in Fig. 13d, it is concluded that an excessive amount of graphitic carbon (e.g., LTO@5% PTCLi4 burned electrode) is detrimental to electrochemical performance at low temperatures and ionically conductive coatings are preferable.6. Conclusions and perspectives
We have proposed a facile way to make an electronically and Li-ionically conductive coating on the surface of LTO materials that improves the cycling of batteries at subzero temperatures. The method used a spray-drying technique to achieve the coverage of anode particles with PTCLi4 molecules, but other methods such as rotary evaporation or planetary ball milling can be used. We also demonstrated the possibility of making a carbon coating by burning PTCLi4-coated LTO in a reductive atmosphere, as is widely reported in the literature with other carbon sources. This material has been compared with LTO covered by r-GO sheets using the same protocol. Carbon contents ranging from 0.3 to 1.5 wt%, depending on the reaction conditions and the material used (i.e., PTCLi4 or GO), were quantified by TGA. TEM and micro-Raman investigations revealed that LTO particles were surrounded by a nanometer-thick carbon layer in both cases. For the burned GO-coated LTO powder, large GO sheets were observed, providing enhanced electronic conductivity for this composite and a superior electrochemical performance of the corresponding electrode was obtained in comparison to those of the batteries made with burned PTCLi4-coated LTO materials. However, PTCLi4-coated LTO electrodes (not burned) exhibited a better rate capability at 25 °C than the pristine and carbon-coated LTO anodes and similar rate capability as the GO-coated LTO electrode. In addition, the good cyclability of the PTCLi4-coated LTO electrodes was observed for over 100 cycles at a rate of C/2 and an average coulombic efficiency of 100% was obtained. XPS analyses performed on aged electrodes revealed less degradation of the electrolyte with a lower concentration of LiF on the surface of the PTCLi4-coated LTO electrodes, which could explain their better cyclability. Finally, the PTCLi4-coated LTO electrode delivered almost the same specific capacity, at a rate of C/2 when cycled at −20 °C, as the pristine electrode cycled at 25 °C. In conclusion, a cheap organic coating providing sufficient electron delocalization and increasing Li-ion transfer at the electrode–electrolyte interface was developed, thus enabling battery cycling at subzero temperatures. The step of thermal treatment under costly inert gas was avoided, thereby considerably decreasing the fabrication cost of a high-current-supporting anode material.Author contributions
N. D. designed the experiments. P. C. performed XPS analyses and their interpretations with N. D. S. R. and G. L. prepared the coated-LTO samples as well as assembled the electrochemical cells. J.-C. D. wrote the introduction and provided fruitful scientific advice. V. G., D. C., R. V., M.-C. M., M. P., and M. T. performed the structural characterizations. N. D. performed the electrochemical characterizations and wrote the article. K. Z. supervised the research and advised on the manuscript.Conflicts of interest
The authors declare no competing interests.Acknowledgements
This work was financially supported by Hydro-Québec and the laboratory experiments were realized at the Center of Excellence in Transportation, Electrification and Energy Storage (CETEES). The authors would like to acknowledge Éloïse Leroux for the design of Scheme 1 and Bilbon Sacquet for interesting scientific discussions. All the authors would like to thank Karim Zaghib for its major contribution in the energy storage field during the last 25 years spent at Hydro-Québec.References
- G. E. Blomgren, J. Electrochem. Soc., 2017, 164, A5019 CrossRef CAS.
- L. Cheng, X.-L. Li, H.-J. Liu, H.-M. Xiong, P.-W. Zhang and Y.-Y. Xia, J. Electrochem. Soc., 2007, 154, A692 CrossRef CAS.
- J.-C. Daigle, Y. Asakawa, M. Beaupré, R. Vieillette, D. Laul, M. Trudeau and K. Zaghib, Nano Lett., 2017, 17, 7372 CrossRef CAS PubMed.
- J.-C. Daigle, Y. Asakawa, P. Hovington and K. Zaghib, ACS Appl. Mater. Interfaces, 2017, 9, 41371 CrossRef CAS PubMed.
- K. Zaghib, M. Dontigny, A. Guerfi, J. Trottier, J. Hamel-Paquet, V. Gariepy, K. Galoutov, P. Hovington, A. Mauger, H. Groult and C. M. Julien, J. Power Sources, 2012, 216, 192 CrossRef CAS.
- K. Zaghib, M. Dontigny, P. Perret, A. Guerfi, M. Ramanathan, J. Prakash, A. Mauger and C. M. Julien, J. Power Sources, 2014, 248, 1050 CrossRef CAS.
- Y. Liu, Y. Zhu and Y. Cui, Nat. Energy, 2019, 4, 540 CrossRef.
- F. Cao, G. X. Pan and Y. J. Zhang, Mater. Res. Bull., 2017, 96, 325 CrossRef CAS.
- S.-A. Hong, S. J. Kim, J. Kim, B. G. Lee, K. Y. Chung and Y.-W. Lee, Chem. Eng. J., 2012, 198–199, 318 CrossRef CAS.
- X. Zhi, G. Liang, X. Ou, S. Zhang and L. Wang, J. Electrochem. Soc., 2017, 164, A1285 CrossRef CAS.
- G. Meligrana, C. Gerbaldi, A. Tuel, S. Bodoardo and N. Penazzi, J. Power Sources, 2006, 160, 516 CrossRef CAS.
- N. Ravet, Y. Chouinard, J. F. Magnan, S. Besner, M. Gauthier and M. Armand, J. Power Sources, 2001, 97–98, 503 CrossRef CAS.
- J.-C. Daigle, Y. Asakawa, M. Beaupré, V. Gariépy, R. Vieillette, D. Laul, M. Trudeau and K. Zaghib, Sci. Rep., 2019, 9, 16871 CrossRef PubMed.
- K. Vediappan, A. Guerfi, V. Gariépy, G. P. Demopoulos, P. Hovington, J. Trottier, A. Mauger, C. M. Julien and K. Zaghib, J. Power Sources, 2014, 266, 99 CrossRef CAS.
- F. Brochu, A. Guerfi, J. Trottier, M. Kopeć, A. Mauger, H. Groult, C. M. Julien and K. Zaghib, J. Power Sources, 2012, 214, 1 CrossRef CAS.
- Z. Ma, G. Shao, Y. Fan, G. Wang, J. Song and T. Liu, ACS Appl. Mater. Interfaces, 2014, 6, 9236 CrossRef CAS PubMed.
- T. V. S. L. Satyavani, B. Ramya Kiran, V. Rajesh Kumar, A. Srinivas Kumar and S. V. Naidu, Eng. Sci. Technol. Int J., 2016, 19, 40 Search PubMed.
- Y. Zhao, L. Peng, B. Liu and G. Yu, Nano Lett., 2014, 14, 2849 CrossRef CAS PubMed.
- A. Paolella, G. Bertoni, S. Marras, E. Dilena, M. Colombo, M. Prato, A. Riedinger, M. Povia, A. Ansaldo, K. Zaghib, L. Manna and C. George, Nano Lett., 2014, 14, 6828 CrossRef CAS PubMed.
- N. M. Ncube, W. T. Mhlongo, R. I. McCrindle and H. Zheng, Mater. Today: Proc., 2018, 5, 10592 CAS.
- Q. Liang, N. Cao, Z. Song, X. Gao, L. Hou, T. Guo and X. Qin, Electrochim. Acta, 2017, 25, 407 CrossRef.
- M.-T. F. Rodrigues, G. Babu, H. Gullapalli, K. Kalaga, F. N. Sayed, K. Kato, J. Joyner and P. M. Ajayan, Nat. Energy, 2017, 2, 17108 CrossRef CAS.
- A. Banerjee, Y. Shilina, B. Ziv, J. M. Ziegelbauer, S. Luski, D. Aurbach and I. C. Halalay, J. Electrochem. Soc., 2017, 164, A6315 CrossRef CAS.
- N. P. W. Pieczonka, V. Borgel, B. Ziv, N. Leifer, V. Dargel, D. Aurbach, J.-H. Kim, Z. Liu, X. Huang, S. A. Krachkovskiy, G. R. Goward, I. Halalay, B. R. Powell and A. Manthiram, Adv. Energy Mater., 2015, 5, 1501008 CrossRef.
- Z. Zhang, T. Zeng, Y. Lai, M. Jia and J. Li, J. Power Sources, 2014, 247, 1 CrossRef CAS.
- W. Zhong, J. N. Zeuna and J. P. Claverie, J. Polym. Sci., Polym. Chem. Ed., 2012, 50, 4403 CrossRef CAS.
- M. Vasei, P. Das, H. Cherfouth, B. Marsan and J. P. Claverie, Front. Chem., 2014, 2, 47 Search PubMed.
- Z.-A. Zhang, C.-M. Qu, M. Jia, Y.-Q. Lai and J. Li, J. Cent. South Univ., 2014, 21, 2604 CrossRef CAS.
- J.-C. Daigle, Y. Asakawa, M. Beaupré, A. A. Arnold, D. Laul, M. Trudeau and K. Zaghib, J. Power Sources, 2019, 421, 116 CrossRef CAS.
- F. Otteny, V. Perner, D. Wassy, M. Kolek, P. Bieker, M. Winter and B. Esser, ACS Sustain. Chem. Eng., 2020, 8, 238 CrossRef CAS.
- H. Lyu, P. Li, J. Liu, S. Mahurin, J. Chen, D. K. Hensley, G. M. Veith, Z. Guo, S. Dai and X.-G. Sun, ChemSusChem, 2018, 11, 763 CrossRef CAS PubMed.
- N. Delaporte, R. L. Belanger, G. Lajoie, M. Trudeau and K. Zaghib, Electrochim. Acta, 2019, 308, 99 CrossRef CAS.
- D. C. Marcano, D. V. Kosynkin, J. M. Berlin, A. Sinitskii, Z. Sun, A. Slesarev, L. B. Alemany, W. Lu and J. M. Tour, ACS Nano, 2010, 4, 4806 CrossRef CAS PubMed.
- R. R. Zhao, Y. L. Cao, X. P. Ai and H. X. Yang, J. Electroanal. Chem., 2013, 688, 93 CrossRef CAS.
- L. Fédèle, F. Sauvage and M. Bécuwe, J. Mater. Chem. A, 2014, 2, 18225 RSC.
- M. Veerababu, U. V. Varadaraju and R. Kothandaraman, Int. J. Hydrogen Energy, 2015, 40, 14925 CrossRef CAS.
- A. Iordache, D. Bresser, S. Solan, M. Retegan, M. Bardet, J. Skrzypski, L. Picard, L. Dubois and T. Gutel, Adv. Sustainable Syst., 2017, 1, 1600032 CrossRef.
- M. Möbus, N. Karl and T. Kobayashi, J. Cryst. Growth, 1992, 116, 495 CrossRef.
- D. R. Dreyer, S. Park, C. W. Bielawsk and R. S. Ruoff, Chem. Soc. Rev., 2010, 39, 228 RSC.
- J. R. Lomeda, C. D. Doyle, D. V. Kosynkin, W.-F. Hwang and J. M. Tour, J. Am. Chem. Soc., 2008, 130, 16201 CrossRef CAS.
- Z. Q. Li, C. J. Lu, Z. P. Xia, Y. Zhou and Z. Luo, Carbon, 2007, 45, 1686 CrossRef CAS.
- F. T. Johra, J.-W. Lee and W.-G. Jung, J. Ind. Eng. Chem., 2014, 20, 2883 CrossRef CAS.
- W. Wu, J. Liu, X. Li, T. Hua, X. Cong, Z. Chen, F. Ying, W. Shen, B. Lu, K. Dou and X. Zhou, Corros. Eng. Sci. Techn., 2018, 53, 625 CrossRef CAS.
- S. Stankovich, D. A. Dikin, R. D. Piner, K. A. Kohlhaas, A. Kleinhammes, Y. Jia, Y. Wu, S. T. Nguyen and R. S. Ruoff, Carbon, 2007, 45, 1558 CrossRef CAS.
- G. Zhang, M. Wen, S. Wang, J. Chen and J. Wang, RSC Adv., 2018, 8, 567 RSC.
- D. A. Tenne, S. Park, T. U. Kampen, A. Das, R. Scholz and D. R. T. Zahn, Phys. Rev. B: Condens. Matter Mater. Phys., 2000, 61, 14564 CrossRef CAS.
- N. Delaporte, G. Lajoie, S. Collin-Martin and K. Zaghib, Sci. Rep., 2020, 10, 3812 CrossRef CAS.
- H. Saneifar, N. Delaporte, G. Shul and D. Bélanger, Mater. Chem. Phys., 2019, 235, 121739 CrossRef CAS.
- B. Priyono, A. Z. Syahrial, A. H. Yuwono, E. Kartini, M. Marfelly and W. M. F. Rahmatulloh, Int. J. Technol., 2015, 6, 555 CrossRef.
- Y. Li, W. Zhou, Y. Li, W. Huang, Z. Zhang, G. Chen, H. Wang, G.-H. Wu, N. Rolston, R. Vila, W. Chiu and Y. Cui, Joule, 2019, 3, 2854 CrossRef CAS.
- B. D. Ossonon and D. Bélanger, Carbon, 2017, 111, 83 CrossRef CAS.
- C. Kim, N. S. Norberg, C. T. Alexander, R. Kostecki and J. Cabana, Adv. Funct. Mater., 2013, 23, 1214 CrossRef CAS.
- X. Y. Wang, J. B. Zheng, L. Chen, X. J. Li and C. D. Cao, J. Mater. Sci.: Mater. Electron., 2017, 28, 2037 CrossRef CAS.
- G. Salvan, C. Himcinschi, A. Y. Kobitski, M. Friedrich, H. P. Wagner, T. U. Kampen and D. R. T. Zahn, Appl. Surf. Sci., 2001, 175, 363 CrossRef.
- T. L. Barr and S. Seal, J. Vac. Sci. Technol., A, 1995, 13, 1239 CrossRef CAS.
- N. Xu, X. Sun, X. Zhang, K. Wang and Y. Ma, RSC Adv., 2015, 5, 94361 RSC.
- Z. Xie, X. Li, W. Li, M. Chen and M. Qu, J. Power Sources, 2015, 273, 754 CrossRef CAS.
- N. Soin, S. S. Roy, S. Roy, K. S. Hazra, D. S. Misra, T. H. Lim, C. J. Hetherington and J. A. McLaughlin,, J. Phys. Chem. C, 2011, 115, 5366 CrossRef CAS.
- A. C. Ferrari and J. Robertson, Phys. Rev. B: Condens. Matter Mater. Phys., 2000, 61, 14095 CrossRef CAS.
- B. D. Ossonon and D. Bélanger, RSC Adv., 2017, 7, 27224 RSC.
- H. Lim, J. S. Lee, H. J. Shin, H. S. Shin and H. C. Choi, Langmuir, 2010, 26, 12278 CrossRef CAS PubMed.
- M. S. Dresselhaus, A. Jorio, M. Hofmann, G. Dresselhaus and R. Saito, Nano Lett., 2010, 10, 751 CrossRef CAS PubMed.
- L. M. Malard, M. A. Pimenta, G. Dresselhaus and M. S. Dresselhaus, Phys. Rep., 2009, 473, 51 CrossRef CAS.
- Y.-B. He, B. Li, M. Liu, C. Zhang, W. Lv, C. Yang, J. Li, H. Du, B. Zhang, Q.-H. Yang, J.-K. Kim and F. Kang, Sci. Rep., 2012, 2, 913 CrossRef PubMed.
- J. K. Yoon, S. Nam, H. C. Shim, K. Park, T. Yoon, H. S. Park and S. Hyun, Materials, 2018, 11, 803 CrossRef PubMed.
- M. Meissner, M. Gruenewald, F. Sojka, C. Udhardt, R. Forker and T. Fritz, Surf. Sci., 2012, 606, 1709 CrossRef CAS.
- J. H. Jeong, M.-S. Kim, Y.-H. Kim, K. C. Roh and K.-B. Kim, J. Power Sources, 2016, 336, 376 CrossRef CAS.
- H.-G. Jung, J. Kim, B. Scrosati and Y.-K. Sun, J. Power Sources, 2011, 196, 7763 CrossRef CAS.
- K. Zaghib, M. Simoneau, M. Armand and M. Gauthier, J. Power Sources, 1999, 81, 300 CrossRef.
- T. Ohzuku, A. Ueda and N. Yamamoto, J. Electrochem. Soc., 1995, 142, 1431 CrossRef CAS.
- L. Aldon, P. Kubiak, M. Womes, J. C. Jumas, J. Olivier-Fourcade, J. L. Tirado, J. I. Corredor and C. Pérez Vicente, Chem. Mater., 2004, 16, 5721 CrossRef CAS.
- P. Reale, S. Panero, B. Scrosati, J. Garche, M. Wohlfahrt-Mehrens and M. Wachtler, J. Electrochem. Soc., 2004, 151, A2138 CrossRef CAS.
- K. Amine, I. Belharouak, Z. Chen, T. Tran, H. Yumoto, N. Ota, S.-T. Myung and Y.-K. Sun, Adv. Mater., 2010, 22, 3052 CrossRef CAS PubMed.
- J. Ma, C. Wang and S. Wroblewski, J. Power Sources, 2007, 164, 849 CrossRef CAS.
- C. Ouyang, Z. Zhong and M. Lei, Electrochem. Commun., 2007, 9, 1107 CrossRef CAS.
- Y. Jin, X. Tang, Y. Wang, W. Dang, J. Huang and X. Fang, CrystEngComm, 2018, 20, 6695 RSC.
- L. Yu, H. B. Wu and X. W. D. Lou, Adv. Mater., 2013, 25, 2296 CrossRef CAS PubMed.
- J. Ren, H. Ming, Z. Jia, Y. Zhang, J. Ming, Q. Zhou and J. Zheng, Energy Technol., 2017, 5, 1680 CrossRef CAS.
- Y. Han, W. Ning, H. Du, J. Yang, N. Wang, L. Cao, F. Li, F. Zhang, F. Xu and M. Tian, Nanoscale, 2015, 7, 17116 RSC.
- N. Delaporte, A. Perea, R. Amin, K. Zaghib and D. Bélanger, J. Power Sources, 2015, 280, 246 CrossRef CAS.
- N. Delaporte, A. Perea, E. Lebègue, S. Ladouceur, K. Zaghib and D. Bélanger, ACS Appl. Mater. Interfaces, 2015, 7, 18519 CrossRef CAS PubMed.
- X. Wang, L. Shen, H. Li, J. Wang, H. Dou and X. Zhang, Electrochim. Acta, 2014, 129, 283 CrossRef CAS.
- W. Zhang, H. L. Zhuang, L. Fan, L. Gao and Y. Lu, Sci. Adv., 2018, 4, eaar4410 CrossRef PubMed.
- N. Delaporte, M. L. Trudeau, D. Bélanger and K. Zaghib, Materials, 2020, 13, 942 CrossRef PubMed.
- X. Li, J. Xu, P. Huang, W. Yang, Z. Wang, M. Wang, Y. Huang, Y. Zhou, M. Qu, Z. Yu and Y. Lin, Electrochim. Acta, 2016, 190, 69 CrossRef CAS.
- W. Li, X. Li, M. Chen, Z. Xie, J. Zhang, S. Dong and M. Qu, Electrochim. Acta, 2016, 139, 104 CrossRef.
- H. Wu, K. Wang, Y. Meng, K. Lu and Z. Wei, J. Mater. Chem. A, 2013, 1, 6366 RSC.
- Q. Li, D. Lu, J. Zheng, S. Jiao, L. Luo, C.-M. Wang, K. Xu, J.-G. Zhang and W. Xu, ACS Appl. Mater. Interfaces, 2017, 9, 42761 CrossRef CAS PubMed.
- S. S. Zhang, K. Xu and T. R. Jow, Electrochem. Commun., 2002, 4, 928 CrossRef CAS.
- E. J. Plichta and W. K. Behl, J. Power Sources, 2000, 88, 192 CrossRef CAS.
- L. F. Xiao, Y. L. Cao, X. P. Ai and H. X. Yang, Electrochim. Acta, 2004, 49, 4857 CrossRef CAS.
- T. R. Jow, M. S. Ding, K. Xu, S. S. Zhang, J. L. Allen, K. Amine and G. L. Henriksen, J. Power Sources, 2003, 119–121, 343 CrossRef CAS.
- S. Li, X. Li, J. Liu, Z. Shang and X. Cui, Ionics, 2015, 21, 901 CrossRef CAS.
- S. Li, Y. Zhao, X. Shi, B. Li, X. Xu, W. Zhao and X. Cui, Electrochim. Acta, 2012, 65, 221 CrossRef CAS.
- S. Zhang, K. Xu and T. Jow, J. Solid State Electrochem., 2003, 7, 147 CrossRef CAS.
- J. Li, C. F. Yuan, Z. H. Guo, Z. A. Zhang, Y. Q. Lai and J. Liu, Electrochim. Acta, 2012, 59, 69 CrossRef CAS.
- S. S. Zhang, K. Xu and T. R. Jow, J. Power Sources, 2003, 115, 137 CrossRef CAS.
- K. Xu, A. Von Cresce and U. Lee, Langmuir, 2010, 26, 11538 CrossRef CAS PubMed.
- T. Abe, H. Fukuda, Y. Iriyama and Z. Ogumi, J. Electrochem. Soc., 2004, 151, A1120 CrossRef CAS.
- A. Moretti, D. V. Carvalho, N. Ehteshami, E. Paillard, W. Porcher, D. Brun-Buisson, J.-B. Ducros, I. de Meatza, A. Eguia-Barrio, K. Trad and S. Passerini, Batteries, 2019, 5, 45 CrossRef.
- M. S. Milien, J. Hoffmann, M. Payne and B. L. Lucht, J. Electrochem. Soc., 2018, 165, A3925 CrossRef CAS.
- S.-M. Yun, J.-W. Kim, M.-J. Jung, Y. C. Nho, P. H. Kang and Y. S. Lee, Carbon Lett., 2007, 8, 292 CrossRef.
- N. Delaporte, M. L. Trudeau, D. Bélanger and K. Zaghib, Materials, 2020, 13, 942 CrossRef PubMed.
- D. Briggs and G. Beamson, Anal. Chem., 1992, 64, 1729 CrossRef CAS.
- D. Briggs and G. Beamson, Anal. Chem., 1993, 65, 1517 CrossRef CAS.
- A. N. Mansour, D. G. Kwabi, R. A. Quinlan, Y.-C. Lu and Y. Shao-Horn, J. Electrochem. Soc., 2016, 163, A2911 CrossRef CAS.
- J. Pan, Y.-T. Cheng and Y. Qi, Phys. Rev. B: Condens. Matter Mater. Phys., 2015, 91, 134116 CrossRef.
- X. Guo, H. F. Xiang, T. P. Zhou, X. K. Ju and Y. C. Wu, Electrochim. Acta, 2014, 130, 470 CrossRef CAS.
- M. Park, X. Zhang, M. Chung, G. B. Less and A. M. Sastry, J. Power Sources, 2010, 195, 7904 CrossRef CAS.
Footnote |
| † Electronic supplementary information (ESI) available. See DOI: 10.1039/d0ma00227e |
| This journal is © The Royal Society of Chemistry 2020 |

