 Open Access Article
Synthesis, fluorescence property and cell imaging of a perylene diimide-based NIR fluorescent probe for hypochlorite with dual-emission fluorescence responses†
Huan-ren
Cheng
 *a,
Botao
Qu
b,
Chen
Qian
a,
Meng
Xu
*c and
Ruiping
Zhang
*b
aSchool of Chemical Engineering, Yangzhou Polytechnic Institute, Yangzhou 225127, China. E-mail: cheng_huanren@163.com
bSchool of Basic Medical Sciences, Shanxi Medical University, Taiyuan 030001, China. E-mail: zrp-7142@163.com
cTongji Medical College, Huazhong University of Science and Technology, Wuhan 430022, China. E-mail: Xumeng@163.com
First published on 10th June 2020
Abstract
In this study, for the first time, a novel near-infrared and ratiometric fluorescent probe was conveniently synthesized by reacting PDI-based salicylaldehyde with 2-(hydrazonomethyl)phenol. The probe was designed based on the intramolecular charge transfer (ICT) mechanism and the intramolecular electron transfer (IET) mechanism, which can be blocked by the hypochlorite and a larger conjugation is formed within the probe. Due to the turn-on fluorescence responses triggered by the PET and ICT processes after the ClO− addition, the probe produces simultaneous emission peaks at 600 nm and 820 nm. In addition, the probe shows a rapid fluorescence response towards the ClO− ions within 5 s, a low detection limit (0.8 × 10⁻⁷ M), intense color changes (from purple to light green), excellent selectivity, and reversibility. Importantly, cell imaging experiments show that the probe can identify endogenous ClO− successfully.
Introduction
Fluorescent chemosensors because of their fast detection speed, high sensitivity and simple operation have been widely used in biological tracing, ion detection, environmental protection and other fields. Today, fluorescent chemosensors used as detection tools for toxic ions or small molecules are getting increasing attention. In recent years, a large number of fluorescent sensors for the detection of ions or small molecules have been reported.1–5 Among these ions or small molecules, hypochlorite (ClO−) as a reactive oxygen species plays an important role in our daily life. However, excessive hypochlorite easily causes a variety of diseases.6–8 Therefore, it is necessary to develop fluorescent chemosensors for the real-time monitoring of hypochlorous acid/hypochlorite.To date, numerous fluorescent probes for ClO− have been reported.9–25 Most of these fluorescence probes for ClO− were a type of short wavelength response probes. Such probes have some prominent disadvantages, such as strong background effect, shallow imaging depth, and poor anti-infection ability. In order to overcome these defects, near-infrared ratiometric fluorescent probes were developed quickly.26–30 Compared with the common fluorescent probes, near-infrared ratiometric fluorescent probes are overwhelming because of their unique advantages: deeper imaging depth, stronger anti-interference energy, and less tissue damage.
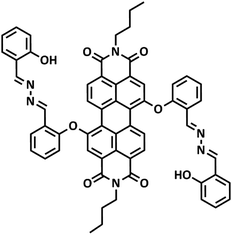
It is known that perylene diimide (PDI) derivatives as excellent fluorophores have been widely studied, most of them are designed based on the PET mechanism, and almost none are designed based on both the PET and ICT mechanism.31–36 In this study, a new near-infrared ratiometric fluorescence probe, namely PDI-SY, was successfully designed and easily obtained by a direct condensation reaction between the PDI-based salicylaldehyde and 2-(hydrazonomethyl)phenol (Fig. 1). PDI-SY produces simultaneous emission peaks at 600 nm and 820 nm, when ClO− is added. In addition, PDI-SY shows high sensitivity and selectivity in a fluorescence ‘‘turn-on’’ manner, the probe can efficiently monitor ClO− with rapid fluorescence responses within 5 s, with a low detection limit (0.8 × 10⁻⁷ M) and intense color changes (from purple to light green). Further 1H-NMR study also suggests that the PET and ICT mechanisms were involved after the addition of ClO− ions. Moreover, the cell imaging experiments show that the probe can identify endogenous ClO− successfully.
Results and discussion
Synthesis of the probe PDI-SY
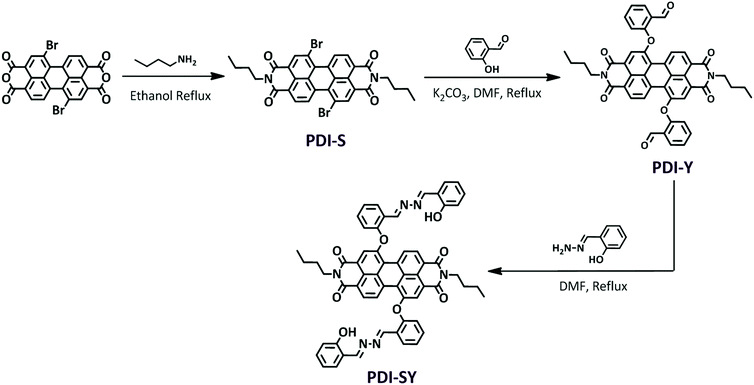
The preparation of PDI-SY is shown in Scheme 1, the key intermediate compound PDI-Y was prepared via a simple electrophilic substitution reaction between PDI-S and salicylaldehyde, affording PDI-Y with 95% yield. All the intermediates and materials used in the synthesis process do not need to be further purified, the materials are cheap and readily available, which greatly reduce the synthesis cost of the probe PDI-SY. All the intermediates and the probe molecule PDI-SY were fully characterized via1H NMR, 13C NMR, and high-resolution mass spectrometry (HRMS-MALDI-TOF); the detailed synthesis procedure of the PDI-SY has been discussed in the synthesis part.Ratiometric absorption and dual emission of PDI-SY before and after reaction with ClO−
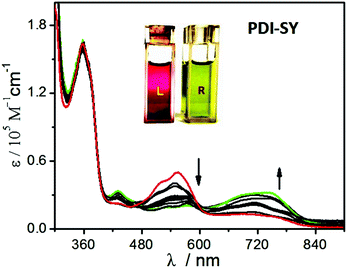
The absorption and fluorescence emission properties of PDI-SY (2 μM) before and after the reaction with ClO− were studied in an optimized mixture of the PBS buffer solution (pH 7.4). All the measurements were carried out in PBS buffer (pH 7.4). As shown in Fig. 2, PDI-SY exhibited maximum absorption peaks at around 354 nm and 556 nm without any other ions. Moreover, PDI-SY showed a weak emission at 520 nm, as shown in Fig. 3. However, upon the addition of ClO− (0–20 μM), a new absorption peak at around 720 nm increased dramatically, while the absorption signals at 556 nm decreased gradually. When ClO− was added to 2 equivalents, the reaction basically completed, which was concomitant with a remarkable color change from purple to light green, as shown in Fig. 2 inset. Moreover, upon the addition of ClO−, the emission peak at 520 nm decreased gradually, while a new sharp enhancement of the fluorescence emission at 600 nm (Φ1Free < 0.1, Φ1Hypochlorite = 0.58) and 820 nm (Φ2Free < 0.1, Φ2Hypochlorite = 0.18) was observed, as shown in Fig. 3. When ClO− was added to 2 equivalents, the reaction was basically completed; the new emission peaks at 600 nm and 820 nm reached a maximum value. From the spectral property of PDI-SY, it could be confirmed that PDI-SY can be used as a ratiometric fluorescent probe for sensing ClO−.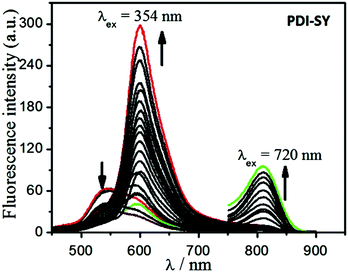 | ||
Fig. 3 Dual emission fluorescence spectra of PDI-SY as a function of the ClO− concentration, ([PDI-SY] = 2 μM, λex = 354 nm and 720 nm, VTHF/H2O = 1![[thin space (1/6-em)]](https://www.rsc.org/images/entities/char_2009.gif) : :![[thin space (1/6-em)]](https://www.rsc.org/images/entities/char_2009.gif) 3, pH = 7.4, PBS buffer). 3, pH = 7.4, PBS buffer). | ||
Moreover, a linear relationship between the concentrations of ClO− and the fluorescence intensity values of PDI-SY at 600 nm was observed (as shown in Fig. 3), the linear fitting curve of PDI-SY at 600 nm is shown in Fig. 4. According to this fitted equation, the detection limit of PDI-SY was measured to be 0.8 × 10⁻⁷ M (3σ/slope, σ is the standard deviation of the blank measurement). The above studies showed that PDI-SY can accurately and sensitively detect ClO− (Table 1).
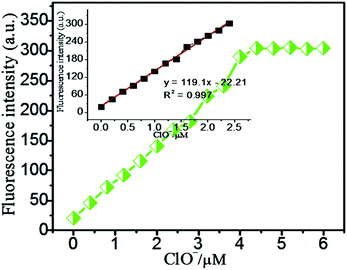 | ||
Fig. 4 Linear fitting curve of the probe PDI-SY with ClO−, ([PDI-SY] = 2 μM, [ClO−] = 2 equivalents, λem = 600 nm, VTHF/H2O = 1![[thin space (1/6-em)]](https://www.rsc.org/images/entities/char_2009.gif) : :![[thin space (1/6-em)]](https://www.rsc.org/images/entities/char_2009.gif) 3). 3). | ||
| Compounds | λ max (nm) | λ em (nm) | Δv1/Δv2c (cm−1) | Φ 1 at 600 nm | Φ 2 at 820 nm |
|---|---|---|---|---|---|
| a Absorption maximum. b Emission maximum. c Stoke's shift = (1/λabs − 1/λem) × 107. d Fluorescence quantum yield, the fluorescence quantum yields were determined using rhodamine 6G and PDI (Φ = 0.95) as a standard, the max absorbance was used as the excited wavelength.37 | |||||
| PDI-SY | 354/556 | 600 | 3947 | <0.1 | <0.1 |
| PDI-SY-ClO− | 556/720 | 600/820 | 1692 | 0.58 | 0.18 |
Rapid time responses of PDI-SY for ClO− ions
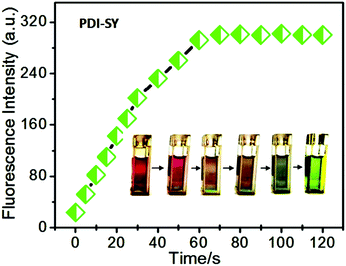
The reaction rate of PDI-SY with the ClO− ions is an important parameter to value its real-time tracking capability. As shown in Fig. 5, the reaction of PDI-SY with ClO− can be triggered within 5 s without stirring, and completed in 60 s with a maximum emission intensity, indicating that PDI-SY can be employed as a rapid analytical chemosensor for the ClO− detection. Simultaneously, the color of the solution containing PDI-SY changed from purple to light green gradually, as shown in Fig. 5 inset. The results demonstrate that PDI-SY has the ability for real-time monitoring of hypochlorite.Selectivity and reversibility of PDI-SY to various ions
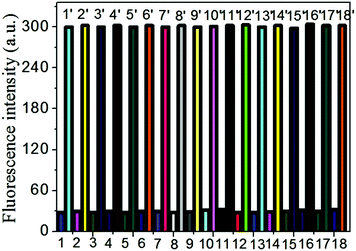
The interference experiments of the probe PDI-SY with other ions such as NO2−, m-Cl-ph-COOH, glutathione, cysteine, NO3−, PO43− H2O2, Fe3+, Ag+, Ba2+, Co2+, Ni2+, Cu2+, Zn2+, Cd3+, Pb2+, Mn2+ and Fe2+ were taken into account. First, eighteen parts of the PDI-SY solution with the same concentration were prepared. Then, the other ions were added to the solution, respectively. The fluorescence spectra of PDI-SY at 600 nm were collected. At last, ClO− ions were added to the mixed solutions of PDI-SY with the other ions. All the fluorescence spectra excited at 354 nm were collected. As shown in Fig. 6, none of the other ions caused any fluorescence emission, while an obvious fluorescence enhancement occurred only after the addition of ClO−, indicating that PDI-SY can detect ClO− specifically.PDI-SY shows good reversibility to ClO− (as oxidant) and S2− (as a reducing agent); the reversibility experiment was carried out by recording the emission intensity of PDI-SY at 600 nm with respect to the change of the ions ClO−/S2− up to 5 cycles. Fig. 7 shows the fluorescence intensity change of PDI-SY for 5 cycles. The relative standard deviations from five replicates were estimated to be <2%.
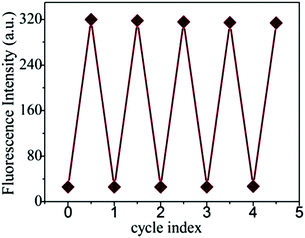 | ||
Fig. 7 Fluorescence intensity of PDI-SY at 600 nm ([PDI-SY] = 2 μM, λex = 354 nm, in VTHF/H2O = 1![[thin space (1/6-em)]](https://www.rsc.org/images/entities/char_2009.gif) : :![[thin space (1/6-em)]](https://www.rsc.org/images/entities/char_2009.gif) 3, pH = 7.4, PBS buffer) upon addition of ClO− (2 equiv.) and S2− solution up to 5 cycles. 3, pH = 7.4, PBS buffer) upon addition of ClO− (2 equiv.) and S2− solution up to 5 cycles. | ||
PET and ICT-based mechanism discussion of PDI-SY with ClO− ions
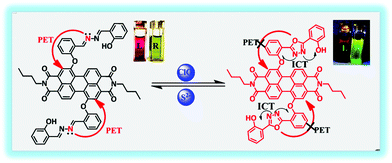
The possible mechanism of the PDI-SY reaction with the ClO− ions is shown in Fig. 8, a PET process from the dibenzyliden–ehydrazine to the PDI core in the excited PDI-SY blocks the fluorescence emission of the PDI core. After the addition of the ClO− ions, an oxidation reaction between PDI-SY and ClO− ions occurred. The result of the oxidation reaction produces a new 1,3,4-oxadiazole ring that increases the conjugate plane of the new molecule, blocking the PET process in the probe, and producing the ICT process. Thus, the fluorescence of the probe recovered, and a new absorption peak at 720 nm appeared. Moreover, the reaction mechanism of PDI-SY with the ClO− ions has been proved by 1H NMR. As shown in Fig. 9, the 1H NMR shifts of C![[double bond, length as m-dash]](https://www.rsc.org/images/entities/char_e001.gif) N–H in the probe is 11.0 ppm. However, after two equiv. of ClO− was added, the peak at 11 ppm disappeared completely; simultaneously, no other new peak appeared. This change of 1H NMR combined with the spectral property of PDI-SY strongly proves the possible mechanism of PDI-SY for the detection of ClO− ions, as shown in Fig. 8. This discussion above is helpful for us to develop some new probes in the follow-up research work.
N–H in the probe is 11.0 ppm. However, after two equiv. of ClO− was added, the peak at 11 ppm disappeared completely; simultaneously, no other new peak appeared. This change of 1H NMR combined with the spectral property of PDI-SY strongly proves the possible mechanism of PDI-SY for the detection of ClO− ions, as shown in Fig. 8. This discussion above is helpful for us to develop some new probes in the follow-up research work.
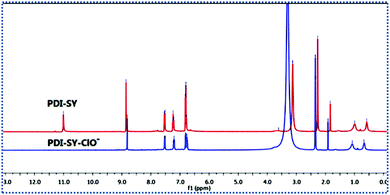 | ||
| Fig. 9 1H NMR spectra of PDI-SY in the absence (top) and presence (bottom) of two equiv. of ClO− in deuterated DMSO-d6. | ||
Confocal laser scanning microscopy images of PDI-SY with 4T1 cells
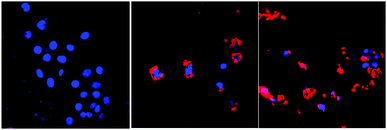
4T1 cells (≈10![[thin space (1/6-em)]](https://www.rsc.org/images/entities/char_2009.gif) 000 cells per well) plated on a 96-well plate were cultured in fresh media that contained 10% fetal calf serum. PDI-SY at various concentrations was added and cultivated at 37 °C for 0.5 h. Then, 20 μl of NaClO (10 μM) was added to the well for 30 min. The CLSM imaging was performed on an Olympus FLUOVIEW FV1000 confocal laser scanning microscope. The cell nuclei were stained with DAPI (blue) and the cytoplasms were stained with NaClO modified PDI-SY (red), as shown in Fig. 10.
000 cells per well) plated on a 96-well plate were cultured in fresh media that contained 10% fetal calf serum. PDI-SY at various concentrations was added and cultivated at 37 °C for 0.5 h. Then, 20 μl of NaClO (10 μM) was added to the well for 30 min. The CLSM imaging was performed on an Olympus FLUOVIEW FV1000 confocal laser scanning microscope. The cell nuclei were stained with DAPI (blue) and the cytoplasms were stained with NaClO modified PDI-SY (red), as shown in Fig. 10.
Conclusions
In summary, a near-infrared and ratiometric fluorescent probe PDI-SY designed on the PET and ICT mechanism, which features a robust fluorescence “light-up” responses to ClO− was successfully synthesized and PDI-SY was fully characterized by 1H NMR, 13C NMR, and high-resolution mass spectrometry. The probe can efficiently monitor ClO− with rapid spectral responses within 5 s, low detection limit (0.8 × 10⁻⁷ M) and intense color changes (from purple to light green). In addition, PDI-SY can be used to detect the hypochlorite for 5 cycles, the new detection mechanism of PDI-SY for ClO− ions was proved by 1H NMR for the first time. More importantly, the application of ClO− detection in cell imaging has also been achieved. Therefore, we expect that PDI-SY may provide a new strategy for the detection of ClO− in biological application.Experimental
Materials and methods
1H NMR and 13C NMR spectra were recorded on a Bruker ADVANCE 300 NMR spectrometer in CDCl3 or DMSO. HRMS were recorded on an Ultraflex II MALDI-TOF mass spectrometer. UV-visible absorption spectra were recorded on a Shimadu UV-3600 spectrophotometer. Fluorescence spectra were recorded on a HORIBA FL-4 Max spectrometer. FT-IR spectra were recorded on a Nicolet 750 series in the region of 4000–400 cm−1. The CLSM imaging was performed on Olympus FLUOVIEW FV1000 confocal laser scanning microscope. All the reagents used were purchased from Aladdin. The solvent used in the test was PBS buffer.Synthesis
Compound 2-(hydrazonomethyl)phenol was prepared our laboratory according to the modified published methods.38 The structure of the compounds PDI-S, PDI-Y and the compound PDI-SY was characterized by 1H NMR and their spectra have been displayed in the ESI.†![[double bond, length as m-dash]](https://www.rsc.org/images/entities/char_e001.gif) C–H); 2932–2980 (νC–H); 1602 (νasH–C
C–H); 2932–2980 (νC–H); 1602 (νasH–C![[double bond, length as m-dash]](https://www.rsc.org/images/entities/char_e001.gif) C) 1498 (νs–C
C) 1498 (νs–C![[double bond, length as m-dash]](https://www.rsc.org/images/entities/char_e001.gif) C) 1276 (νC–O).1H NMR (DMSO, ppm): δ 11.12 (s, 4H), 8.99 (s, 4H), 7.68 (m, 5H), 7.42–7.38 (t, 5H, J = 6 Hz), 6.99–6.95 (m, 10H), 3.86–3.80 (m, 4H), 2.07 (m, 2H), 1.25 (m, 6H), 0.88 (m, 6H). 13C NMR (DMSO, ppm): δ 192.17, 162.78, 161.20, 136.89, 129.65, 122.76, 117.69, 36.25, 31.24, 22.97, 14.39. TOF-MS-ES: m/z. Calculated: [M + H]+ = 979.3450, found: [M + H]+ = 979.3450.
C) 1276 (νC–O).1H NMR (DMSO, ppm): δ 11.12 (s, 4H), 8.99 (s, 4H), 7.68 (m, 5H), 7.42–7.38 (t, 5H, J = 6 Hz), 6.99–6.95 (m, 10H), 3.86–3.80 (m, 4H), 2.07 (m, 2H), 1.25 (m, 6H), 0.88 (m, 6H). 13C NMR (DMSO, ppm): δ 192.17, 162.78, 161.20, 136.89, 129.65, 122.76, 117.69, 36.25, 31.24, 22.97, 14.39. TOF-MS-ES: m/z. Calculated: [M + H]+ = 979.3450, found: [M + H]+ = 979.3450.
Conflicts of interest
There are no conflicts to declare.Acknowledgements
This work was supported by PhD Botao Qu for confocal laser scanning cell images, the“Qinglan project” of Jiangsu Province (2018–2012) College of Chemistry and Chemical Engineering, Yangzhou Polytechnic Institute, the Fundamental Research Funds for the National Natural Science Foundation of China (No. 51372077), and the Natural Science Foundation of Shanxi Province (No. 201901D111213).References
- Y. Y. Zhang, Y. F. Ma, Z. Wang, X. Y. Zhang, X. Chen and H. M. Wang, Analyst, 2020, 145, 939–945 RSC.
- X. J. He, C. C. Xu, W. Xiong, Y. Qian, J. Y. Fan, F. Ding, H. Deng, H. Chen and J. L. Shen, Analyst, 2020, 145, 29–33 RSC.
- Y. P. Pan, Y. Yan, Y. Li, X. W. Gao and D. B. Chao, New J. Chem., 2019, 43, 15120–15125 RSC.
- S. Malkondu, S. Erdemir and S. Karakurt, Dyes Pigm., 2020, 174, 108019 CrossRef CAS.
- X. P. Lin, Y. L. Chen, L. Bao, S. J. Wang, K. Y. Liu, W. D. Qin and F. G. Kong, Dyes Pigm., 2020, 174, 108113 CrossRef CAS.
- G. C. Bittner, C. R. Bertozzi and C. J. Chang, J. Am. Chem. Soc., 2013, 135, 1783–1795 CrossRef PubMed.
- K. B. Li, L. Dong, S. Zhang, W. Shi, W. P. Jia and D. M. Han, Talanta, 2017, 165, 593–597 CrossRef CAS PubMed.
- N. Güngör, A. M. Knaapen, A. Munnia, M. Peluso, G. R. Haenen, R. K. Chiu, R. W. L. Godschalk and F. J. Van Schooten, Mutagenesis, 2010, 25, 149–154 CrossRef PubMed.
- Y. C. Du, B. W. Wang, D. Jin, M. R. Li, Y. Li, X. L. Yan, X. Q. Zhou and L. G. Chen, Anal. Chim. Acta, 2019, 12, 23 Search PubMed.
- C. P. Jiao, Y. Y. Liu, W. J. Lu, P. P. Zhang, X. Ma and Y. F. Wang, RSC Adv., 2019, 9, 31196–31201 RSC.
- M. R. Li, F. K. Du, P. Xue, X. C. Tan, S. G. Liu, Y. Zhou, J. Chen and L. J. Bai, Spectrochim. Acta, Part A, 2020, 227, 117760 CrossRef CAS PubMed.
- J. Lv, F. Wang, T. W. Wei and X. Q. Chen, Ind. Eng. Chem. Res., 2017, 56, 3757–3764 CrossRef CAS.
- W. J. Shi, Y. Huang, W. C. Liu, D. Xu, S. T. Chen, F. G. Liu, J. Q. Hu, L. Y. Zheng and K. Chen, Dyes Pigm., 2019, 170, 107566 CrossRef CAS.
- X. H. Xu, C. Liu, Y. Mei and Q. H. Song, J. Mater. Chem. B, 2019, 7, 6861–6867 RSC.
- X. L. Zhong, Q. Yang, Y. S. Chen, Y. L. Jiang, B. X. Wang and J. Shen, J. Mater. Chem. B, 2019, 7, 7332–7337 RSC.
- J. S. Lan, L. Liu, R. F. Zeng, Y. H. Qin, Y. Liu, X. Y. Jiang, A. Aihemaiti, Y. Ding, T. Zhang and R. J. Y. Hoc, Chem. Commun., 2020, 56, 1219–1222 RSC.
- G. J. Mao, G. Q. Gao, Z. Z. Liang, Y. Y. Wang, L. Su, Z. X. Wang, H. Zhang, Q. J. Ma and G. S. Zhang, Anal. Chim. Acta, 2019, 1081, 184–192 CrossRef CAS PubMed.
- M. Ren, Z. H. Li, J. Nie, L. Wang and W. Y. Lin, Chem. Commun., 2018, 54, 9238–9241 RSC.
- D. Wu, L. Y. Chen, Q. L. Xu, X. Q. Chen and J. Y. Yoon, Acc. Chem. Res., 2019, 52, 2158–2168 CrossRef CAS PubMed.
- Y. L. Pak, S. J. Park, Q. L. Xu, H. Myung Kim and J. Yoon, Anal. Chem., 2018, 90, 9510–9514 CrossRef CAS PubMed.
- L. Wang, X. L. Chen, Q. Xia, R. Y. Liu and J. Q. Qu, Ind. Eng. Chem. Res., 2018, 57, 7735–7741 CrossRef CAS.
- Y. V. Zatsikha, N. O. Didukh, R. K. Swedin, V. P. Yakubovskyi, T. S. Blesener, A. T. Healy, D. E. Herbert, D. A. Blank, V. N. Nemykin and Y. P. Kovtun, Org. Lett., 2019, 21, 5713–5718 CrossRef CAS PubMed.
- B. L. Huo, M. Du, A. Shen, M. W. Li, Y. R. Lai, X. Bai, A. J. Gong, L. Q. Fang and Y. X. Yang, Sens. Actuators, B, 2019, 284, 23–29 CrossRef CAS.
- Y. L. Zhu, K. N. Wang, X. W. Wu, Y. N. Sun, X. S. Gong, D. X. Cao, R. F. Guan and Z. Q. Liu, Talanta, 2020, 209, 120548 CrossRef CAS PubMed.
- Y. F. Huang, Y. B. Zhangb, F. J. Huob, J. B. Chaob and C. Yin, Sens. Actuators, B, 2019, 287, 453–458 CrossRef CAS.
- Y. L. Wu, J. Wang, F. Zeng, S. L. Huang, J. Huang, H. T. Xie, C. M. Yu and S. Z. Wu, ACS Appl. Mater. Interfaces, 2016, 8(2), 1511–1519 CrossRef CAS PubMed.
- C. DuanMiae, W. VerwilstJunchao, X. Seok, K. Zeng and J. S. Kim, Anal. Chem., 2019, 91(6), 4172–4178 CrossRef PubMed.
- X. M. Zou, X. B. Zhou, C. Cao, W. Y. Lu, W. Yuan, Q. Y. Liu, W. Feng and F. Y. Li, Nanoscale, 2019, 11, 2959–2965 RSC.
- C. Xu, Y. Qian, Z. Q. Qi, C. G. Lu and Y. P. Cui, New J. Chem., 2018, 42, 6910–6917 RSC.
- Y. Y. Zhang, Y. F. Ma, Z. Wang, X. Y. Zhang, X. Chen, S. C. Hou and H. M. Wang, Analyst, 2020, 145, 939–945 RSC.
- H. B. Gobeze, L. M. Arellano, A. M. Gutiérrez-Vílchez, M. J. Gómez-Escalonilla, Á. Sastre-Santos, F. Fernández-Lázaro, F. Lang and F. D'Souz, Nanoscale Adv., 2019, 1, 4009–4015 RSC.
- W. Zhang, Y. Song, S. J. He, L. Shang, R. N. Ma, L. P. Jia and H. S. Wang, Nanoscale, 2019, 11, 20910–20916 RSC.
- Y. X. Zhou, B. Xue, C. Y. Wu, S. Q. Chen, H. Liu, T. G. Jiu, Z. B. Li and Y. J. Zhao, Chem. Commun., 2019, 55, 13570–13573 RSC.
- M. Li, J. Xu, W. F. Guo, W. C. Zhong, Q. Li, L. L. Tan and L. Shang, Sens. Actuators, B, 2020, 305, 127422 CrossRef.
- P. Singh, L. S. Mittal, K. Kumar, P. Sharma, G. Bhargava and S. Kumara, Chem. Commun., 2018, 54, 9482–9485 RSC.
- K. Kumar, S. Kaur, S. Kaur, G. Bhargava, S. Kumar and P. Singh, J. Mater. Chem. B, 2020, 8, 125–135 RSC.
- J. N. Demas and G. A. Crosby, J. Phys. Chem., 1971, 75, 991–1024 CrossRef.
- B. Gregory, L, N. Donna M and J. Branko S, Bioorg. Med. Chem., 2014, 22(17), 4629–4636 CrossRef PubMed.
Footnote |
| † Electronic supplementary information (ESI) available. See DOI: 10.1039/d0ma00131g |
| This journal is © The Royal Society of Chemistry 2020 |

