 Open Access Article
Understanding the self-templating of hierarchically porous carbon electrocatalysts using Group 2 coordination polymers†
Eliyahu M.
Farber
 ,
Kasinath
Ojha
 ,
Tomer Y.
Burshtein
 ,
Lihi
Hasson
and
David
Eisenberg
 *
*
Schulich Faculty of Chemistry and the Grand Technion Energy Program, Technion–Israel Institute of Technology, Technion City, Haifa 3200003, Israel. E-mail: eisenberg@technion.ac.il
First published on 30th March 2020
Abstract
Self-templating of hierarchical porosity in carbon materials can be realized by the pyrolysis of well-designed metal–organic precursors. While this strategy is elegant and scalable, detailed mechanistic understanding of the self-templating process is lacking. We now report a systematic investigation of the microstructural evolution in porous carbons, including hierarchically micro-/meso-/macroporous materials with variable mesopore size. We focus on a homologous series of well-defined metal–organic coordination polymers, combining the highly abundant Group 2 ions (Mg2+, Ca2+, Sr2+, Ba2+) with a common ligand. To understand the role of the metal ion in directing the morphology of the ultimate N-doped carbons, we performed a detailed investigation using electron microscopy (HRSEM, HRTEM, EDS), N2 porosimetry, XRD, XPS and Raman spectroscopy. The rich morphological variations in the carbons determine their activity as metal-free electrocatalysts towards the oxygen reduction reaction. In particular, the reaction selectivity (2e−vs. 4e− pathways) is directed by competition between kinetics and mass transfer, due to confinement in mesopores.
1. Introduction
Carbon electrodes are important in many applications, including batteries, supercapacitors, and fuel cell catalysts.1–5 Carbon offers enormous structural versatility, easy doping by metals and non-metals, and potentially low price. The morphology of the carbon is particularly important for electrocatalysis, as it governs two parallel modes of transport to catalytic sites: electrical conductivity through graphitic domains, and mass transport of reactants and products through a network of pores. Hierarchically porous carbons, combining micropores (d < 2 nm) with meso- (2 < d < 50) and macro-pores (50 < d) are promising for exposing catalytic sites to efficient flow of reactants and products.6–9Rational design of complex carbon morphologies is highly challenging, since precise structural control is typically at odds with simplicity of synthesis. Precise carbon structures can be obtained by multi-step, sequential syntheses involving lithography, patterning, and/or external templating.10–15 The resulting carbons are ideal for fundamental studies in catalysis, yet the practical applicability of the synthesis is often limited by its high complexity and low yields. Alternatively, pyrolysis of abundant biomass- or petroleum-based precursors is much more cost-effective, and the vast number of organic precursors leads to many interesting structures and useful electrocatalysts.16,17 However, this strategy relies on serendipity, with few knobs for controlling carbon doping, porosity and conductivity. Thus, new synthetic strategies are needed, to expand the scope of carbon structures without compromising precision or simplicity.
The self-templating, or endo-templating synthetic strategy combines advantages from both approaches (Fig. 1),18–23 being a type of hard templating, yet avoiding the addition of any external template. Simple yet specifically designed metal–organic coordination polymers (MOCPs) serve as both a source and a spontaneous template for the final carbon material. During pyrolysis, the organic ligands are carbonized to yield a carbon matrix, doped by atomic or nanoparticulate metal sites.24–28 In parallel, inorganic particles form inside the carbon; they can then be washed away, serving as in situ templates for meso- and macropores (depending on the degree of agglomeration). Furthermore, the presence of the metal ions during pyrolysis contributes to micropore etching and to carbon exfoliation, boosting surface area and exposure of catalytic sites.29 Thus, careful design of the metal–organic precursors can expand the scope of controlled nanostructures, and enable fundamental studies of synthesis–structure and structure–activity correlations in these promising electrocatalysts materials.
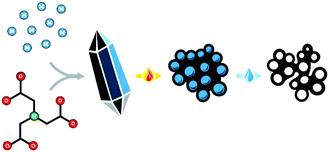 | ||
| Fig. 1 Self-templating synthesis of hierarchically porous carbon materials, involving the precipitation, pyrolysis and washing of a well-defined metal–organic precursor. | ||
We now report a systematic study of the self-templating synthesis of carbon materials, using Group 2 MOCP precursors. Alkaline earth metal ions are highly abundant: Mg2+, Ca2+, Sr2+ and Ba2+ are the 7th, 5th, 14th and 16th most abundant elements in the earth's crust, respectively.30 Importantly for electrocatalysis research, Group 2 metal ions are electrocatalytically inactive, allowing them to direct structure formation without masking the catalytic activity. Nevertheless, these promising elements are under-represented in the field of MOCP-derived carbons, dominated by precursors based on Fe2+/3+, Co2+, Zn2+, and Al3+ salts.4 Only a handful of Group 2 MOCPs have been reported as carbon precursors, mostly for Mg2+.19–21,31–35 Systematic studies of synthesis–structure trends are scarce,19,20,36 and structure–activity correlations are often limited to the observation that meso- and macropores boost current densities, probably due to improved mass transport.
To understand in detail how the carbon microstructure evolves during the self-templating synthesis, to explore the expected richness of Group 2-derived precursors, and to try and correlate structure to electrocatalytic activity, we took a systematic approach. We prepared a homologous series of MOCPs based on Mg2+, Ca2+, Sr2+ and Ba2+ with a single common ligand, nitrilotriacetic acid (H3NTA). The ligand is both cheap and flexible, providing high binding versatility to different ion sizes.37 By combining a broad range of material characterization techniques with oxygen reduction reaction (ORR) electrocatalytic studies, we investigated the effect of the metal ion on the material morphology throughout the self-templating pathway. The carbons produced by this method spanned the full porosity range between pure microporosity to rich hierarchical porosity. The pore size distribution was found to determine both ORR activity (through boosting flow) and selectivity (through confinement of intermediates).
2. Experimental
2.1 Synthesis of metal coordination polymers (MOCPs)
We previously reported the synthesis of MgNTA and the carbon derived from it.21 In this paper, we delve deeper into the self-templating mechanism, and expand the synthesis to Ca2+, Sr2+ and Ba2+-based coordination polymers. Briefly, metal carbonate, metal hydroxide and nitrilotriacetic acid were mixed in water at a 4![[thin space (1/6-em)]](https://www.rsc.org/images/entities/char_2009.gif) :
:![[thin space (1/6-em)]](https://www.rsc.org/images/entities/char_2009.gif) 1
1![[thin space (1/6-em)]](https://www.rsc.org/images/entities/char_2009.gif) :
:![[thin space (1/6-em)]](https://www.rsc.org/images/entities/char_2009.gif) 5 molar ratio (based on metal ions and NTA units). A clear solution was obtained and stirred for 10 min at 85 °C, then left to cool to room temperature. To complete the precipitation, ethanol was gradually added and the solution was ice-cooled. The resulting white precipitate was vacuum filtered, washed with cold ethanol, and vacuum dried at 50 °C for 2 days. The synthesis has been repeated >3 times for each precursor, with identical results.
5 molar ratio (based on metal ions and NTA units). A clear solution was obtained and stirred for 10 min at 85 °C, then left to cool to room temperature. To complete the precipitation, ethanol was gradually added and the solution was ice-cooled. The resulting white precipitate was vacuum filtered, washed with cold ethanol, and vacuum dried at 50 °C for 2 days. The synthesis has been repeated >3 times for each precursor, with identical results.
2.2 Synthesis of carbons
The MOCP powders were pyrolyzed at 750 °C in Ar atmosphere for 1 h (heating rate 10 °C min−1). These inorganic/carbon composites are denoted as MX@NC, where M = Mg, Ca, Sr, Ba, and X is the anion(s). The inorganic phase was dissolved in hydrochloric acid (1 M, 72 hours), and the resulting carbon (denoted NC-M) was vacuum dried, and annealed again in Ar (1000 °C/1 h, heating rate 5 °C min−1).2.3 Material characterizations
Powder X-ray diffraction (XRD) was recorded on a Rigaku SmartLab instrument operating at 45 kV and 150 mA, at a wavelength of 1.54 Å. ICDD cards used for powder XRD assignment: MgO (00-004-0829), CaCO3 (01-075-6049), Ca(OH)2 (00-044-1481), CaO (01-070-5490), SrCO3 (00-052-1526), Sr(OH)2 (00-018-1273), Sr(OH)2·H2O (00-028-1222), and BaCO3 (01-074-2663). Rietveld fitting of different phases showed sufficiently low fitting figures-of-merit (wR < 10, GOF ∼ 1). High-resolution scanning electron microscope was done on a Zeiss-ultra+ at 4 kV and in-lens detector, on the NC-M samples prior to the final annealing (samples after the final annealing showed identical morphologies). Energy dispersive spectroscopy (EDS) was measured with a Quantax spectrometer (Bruker) at 7 kV. High-resolution transmission electron microscopy (HRTEM) was performed on FEI Talos 200C, at an acceleration voltage of 200 kV. N2 adsorption–desorption isotherms were measured on a Micromeritics 3Flex instrument at 77 K, using vacuum-dried samples. The isotherms were analyzed using the two-parameter Brunauer–Emmett–Teller (BET) model for specific surface area (SSA, at P/P0 values of 0.01–0.15) and by non-local density functional theory (NLDFT) isotherm fitting for pore size distribution (using the adsorption branch of the isotherm). Raman spectroscopy was performed on a Horiba LabRam HR Evolution Raman microscope using 10× lens, 532 nm laser excitation wavelength, and 1800 grating. First-order Raman spectra were fitted iteratively with four Lorentzian components. X-ray photoelectron spectroscopy (XPS) was collected on a PHI VersaProbe III scanning microprobe supplied from Physical Instruments at UHV ∼10−10 Torr, step size 0.05 eV. Peaks were calibrated using the C 1s position (284.5 eV), and deconvluted in CasaXPS.2.4 Electrochemical measurements
The oxygen reduction reaction voltammograms were recorded on a BioLogic VSP bipotentiostat, combined with a Pine rotating electrode setup. Carbon powder inks were prepared by sonicating 1 mg of carbon, 300 μL of deionized water, 180 μL ethanol and 20 μL of Nafion 5 wt% dispersion (Alfa Aesar). 10 μL of the ink were dropcast onto a rotating ring-disk electrode (RRDE; glassy carbon disc ϕ = 5.61 mm, Pt ring, loading 81 μg cm−2), and dried at 50 °C. Experiments were conducted in 0.1 M KOH at 25.0 °C, saturated by O2 (for ORR measurements) or N2 (for baseline measurements) by bubbling gas for 30 minutes, then kept under a gas blanket. Currents in N2-purged solutions were subtracted from those in the O2-purged solutions, to account for capacitive currents. Graphite and saturated calomel (SCE) were used as counter and reference electrodes, respectively. Potentials were applied using an automatic 85% iR correction. Reported potentials were converted to RHE by adding 0.242 V and 0.0592 V for every pH unit, a total of 1.011 V. Before measurement, the electrode was wetted by 20 cycles between 0.1 V and −0.7 V vs. SCE at 100 mV s−1. The number of electrons transferred per O2 molecule (n) was calculated by the Koutecký–Levich method from linear sweep voltammograms performed on a rotating disk at rotation speeds of 200–2400 rpm, as described elsewhere.22 The yield of H2O2 (%) was calculated by eqn (1), where iring is the ring current, and idisc is the disc current. The collection efficiency was determined experimentally to be N = 0.35, using 4 mM of the Ru(III)/Ru(II) hexamine couple in N2-purged 0.1 M KCl. | (1) |
3. Results and discussion
3.1 MX@NC composites: template formation
The Group 2 nitrilotriacetates are crystalline powders, as determined by XRD (Fig. S1, ESI†) and electron microscopy (Fig. S2, ESI†). Their single crystal X-ray diffractograms (to be reported separately) show well-defined crystals of metal–organic coordination polymers, sharing a common M(NTA)3(H2O)x composition: MgNH(CH2COO)3(H2O)3, CaNH(CH2COO)3(H2O)2, SrNH(CH2COO)3(H2O)1.5, and BaNH(CH2COO)3.Thermal treatment of the four MOCPs in argon atmosphere (750 °C/1 h, heat rate 10 °C min−1) converted them into black powders. While MgX@NC and BaX@NC are light and fluffy, SrX@NC is somewhat denser, and CaX@NC is a dense and hard powder. The crystalline phases in each composite were identified by XRD (Fig. 2) and quantified by Rietveld analysis.38,39 The smallest (Mg2+) and largest (Ba2+) cations yielded only a single phase of crystalline nanoparticles (MgO and BaCO3) during the thermal treatment. In contrast, Ca2+ and Sr2+ produced a mixture of inorganic phases: CaX@NC contains CaO, Ca(OH)2 and CaCO3 at roughly 20–30–50% proportions, and SrX@NC contains Sr(OH)2 and SrCO3 (two similar phases of each) at a 50–50% ratio. Qualitatively, the oxide–hydroxide–carbonate sequence of binary phases (from MgO to BaCO3) can be explained by Pearson's hard–soft acid–base theory. The least polarizable, Lewis-acidic Mg2+ cations (r = 86 pm) form the most stable interactions with similarly hard base O2− anions, while large and polarizable Ba2+ cations (r = 149 pm) are most stable with similarly soft base CO32− anions.
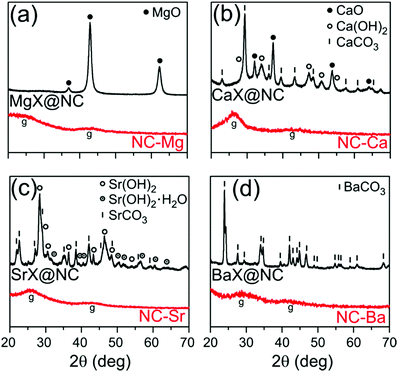 | ||
| Fig. 2 Powder XRD of the inorganic/carbon composites following pyrolysis (MX@NC, top black traces) and the final carbons following washing (NC-M, bottom red traces). | ||
To explain the phase composition along the oxide–hydroxide–carbonate sequence, we consider the possible inorganic reactions during pyrolysis (eqn (2)–(5)). At the pyrolysis temperature of 750 °C, the oxides are expected to be more stable than the hydroxides, and less stable than the carbonates. However, the composition is unlikely to be under thermodynamic control. First, the reducing, carbon-rich matrix may shift the equilibria towards hydroxides and carbonates. Second, atom diffusion is slow: only two of the phases are liquid at this temperature (Ca(OH)2 mp 580 °C, Sr(OH)2 mp 375 °C), while all others are solids far from their melting points (ranging 1340–2570 °C). This will slow down diffusion in these materials, making dynamic equilibration of the MO ⇌ M(OH)2 ⇌ MCO3 mixtures unlikely after only one hour at the pyrolysis temperature. Finally, the presence of Ca(OH)2 and Sr(OH)2 may also result from rapid re-hydration of the oxides,40,41 at any time during or after pyrolysis. Such hydroxide phases are often extended (rather than particulate), possibly leading to loss of pore-templating abilities. Overall, precise tuning of the pyrolysis temperatures and times could prove a highly efficient method for tweaking the composition of the templating phases.
| Ca(OH)2 ⇌ CaO + H2O Tdecomp = 520–580 °C40 | (2) |
| CaCO3 ⇌ CaO + CO2 Tdecomp = 750–800 °C42 | (3) |
| Sr(OH)2 ⇌ SrO + H2O Tdecomp = 600–700 °C41 | (4) |
| SrCO3 ⇌ SrO + CO2 Tdecomp = 900–1000 °C43 | (5) |
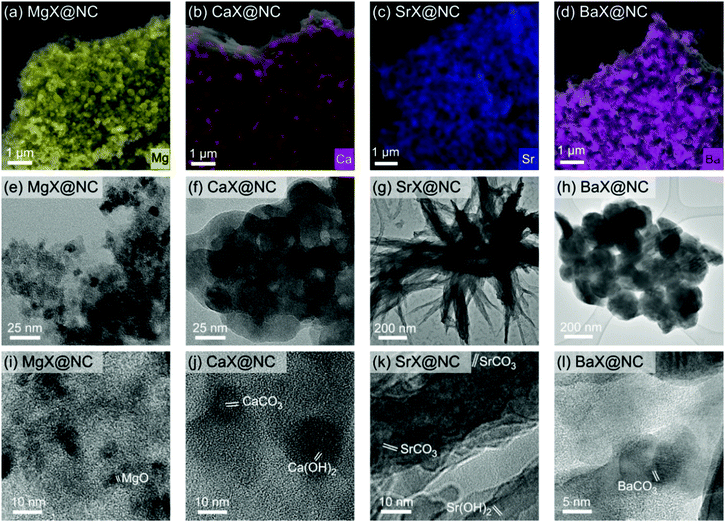
The sizes, shapes, and agglomeration of the inorganic particles was studied by HRSEM with elemental mapping by EDS (Fig. 3a–d) and by HRTEM at two magnifications (Fig. 3e–l and Fig. S3, ESI†). The MgO particles in MgX@NC (Fig. 3e and i) are identified by their crystal spacings in corroboration of the XRD data. The MgO particles are the smallest: 6 ± 1 nm diameter, close to the 9 ± 1 nm obtained from XRD broadening (Table 1). The match between their dimensions and the size of the coherently scattering crystallites suggests they have very few defects. The MgO nanoparticles are well-dispersed through the material (EDS in Fig. 3a), and agglomerates are small and disordered.
| Metal ion | Inorganic phase | Phase fractiona (%) | Crystallite size (XRD)b [nm] | Particle sizec (TEM/SEM) [nm] |
|---|---|---|---|---|
| a Obtained by Rietveld analysis of the XRD. b Determined by Scherrer analysis of the XRD broadening, average between several peaks. This analysis could not be performed for the Sr2+-based phases. c Obtained by image analysis of many particles in the HRSEM or HRTEM images. Aggl. denotes sizes of agglomerates. | ||||
| Mg2+ | MgO | 100 | 9 ± 1 | 6 ± 1. Aggl. 10–100 s |
| Ca2+ | CaO | 21 | 15 ± 2 | Aggl. 100 s |
| Ca(OH)2 | 31 | 8 ± 1 | ||
| CaCO3 | 48 | 14 ± 3 | ||
| Sr2+ | Sr(OH)2 | 55 | — | 100 s |
| SrCO3 | 45 | — | ||
| Ba2+ | BaCO3 | 100 | 26 ± 4 | 30 ± 10. Aggl. 200 ± 30 |
Well-dispersed particles are also found at the other extreme of the alkaline-earth series, in the case of BaCO3@NC (Fig. 3d). The spherical nanoparticles have diameters of 30 ± 10 nm (HRTEM), similarly to the size of coherently scattering domains (26 ± 4 nm), suggesting low defect density. In contrast to the small and disordered agglomerates of MgO, the primary BaCO3 nanoparticles aggregate into highly uniform, well-packed, spherical agglomerates, diameter = 200 ± 30 nm (Fig. 3h and l). The known tendency of BaCO3 to agglomerate,44 will therefore govern their pore-templating activity.
In CaX@NC, the Ca-based particles are larger (10–100 s of nm, Fig. 3b, f, j and Fig. S3c, d, ESI†), yet shapes and precise dimensions of individual particles are hard to determine. XRD broadening reveals that the coherently scattering domains are much smaller, on average (8–15 nm for the three phases), indicating multiple defects and/or significant agglomeration. Similarly, the SrCO3 phase in SrX@NC is extended, adopting the acicular (elongated and branched) crystal habit, typical for the strontianite SrCO3 mineral.45 Branches are 50–90 nm thick and 300–700 nm long (Fig. 3c, g, k and Fig. S4, ESI†). Individual SrCO3 and Sr(OH)2 particles are hard to discern, but are identified by their crystal plane spacings (Fig. 3k and Fig. S3f, ESI†). This suggests that Ca-based and Sr-based particles are all agglomerated, yet well-dispersed throughout the material (Fig. 3b and c).
Overall, the homologous series of alkaline-earth MOCPs yields various carbon-embedded inorganic phases, ranging in size, shape, crystallinity, and degree of agglomeration. These are expected to template a broad variety of pore size distributions.
3.2 NC-M carbons: self-templating of porosity
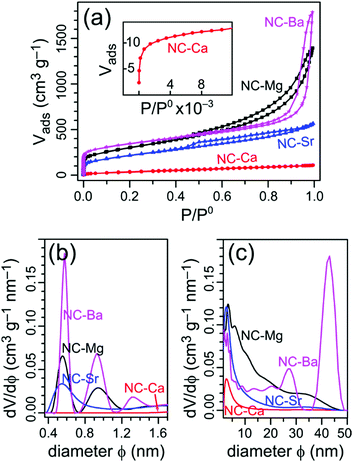
To understand the evolution of hierarchical porosity in this series of self-templated materials, we examine both the quantitative (N2-sorption derived) and qualitative (electron microscopy-derived) pore size distributions. Adsorption-desorption isotherms of N2 at 77 K were collected for all four NC-M carbons (Fig. 4a), and used to calculate the specific surface areas (SSAs) by the BET model (Table 2). The pore size distributions were calculated using NLDFT model for both the micropore and mesopore ranges (Fig. 4b and c).| Carbon | SSA [m2 g−1] | V total [cm3 g−1] | V micropore [cm3 g−1] | V meso+macro [cm3 g−1] |
|---|---|---|---|---|
| a Determined by N2 adsorption at 77 K, fitted by BET model. b Volume of N2 adsorbed at P/P0 = 0.99. c V total − Vmicropore. | ||||
| NC-Mg | 1040 | 2.2 | 0.43 | 1.73 |
| NC-Ca | 140 | 0.17 | 0.04 | 0.13 |
| NC-Sr | 740 | 0.87 | 0.30 | 0.57 |
| NC-Ba | 1220 | 2.8 | 0.50 | 2.30 |
The simplest morphology is found in NC-Ca, featuring a type I isotherm, typical for strictly microporous materials.46 Indeed, the pore size distribution reveals no significant mesoporosity, especially in comparison with the other carbons. Thus, no self-templating occurred in NC-Ca, despite the presence of Ca-based inorganic phases in the material. Micropores in the bulk carbon, typically formed homogeneously throughout the volume of pyrolyzed polymers, are inaccessible; rather, only the surface micropores of NC-Ca are accessible to N2.
Crystallites of CaNTA, the carbon precursor, are tabular and smooth, ranging tens of micrometers in size (Fig. 5a and Fig. S2b, S6b, ESI†). The shapes and dimensions of the macroscopic crystals are retained during the thermal treatment, as the organic ligand is carbonized and the Ca-based inorganic phases are formed (Fig. 5b). The resulting CaX@NC composite is quite dense at all magnifications (Fig. 5b–d), with a few 0.5–2 μm holes dispersed on the surface.
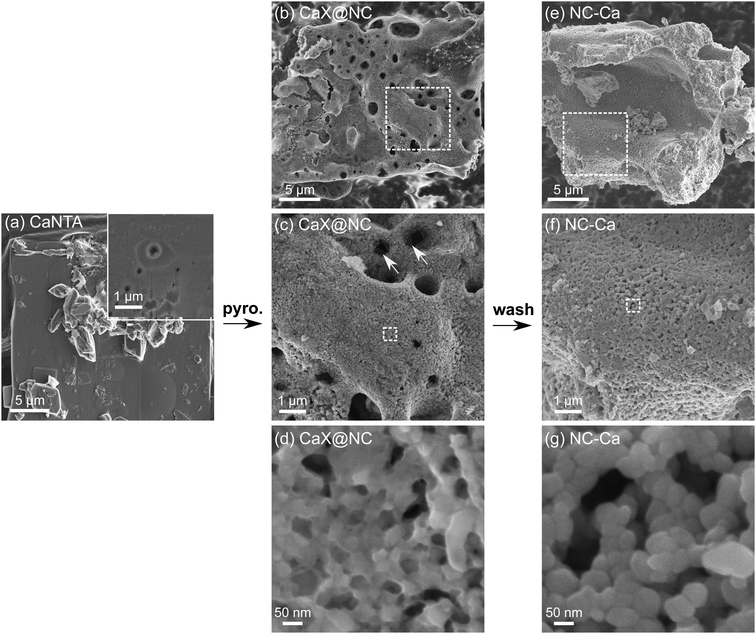 | ||
| Fig. 5 Scanning electron micrographs. (a) CaNTA crystals. (b–d) Composites of Ca-based inorganic phases and N-doped carbon (CaX@NC), as obtained after pyrolysis. (e–g) Final N-doped carbon (NC-Ca), following washing by HCl. Arrows in (c) point to translucent films covering the carbon (see also Fig. S5, ESI†). Additional representative micrographs in Fig. S6–S8 (ESI†). | ||
After washing the material in acid, the NC-Ca particles retain the original macroscopic dimensions of the CaNTA crystals (Fig. 5e), but are composed of a dense array of carbon nanoparticles (40–60 nm, Fig. 5f and g). All Ca-based inorganic phases were completely removed by the acid wash (Fig. 2b, bottom trace), including translucent films covering pore edges (Fig. 5d and Fig. S5 (ESI†), vs.Fig. 5g). However, the carbon matrix is nearly as dense as before the wash, with only a minor contribution of new porosity in the 50–200 nm range (Fig. 5f, g and Fig. S9, ESI†). These pores match in size the Ca-based agglomerates observed in Fig. 3b, f, suggesting that the meagre mesoporosity found in NC-Ca is self-templated.
Efficient self-templating by Ca salts strongly depends on the pyrolysis conditions (affecting carbonate decomposition) and on the linker. Sevilla and Fuertes were the first to show that different calcium salts (alginate vs. citrate) can self-template strikingly different carbons, with pore volumes ranging from 0.5 to 2.6 mL g−1.20 In these carbons, a distinct population of mesopores corresponded in diameter to the size of primary CaO nanoparticles (∼10 nm), indicating a low degree of agglomeration. Moreover, their CaX@C composites contained no CaCO3, indicating its complete decomposition (eqn (3)), and leading to maximum in situ activation by the released CO2(g). The ligand in the precursor determines the composition of the carbon surrounding the inorganic phases during pyrolysis. This, in turn, controls the equilibrium of inorganic phases and the carbon, and also directs them to either stay endo-templated or be expelled from the matrix (leaving behind an array of carbon nano-spheres, like in NC-Ca). Overall, the microporosity observed in NC-Ca in Fig. 4 is only available at the surface, stressing the importance of ligand choice in the self-templating strategy.
The next carbon examined, NC-Sr, shows N2 sorption isotherms of the H4 type (Fig. 4a): mostly microporous with a small hysteresis loop, suggesting a tiny fraction of larger pores. Indeed, the pore size distribution (Fig. 4c) trails into the small mesopore range (up to ∼15 nm). Many more micropores are accessible to N2 in NC-Sr than in NC-Ca, as seen in the 7-fold increase in Vmicropore and 5-fold increase in specific surface areas (Table 2). This may suggest that either (1) the surface texture of the carbon matrix is radically different between the two samples, or (2) the texture is similar, but more of it is exposed in NC-Sr. Since the carbons are derived from the same ligand, the first hypothesis is unlikely; see below for experimental support for this point. Higher surface exposure, however, is possible – but it must arise from added macro-, rather than meso-pores, since the latter are still few in NC-Sr (Fig. 4c).
To test this hypothesis, we first examine the SrNTA crystals: platy, smooth, and around ten microns across (Fig. 6a). Their similarity to CaNTA continues with pyrolysis, as the SrX@NC composite is also made of large, dense particles, disrupted by rare micrometer-sized holes (Fig. 6b–d). However, the acid wash changes the texture dramatically, making it highly open and tortuous on the micrometer scale (Fig. 6e and f). This boost in macroporosity can indeed expose many of the micropores in the material, corroborating the porosimetry data. Interestingly, the surface texture remains dense, and terraced with distinct carbon layers (Fig. 6g). The correlation between macropore-templating and strontianite branches is weak, but may be supported by the only other report of a strontium salt used to template carbon.35 There, elongated features in the ∼100 nm range are observed in the TEM micrographs, possibly due to macropores. Overall, the large Sr-based inorganic particles in NC-Sr template macroporosity more than in NC-Ca, but the extensive nature of the SrCO3 and Sr(OH)2 phases yields large macropores and no mesopores. Thus, they are yet unfit for the self-templating of truly hierarchical porosity that ranges across several orders of magnitude in diameter.
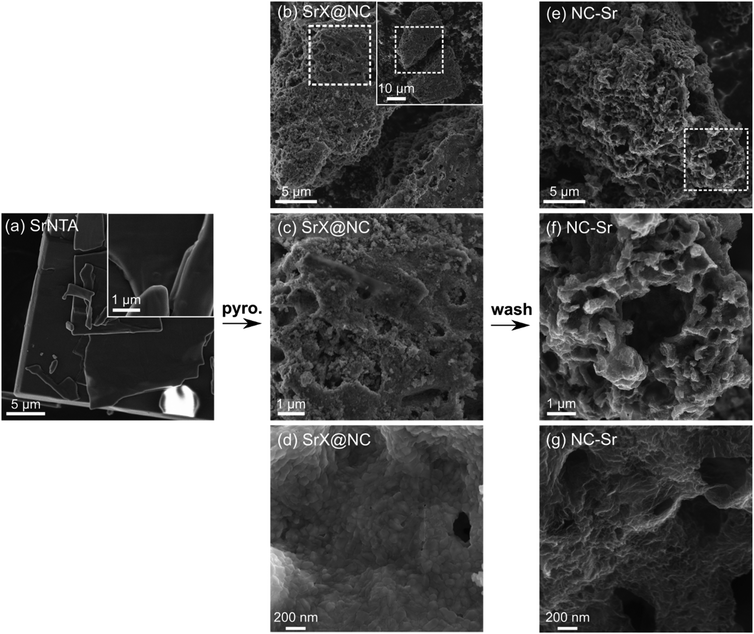 | ||
| Fig. 6 Scanning electron micrographs. (a) SrNTA crystals. (b–d) Composites of Sr-based inorganic phases and N-doped carbon (SrX@NC), as obtained after pyrolysis. Inset in (b) shows a lower magnification of the same particle. (e–g) Final N-doped carbon (NC-Sr), after washing by HCl. Additional representative micrographs in Fig. S6–S8 (ESI†). | ||
Unlike NC-Ca (microporous) and NC-Sr (micro- and macroporous), the next two carbons have fully hierarchical porosities, spanning the micro-, meso- and macropore range. The MgNTA precursor is already different, composed of large aggregates (10 s of micrometers) of prismatic crystallites (∼1 μm long and tens of nanometers wide) (Fig. 7a and Fig. S2a, S6a, ESI†). Upon pyrolysis, these aggregates yield composite MgX@NC, roughly retaining the precursor aggregate dimensions. The particles are cracked and contain many pores in the 10–100 s nm range, typically next to spheres of the same dimensions. The spheres range in size from <10 nm (as observed by TEM, Fig. 3e and i) to large spherical agglomerates spanning from 10 s to 100 s of nm (particle size distribution in Fig. S10, ESI†). The subsequent removal of the spheres by acid washing identifies them as MgO. The small sizes of the MgNTA crystallites are expected to limit the starting size of MgO spheres, thus strongly affecting mesopore templating.
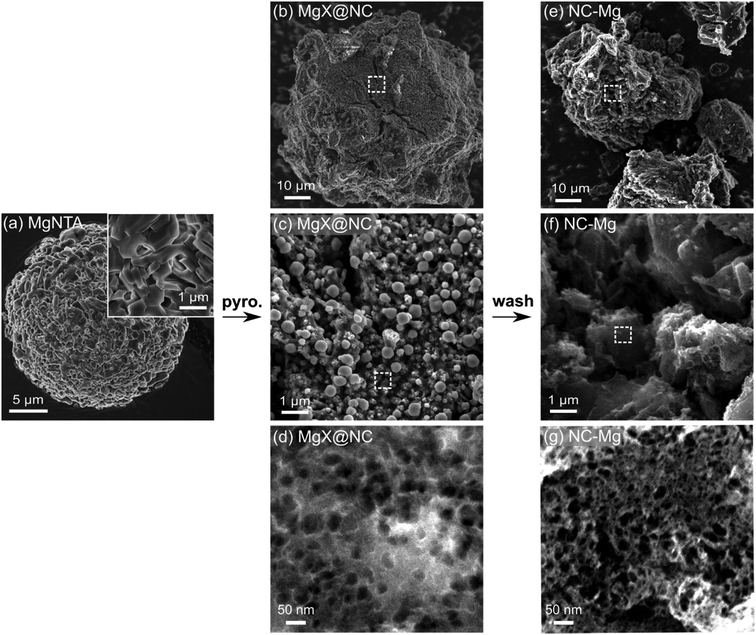 | ||
| Fig. 7 Scanning electron micrographs. (a) MgNTA crystals. (b–d) Composites of Mg-based inorganic phases and N-doped carbon (MgX@NC), as obtained after pyrolysis. (e–g) Final N-doped carbon (NC-Mg), after washing by HCl. Additional representative micrographs in Fig. S6–S8 (ESI†). | ||
The spherical meso- and macro-pores are perfectly retained during the acid wash, with diameters up to 40 nm according to N2 sorption porosimetry (Fig. 4c) and electron microscopy (Fig. 7g). It is likely that the MgO particles form and agglomerate inside the MOCP as it is carbonized; then they are rejected from the carbon matrix, leaving behind a network of meso- and macro-pores. The exsolution, agglomeration, and sphericity of MgO particles all point to a high interfacial energy with the carbon matrix. Indeed, the MgO surface is hydrophilic (contact angle with water of 47°),47 unlike carbon which is hydrophobic. The hierarchical porosity is quantified by N2 physisorption (Fig. 4), with a BET SSA of 1040 m2 g−1 and significant micro- and mesoporosity (0.5–50 nm) – as observed directly by HRSEM (Fig. 7g) and HRTEM (Fig. S9a, ESI†).
Several magnesium salts were reported as precursors in the self-templating design of carbons, since the seminal work of Morishita, Inagaki et al. in 2006.18,48,49 The size, crystallinity and degree of agglomeration of MgO nanoparticles, forming during pyrolysis of magnesium salts, depends on the organic ligand, and lead to pore templating.18,31,32,48–50 However, the effect of crystallite size in the metal–organic precursor has not been reported previously, and the exsolution of MgO templates was never directly observed. Overall, magnesium-based self-templating is excellent for hierarchical porosity, since the MgO spheres span a broad distribution of sizes, and easily leave behind a stable network of pores.
Similarly to MgNTA, the BaNTA MOCP yields a carbon with fully hierarchical porosity. The pathway, however, is quite different. The original BaNTA crystals are tabular and tens of microns large, like those of CaNTA and SrNTA (Fig. 8a and Fig. S2d, ESI†). Unlike them, however, BaNTA crystals are not smooth but rather cracked in a regular pattern (periodicity 200–400 nm, Fig. 8a inset and Fig. S6d, ESI†). After pyrolysis, the large BaX@NC particles are composed of uniformly sized granules (Fig. 8b–d). These granules are ∼200 nm in size (Fig. 3h, Fig. 8c, d, Fig. S7d (ESI†), Table 1), similarly to the frequency of cracks in the BaNTA crystal. This suggests that the cracks in the crystal serve as highly useful ‘cutting lines’, along which the crystallites separate during pyrolysis.
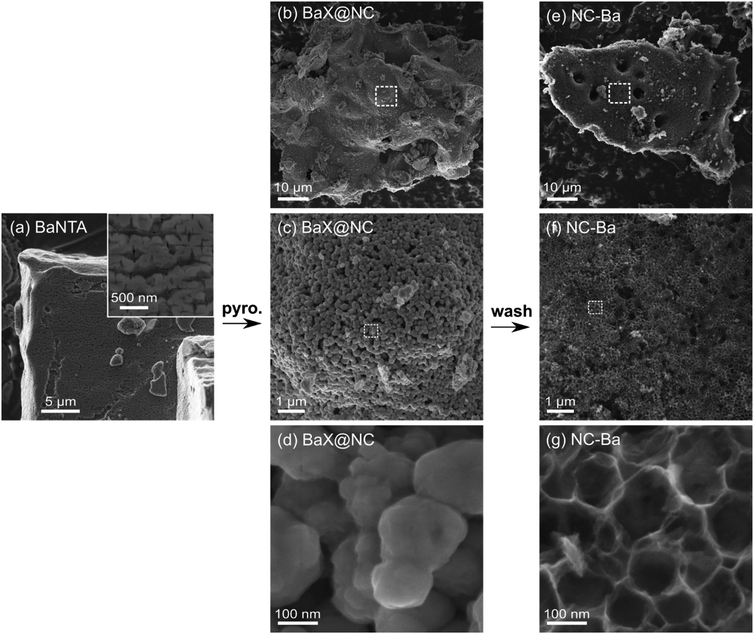 | ||
| Fig. 8 Scanning electron micrographs. (a) BaNTA crystals. (b–d) Composites of Ba-based inorganic phases and N-doped carbon (BaX@NC), as obtained after pyrolysis. (e–g) Final N-doped carbon (NC-Ba), after washing by HCl. Additional representative micrographs in Fig. S6–S8 (ESI†). | ||
After the acid wash, the particle retains its overall shape, yet becomes highly porous, showing a homogeneous array of similarly sized macropores (∼80–150 nm, Fig. 8g and Fig. S8d, S9g, ESI†). The sizes of these pores correspond nicely to the size of granules in BaX@NC; the pores are slightly smaller, probably due to shrinking during pyrolysis. This size correlation suggests that the granules are carbon-encapsulated BaCO3. Their irregular shapes indicate they are polycrystalline agglomerates of primary BaCO3 crystallites. Indeed, Scherrer analysis determines that the size of coherently scattering BaCO3 crystals as 26 ± 4 nm (Table 1), much smaller than granule diameters.
The pore size distribution in NC-Ba, calculated from N2 sorption, reveals a distribution of small mesopores (>2 nm), and two peaks at 25 and 40 nm (Fig. 4c); larger pore diameters cannot be detected by N2 sorption. The 25 nm mesopores perfectly match the size of individual BaCO3 nanoparticles (Table 1), indicating some of them are non-agglomerated. Overall, the particle size distribution of the BaCO3 agglomerates is narrow, similarly to the reported pyrolysis of barium citrate, where it centred on 15 nm.34 This narrow distribution indicates a fine balance between the interface energies at both the BaCO3|BaCO3 and BaCO3|carbon interfaces. Such a balance provides an opportunity for tailoring the self-templating of porosity in this material. This further suggests that BaCO3 particles can be used as excellent external additives for hard templating of large mesopores, beyond the self-templating strategy, the way that MgO additives are used for introducing small mesopores into carbons.51,52
Overall, this homologous series of carbons covers the full range of pore modalities. Starting from a microporous carbon with only surface micropores (NC-Ca), to a cracked macroporous carbon exposing some bulk micropores (NC-Sr), and finally to fully hierarchical micro-meso-macro-porosities in NC-Mg and NC-Ba, differing in mesopore size (∼20–40 nm and ∼80–150 nm, respectively). An interesting control experiment would be a non-templated carbon derived from pure, non-complexing NTA. However, nitrilotriacetic acid is volatile and does not carbonize.
This structural richness is expected to be crucial for electrocatalytic activity, as the optimal balance between void network and carbon network is sought. First, the variance in the exposure of bulk micropores will affect the availability of catalytic sites, as well as the flow rates for the replenishment of reactant (O2) and the removal of products (OH−) and intermediates (HO2−). Second, excessive porosity may lead to undesirably thick catalyst layers, to provide enough catalytic sites within the catalyst volume.
Importantly for the understanding of self-templating mechanisms, we hypothesize that such well-dispersed mesoporosity as in NC-Mg and NC-Ba depends critically on the small size of the crystallites in the MOCP precursors. The sub-micronic dimensions of the MgNTA prismatic crystallites, and of the homogeneous cracks in BaNTA crystals, limit the sizes of inorganic particles as they nucleate during pyrolysis. This opens new avenues in porosity design, suggesting that the fine-tuning of MOCP crystallization conditions can control the self-templating behaviour during pyrolysis.
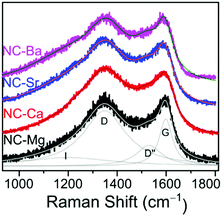
Since the N-doped carbons were all derived from a similar M(NTA)3 precursor composition, we hypothesized earlier that the carbon composition will be constant along the series. To test this hypothesis, we studied the NC-M carbons by Raman spectroscopy (Fig. 9), inductively coupled plasma mass spectroscopy (ICP-MS), XPS (Fig. 10), and HRTEM (Fig. S9, ESI†). The deconvoluted Raman spectrum for NC-Mg, shows both high frequency E2g in-plane stretching of sp2 carbons, typical to graphitic regions (G), and lower frequency A1g vibrations, activated near carbon defects (D).53 Other peaks (D′′, I) were also fitted according to accepted assignments.36,53 The intensity ratio between the D and G bands (ID/IG) expresses the degree of graphitization of the carbon, which, in turn, correlates to its conductivity. While this correlation is imperfect – especially in N-doped carbons where dopants introduced defects – it remains the method of choice in the powder carbon literature,53 since contact measurements (e.g. 4-point-probe) mostly assess inter-, rather than intra-particle conductivity. The Raman spectra of all four NC-M carbons are indeed very similar, and the ID/IG ratios are within a narrow range (1.13–1.29, Fig. 9 and Fig. S11, ESI†). In the context of electrocatalysis, the similar graphitization suggests that the carbons will have similar electronic conductivity.
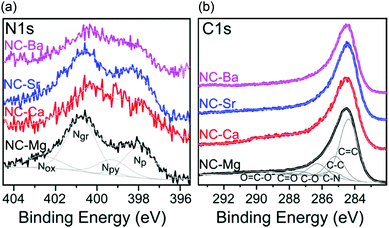 | ||
| Fig. 10 High resolution XPS spectra of the NC-M carbons in the (a) N 1s, and (b) C 1s regions. Intensities matched, by <30%. Deconvolution envelopes displayed in grey. | ||
Transmission electron micrographs of NC-M carbons show similar graphitic regions, ∼3–10 layer thick (Fig. S9, ESI†). For NC-Mg and NC-Ba, these graphitic layers form shells around the inorganic particles. Such mild graphitization catalysis has been reported for MgO,54,55 but this is the first report of a Ba-based inorganic phase that can catalyse mild graphitization during pyrolysis. Mild graphitization is important for avoiding the uncontrolled growth of carbon nanotubes or large graphite blocks, as many electronic and electrochemical applications seek low dimensional carbon materials.56–58
The NC-M carbons have a high nitrogen content (4.5–7.7 wt%), and very low trace metal content after the acid wash (0.04–0.21 wt%), as determined by ICP-MS (Table 3). The distribution of binding states of surface nitrogen and carbon atoms was further analysed by XPS in the N 1s and C 1s regions (Fig. 10). Several nitrogen types contribute to the N 1s spectrum, deconvoluted into pyridinic (Np), pyrrolic/pyrimidonic (Npy), graphitic (Ng), and oxidized (Nox) nitrogens.59 Their relative proportions vary between the four carbons, but the fraction of pyridinic nitrogen, an important contributor to ORR activity,60 is overall quite constant (1.1–1.7 wt%,) and sufficient for effective ORR electrocatalysis.1,2,61–63
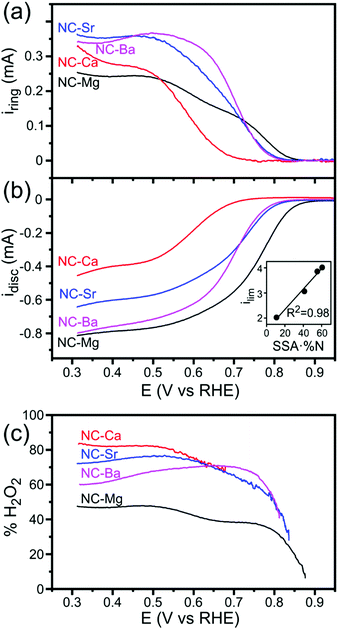
The similarities in carbon composition along the series, in contrast to the far-swinging differences in porosity, suggest that the ORR activity of these catalysts will depend chiefly on their microstructure. To investigate this dependence, we studied the activity of NC-M carbons towards the ORR, using a rotating ring-disc electrode in an O2(g)-saturated 0.1 M KOH electrolyte. All carbons demonstrated cathodic currents on the disc under mass-transport controlled conditions (1600 rpm, Fig. 11b), yet differed in their H2O2 yields (measured on the ring, Ering = 1.3 V vs. RHE, Fig. 11a and c). The half-wave potentials and limiting current densities testify to good ORR performance, and are sufficient for studying how morphology affects ORR activity and selectivity. NC-Mg was the most active electrocatalyst of the four. It showed the earliest onset for ORR, 0.93 V vs. RHE (defined as 1% of the limiting current at 0.35 V, after correction for capacitive currents), the highest limiting current density (4.1 mA cm−2 at 0.31 V), and the lowest rates of peroxide formation. NC-Ca performed worst, with the most negative onset (0.75 V), lowest limiting current density (2.3 mA cm−2 at 0.31 V) and most peroxide formed. NC-Sr activity was intermediate between the two, and NC-Ba is almost as active as NC-Mg in limiting current at potential 0.4 V, but more negative onset potential (0.83 V) and higher rates of peroxide formation. Koutecký–Levich analysis of the four materials under mass-transfer-controlled conditions (E = 0.7 V vs. RHE) shows that NC-Mg and NC-Ba have similar electron transfer numbers (3.85 and 4.15, both near 4 with some experimental errors, Table S1 and Fig. S13, ESI†). The values on NC-Sr and NC-Ca are lower (3.56 and 2.78), in line with their higher peroxide yields.
In N-doped carbons, the nitrogen dopants typically contribute most of the ORR activity, well ahead of the catalytic activity of carbon defect sites.60,64 Thus, the ORR current densities catalyzed by the carbons depend on the number of exposed nitrogens. To estimate this value, we can multiply the surface N content by the BET SSA. The number of exposed N atoms, although a rough estimate, is in perfect linear correlation with the ORR activity, as measured by the limiting current density at E = −0.6 V vs. RHE and rotation rate 1600 rpm (Fig. 11, inset). This correlation is weaker when ORR activity is compared solely to SSA or to N content (Fig. S12, ESI†). This indicates that the N atoms are indeed responsible for ORR activity; that they are highly similar across the series; and that the chief parameter at play is the degree of N-site exposure. This further stresses the importance of the pore structure in determining activity. Even the different onset potentials for ORR (ranging in 150 mV between NC-Mg and NC-Ca), often signifying inherently different catalysis mechanisms, could be explained by flow-enhancing porosity (see below).
Alkaline ORR on N-doped carbons begins with a 2e− electro-reduction yielding a peroxide intermediate (eqn (6)). The peroxide can either (1) escape, (2) be reduced further by another 2e− (eqn (7)), or (3) be disproportionated (eqn (8)). Interestingly, the carbons’ microstructure has a striking effect on the ORR selectivity (2e−vs. 4e−), as gauged by their different peroxide yields. On each of the NC-M carbons, the disc and ring reactions start at the same onset potential, suggesting they begin producing the HO2− intermediate simultaneously with O2 reduction (Fig. 11b). However, peroxide yields on NC-Mg are lower throughout the potential range, and especially at low current densities (potential range from −0.85 to −0.6 V vs. RHE, Fig. 11c). On the other carbons, the peroxide yields rise fast and reach higher plateaus.
| O2 + 2e− + H2O ⇌ HO2− + OH− | (6) |
| HO2− + 2e− + H2O ⇌ 3OH− | (7) |
| HO2− → 1/2O2 + OH− | (8) |
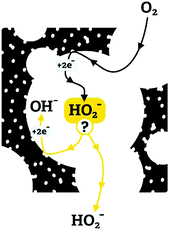
We propose that the differences in ORR selectivity stem from a competition between the kinetics and mass transfer of peroxide intermediates in the mesopores (as described schematically in Fig. 12). First, O2 diffuses into the carbon, and is reduced to HO2− by a 2e− process. The fate of the peroxide intermediate depends on its confinement: if it is in a large pore or near the particle surface, it will diffuse away, to be detected on the ring electrode. But if it is trapped within a smaller pore, it can be reduced by two more electrons (yielding an overall 4e− reduction), and/or be disproportionated. If the 2e− reduction (eqn (6)) and disproportionation (eqn (8)) occur repeatedly, the apparent number of electrons in the overall reduction will asymptotically approach 4e−. Similar confinement effects were invoked to explain why the apparent 4e−/2e− selectivity in ORR rises with the thickness of the catalytic layer.65 Thicker layers may confine the peroxide intermediate in the inter-particle space, allowing it to complete its reactions.
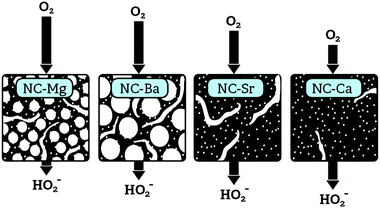
The pore-confinement mechanism can explain how morphology governs ORR activity across the series (Fig. 13). In strictly microporous NC-Ca, where bulk porosity is inaccessible, the ORR occurs on the outer surface of catalytic particles. This leads to low ORR currents on the disc, and to high yield of the peroxide ion on the ring – since the peroxide is not confined to internal pores and escapes after a mere 2e− reduction. On NC-Sr, higher disc currents and an earlier onset correspond to the addition of macroporosity, which exposes many more micropores. However, there is still no confinement effect, and many peroxide intermediates can diffuse away. The highest ORR currents are observed on NC-Ba and NC-Mg, since their hierarchical macro-/meso-/microporosity allows the fastest mass transport of O2 into the pores even at high current densities. However, mesopore diameters in NC-Mg are smaller than in NC-Ba (∼20–40 nm vs. ∼80–150 nm, respectively). The smaller mesopores of NC-Mg confine the HO2− intermediates, leading to apparent 4e− reduction, be it by the (2e− + 2e−) or the (2e− + disproportionation) mechanism. In NC-Ba, in contrast, the mesopore diameters are 3–5 times larger than in NC-Mg, leading to easier escape of the peroxide intermediate. Diffusion of the final product, OH(aq)−, is less dependent of pore structure, as it is highly abundant in the electrolyte. Overall, the rate of diffusion of O2 into the pores, enabled by the hierarchical porosity, leads to high current densities on the disc. Simultaneously, the apparent 4e−/2e− selectivity ratio depends on the pore confinement of peroxide intermediates (as described schematically in Fig. 12). Such confinement effects on ORR selectivity were previously considered to explain why a mesoporous g-C3N4/carbon composite is more selective towards 4e− reduction than a macroporous one.66 Recently, confinement in carbon pores was shown to direct the selectivity of CO2 reduction, with an optimal pore size of 27 nm.67 Even though mass transport of CO2 and its reduction products are different than those in the ORR, this value is close to the ∼20–40 nm pore diameters in best-performing NC-Mg.
4. Conclusions
We have studied the self-templating synthesis of porous N-doped carbon materials starting from the nitrilotriacetates of four abundant Group 2 metal ions. By following them from the crystalline precursor M-NTA, through the inorganic/carbon composite MX@NC, and to the ultimate carbon NC-M, we could identify the unique role of the metal in creating the carbon morphology. Across the series, a variety of carbon-embedded inorganic particles spontaneously formed during pyrolysis, ranging from oxides (MgO, CaO) for the harder cations, to carbonate (SrCO3, BaCO3) for the softer cations, with hydroxide intermediates or re-hydration products. The inorganic particles varied greatly in size, crystallinity, shape, and degree of agglomeration. Clear links were established between the particle dimensions and spatial arrangement, and the pore structures of the ultimate carbon. The Ca-based precursor yielded a microporous carbon with barely any meso- or macroporosity, and thus low availability of catalytic sites and small ORR current densities. The Sr-based carbon was cracked and macroporous, improving the influx of O2 but not yet attaining fully hierarchical porosity. Mg- and Ba-based carbons showed fully hierarchical micro-/meso-/macroporosity, with their mid-size mesopores varying in diameter by a factor of 3–5. This difference leads to variations in the ORR selectivity towards the 2e− or the (apparent) 4e− pathway, probably due to pore-confinement of the peroxide intermediate in the smaller mesopores of NC-Mg, leading to higher electron transfer numbers.Overall, a thorough description of the self-templating process sets an excellent starting point for further development of self-templated carbons, the use of Group 2 inorganic particles as hard templates, and the study of structure–activity correlations in this important class of electrocatalysts.
Conflicts of interest
There are no conflict of interest to declare.Acknowledgements
We thank the Nancy and Stephen Grand Technion Energy Program and the Russell Berrie Nanotechnology Institute (Technion) for partial funding. E. M. F. thanks the Daniel and the Gutwirth Foundations for graduate research fellowships. T. Y. B. thanks the Irwin and Joan Jacobs Foundation for a graduate research fellowship. We thank Mr Imanuel Peer (Technion) for help in initial stages of the project, Dr Kamira Weinfeld-Cohen (Technion) for XPS experiments, Dr Maria Koifman (Technion) for analysis of XRD data, Dr Naama Koifman (Technion) for help with HRSEM experiments, and Mrs Efrat (Eshkat) Bronshtein for the graphical design of schemes.References
- N. Daems, X. Sheng, I. F. J. Vankelecom and P. P. Pescarmona, J. Mater. Chem. A, 2014, 2, 4085–4110 RSC.
- T. Asefa, Acc. Chem. Res., 2016, 49, 1873–1883 CrossRef CAS PubMed.
- Y. Song, T. Liu, F. Qian, C. Zhu, B. Yao, E. Duoss, C. Spadaccini, M. Worsley and Y. Li, J. Colloid Interface Sci., 2018, 509, 529–545 CrossRef CAS PubMed.
- W. Yang, X. Li, Y. Li, R. Zhu and H. Pang, Adv. Mater., 2019, 31, 1804740 Search PubMed.
- L. Yang, J. Shui, L. Du, Y. Shao, J. Liu, L. Dai and Z. Hu, Adv. Mater., 2019, 31, 1804799 CrossRef PubMed.
- K. Artyushkova, C. Walker, W. Patterson and P. Atanassov, Electrocatalysis, 2014, 5, 241–247 CrossRef CAS.
- H. Chen, T. Ran, Y. Gan, J. Zhou, Y. Zhang, L. Zhang, D. Zhang and L. Jiang, Nat. Mater., 2018, 17, 935–942 CrossRef CAS PubMed.
- A. B. Fuertes and M. Sevilla, ACS Appl. Mater. Interfaces, 2015, 7, 4344–4353 CrossRef CAS PubMed.
- W. He, C. Jiang, J. Wang and L. Lu, Angew. Chem. Int. Ed., 2014, 53, 9503–9507 CrossRef CAS PubMed.
- A. A. Zakhidov, R. H. Baughman, Z. Iqbal, C. Cui, I. Khayrullin, S. O. Dantas, J. Marti and V. G. Ralchenko, Science, 1998, 282, 897–901 CrossRef CAS PubMed.
- C. Liang, K. Hong, G. A. Guiochon, J. W. Mays and S. Dai, Angew. Chem. Int. Ed., 2004, 43, 5785–5789 CrossRef CAS PubMed.
- D.-Y. Kang and J. H. Moon, Sci. Rep., 2015, 4, 5392 CrossRef PubMed.
- W. Wei, H. Liang, K. Parvez, X. Zhuang, X. Feng and K. Müllen, Angew. Chem., Int. Ed., 2014, 53, 1570–1574 CrossRef CAS PubMed.
- J. M. Serrano, T. Liu, A. U. Khan, B. Botset, B. J. Stovall, Z. Xu, D. Guo, K. Cao, X. Hao, S. Cheng and G. Liu, Chem. Mater., 2019, 31, 8898–8907 CrossRef CAS.
- X. Zhao, P. Pachfule, S. Li, T. Langenhahn, M. Ye, G. Tian, J. Schmidt and A. Thomas, Chem. Mater., 2019, 31, 3274–3280 CrossRef CAS.
- J. Deng, M. Li and Y. Wang, Green Chem., 2016, 18, 4824–4854 RSC.
- P. Kaur, G. Verma and S. S. Sekhon, Prog. Mater. Sci., 2019, 102, 1–71 CrossRef CAS.
- T. Morishita, Y. Soneda, T. Tsumura and M. Inagaki, Carbon, 2006, 44, 2360–2367 CrossRef CAS.
- M. Inagaki, H. Orikasa and T. Morishita, RSC Adv., 2011, 1, 1620–1640 RSC.
- M. Sevilla and A. B. Fuertes, J. Mater. Chem. A, 2013, 1, 13738–13741 RSC.
- D. Eisenberg, W. Stroek, N. J. Geels, C. S. Sandu, A. Heller, N. Yan and G. Rothenberg, Chem. – Eur. J., 2016, 22, 501–505 CrossRef CAS PubMed.
- D. Eisenberg, W. Stroek, N. J. Geels, S. Tanase, M. Ferbinteanu, S. J. Teat, P. Mettraux, N. Yan and G. Rothenberg, Phys. Chem. Chem. Phys., 2016, 18, 20778–20783 RSC.
- G. A. Ferrero, N. Diez, M. Sevilla and A. B. Fuertes, Microporous Mesoporous Mater., 2019, 278, 280–288 CrossRef CAS.
- V. Di Noto and E. Negro, Electrochimica Acta, 2010, 55, 7564–7574 CrossRef CAS.
- G. Wu, K. L. More, C. M. Johnston and P. Zelenay, Science, 2011, 332, 443–447 CrossRef CAS PubMed.
- N. Daems, J. Wouters, C. Van Goethem, K. Baert, C. Poleunis, A. Delcorte, A. Hubin, I. F. J. Vankelecom and P. P. Pescarmona, Appl. Catal., B, 2018, 226, 509–522 CrossRef CAS.
- K. Ojha, E. M. Farber, T. Y. Burshtein and D. Eisenberg, Angew. Chem., Int. Ed., 2018, 57, 17168–17172 CrossRef CAS PubMed.
- T. Zhang and T. Asefa, Adv. Mater., 2019, 31, 1804394 CrossRef PubMed.
- T. Y. Burshtein, E. M. Farber, K. Ojha and D. Eisenberg, J. Mater. Chem. A, 2019, 7, 23854–23861 RSC.
- D. Darling, Terrestrial Abundance of Elements, http://www.daviddarling.info/encyclopedia/E/elterr.html, accessed January 14, 2019.
- R. Das, P. Pachfule, R. Banerjee and P. Poddar, Nanoscale, 2012, 4, 591–599 RSC.
- Z.-F. Wu, B. Tan, C.-F. Du, M.-L. Feng, Z.-L. Xie and X.-Y. Huang, CrystEngComm, 2015, 17, 4288–4292 RSC.
- X. Y. Chen, C. Chen, Z. J. Zhang, D. H. Xie, X. Deng and J. W. Liu, J. Power Sources, 2013, 230, 50–58 CrossRef CAS.
- J. Zhou, X. Yuan, W. Xing, W. Si and S. Zhuo, Carbon, 2010, 48, 2765–2772 CrossRef CAS.
- Y. Tong, D. Ji, P. Wang, H. Zhou, K. Akhtar, X. Shen, J. Zhang and A. Yuan, RSC Adv., 2017, 7, 25182–25190 RSC.
- D. Eisenberg, P. Prinsen, N. J. Geels, W. Stroek, N. Yan, B. Hua, J.-L. Luo and G. Rothenberg, RSC Adv., 2016, 6, 80398–80407 RSC.
- S. Yuan, L. Feng, K. Wang, J. Pang, M. Bosch, C. Lollar, Y. Sun, J. Qin, X. Yang, P. Zhang, Q. Wang, L. Zou, Y. Zhang, L. Zhang, Y. Fang, J. Li and H.-C. Zhou, Adv. Mater., 2018, 30, 1704303 CrossRef PubMed.
- H. M. Rietveld, J. Appl. Crystallogr., 1969, 2, 65–71 CrossRef CAS.
- C. T. Kniess, J. C. de Lima and P. B. Prates, Sintering – Methods and Products, InTech, 2012, ch. 14 Search PubMed.
- S. Lin, Y. Wang and Y. Suzuki, Energy Fuels, 2009, 23, 2855–2861 CrossRef CAS.
- R. Dinescu and M. Preda, J. Therm. Anal., 1973, 5, 465–473 CrossRef CAS.
- K. S. P. Karunadasa, C. H. Manoratne, H. M. T. G. A. Pitawala and R. M. G. Rajapakse, J. Phys. Chem. Solids, 2019, 134, 21–28 CrossRef CAS.
- I. Arvanitidis, D. Sichen, S. Seetharaman and H. Y. Sohn, Metall. Mater. Trans. B, 1997, 28, 1063–1068 CrossRef.
- F. Salvatori, H. Muhr, E. Plasari and J.-M. Bossoutrot, Powder Technol., 2002, 128, 114–123 CrossRef CAS.
- S. Reddy, D. Rautaray, S. R. Sainkar and M. Sastry, Bull. Mater. Sci., 2003, 26, 283 CrossRef CAS.
- M. Thommes, K. Kaneko, A. V. Neimark, J. P. Olivier, F. Rodriguez-Reinoso, J. Rouquerol and K. S. W. Sing, Pure Appl. Chem., 2015, 87, 1051–1069 CAS.
- T. A. Ho, D. V. Papavassiliou, L. L. Lee and A. Striolo, Proc. Natl. Acad. Sci. U. S. A., 2011, 108, 16170–16175 CrossRef CAS PubMed.
- T. Morishita, K. Ishihara, M. Kato and M. Inagaki, Carbon, 2007, 45, 209–211 CrossRef CAS.
- T. Morishita, T. Tsumura, M. Toyoda, J. Przepiórski, A. W. Morawski, H. Konno and M. Inagaki, Carbon, 2010, 48, 2690–2707 CrossRef CAS.
- W. Jiang, Z. Luo, X. Jia and X. Wu, J. Solid State Electrochem., 2015, 19, 795–803 CrossRef CAS.
- M. Inagaki, S. Kobayashi, F. Kojin, N. Tanaka, T. Morishita and B. Tryba, Carbon, 2004, 42, 3153–3158 CrossRef CAS.
- J. Zhang, L. Jin, J. Cheng and H. Hu, Carbon, 2013, 55, 221–232 CrossRef CAS.
- A. C. Ferrari and J. Robertson, Phys. Rev. B: Condens. Matter Mater. Phys., 2000, 61, 14095–14107 CrossRef CAS.
- M. H. Rümmeli, A. Bachmatiuk, A. Scott, F. Börrnert, J. H. Warner, V. Hoffman, J.-H. Lin, G. Cuniberti and B. Büchner, ACS Nano, 2010, 4, 4206–4210 CrossRef PubMed.
- A. Bachmatiuk, R. G. Mendes, C. Hirsch, C. Jähne, M. R. Lohe, J. Grothe, S. Kaskel, L. Fu, R. Klingeler, J. Eckert, P. Wick and M. H. Rümmeli, ACS Nano, 2013, 7, 10552–10562 CrossRef CAS PubMed.
- A. B. Fuertes, M. Sevilla, T. Valdes-Solis and P. Tartaj, Chem. Mater., 2007, 19, 5418–5423 CrossRef CAS.
- P. Valle-Vigón, M. Sevilla and A. B. Fuertes, Chem. Mater., 2010, 22, 2526–2533 CrossRef.
- J. Sun, F. Dillon, C. Wu, J. Jiang, K. Jurkschat, A. A. Koós, A. Crossley, N. Grobert and M. R. Castell, Carbon, 2016, 99, 591–598 CrossRef CAS.
- J. Biemolt, I. M. Denekamp, T. K. Slot, G. Rothenberg and D. Eisenberg, ChemSusChem, 2017, 10, 4018–4024 CrossRef CAS PubMed.
- D. Guo, R. Shibuya, C. Akiba, S. Saji, T. Kondo and J. Nakamura, Science, 2016, 351, 361–365 CrossRef CAS PubMed.
- Q. Lv, W. Si, J. He, L. Sun, C. Zhang, N. Wang, Z. Yang, X. Li, X. Wang, W. Deng, Y. Long, C. Huang and Y. Li, Nat. Commun., 2018, 9, 3376 CrossRef PubMed.
- J. Quílez-Bermejo, M. Melle-Franco, E. San-Fabián, E. Morallón and D. Cazorla-Amorós, J. Mater. Chem. A, 2019, 7, 24239–24250 RSC.
- H. W. Kim, H. Park, J. S. Roh, J. E. Shin, T. H. Lee, L. Zhang, Y. H. Cho, H. W. Yoon, V. J. Bukas, J. Guo, H. B. Park, T. H. Han and B. D. McCloskey, Chem. Mater., 2019, 31, 3967–3973 CrossRef CAS.
- S. K. Singh, K. Takeyasu and J. Nakamura, Adv. Mater., 2019, 31, 1804297 CrossRef PubMed.
- A. Baricci, A. Bisello, A. Serov, M. Odgaard, P. Atanassov and A. Casalegno, Sustainable Energy Fuels, 2019, 3, 3375–3386 RSC.
- J. Park, Y. Nabae, T. Hayakawa and M. Kakimoto, ACS Catal., 2014, 4, 3749–3754 CrossRef CAS.
- D. Hursán, A. A. Samu, L. Janovák, K. Artyushkova, T. Asset, P. Atanassov and C. Janáky, Joule, 2019, 3, 1719–1733 CrossRef PubMed.
Footnote |
| † Electronic supplementary information (ESI) available. See DOI: 10.1039/d0ma00084a |
| This journal is © The Royal Society of Chemistry 2020 |

