 Open Access Article
Sequential ionic layer adsorption reaction formation of LaVO4–TiO2 nanocomposites for photocatalytic water treatment†
Gylen
Odling
 a,
Reshma
Bhosale
b,
Satischandra
Ogale
b and
Neil
Robertson
 *a
*a
aSchool of Chemistry, David Brewster Road, The King's Buildings, Edinburgh, EH9 3FJ, UK. E-mail: neil.robertson@ed.ac.uk
bDepartment of Physics and Centre for Energy Science, Indian Institute of Science Education and Research, Dr Homi Babha Road, Pune, India
First published on 30th April 2020
Abstract
Lanthanum vanadate (LaVO4) has been successfully deposited as a thin conformal layer onto the surface of P25 TiO2 particles immobilized on the surface of macroscopic glass beads. Using a simple sequential ionic layer adsorption reaction (SILAR) method, the LaVO4 layer is deposited in situ with good control over the loading. Both the prepared composites and individual LaVO4 and TiO2 materials have been thoroughly characterized by X-ray diffraction, electron microscopies, X-ray photoelectron spectroscopy. The coated bead samples have been applied in the photocatalytic degradation of the model organic pollutant 4-chlorophenol, with the optimal LaVO4 loading displaying ∼3× higher degradation of the pollutant than the pristine P25 sample. Using electrochemical and spectroscopic methods, band energies for both materials and the composite have been determined, and a provisional mechanism for degradation proposed upon the basis of this band alignment and upon scavenging experiments.
Introduction
Semiconductor photocatalysis has attracted much attention in recent years as a potential method to address global drinking water demands,1–3 including initial demonstration in rural Indian villages.3 Photogenerated production of reactive holes, electrons and reactive oxygen species has been proven to be an effective strategy to destroy many contaminants commonly present in water sources.4 Thus far, much of the reported work focuses upon titanium dioxide (TiO2).5 Due to its low cost and low toxicity, TiO2 is an almost ideal candidate for photocatalytic purposes. However, efficiencies remain relatively low due to fast recombination of photogenerated charges leading to few surface reactions occurring in most pure TiO2 based systems.6,7 To address this issue, much work has been undertaken to engineer the TiO2 nanostructure in such a way to suppress recombination. Typical methods include fabrication of TiO2 with morphologies giving short paths of photogenerated charges to the surface,8 tuning the ratio of polymorphs9 and control over the exposed crystal facets of TiO2.10 Another method by which recombination may be reduced is the formation of a composite with another photocatalytic material.11 Choice of material for combination with TiO2 is key in the success of applying this strategy, as the band energies must align correctly for charges to separate across the interface efficiently. Many successful composites in this area have a staggered band arrangement, where conduction and valence bands of one material lie slightly above those of the other, known as a type-II junction. Many different oxides and sulfides have been shown to form a type-II junction with TiO2,12,13 and these often demonstrate improvements in a variety of different photocatalytic reactions due to improved charge separation.14–21A potential candidate material for formation of a type-II junction with TiO2 is lanthanum vanadate (LaVO4). Thoroughly explored as a phosphor matrix material,22 it has been somewhat overlooked in the field of photocatalysis. A few examples exist of LaVO4 being combined with TiO2, with some focusing upon the application of the heterojunction in gas phase photocatalytic degradation reactions.23–27 The work of Fang et al.24 and Huang et al.27 have demonstrated that LaVO4 forms with a monoclinic structure on the surface of TiO2, with a relatively narrow band gap of around 2.1 eV, which in both cases proved effective for the gas phase degradation of benzene. Conversely, in this work, a method has been developed by which an amorphous phase of LaVO4 may be formed on TiO2 in a conformal layer arrangement. Using a pre-immobilised TiO2 substrate on glass beads, a sequential ionic layer adsorption reaction (SILAR) method has been applied to deposit a thin layer of LaVO4 aggregates onto the TiO2 surface. To the best of our knowledge, this is the first example of LaVO4 being prepared by SILAR and represents a new easily controllable method by which thin layers of LaVO4 can be prepared for a variety of different applications. We demonstrate that LaVO4 prepared in this manner has a significantly wider band gap of 3.5 eV, but that the conduction and valence band are both arranged in the same staggered type-II arrangement as previous reports. This new composite has been found to be effective for the photocatalytic degradation of 4-chlorophenol in water, and we propose a mechanism for this activity based upon the type-II band arrangement of the two materials.
Results & discussion
Sample preparation
To provide a substrate upon which LaVO4 could be deposited, TiO2 was coated onto soda lime glass beads according to our previously reported method.28 To the TiO2 coated beads, LaVO4 was deposited by a sequential ionic layer adsorption reaction (SILAR) method. Typically used to produce simple binary chalcogenides, this is to the best of our knowledge the first instance of SILAR being used to produce LaVO4. A schematic describing the entire process is given in Fig. 1. In brief, aqueous solutions of LaCl3 and Na3VO4 were sequentially introduced to a column packed with TiO2 coated beads, washing with water between each solution. This process was repeated between 2 and 8 times, to build up varying levels of LaVO4 onto the TiO2 surface, and as such the samples were denoted NxLVO, where N is the number of SILAR cycles. Due to its simplicity and potential for scale up the SILAR process enables the production of large quantities of immobilized materials. This is advantageous when producing a photocatalyst for water purification, as, by the nature of the process, the material is produced on an immobile and easily separated substrate and may be generated relatively quickly in large quantities. As bulk processing methods, SILAR and water purification are well matched. The process was also repeated on flat microscope glass slides and conducting FTO glass to facilitate some of the analyses. While TiO2 has been used a photocatalytic base material in the work described herein, the SILAR process may be applied to a variety of different substrates.29 Therefore, SILAR could be a facile route to deposit LaVO4 on different semiconductors to produce a range of different semiconductor composite materials.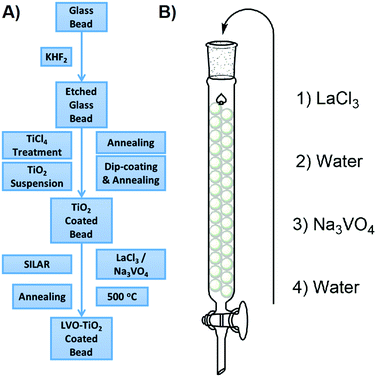 | ||
| Fig. 1 (A) Preparation method of the LVO–TiO2 coated beads. (B) SILAR processing of the TiO2 coated glass beads. | ||
Phase & morphology
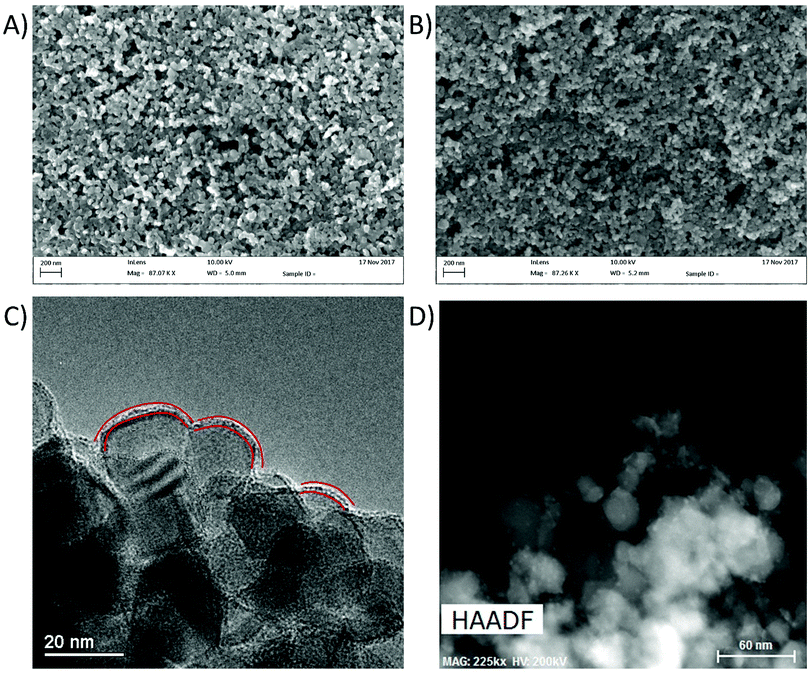
X-ray diffraction (XRD) was used to analyse the crystal structures of the prepared materials (Fig. 2). No new peaks were observed after SILAR deposition of LaVO4, with the remaining peaks being indexed to the anatase and rutile forms of TiO2. This has been noted previously by Fang et al. in their preparation of LaVO4–TiO2 composites, and was determined to be due to low concentration and small particle sizes of LaVO4 produced in their work.24 To overcome these barriers, a sample of LaVO4 using the same precursors was prepared by simple precipitation and annealing, which was found to give diffraction peaks mainly corresponding to the tetragonal form of LaVO4 (Fig. S1, ESI†). A few lower intensity peaks were identified in this trace as possibly being present due to small amounts of the monoclinic phase, indicating that his precipitation had given a mix of phases, but with the tetragonal form as the main product. As SILAR can be considered as a controlled precipitation reaction on the TiO2 surface, the LaVO4 produced by this process might be expected in the tetragonal form, however in this case it is found to be amorphous likely due to size restrictions originating from the small TiO2 substrate particle sizes. It is concluded that, if allowed to grow to larger particle sizes and higher loadings, the LaVO4 layer deposited on TiO2 in this work would likely show the crystallinity of the material detailed in Fig. S1 (ESI†), however it appears amorphous as shown in Fig. 2 due to small particle sizes resulting in little long range order for diffraction and low loading of LaVO4, even in the sample with the greatest number of SILAR cycles. Scanning electron microscope (SEM) images of the P25 films modified with LaVO4 showed little to no observable difference in morphology upon repeated SILAR cycles (Fig. 3A and B). This would suggest that the growth of LaVO4 on the TiO2 surface forms a conformal layer, and as such the particles appear approximately the same in terms of morphology. Transmission electron microscope (TEM) images agreed with the conclusion of the SEM studies, with little morphological difference being apparent upon SILAR processing. However, close inspection of the images revealed signs of a thin surface coverage of a secondary material (Fig. 3C, highlighted by red lines), which was not observed in the plain P25 (Fig. S2, ESI†). Scanning transmission electron microscope high angle annular dark field (STEM HAADF) images revealed some very small aggregates formed on the surface (Fig. 3D). Appearing as small light dots in the HAADF image, these aggregates, which may be LVO, are of around 2–5 nm and as such would not have peaks in the XRD, which agrees with the lack of LVO crystal reflections observed.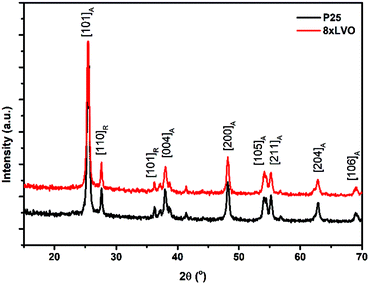 | ||
| Fig. 2 XRD traces of the pristine P25 TiO2 and a sample modified with 8xLVO SILAR cycles, subscripts on the plane annotations indicate whether the peak corresponds to anatase or rutile. | ||
Elemental analysis
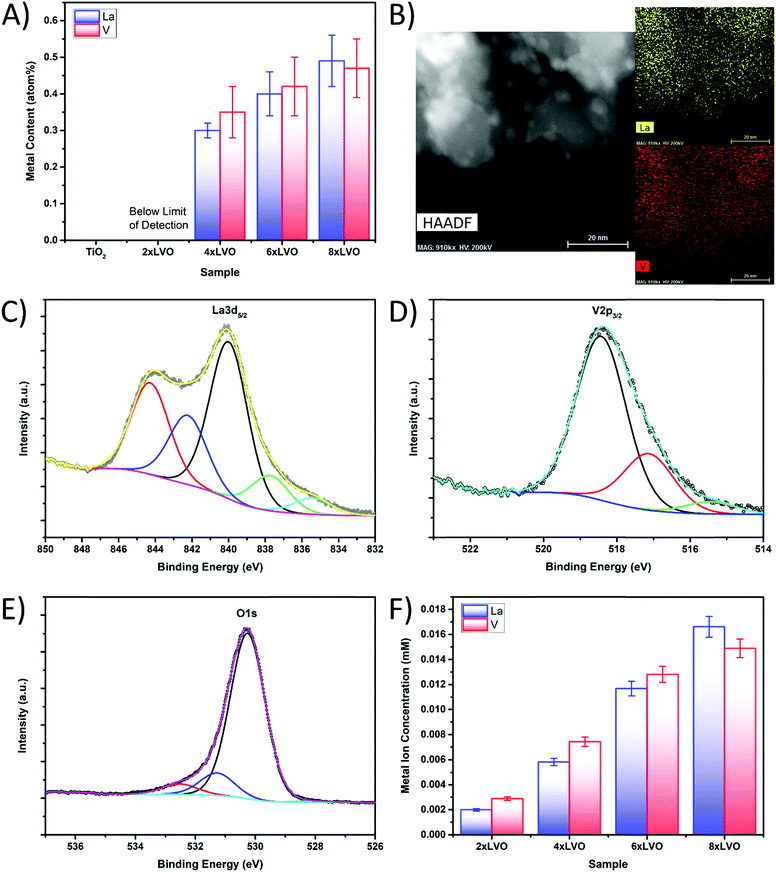
Elemental analysis using energy dispersive X-ray spectroscopy (EDX) analysis was used to quantify the levels of La and V deposited by the SILAR process (Fig. 4A). Small numbers of SILAR cycles were found to introduce very low amounts of La and V, which were below the detection limit of the instrument used in this study. However, repeated SILAR cycles were found to deposit higher levels of both La and V onto the TiO2 substrate, in a ratio within experimental error of 1![[thin space (1/6-em)]](https://www.rsc.org/images/entities/char_2009.gif) :
:![[thin space (1/6-em)]](https://www.rsc.org/images/entities/char_2009.gif) 1, indicating the formation of pure LaVO4. In a similar manner, TEM EDX element mapping experiments revealed a full surface coverage of LVO present across the whole of the observed sample (Fig. 4B). No distinct areas of high concentration were noted, indicating that the LVO material forms across the surface of the whole P25 particle surface. The small aggregates noted previously in the HAADF images hold somewhat more La or V than the rest of the material, however La and V intensity was observed away from the aggregates as well. The LVO material is therefore thought to form as a layer over the top of the P25 particles, with the concurrent formation of these small LVO aggregates.
1, indicating the formation of pure LaVO4. In a similar manner, TEM EDX element mapping experiments revealed a full surface coverage of LVO present across the whole of the observed sample (Fig. 4B). No distinct areas of high concentration were noted, indicating that the LVO material forms across the surface of the whole P25 particle surface. The small aggregates noted previously in the HAADF images hold somewhat more La or V than the rest of the material, however La and V intensity was observed away from the aggregates as well. The LVO material is therefore thought to form as a layer over the top of the P25 particles, with the concurrent formation of these small LVO aggregates.
To further establish the formation of LaVO4, X-ray photoelectron spectroscopy (XPS) was used to identify the chemical environments of the constituent elements in the 8xLVO sample (Fig. 4C, D and Fig. S3, S4, ESI†). Peaks due to the La3d5/2 were identified at binding energies of 840 eV and 844 eV, agreeing well with previous reports for La in LVO.30 The peak at 518 eV may be assigned to vanadium in LVO.31 The peak at 530 eV may be assigned to oxygen, with shoulders which may either be due to a slight difference in the binding energy of LVO based O atoms compared with TiO2 based O atoms, or surface bound water molecules.32 A single peak at 459 eV was observed, which may be simply assigned to a single chemical environment of Ti. Survey scans and high resolutions scans of the titanium regions of the LVO–TiO2 and TiO2 materials can be found in the ESI† (Fig. S3 and S4). To further confirm the presence of LVO on the TiO2 surface, and to overcome any surface sensitivity of the XPS and TEM/SEM-EDX measurements, the La and V contents were examined by dissolving the LVO material in strongly acidic conditions and studying the resulting solution using ICP-OES (Fig. 4F). La and V were observed to be present in approximately a 1![[thin space (1/6-em)]](https://www.rsc.org/images/entities/char_2009.gif) :
:![[thin space (1/6-em)]](https://www.rsc.org/images/entities/char_2009.gif) 1 ratio, confirming the formation of pure LVO by SILAR. Increased numbers of SILAR cycles were found to give higher concentrations of La and V in the leached solution, but the ratio remained to be ∼1
1 ratio, confirming the formation of pure LVO by SILAR. Increased numbers of SILAR cycles were found to give higher concentrations of La and V in the leached solution, but the ratio remained to be ∼1![[thin space (1/6-em)]](https://www.rsc.org/images/entities/char_2009.gif) :
:![[thin space (1/6-em)]](https://www.rsc.org/images/entities/char_2009.gif) 1.
1.
Band alignment determination
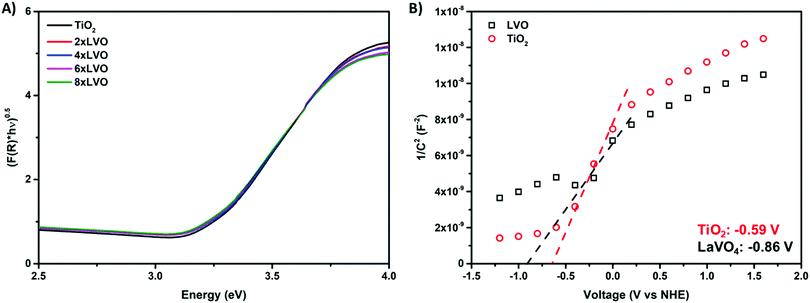
Key in photocatalytic activity of a composite is the alignment of valence and conduction bands of the two constituent materials. In this regard, diffuse reflectance and electrochemical impedance measurements were used to construct a band alignment diagram.Absorption profiles of TiO2 and the LVO–TiO2 composite materials were measured using diffuse reflectance spectroscopy (Fig. 5A). Band gaps were estimated by extrapolation of the Tauc plot according to the following equation:
To gauge the flat band energy of LVO relative to TiO2, Mott–Schottky analysis was carried out in 0.5 M Na2SO3 at the frequency of 10 kHz in the dark (Fig. 5B). Both materials displayed plots consistent with the materials in question being of n-type conductivity,34,35 with a positive slope in the linear region of the plot. According to the Mott–Schottky equation, the flat band (Efb) can be obtained from the following equation:36
Using both band gaps obtained by diffuse reflectance measurements and conduction band shifts obtained using Mott–Schottky analysis, a theoretical band alignment diagram may be constructed (Fig. 6). The prepared composites demonstrate a type-II heterojunction structure, allowing photoexcited electrons and holes to separate from LVO to TiO2 conduction bands, and from TiO2 to LVO valence bands respectively. As per the annotated radical formation redox processes in Fig. 6, it is clear that the prepared materials have the potential to form several key radical species used in the degradation of organic pollutants.2,4
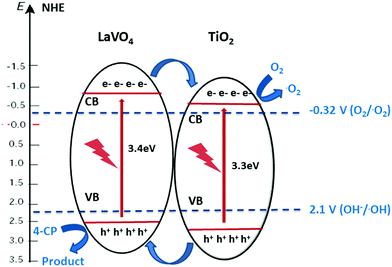 | ||
| Fig. 6 Band alignment diagram showing electron transfer between the two materials in a type-II heterojunction arrangement. | ||
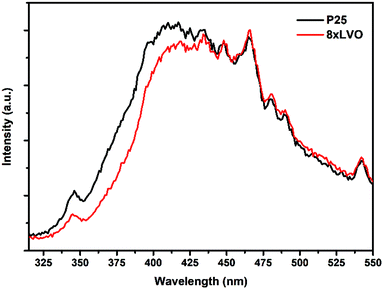
Photoluminescence (PL) spectroscopy was used to probe the degree of charge separation in the composites (Fig. 7). It is well established that a reduction in PL intensity from a semiconductor composite indicates a reduction of charge recombination.38–41 This can be ascribed to increased charge separation across the interface between the two materials, typically leading to increased photocatalytic activity.42 When excited at 300 nm, the unmodified P25 produced a broad emission from 350 to 550 nm. When modified with LVO however this emission was reduced somewhat between 325 and 425 nm, indicating transfer of photoexcited electrons and holes between the two materials, reducing the likelihood of recombination.
Photocatalytic activity
Testing of the photocatalytic bead system was carried out by packing the coated beads into a jacketed condenser type reactor. To the column was added a pollutant solution and the whole apparatus was left to stand in the dark until no change in the absorbance of the solution due to adsorption of 4CP onto the photocatalyst surface was observed (Fig. S6, ESI†). It was found that little adsorption occurred, with only around 1–2% decrease over 30 minutes. The set up was then irradiated with a 400 W halogen lamp for 180 minutes. Performance of the photocatalysts was determined according to the degradation efficiency (DE) as below:where C is the concentration of 4CP after photocatalytic degradation, C0 is the initial concentration prior to photocatalytic treatment, and DE is degradation efficiency as a percentage. Initial optimization of the number of SILAR cycles used in the preparation of the photocatalytic beads was studied using the degradation of the model pollutant 4-chlorophenol (4CP) (Fig. 8A). As a colourless organic pollutant, 4CP is free from many of the sensitization effects which can affect photocatalytic degradation tests when dye molecules are used.43 An increase in the degradation efficiency was observed between the samples 2xLVO to 6xLVO, however upon addition of a further 2 SILAR cycles to give 8xLVO a reduction in activity was noted. Thus, the optimal number of SILAR cycles was determined to be 6. As the SILAR processing of LVO on TiO2 gives a conformal layer covering the TiO2 surface, an optimal coverage of LVO has clearly been reached by the 6th SILAR cycle. Further addition of LVO likely causes the LVO material to coat the TiO2 more completely, which may inhibit the TiO2 surface. As the photocatalytic mechanism likely relies upon reduction of O2 by separated electrons in the TiO2 conduction band as shown in Fig. 6, complete coverage of TiO2 is likely disadvantageous to the photocatalytic performance as such a process would require open TiO2 surfaces to occur. Further addition of LVO beyond 6 SILAR cycles likely leads to blockage of the TiO2 surface, and any photogenerated charges on LVO that separate across the LVO/TiO2 interface will not be able to react and simply eventually recombine. It is also possible that a thicker layer of LVO/larger LVO particles on the TiO2 surface is disadvantageous due to charge generated deeper into the bulk of the material being unable to migrate to the surface or interface with TiO2, again leading to increased recombination in the composite. While 4-CP is generally accepted as a good model pollutant, it is worthwhile to note that different pollutants often exhibit different degradation rates under identical conditions.44 Therefore, while the performance described herein gives a good indication of the activity of the LVO–TiO2 composite, it should only be construed as such.
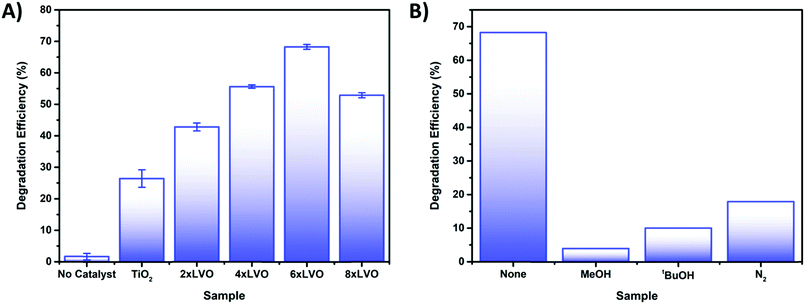 | ||
| Fig. 8 (A) Photocatalytic degradation of 4CP by the prepared TiO2 and LVO–TiO2 coated bead samples. (B) Scavenging tests of 4CP using a variety of different scavengers. | ||
To probe the photocatalytic mechanism, scavenging tests were applied to the degradation of 4CP. Introduction of relatively high concentrations of methanol, tertiary butanol, and degassing with N2 were used to scavenge for holes,45 hydroxyl radicals46 and to remove oxygen47 respectively (Fig. 8B). Introduction of all scavengers resulted in large drops in activity when compared to the baseline sample, indicating that each reactive species is involved to some extent in the photocatalytic degradation mechanism. A widely studied route for photocatalytic destruction on TiO2 surfaces is the hole driven formation of hydroxyl radicals from hydroxide or water,48,49 supporting the similar losses of activity noted when holes and hydroxyl radicals are scavenged from the reaction. Removal of O2 from the photocatalytic system also results in a large loss of activity, indicating that the formation of the superoxide radical is key in the degradation of 4CP. However, it is possible that by removing the main way in which electrons are trapped at the surface recombination is favoured, reducing the number of reactive holes and/or hydroxyl radicals. In this way it is clear that each reactive species has a role in the overall degradation mechanism.
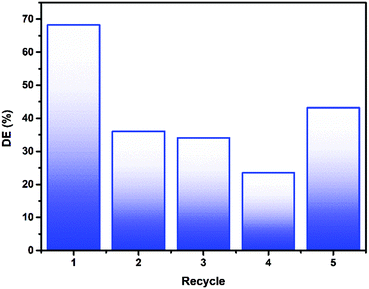
Re-use of the photocatalytic material is key in producing a viable working water purification method based on photocatalysis. As the material described herein is immobilised on a macroscopic glass support, the separation and re-use process is simplified considerably. Introduction of fresh 4CP pollutant solution to the 6xLVO sample and illuminating for a further 3 hours was used to probe the materials stability (Fig. 9). Considerable losses were noted between the first and second runs, however after these initial losses the activity remained more or less constant. It is possible that this loss after the first run is due to incomplete degradation leading to some pollutant degradation products and undegraded 4CP being retained by the material, hindering the degradation of the fresh solution on further recycles. It is known that in the degradation of organic pollutants by ROS, hydroxylation is a common step.50 As shown in the scavenging experiments detailed in Fig. 8, small alcohols can have a dramatic effect on the activity of the photocatalyst material. Therefore, the losses of activity on recycling of the material may well be due to small alcohol fragments scavenging any photogenerated charges or ROS produced by the material.
Conclusions
Herein is described the use of a sequential ionic layer adsorption reaction method by which LaVO4 may be deposited in a controlled manner as a conformal layer onto the surface of P25 TiO2 particles. This LaVO4 layer has been shown to be amorphous in nature due to its small scale, however synthesis of larger scale particles has shown that this method preferentially forms the tetragonal form of LaVO4, in contrast to other previously reported methods for LaVO4 deposition. The electronic structure of this composite material of LaVO4 and TiO2 has been determined by diffuse reflectance and Mott–Schottky analyses to be of a type-II heterojunction, with both conduction and valence bands of LaVO4 lying cathodically shifted from those of TiO2. This heterojunction structure thermodynamically allows charge separation and has been shown to give improved activity for the photocatalytic degradation of a model pollutant 4-chlorophenol.Experimental
Sample preparation
This process was also carried out using the same mass of LaVO4 in place of P25. The LaVO4 used in this procedure was prepared as follows; a solution of Na3VO4 (50 mM) was added dropwise with stirring to a solution of LaCl3 (50 mM). The resulting precipitate was isolated by centrifugation and then dried at 150 °C and annealed at 500 °C for 1 hour.
Glass bead etching
Soda-lime glass beads were added into a solution of potassium bifluoride (10 mg ml−1) and left to etch for 3 days, with occasional agitation. The beads were rinsed thoroughly with water, then sonicated in water for 15 minutes, followed by rinsing with ethanol and sonication in ethanol for a further 15 minutes. The beads were then recovered and dried at 100 °C for 30 minutes before use.Coating of glass substrates with TiO2
Prior to coating with the prepared TiO2 suspension, the beads were treated with TiCl4 (40 mM) at 70 °C for 30 minutes and then annealed at 500 °C for 30 minutes. The etched & treated glass beads were then coated with TiO2 by full immersion of an appropriate amount of the beads in the prepared suspension for 30 minutes. The excess suspension was then drained by initially decanting and then using a syringe to remove the last few drops. The beads were then spread on a glass dish and heated to 150 °C until dry. While drying the beads were swirled constantly to avoid clustering. The beads were then annealed at 500 °C for 1 hour. This process was repeated three times to build up a larger amount of TiO2 on the bead surface.In addition to coating on glass beads, a dip coating process was used to apply the prepared suspension to microscope glass and FTO substrates, which were used in analyses requiring flat surfaces. Dip coating was carried out using a Holmarc model dip-coating unit. Substrates were dipped at a speed of 2 mm s−1, held in the suspensions for 20 s and then retracted at the same speed. One side (for FTO, the non-FTO side) of the substrates was then wiped clean and then the substrate dried and heat treated in the same manner as the beads. Coating of these substrates with LaVO4 was achieved using the LaVO4 suspension applied in the same way.
SILAR modification
TiO2 coated glass beads were firstly packed into a standard chromatography column. Two solutions were then prepared, solution A consisting of LaCl3 in water (50 mM), and solution B consisting of Na3VO4 (50 mM) in water. Solution A was added to the column in enough volume such that the beads were fully immersed, and left to stand for 300 seconds. Solution A was then drained and de-ionised water was then added and allowed to stand for 300 seconds. The water was then drained and solution B added and allowed to stand for 300 seconds. After draining, water was finally added and allowed to stand for another 300 seconds. This process is termed as one SILAR cycle, and was repeated between 2 and 8 times to give the different SILAR modified samples.Modification of the coated microscope glass and FTO was achieved in similar fashion. Coated substrates were dipped for 300 seconds into a beaker containing solution A, then washed with de-ionised water for 300 seconds, then dipped into solution B for 300 seconds, before finally washing with water for a further 300 seconds.
LVO–TiO2 coated substrates were annealed at 500 °C for 1 hour in air and allowed to cool naturally before use.
Analytical techniques
X-ray diffraction studies were performed using a Bruker D2 phaser using Cu Kα radiation. UV-vis diffuse reflectance measurements were made using a JASCO V-670 spectrophotometer with an integrating sphere attachment. SEM images were collected using a Carl Zeiss SIGMA HD VP Field Emission SEM, operated in InLens mode with a 10 kV accelerating voltage. SEM-EDS measurements were made on the same instrument, using an Oxford AZtec ED X-ray analysis set up. Solutions for ICP-OES analysis were obtained by dissolving the LVO materials in nitric acid before dilution to give a 3 vol% HNO3 solution. ICP-OES analysis was then performed on a PerkinElmer Optima 5300 DV ICP-OES. TEM images and elemental maps were captured with a FEI Titan Themis electron microscope using a Super-X high sensitivity windowless EDX detector. X-ray photoelectron spectroscopy measurements were carried out using an Al Kα X-ray source on the Scienta 300 XPS spectrometer. Analyses accompanied by an error have been calculated based on three separate measurements. Mott–Schottky measurements were carried out on AUTOLAB PGSTAT 30 in a three-electrode system. TiO2 and LaVO4 photoelectrode materials coated on FTO with 1 × 1 cm2 areas respectively, served as working electrode, platinum as counter electrode and Ag/AgCl as reference electrode in 0.5 M Na2SO3. Photoluminescence measurements were carried out using a Horiba Jobin Yvon Fluoromax-3 fitted with a fibre optic attachment. The excitation wavelength used for all measurements was 300 nm.Photocatalytic testing
The coated glass bead samples (approx. 11.5 g) were packed into a jacketed column. 5 ml of a solution of 4-chlorophenol (156 μM) was then added such that the beads were immersed in the solution. The assembly was then irradiated with an unfiltered halogen lamp (400 W, >350 nm) from the side from 5 cm away for 3 hours, keeping the temperature approximately constant at room temperature using a flowing water jacket. The change in absorption of the solution was measured on a JASCO V-670 UV-vis spectrophotometer at 223 nm. Error bars for these measurements were obtained by measurement of three separate samples in the same way. Photocatalytic scavenging tests were carried out in the same way, using the same concentration of 4-chlorophenol solution, with the addition of tertiary butanol (50 mM), methanol (50 mM) or with the 4-chlorophenol solution being degassed by bubbling with N2 for 30 minutes prior to the test. Recycling tests of the materials were carried out by draining any remaining 4CP solution, washing the beads by firstly passing deionized water through the column and then standing in deionized water for at least 16 hours. The deionized water was then drained, and the beads dried in a stream of N2 gas before repeating the photocatalyst testing on 4CP.Conflicts of interest
There are no conflicts to declare.Acknowledgements
The authors would like to thank the CRITICAT Centre for Doctoral Training (PhD studentship to G. O.; Grant Code: EP/L016419/1) and the Energy Technology Partnership (ETP) Postgraduate and Early Career Researcher Exchange (PECRE) program for financial support. TEM studies were achieved with the support of the EPSRC Capital for Great Technologies Grant (EP/L017008/1). Open data: https://doi.org/10.7488/ds/2810.References
- T. Ochiai and A. Fujishima, J. Photochem. Photobiol., C, 2012, 13, 247–262 CrossRef CAS.
- H. Park, Y. Park, W. Kim and W. Choi, J. Photochem. Photobiol., C, 2013, 15, 1–20 CrossRef CAS.
- V. Porley, E. Chatzisymeon, B. C. Meikap, S. Ghosal and N. Robertson, Environ. Sci.: Water Res. Technol., 2020, 6, 809–816 RSC.
- Y. Nosaka and A. Y. Nosaka, Chem. Rev., 2017, 117, 11302–11336 CrossRef CAS PubMed.
- K. Nakata and A. Fujishima, J. Photochem. Photobiol., C, 2012, 13, 169–189 CrossRef CAS.
- J. Low, J. Yu, M. Jaroniec, S. Wageh and A. A. Al-Ghamdi, Adv. Mater., 2017, 29, 1601694 CrossRef PubMed.
- M. R. Hoffmann, S. T. Martin, W. Choi and D. W. Bahnemann, Chem. Rev., 1995, 95, 69–96 CrossRef CAS.
- C. Song, L. Wang, F. Gao and Q. Lu, Chem. – Eur. J., 2016, 22, 6368–6373 CrossRef CAS PubMed.
- X. Wang, L. Bai, H. Liu, X. Yu, Y. Yin and C. Gao, Adv. Funct. Mater., 2018, 28, 1–8 Search PubMed.
- J. Yang, Q. Wu, S. He, J. Yan, J. Shi, J. Chen, M. Wu and X. Yang, Nanoscale, 2015, 7, 13888–13897 RSC.
- S. G. Kumar and L. G. Devi, J. Phys. Chem. A, 2011, 115, 13211–13241 CrossRef CAS PubMed.
- Y. Wang, Q. Wang, X. Zhan, F. Wang, M. Safdar and J. He, Nanoscale, 2013, 5, 8326–8339 RSC.
- S. Yu, J. Liu, Y. Zhou, R. D. Webster and X. Yan, ACS Sustainable Chem. Eng., 2017, 5, 1347–1357 CrossRef CAS.
- J. Low, B. Cheng and J. Yu, Appl. Surf. Sci., 2017, 392, 658–686 CrossRef CAS.
- Y. Huo, X. Yang, J. Zhu and H. Li, Appl. Catal., B, 2011, 106, 69–75 CAS.
- K. Osako, K. Matsuzaki, T. Susaki, S. Ueda, G. Yin, A. Yamaguchi, H. Hosono and M. Miyauchi, ChemCatChem, 2018, 10, 3666–3670 CrossRef CAS.
- M. Ghosh, J. Liu, S. S. C. Chuang and S. C. Jana, ChemCatChem, 2018, 10, 3305–3318 CrossRef CAS.
- M. Wu, L. Gu, Q. Wang, C. Wang and H. Zhang, ChemNanoMat, 2018, 4, 387–393 CrossRef CAS.
- Q. Tang, X. Meng, Z. Wang, J. Zhou and H. Tang, Appl. Surf. Sci., 2018, 430, 253–262 CrossRef CAS.
- Q. Sun, Y. Hong, Q. Liu and L. Dong, Appl. Surf. Sci., 2018, 430, 399–406 CrossRef CAS.
- L. Kong, X. Zhang, C. Wang, F. Wan and L. Li, Chin. J. Catal., 2017, 38, 2120–2131 CrossRef CAS.
- J. W. Stouwdam, M. Raudsepp and F. C. J. M. van Veggel, Langmuir, 2005, 21, 7003–7008 CrossRef CAS PubMed.
- Q. Wang, Z. Zhang, Y. Zheng, W. Cai and Y. Yu, CrystEngComm, 2012, 14, 4786 RSC.
- J. Fang, D. Li, Y. Shao and J. Hu, J. Mater. Chem. A, 2016, 4, 14213–14221 RSC.
- X. Zou, X. Li, Q. Zhao and S. Liu, J. Colloid Interface Sci., 2012, 383, 13–18 CrossRef CAS PubMed.
- R. Yuan, T. Chen, E. Fei, J. Lin, Z. Ding, J. Long, Z. Zhang, X. Fu, P. Liu and L. Wu, ACS Catal., 2011, 1, 200–206 CrossRef CAS.
- H. Huang, D. Li, Q. Lin, W. Zhang, Y. Shao, Y. Chen, M. Sun and X. Fu, Environ. Sci. Technol., 2009, 43, 4164–4168 CrossRef CAS PubMed.
- G. Odling, E. Chatzisymeon and N. Robertson, Catal. Sci. Technol., 2018, 8, 829–839 RSC.
- H. M. Pathan and C. D. Lokhande, Bull. Mater. Sci., 2004, 27, 85–111 CrossRef CAS.
- C.-Y. Liu, S.-Y. Tsai, C.-T. Ni and K.-Z. Fung, J. Electron. Mater., 2017, 46, 2301–2308 CrossRef CAS.
- P. Parhi and V. Manivannan, Solid State Sci., 2008, 10, 1012–1019 CrossRef CAS.
- Y. He, J. Cai, L. Zhang, X. Wang, H. Lin, B. Teng, L. Zhao, W. Weng, H. Wan and M. Fan, Ind. Eng. Chem. Res., 2014, 53, 5905–5915 CrossRef CAS.
- Y. He, Y. Wang, L. Zhao, X. Wu and Y. Wu, J. Mol. Catal. A: Chem., 2011, 337, 61–67 CrossRef CAS.
- K. Sayama, A. Nomura, T. Arai, T. Sugita, R. Abe, T. Oi, Y. Iwasaki, Y. Abe and H. Sugihara, J. Phys. Chem. B, 2006, 3, 11352–11360 CrossRef PubMed.
- G. Wang, Y. Ling, X. Lu, F. Qian, Y. Tong, J. Z. Zhang, V. Lordi, C. Rocha Leao and Y. Li, J. Phys. Chem. C, 2013, 117, 10957–10964 CrossRef CAS.
- W. Q. Fang, X. L. Wang, H. Zhang, Y. Jia, Z. Huo, Z. Li, H. Zhao, H. G. Yang and X. Yao, J. Mater. Chem. A, 2014, 2, 3513 RSC.
- S. J. Hong, S. Lee, J. S. Jang and J. S. Lee, Energy Environ. Sci., 2011, 4, 1781 RSC.
- H. Xu, J. Yi, X. She, Q. Liu, L. Song, S. Chen, Y. Yang, Y. Song, R. Vajtai and J. Lou, Appl. Catal., B, 2018, 220, 379–385 CrossRef CAS.
- B. Su, L. Huang, Z. Xiong, Y. Yang, Y. Hou, Z. Ding and S. Wang, J. Mater. Chem. A, 2019, 7, 26877–26883 RSC.
- X. Lin, H. Chen, Z. Hu, Y. Hou and W. Dai, Solid State Sci., 2018, 83, 181–187 CrossRef CAS.
- S. Wang, Y. Wang, S. L. Zhang, S.-Q. Zang and X. W. Lou, Adv. Mater., 2019, 31, 1903404 CrossRef CAS PubMed.
- Y. Wang, W. Yang, X. Chen, J. Wang and Y. Zhu, Appl. Catal., B, 2018, 220, 337–347 CrossRef CAS.
- L. Zhang, C. G. Niu, G. X. Xie, X. J. Wen, X. G. Zhang and G. M. Zeng, ACS Sustainable Chem. Eng., 2017, 5, 4619–4629 CrossRef CAS.
- G. Odling, Z. Y. Pong, G. Gilfillan, C. R. Pulham and N. Robertson, Environ. Sci.: Water Res. Technol., 2018, 4, 2170–2178 RSC.
- M. Shen and M. A. Henderson, J. Phys. Chem. Lett., 2011, 2, 2707–2710 CrossRef CAS.
- J. Kim, C. W. Lee and W. Choi, Environ. Sci. Technol., 2010, 44, 6849–6854 CrossRef CAS PubMed.
- Y. Jin, D. Jiang, D. Li and M. Chen, Catal. Sci. Technol., 2017, 7, 2308–2317 RSC.
- G. Odling and N. Robertson, Catal. Sci. Technol., 2019, 9, 533–545 RSC.
- C. Turchi and D. Ollis, J. Catal., 1990, 122, 178–192 CrossRef CAS.
- J. Theurich, M. Lindner and D. W. Bahnemann, Langmuir, 1996, 12, 6368–6376 CrossRef CAS.
Footnote |
| † Electronic supplementary information (ESI) available. See DOI: 10.1039/d0ma00047g |
| This journal is © The Royal Society of Chemistry 2020 |

