DOI:
10.1039/D0LC00523A
(Paper)
Lab Chip, 2020,
20, 3733-3743
Area cooling enables thermal positioning and manipulation of single cells†
Received
19th May 2020
, Accepted 7th September 2020
First published on 1st October 2020
Abstract
Contactless particle manipulation based on a thermal field has shown great potential for biological, medical, and materials science applications. However, thermal diffusion from a high-temperature area causes thermal damage to bio-samples. Besides, the permanent bonding of a sample chamber onto microheater substrates requires that the thermal field devices be non-disposable. These limitations impede use of the thermal manipulation approach. Here, a novel manipulation platform is proposed that combines microheaters and an area cooling system to produce enough force to steer sedimentary particles or cells and to limit the thermal diffusion. It uses the one-time fabricated motherboard and an exchangeable sample chamber that provides disposable use. Sedimentary objects can be steered to the bottom center of the thermal field by combined thermal convection and thermophoresis. Single particle or cell manipulation is realized by applying multiple microheaters in the platform. Results of a cell viability test confirmed the method's compatibility in biology fields. With its advantages of biocompatibility for live cells, operability for different sizes of particles and flexibility of platform fabrication, this novel manipulation platform has a high potential to become a powerful tool for biology research.
Introduction
The capability to manipulate cells and particles precisely has stimulated great breakthroughs in biological, medical and materials science fields, such as cell interacting behavior and mechanics, drug delivery and semiconductor processing.1–3 Among these, non-contact manipulations have attracted extensive attention in lab-on-a-chip techniques.4–7 The key point of non-contact manipulations is to control the motion of micro-objects by employing a supplied external field gradient, such as an optical field, acoustic field, electrical field, and thermal field. Optical tweezers are widely used for single particle (cell, bacteria, or virus) manipulation at micro and nano scales, and they are capable of trapping and transporting the single particle by using a highly focused laser beam.8,9 However, optical tweezers have disadvantages of requiring complicated optical setups and expensive optical equipment that are difficult to miniaturize and integrate into lab-on-chip systems.
Based on the development of microelectromechanical systems (MEMS) and microfluidics systems, many non-contact methods have been proposed that provide a promising alternative for supplying an easily fabricated and integrated platform compared with optical systems. For instance, acoustic tweezers have the capability to steer different sizes of objects (from nanometers to millimeters) and they have less impact on cell viability.10–12 Since acoustic tweezers need a function generator, an amplifier, and software to control and generate the appropriate periodic frequency signals, users may encounter some limitations in operation of this equipment. Because vibrating and pressure waves are the basis for the acoustic method, the acoustic tweezers might influence the cell adhesion. Human embryonic kidney cells were detached in less than 2 min under the acoustic wave (17 MHz) and mouse ovary cells were also quickly detached in 5 min under the low-frequency acoustic wave (20 kHz).13,14 Although electrokinetic techniques are simple to implement and their manipulating platform is low-cost compared with other methods that have been widely applied in particle concentration,15 separation,16 and rotation,17 their applications have been limited by particle polarizability and medium conductivity.
The thermal field manipulation method has received considerable attention because of its optic-free mechanism, its ease of integration with other functional units, no vibration, and no limitation for the medium conductivity. Depending on the heat source, thermal field methods can be classified as electrical methods, for example, radio frequency (RF) electronics and a DC signal (Joule heat), optical methods, plasma methods, and acoustic methods. Here, we discuss electrical methods because they have a high energy conversion efficiency from electrical energy to heat energy. Compared to the control equipment in an RF electronics method,18 a DC signal method (using a microscale resistance pattern to produce Joule heat) that uses simpler equipment and has user-friendly operation has attracted more research interest.19–23 Among these thermal-driven manipulation platforms, there are two main issues demanding solution. The first is the trade-off between temperature and thermal diffusion. Generally, the particle manipulation forces are from thermal convection, thermocapillary convection, and thermophoresis,24–26 all of which have a positive relationship with temperature. High temperature means there is a strong manipulating force to steer different kinds of objects. Meantime, the high temperature causes a large area to be influenced by thermal diffusion, which might cause thermal damage to biological samples.27 Cong et al.19 showed that thermal field manipulation at 30 °C can be used to trap E. coli (size: 1 μm). However, at this temperature, it was not possible to manipulate large particles or cells effectively. Zhang et al.21 developed an efficient manipulation system to transport particles and large size droplets (size: 100 μm) by combining a thermal field and an electric field at 70 °C, a temperature at which cells cannot live. The second issue is contamination of the manipulation platform. The micro-scale resistive electrodes that serve as the thermal sources are in direct contact with solution, and their performance can be degraded although some perform better when they have an isolation layer.28,29 However, as the micro-heater structure is fixed on the platform, there is a hard trade-off between disposable use and fabrication cost. Therefore, a next generation approach has not been proposed that limits the thermal diffusion and allows disposable use in a low-cost way.
In this paper, we developed a flexible manipulation platform that has microheaters and a area cooling temperature system to limit the thermal diffusion and circumvent the dilemma between disposable use and one-time fabrication. The manipulation platform consists of three main parts: an area cooling temperature part (a Peltier element and heat sink), a motherboard (composed of a glass substrate with microheaters), and a daughterboard (with a disposable sample chamber made of polydimethylsiloxane (PDMS), a thin glass sheet and a glass cover) (Fig. 1a). Disposable use is realized and operating costs are dropped significantly using this design concept (Fig. 1e and f). The induced thermal convection can steer the sedimentary particles and can trap particles in combination with thermophoresis at the center of the heat source. Four microheaters can be used to steer particles on different paths (Fig. 1c and d). Additionally, thermal diffusion can be greatly limited by the area cooling system (Fig. 1g–j). We first characterize the ability of area cooling to improve control over the temperature field in a thermal manipulation device. Then we demonstrate application of thermal manipulation to control motion of objects in 1D (using a single heater) and 2D (using an array of four heaters). Finally, we assess capabilities for manipulation of biological cells achieving 2D motion control without affecting cell viability. This simple and flexible platform is attractive for a wide range of biology applications needing particle manipulation.
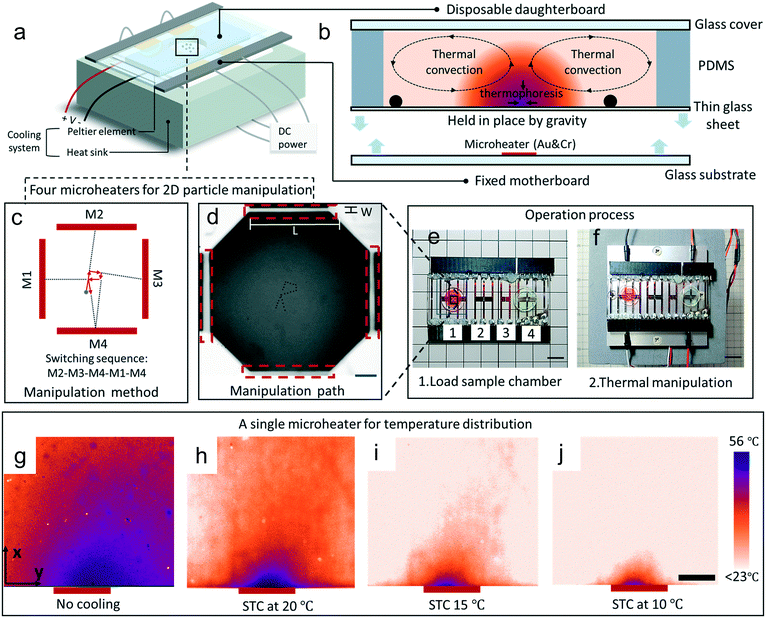 |
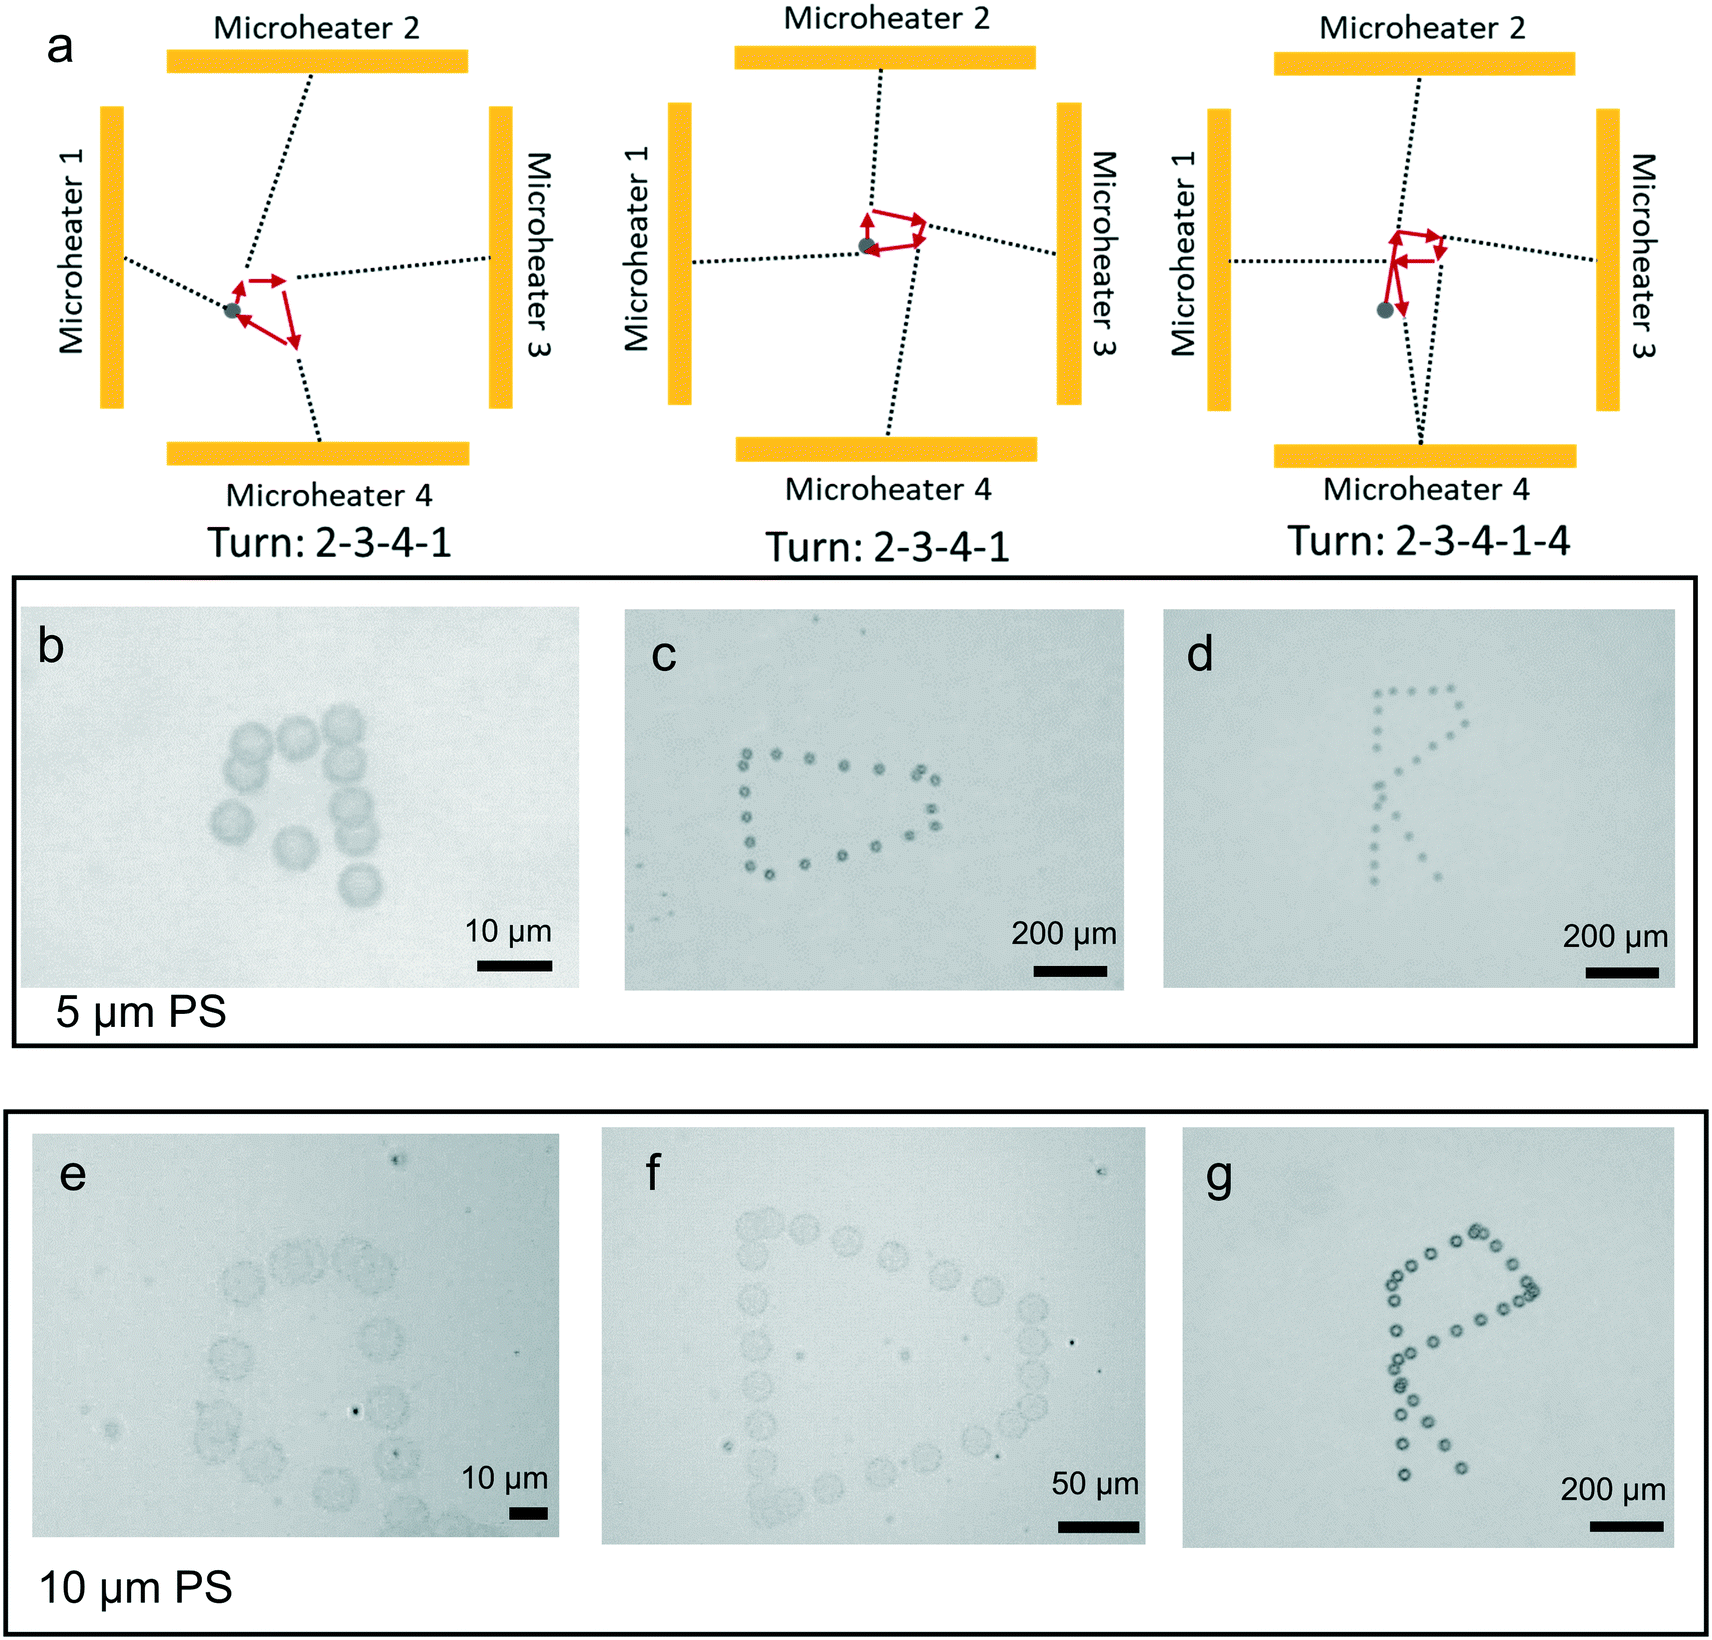
| | Fig. 1 Device structure and working mechanism of the thermal manipulation platform. (a) Schematic configuration of the whole platform. Bottom part: The cooling temperature system includes the Peltier element and heat sink. Middle part: The motherboard integrated with electrodes as microheaters. Top part: The disposable chamber daughterboard fabricated from PDMS, a thin glass substrate and a glass cover. (b) Particle migration mechanism: sedimentary particles are driven to the bottom center by thermal convection and thermophoresis. (c) Manipulation method for steering the particle in a pre-designed path (the switching sequence for four microheaters is 2, 3, 4, 1, 4). (d) Photo of the four microheaters and manipulation path, “R” letter (width, 10 μm; length, 500 μm). Scale bar, 200 μm. (e and f) The operation process for the manipulation platform. Scale bar, 10 mm (numbers 1 and 2 microheaters are for 2D particle manipulation; numbers 3 and 4 are for temperature profile measurement and controlling motion of a particle in 1D). (g–j) Effect of limiting thermal diffusion of a single microheater: temperature distributions for applied 3 V DC voltage amplitude without cooling and with different set temperatures of area cooling (STC) at 20 °C, 15 °C, and 10 °C. Scale bar, 200 μm. | |
Materials and methods
Working principle
Under a thermal field, the migration of particles is subject to two predominant forces which are from thermal convection and thermophoresis. The velocity distribution of convection flow is described by the steady-state Navier–Stokes equation:| | | ρm(u·∇)u = μ(T)∇2u − ∇p + fb | (1) |
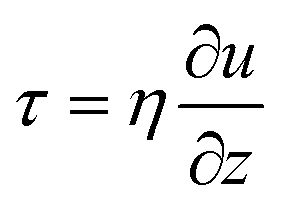
where ρm is the fluid density at room temperature, u is the fluid velocity, μ(T) is the dynamic fluid viscosity at the temperature T, p is the pressure, fb is the volumetric buoyancy force, which can be calculated by the following equation. fb = −g[ρm −ρ(T)] ≈ −gρ0β(T − T0), where g is the gravitational acceleration, ρ(T) is the density of fluid at the temperature T, β is thermal-expansion coefficient of fluid, and T0 is the initial temperature. The mass conservation equation for an incompressible fluid is ∇·u = 0. Considering the wall effect, according to Newton's law, the shear stress is  , and the velocity profile close to the wall is parabolic. Based on the symmetry of thermal convection, the whole velocity profile along the height direction is a pair of opposite parabolic shapes (Fig. 2). Under the Hagen–Poiseuille law, the velocity profile is30
| | 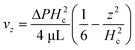 | (2) |
where ΔP is the effective pressure difference, L is the radius of convection, and Hc is the height of the chamber (0 ≤ z ≤ Hc/4).
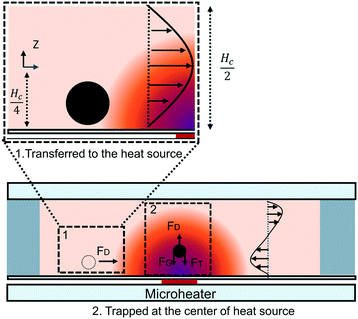 |
| | Fig. 2 Velocity profile and force analysis in the two steps for particle migration: transfer to the heat source and trapping at the center of the heat source (FD, drag force, FG, gravitational force, FT, thermophoretic force). | |
The migration of particles driven by thermophoresis is quantified by the total mass flux J, which is defined by31
where
c is the concentration of the particles,
DT is the thermal diffusion coefficient, and
D is the particle mass diffusivity. Based on the hypothesis that the thermophoretic velocity
VT depends linearly on the temperature gradient ∇
T with a proportionality constant which equals the thermal diffusive coefficient
DT,
32 we obtain the following equation:
In a closed system, when a steady-state is reached, the experimental thermal diffusion coefficient can be obtained from
eqn (3):
the value of
DT of colloidal particles in aqueous solution is several μm
2 s
−1 K, and the negative sign means the particle transfers from cold to hot regions (thermophilic) and the positive sign represents the opposite transfer direction (thermophonic).
33 Based on the analytical Duhr–Dhont model,
34DT of large particles (>1 μm) is negative and
DT of small particles (<1 μm) is positive. Since heat is lost quickly on the microscale, the temperature gradient dramatically decreases along the temperature transfer direction,
35 and the thermophoresis effect can only influence the particle migration within a very short distance from the heat source (100 nm to 20 μm).
36
The migration process was divided into two steps: transfer to the center of the heater source and trapping in the heater source (Fig. 2). Because of the small effective range of thermophoresis, we assumed that thermophoresis could only occur for the particles in the trapping process. The motion of the particle in the transferred process is given by
Theoretically, the particle velocity equals the local fluid velocity. Therefore, the particle velocity decreases when the centerline of particle is close to the wall.
The motion of the particle in the trapped process is given by
where
vG is the particle migration velocity caused by gravitational force.
Device fabrication and experimental setup
To fabricate the motherboard, a glass substrate was cleaned using H2SO4/H2O2 solution for 15 min to ensure that there were no contaminants on its surface. Subsequently, Cr and Au layers were deposited on the cleaned glass surface by sputtering (EIS-220; Elionix, Tokyo, Japan) for 30 min and 90 min, respectively. Positive photoresist (OFPR-800LR; Tokyo Ohka Kogyo, Kanagawa) was coated on the metal layers with a spin-coater (1H-D7; Mikasa, Tokyo) spinning first at 500 rpm for 10 s and then at 4000 rpm for 30 s. The photoresist covering the metal layers was baked at 95 °C for 90 s and then exposed for 14.5 s to UV light using a design mask to develop the micro-heater pattern. After etching the Au and Cr layers, the substrate was immersed in acetone for about 4 min to remove organic contaminants. Finally, the substrate was rinsed in pure water and blow-dried using N2 flow. For the daughterboard as the functional unit, it consisted of a thin glass substrate (treated by oxygen plasma, 15 W, 60 s), a PDMS wall sample chamber and a glass cover.
In experiments, 5, 10, 40 and 90 μm polystyrene spheres (Polysciences. Inc, PA, USA) were suspended in deionized water. A DC power supply (PPS303; AS one, Osaka, Japan) was used to energize the microheaters and the cooling Peltier element (VPE35-12-40S, VICS, Tokyo, Japan). A microscope (MF-B1010C; Mitutoyo, Tokyo, Japan) equipped with a CCD camera unit (Lu075C; Lumenera, Ottawa, Canada) was used to observe the movement of particles and cells, and the velocity was calculated using the Fiji-ImageJ software. A homemade python software code was prepared to obtain the layered images at key frames for the path of motion.
Temperature measurement
Rhodamine B powder (183-00122; Wako pure chemical, Osaka, Japan) was dissolved in distilled water at a concentration of 100 mM. Fluorescence imaging of the rhodamine B was done using a fluorescence microscope (IX-71; Olympus, Tokyo, Japan) with an objective 10× lens (NA, 0.3). A filter set (Olympus) was used to transmit excitation wavelengths in the range of 530–550 nm and to observe fluorescence wavelengths above 575 nm. All of these images were captured with software (CellSens), the exposure time was set at 160 ms and ISO was set at 1600. The transfer relationship between fluorescence intensity and temperature was calculated by Fiji-ImageJ software. A homemade python software code was prepared to calculate and smooth the data of temperature and temperature gradient.
Cell viability test
Mouse skeletal myoblast (C2C12) (RCB0981; Riken BRC cell bank, Ibaraki, Japan) cell line was used for cell viability test. First, Dulbecco's modified Eagle's medium (D6429; Sigma-Aldrich) supplied with 10 v/v% fetal bovine serum (Nichirei Biosciences, Tokyo) and 1 v/v% penicillin–streptomycin (168-23191; Wako) was prepared to maintain the cells. The cells were passaged by a trypsin-digest method before full-confluency and then diluted to 2 × 10⁵ cells per mL in the medium. To demonstrate the cell viability, 120 μL C2C12 cell suspensions were prepared under four different conditions: (1) untreated cells (positive control); (2) using the thermal manipulation platform with voltage amplitude of 2.5 V and without cooling temperature for 5 min; (3) using the thermal manipulation platform with voltage amplitude of 2.5 V and with 15 °C cooling temperature for 5 min; (4) using the thermal manipulation platform with voltage amplitude of 2.5 V and with 10 °C cooling temperature for 5 min. After preparation of the suspensions, all chambers with cells were then incubated at 37 °C in a humidified condition with 5% CO2. The fluorescence images were captured for analysis by ImageJ.
Results and discussion
Temperature distribution
The thermal source is from the electrode by Joule heating when a voltage is applied. The heat generated by the electrode is dissipated in the ambient (cooling system, fluid, glass materials, and air). As the system reaches a steady-state condition, the microheater dissipates the heat flux on its up-side toward the thin glass substrate of the daughterboard which contacts the fluid, and it directs the heat flux on its down-side toward a glass slide which contacts the cooling system. In this case, the total in and out heat flux can be given bywhere Qm is the heat flux produced by the microheater, Qh = k(Tm − Ts)/ht is heat dissipation by conduction along the thin glass substrate, Qf = H(Tf − Ts) is convective heat flux, Qc = k(Tm − Tc)/hg is heat dissipation by conduction through the cooling system. Additionally, k, Tm, Ts, ht, H, Tf, Tc, and hg are the thermal conductivity coefficient, the temperature of the microheater, the temperature of the up-side of the thin glass substrate, the thickness of the thin glass, the convective heat transfer coefficient, the temperature of the fluid, the temperature of the cooling system and the thickness of the glass substrate, respectively. Importantly, the heat flux becomes higher by using thin glass materials which we have developed techniques to handle.37–39
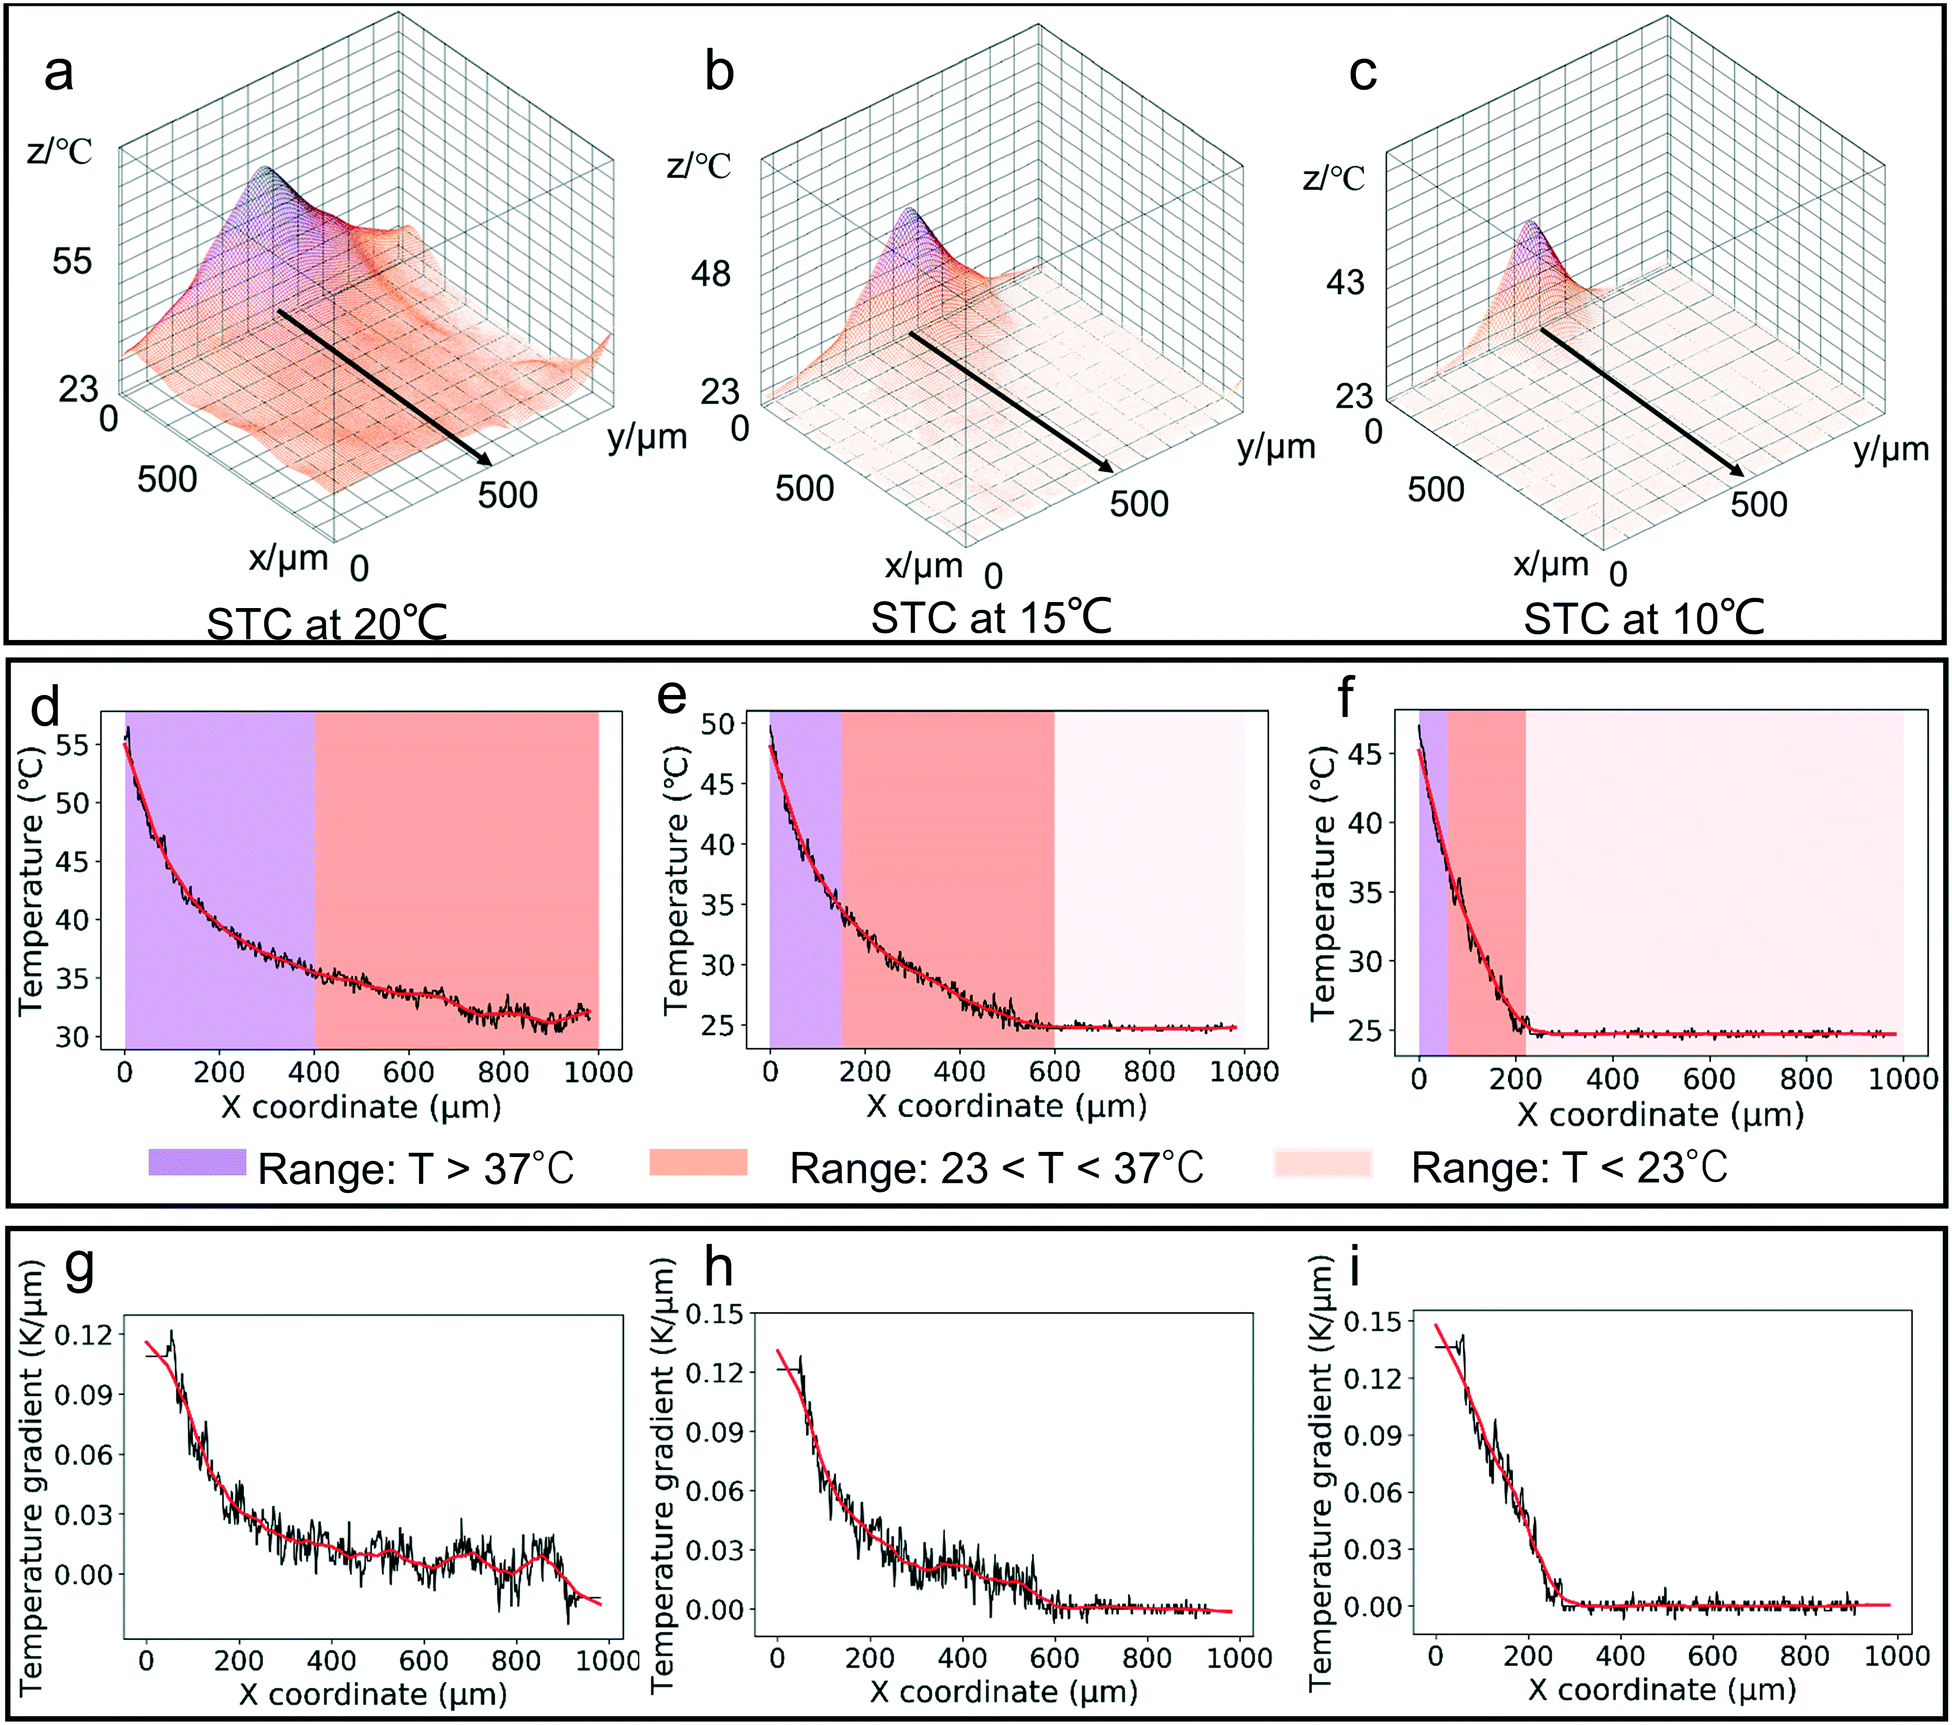
In order to investigate the thermal profile of the microheaters, the fluorescent temperature measurement using rhodamine B was done. Rhodamine B is a temperature sensitive fluorescent, water-soluble compound.40–43 Its absorption and emission peaks are at 554 nm and 576 nm. However, there are some limitations to use fluorescent dyes.41 As the temperature profile is three-dimensional, the final temperature profiles were averaged over the height of the sample chamber. And the fluorescent dyes can be adsorbed easily by the PDMS, which might cause the true temperature distribution not to be shown. In this experiment, focal length of the microscope was kept at the top surface of the thin glass and a thin chamber of 50 μm height (Fig. S1†) was used to minimize the height influence as much as possible and to characterize the surface temperature. To acquire the temperature map around the single microheater, first a temperature calibration was performed to get the relationship between temperature and the fluorescence intensity. A cubic equation was derived:
| | | T = 90.094 − 154.82IR + 169.19I2R − 81.083I3R | (9) |
where
IR is the measured fluorescence intensity. Based on the calibration equation, the temperature distribution maps for a single microheater at different cooling temperatures are shown in
Fig. 1g–j and transferred from the fluorescent profile to the temperature value (
Fig. 3a–c). Here, three regions were defined by the temperature: cold region (<23 °C, room temperature), normal regime (23 °C <
T < 37 °C, body temperature) and hot region (>37 °C). The results indicated that when area cooling was applied, the hot region was significantly limited. When the cooling system was set to 10 °C, the hot region decreased 90% compared to the no cooling situation. Based on
eqn (8), when
Qm is constant, decreasing the temperature of area cooling increases the heat dissipation
Qc and reduces the heat dissipation
Qf. Thus, it decreases the fluid temperature.
Fig. 2a–f show that there was a decrease of the maximum temperature of the fluid when lowering the set temperature of area cooling (STC). It resulted from the fact that the cooling heat flux applied by the area cooling was much larger than the heat flux from the microheater.
Fig. 3g–i show the temperature gradient with different STCs. These results indicated that when the set temperature was decreased, the maximum temperature gradient on the thin glass surface increased and the maximum temperature gradient was below 0.15 k μm
−1. Theoretically, according to
eqn (4), the thermophoretic velocity was below 1.5 μm s
−1 (the
DT for 5 μm particle is about 10.7 μm
2 s
−1 K). The velocity decreased below 1 μm s
−1 at the position that was about 30 μm away from the center of the heat source. This agreed with the assumption that thermophoresis could only influence the trapping process in the experiment. Applying area cooling can shrink the high-temperature region, which produces a low-temperature region and limits the thermal diffusion. Normally, when the surrounding temperature is above 37 °C, the cell viability may be affected. Thus, the cold region is very important when it is applied in manipulation of cells and biomolecules. Furthermore, mammalian cells incubated at low temperature (<16 °C) maintain a high level of viability and recovery for a long time,
44 which shows that low temperature to some level is harmless for cell viability. Thus, this platform has a great potential for biological research.
 |
| | Fig. 3 Quantitative analysis of temperature distribution (DC voltage amplitude, 3 V). 3D temperature spatial distribution with different cooling temperatures (STCs) at (a) 20 °C, (b) 15 °C and (c) 10 °C. Temperature range analysis at scan line, y = 500 μm (over 37 °C, between 37 °C and 23 °C, and below 23 °C) with different STCs at (d) 20 °C, (e) 15 °C and (f) 10 °C. Temperature gradient analysis with different STCs at (g) 20 °C, (h) 15 °C, and (i) 10 °C. | |
Migration velocity analysis
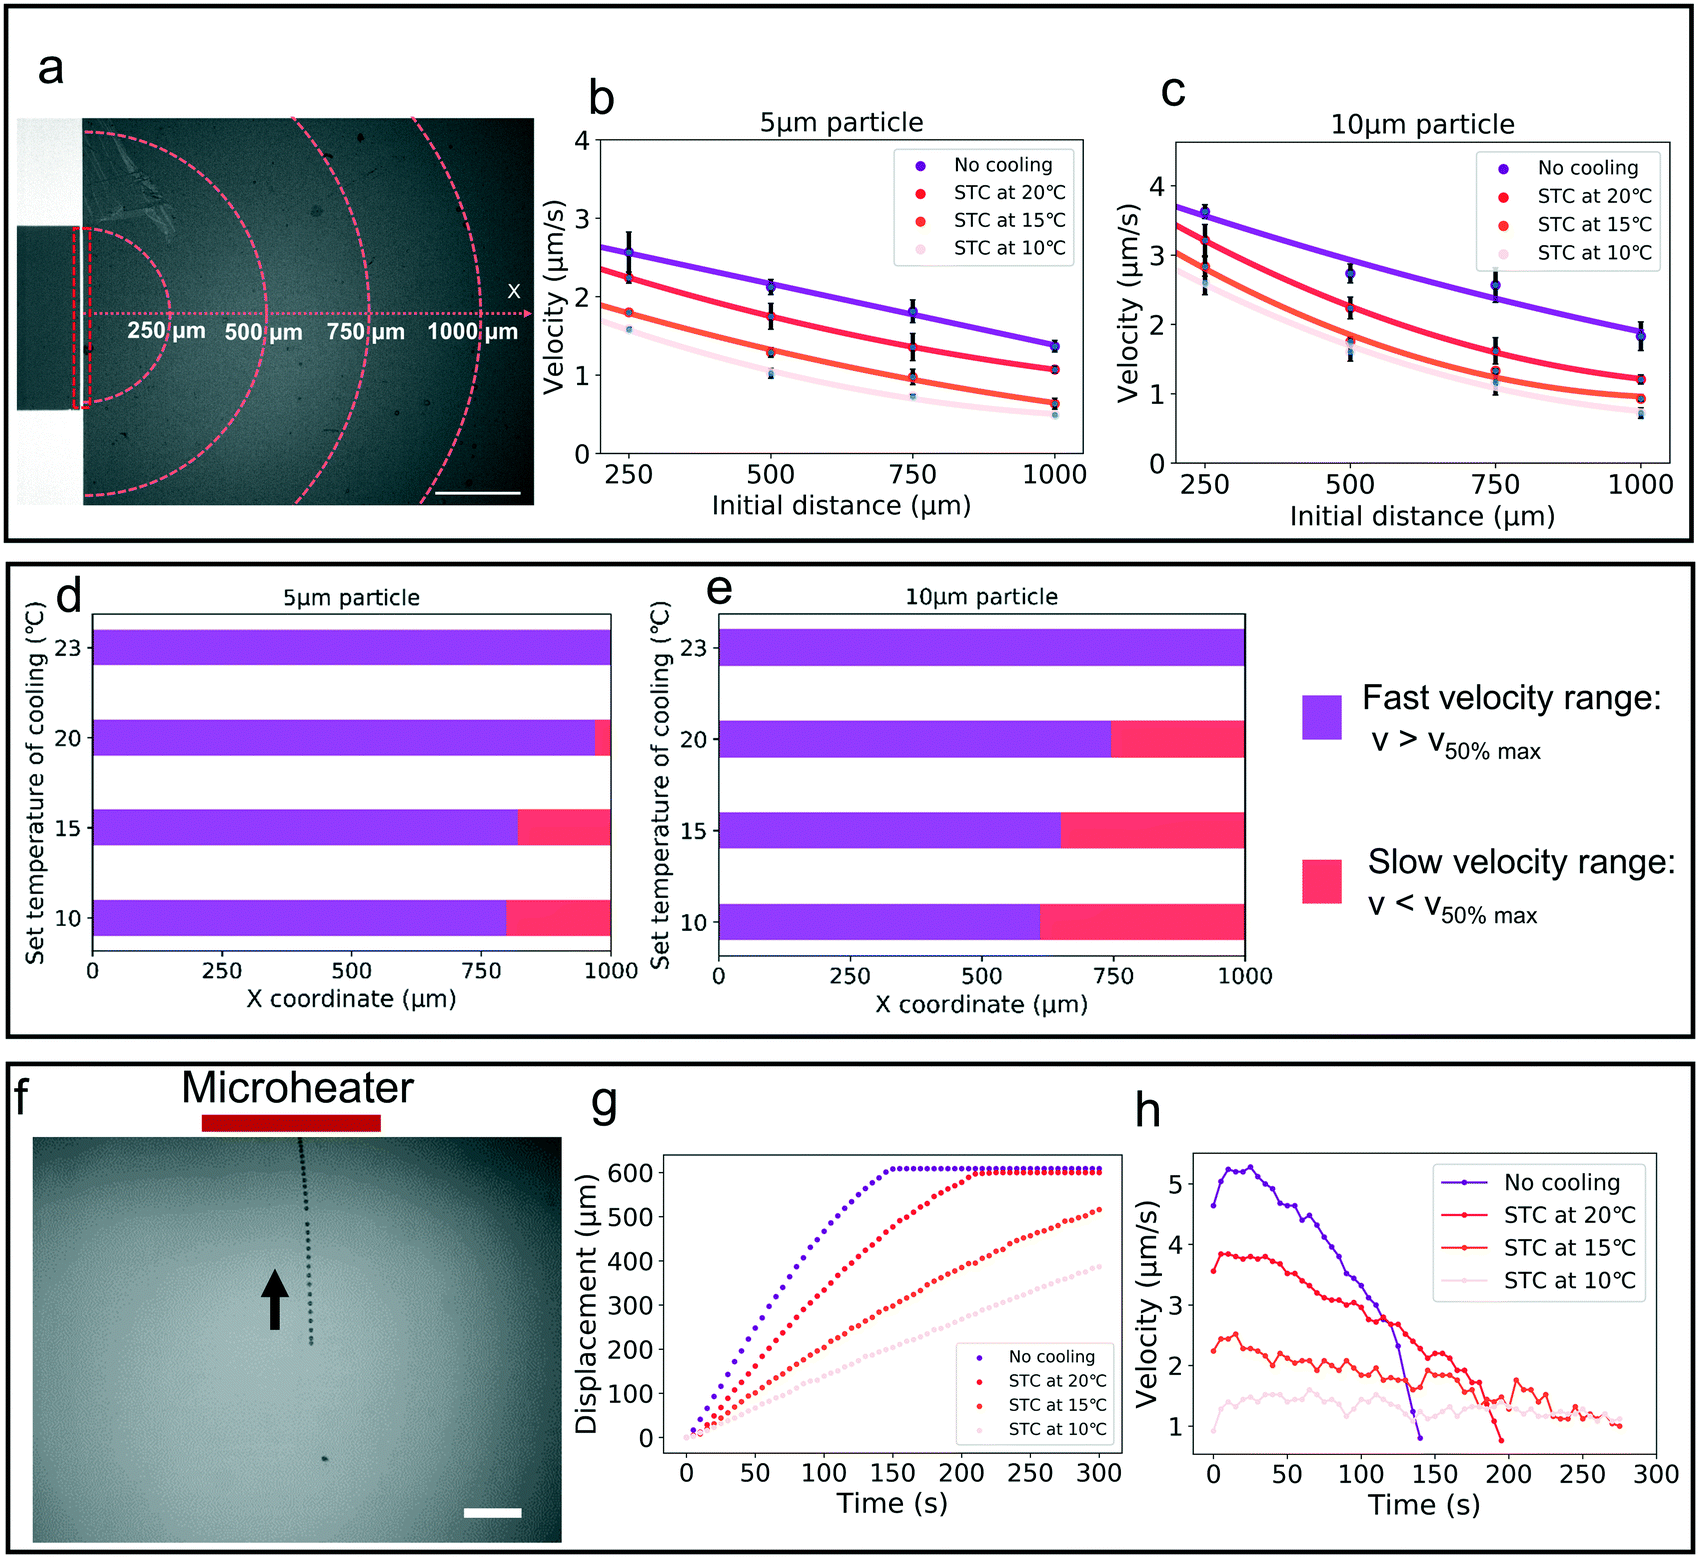
The temperature gradient in the platform was generated by the microheaters, and under this gradient, the particles were transferred and then trapped at the heater source (Fig. S2†). Fig. 4a shows the image for a single microheater and the coordinate system for velocity statistics. The mean velocity for 1 min in different initial positions was analyzed. Fig. 4b and c present the mean velocity for 5 μm and 10 μm particles at different initial places and cooling temperatures. To evaluate the trend for particle velocity, the mean velocity of particles within 250 μm from the center of the microheater was defined as the maximum velocity (vmax). Based on the fitting equation from Fig. 4b and c, two velocity ranges were seen: the fast velocity range (vp > 50% of vmax) and the slow velocity range (vp < 50% of vmax). Fig. 4d and e plot the velocity range at different cooling temperatures; with decreasing cooling temperature, the fast velocity range was focused to the center and the slow velocity range was expanded.
 |
| | Fig. 4 Particle migration and velocity analysis. (a) The structure of a single microheater (red dotted frame) and the coordinate for velocity statistics (gray color, glass material; white color, Au metal). Relationship between velocity and initial distance at different cooling temperatures for (b) 5 μm particles and (c) 10 μm particles (mean ± SD, N = 3). Changes of velocity range under different cooling temperatures for (d) 5 μm particles and (e) 10 μm particles. (f) Stacked images of a single 5 μm particle migration in the thermal field from fixed initial distance of 600 μm (heat power, 0.18 W; voltage amplitude, 3 V; no cooling temperature; sample chamber height, 500 μm). Scale bar, 200 μm. (g) Particle motion at various applied cooling temperatures (experimental results). (h) Velocity curves corresponding to the displacement curves in g (smoothed with a moving-average filter of five data points). | |
Fig. 4f shows the whole process of particle migration in the thermal field from the fixed initial distance of 600 μm. Fig. 4g examines the single 5 μm particle motion under different cooling temperatures in response to the same voltage amplitude (3 V) for a 5 min period. Fig. 4h plots the particle velocity during this process, and it was seen that during the whole process of transferring to the bottom center of the thermal field, the velocity rose first and then fell. And it became slow with decreasing cooling temperature. Since the direction of drag force changed from horizontal to vertical, the particle velocity decreased on becoming close to the heat source.
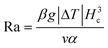
The velocity of different size particles was evaluated in the same experimental environment (initial distance, 600 μm, test time, 1 min). Fig. 5 shows the particle velocity increased with increasing particle size (r/Hc < 1/4). From eqn (6), the particle velocity is dominated by the local fluid velocity. Since the velocity profile is parabolic (Fig. 2), the particle velocity decreases when the centerline of the particle is close to the wall. The relationship between the height of the centerline and the whole fluid velocity is seen in eqn (2). When the ratio (r/Hc) is larger than 1/4, the fluid velocity decreases and then changes its direction. For instance, the velocity of the 90 μm particle was close to zero (Hc: 100 μm) (Fig. 5). Additionally, Fig. 5 also shows that particle velocity increased with the increase of chamber height. In thermal convection, the flow regime can be characterized by the Rayleigh number, Ra. It is estimated as
| |  | (10) |
where
β is the thermal-expansion coefficient,
g is gravity acceleration,
ν is the kinematic viscosity,
Hc is the chamber height, and
α is thermal diffusivity of water. As the chamber height has a positive relationship with Ra, large Ra means that it is easy to produce the thermal convection and there is a high velocity in the fluid.
45 Conversely, when the chamber height is decreased, thermal convection is limited and the transferring velocity falls. Because the higher chamber height has a faster velocity, a chamber of 1000 μm height was used in the following manipulation experiment. Additionally, the thickness of the thin glass sheet (
ht, Fig. S3
†) could also influence the particle velocity by changing the temperature of its surface that contacts the liquid. From
eqn (8), the temperature of the up-side of the thin glass sheet (
Ts) is
when the temperature of the microheater and heat flux
Qh are constant,
Ts decreases with increasing thickness of the thin glass. The low temperature causes the decrease of particle velocity (Fig. S4
†). However, the decreasing temperature offers thermal protection for the object in the fluid, especially for manipulation applications in the biology field.
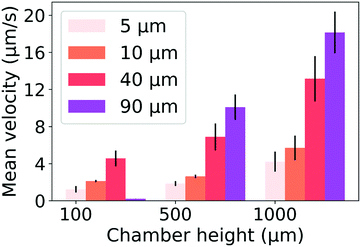 |
| | Fig. 5 Mean velocity of the different size particles and different chamber heights. DC voltage amplitude, 3 V; STC, 15 °C (mean ± SD, N = 3). | |
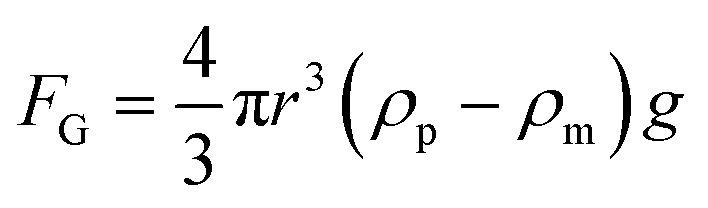
When the particle is transferred at the center of the heat source, a new balance is established. From eqn (7) and Fig. 2, the gravitational force and thermophoretic force decide whether the particle is trapped or transferred with the convection flow. The velocity of the 5 μm particle close to the heat source was around 1 μm s−1. In this process, the drag force calculated by Stokes law (FD = 6πμrvp) was 41.9 fN, which was larger than the gravitational force (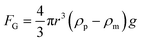 , 32 fN). Under the thermophoretic force (9.9 fN), the 5 μm particle was trapped at the heat source. For these large particles (>10 μm), the gravitational force (FG is proportional to s3) is larger than the drag force (FD is proportional to r), indicating they can be trapped at the center of the heat source even without the thermophoretic force.
Manipulation of a single particle
To demonstrate the performance of single particle manipulation, we fabricated four microheaters and positioned them in a square shape (Fig. 1d). Each electrode independently controlled particle movement along a single direction. Indeed, since the particle in the thermal field moves toward the center of every microheater, the four microheaters build a special coordinate system for the movement (Fig. 6a). Based on this coordinate system, the moving path was pre-designed. A manipulation application of this method is shown in Fig. 6b–d (see also ESI† Movie I), where a 5 μm fluorescent polystyrene particle was driven along a path to write different quadrilateral shapes (kite and trapezoid), and the letter “R” shape. Fig. 6e–g show the same paths for 10 μm particles (see also ESI† Movie II). There were some differences between designed and finished shapes, and that stemmed from the different initial position in the experiments. Because of the special coordinate system, the pre-designed shape depends on the initial position of the particles. This problem can be solved by fabrication of much smaller microheater arrays to increase the manipulation resolution.
 |
| | Fig. 6 Two-dimensional single particle manipulation. (a) The coordinate system for the movement and pre-designed path (turn: turning on the microheaters with corresponding number). (b–d) Manipulation for 5 μm particles in the kite (time step, 2 s), trapezoid (time step, 10 s), and letter “R” (time step, 10 s) shapes. (c–g) Manipulation for 10 μm particles in the kite (time step, 4 s), trapezoid (time step, 4 s), and letter “R” (time step, 10 s) shapes (DC voltage amplitude, 3 V; STC, 15 °C; sample chamber diameter and height, 1 mm and 1000 μm). | |
Manipulation of a single cell
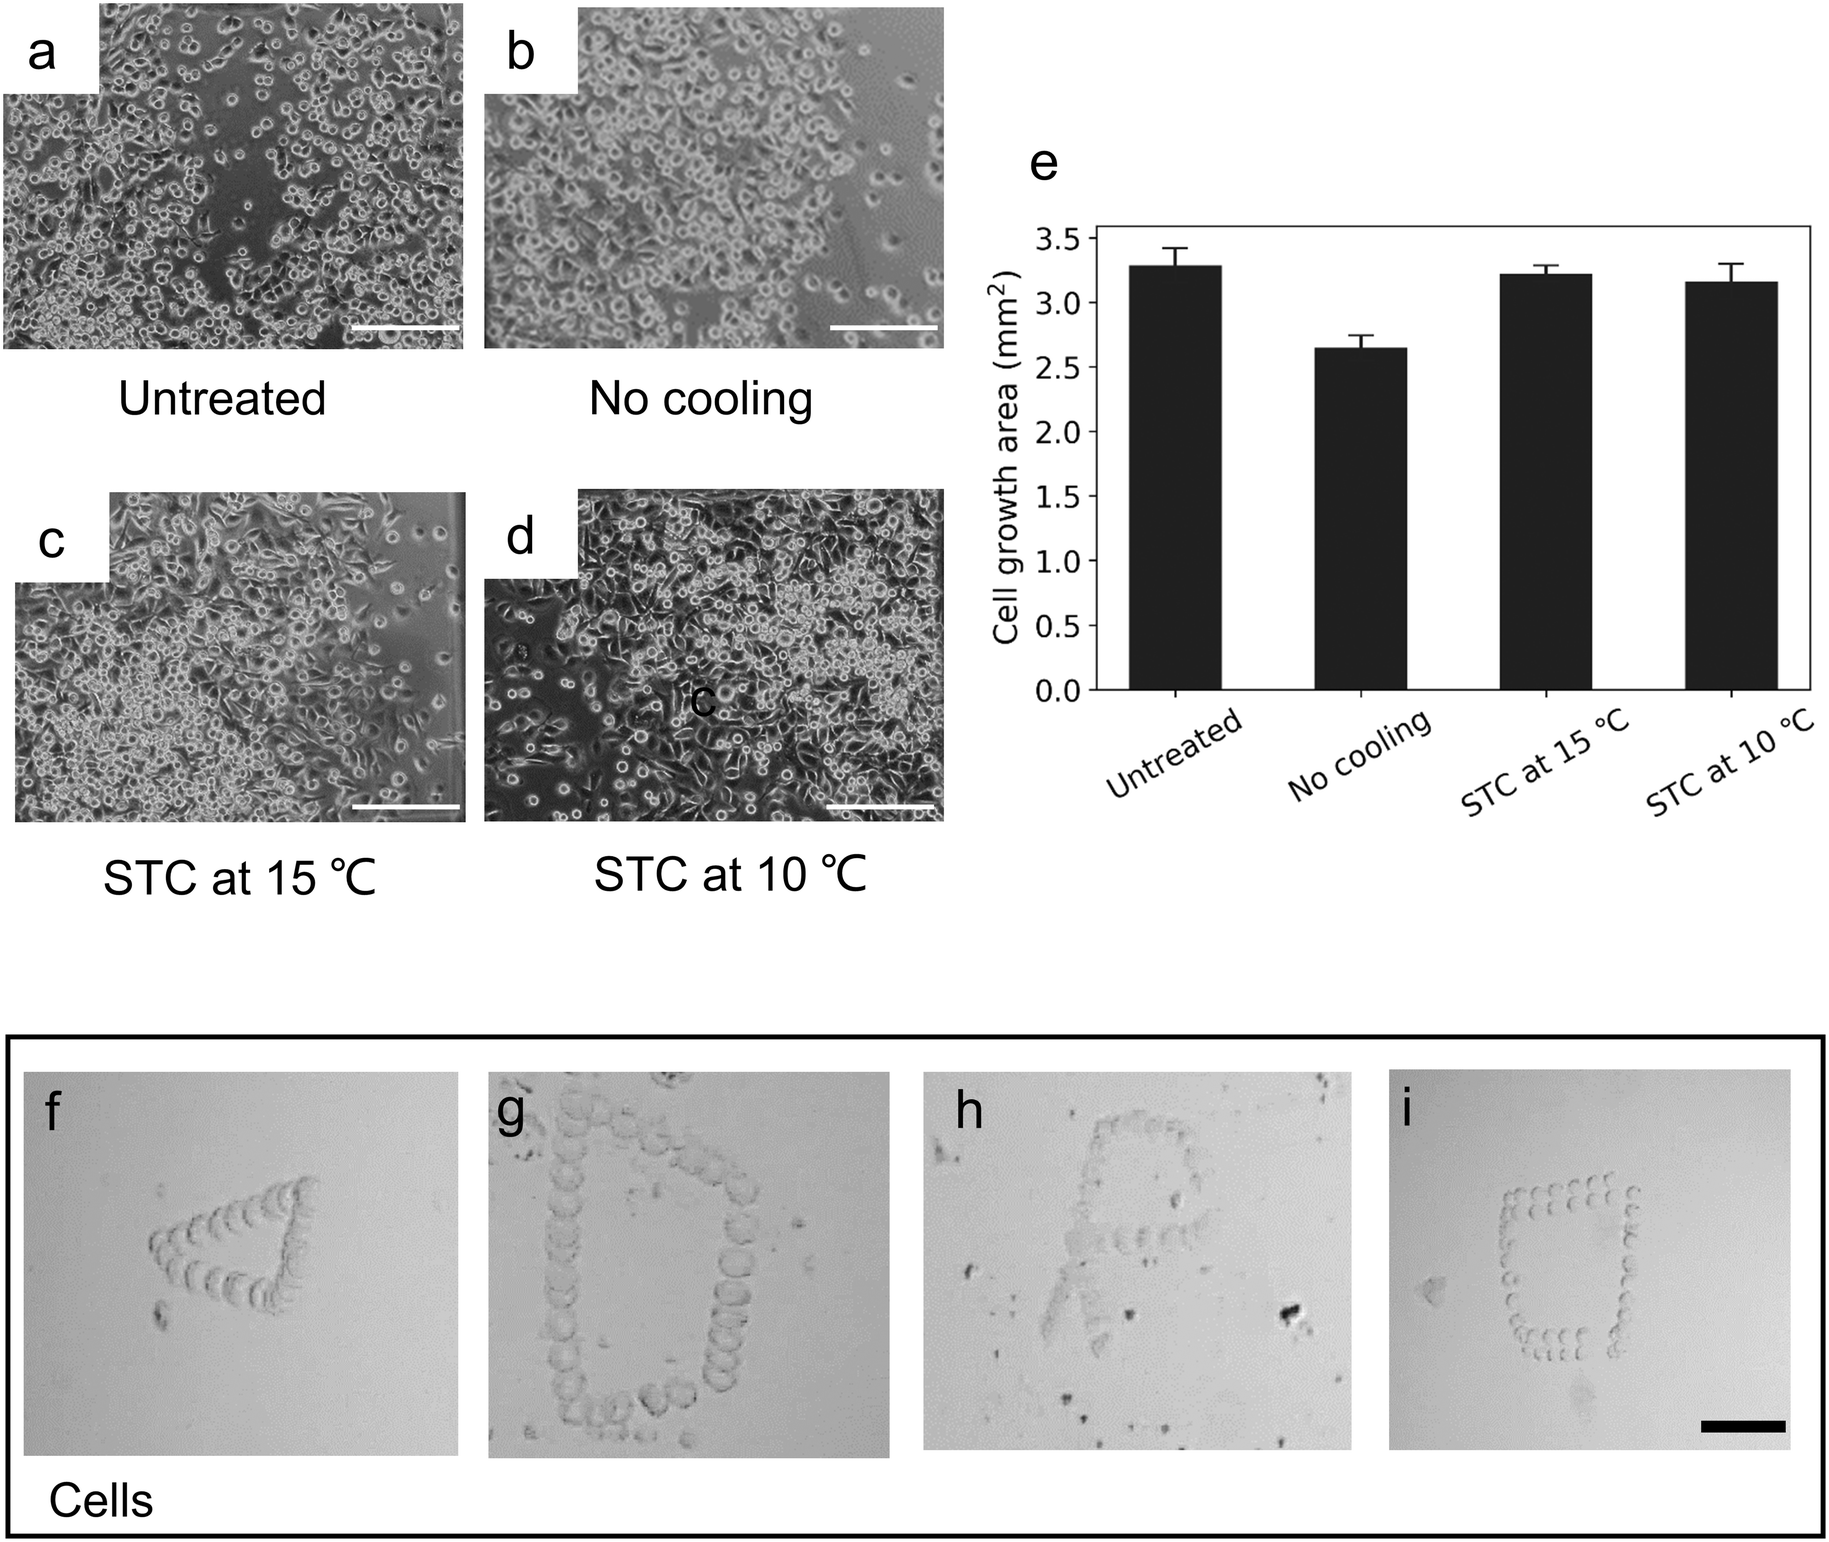
Before validating its capability in bioanalytical applications, the C2C12 cell viability test was performed (Fig. S5 and S6†). Fig. 7a–d show the growth condition of cells that we collected after 5 h of culturing for untreated cells and thermal-treated cell under different area cooling temperature, the initial shape of cells (before being sent to the incubator) is shown in Fig. S7.†Fig. 7e plots the cell growth area after 5 h. The reason that the thermal-treated group with no cooling temperature had a small low cell growth area was due to the influence of thermal diffusion for some part of the cells. And this shows that by decreasing the area cooling temperature, more cells were trapped at the center (Fig. S8†), which also caused large cell growth. As the results in the temperature distribution section showed, decreasing the cooling temperature increased the temperature gradient in the bottom center of the microheater. The main reason for this trend was surface tension variations. Because the chamber for the cell viability test was open (to maintain the cell viability during the thermal manipulation), the high-temperature gradient increased the surface tension variations, which enhanced the convection flow. Using the same coordinate system, we designed different shapes for cell manipulation. Fig. 7f–h display the manipulation of a single C2C12 cell (around 15 μm) to trace the triangular, quadrilateral and “R” letter shapes (see also ESI† Movie III). Fig. 7i shows the manipulation of two adhering cells and both a single cell and adherent cells could be steered on a designed path by using this platform. The mean velocity of the single cell was around 4 μm s−1, which was a little less than the velocity of 10 μm particles in the same height (1000 μm) chamber (Fig. 5). Indeed, under this shear stress flow of eqn (2), as the properties of cells are different from those of polystyrene spheres (the latter can be considered as an ideal rigid body), the elastic deformation and the surface features of cells are able to influence movement in the thermal field. For cells close to the wall, more deformable cells require larger hydrodynamic torques for transfer, causing low flowability.46 On the other hand, when living cells are introduced into a culture chamber, they attach to the chamber surface via integrin receptor-protein binding or electrostatic attraction.47 It has been confirmed that cell adhesion ability increases with temperature (for the range from room temperature to body temperature).48 This thermal manipulation method can be used easily to remove dead cells with no adhesion ability in the cell culture process. Furthermore, the detached cells can be manipulated on the adhesive cell layer, which can be useful for research about cell adhesion assay on endothelial cells in vitro.49
 |
| | Fig. 7 Cell viability test and cell manipulation. The conditions for cell culture after 5 h of proliferation: (a) not treated (positive group), (b–d) different thermal treatment environments. (b) DC voltage amplitude, 2.5 V with no cooling, (c) DC voltage amplitude 2.5 V with STC at 15 °C and (d) at 10 °C. Scale bar, 200 μm. (e) The cell growth area after 5 h of proliferation. (f–h) Manipulation for a single cell in different quadrilateral shapes and letter “R” shape (DC voltage amplitude, 2.5 V; STC, 15 °C; sample chamber diameter and height, 1 mm and 1000 μm). (i) Manipulation for two adhering cells. Scale bar, 150 μm (the manipulating times for each path were 65, 96, 125, and 87 s). | |
To widely apply the optic-free thermal manipulation to biological applications, the biggest obstacles are the manipulation force, temperature control, and device fabrication. Table 1 summarizes these thermal manipulation methods using resistive heaters as to the parameters of temperature, steering range, velocity range, steering ability, and flexibility. Compared to these reported methods, where the cell size for manipulation was less than 5 μm, our developed platform manipulated the others for mammalian cells (>10 μm) and had a large manipulating range (1000 μm). Although Zhang et al.21 developed a thermal manipulation system, which had a fast steering velocity, it was not suitable for accurate manipulating. This is the first utilization of the concept of limiting the thermal diffusion area by cooling temperature to produce enough power to steer a single cell or cells and to maintain the cell viability. In addition, the big novelty of this platform is that it uses the one-time fabricated motherboard and a disposable sample chamber. Therefore, we expect this platform will become an effective and powerful tool for different kinds of biology applications.
Table 1 Thermal manipulation methods using resistive heaters
| Ref. |
T
|
Steering range |
Velocity range |
Geometric track |
Steer objects of various sizesb |
Flexibilityc |
|
T: the temperature around the steering objects.
Various sizes: from 1 to 100 μm.
Flexibility: the sample chamber is not fitted with microheaters. ×: unfeasible. ○: feasible. |
|
19
|
37 °C |
1.5–20 μm |
1.2–2.2 μm s−1 |
× |
× |
× |
|
20
|
35 °C |
<20 μm |
3.3–5.2 μm s−1 |
× |
× |
× |
|
21
|
77 °C |
N.A |
40–120 μm s−1 |
× |
× |
× |
| This paper |
10–37 °C |
10–1000 μm |
0.5–12 μm s−1 |
○ |
○ |
○ |
Conclusions
This work presented a manipulation platform that combines microheaters and an area cooling system. It is able to steer sedimentary particles and cells and greatly limit the thermal diffusion. The ability of area cooling to improve control over the temperature field was characterized by using fluorescence material rhodamine B. Thermal manipulation to control the motion of objects in 1D (using a single microheater) was demonstrated. Manipulation of designed paths for particles was achieved by using four microheaters. Finally, the manipulation of biological cells was achieved and the method had less effect on cell viability. This manipulation platform offers four desirable features. (1) Operability: the platform is able to steer objects with a variety of size scales and has a larger steering area. (2) Tunable temperature region: the platform is able to limit the thermal diffusion. (3) Biocompatibility: the platform is able to manipulate live cells for different purposes including trapping, transferring, and assembling. (4) Flexibility: the platform has an exchangeable sample chamber that provides disposable use.
Author contributions
Conceptualization: Y. S., Y, Y., Y. T. methodology: Y. S. software: Y. S. validation: formal analysis: Y. S., Y, Y., Y. T. investigation: Y. S., Y, A., A. S. resources: Y. S., Y, Y., N. T, Y. T. data curation: Y. S. writing original draft: Y. S. writing review & editing: Y. S., Y, Y., Y. T. visualization: Y. S. supervision: Y, Y., Y. T. funding acquisition: Y, Y., Y. T.
Conflicts of interest
There are no conflicts to declare.
Acknowledgements
We gratefully acknowledge support received from Grant-in-Aid for Scientific Research (B) (20H02596) from the Japan Society for the Promotion of Science (JSPS), TEPCO memorial Fund, the Amada Foundation, Japan.
References
- A. E. Saliba, A. J. Westermann, S. A. Gorski and J. Vogel, Nucleic Acids Res., 2014, 42, 8845–8860 CrossRef CAS.
- P. L. Johansen, F. Fenaroli, L. Evensen, G. Griffiths and G. Koster, Nat. Commun., 2016, 7, 1–8 Search PubMed.
- P. J. Pauzauskie, A. Radenovic, E. Trepagnier, H. Shroff, P. Yang and J. Liphardt, Nat. Mater., 2006, 5, 97–101 CrossRef CAS.
- T. Zhang, Z. Y. Hong, S. Y. Tang, W. Li, D. W. Inglis, Y. Hosokawa, Y. Yalikun and M. Li, Lab Chip, 2019, 20, 35–53 RSC.
- Y. Shen, Y. Yalikun and Y. Tanaka, Sens. Actuators, B, 2018, 282, 268–281 CrossRef.
- B. Y. Yu, C. Elbuken, C. Shen, J. P. Huissoon and C. L. Ren, Sci. Rep., 2018, 8, 1–12 CrossRef.
- L. Ren, N. Nama, J. M. McNeill, F. Soto, Z. Yan, W. Liu, W. Wang, J. Wang and T. E. Mallouk, Sci. Adv., 2019, 5, eaax3084 CrossRef CAS.
- D. G. Grier, Nature, 2003, 424, 810–816 CrossRef CAS.
- K. C. Wang, A. Kumar, S. J. Williams, N. G. Green, K. C. Kim and H. S. Chuang, Lab Chip, 2014, 14, 3958–3967 RSC.
- A. Fakhfouri, C. Devendran, T. Albrecht, D. J. Collins, A. Winkler, H. Schmidt and A. Neild, Lab Chip, 2018, 18, 2214–2224 RSC.
- A. Ozcelik, J. Rufo, F. Guo, Y. Gu, P. Li, J. Lata and T. J. Huang, Nat. Methods, 2018, 15, 1021–1028 CrossRef CAS.
- X. Ding, S. C. S. Lin, B. Kiraly, H. Yue, S. Li, I. K. Chiang, J. Shi, S. J. Benkovic and T. J. Huang, Proc. Natl. Acad. Sci. U. S. A., 2012, 109, 11105–11109 CrossRef CAS.
- A. Bussonnière, Y. Miron, M. Baudoin, O. Bou Matar, M. Grandbois, P. Charette and A. Renaudin, Lab Chip, 2014, 14, 3556–3563 RSC.
- Y. Kurashina, C. Imashiro, M. Hirano, T. Kuribara, K. Totani, K. Ohnuma, J. Friend and K. Takemura, Commun. Biol., 2019, 2, 1–11 CrossRef CAS.
- Y. Wu, Y. Ren, Y. Tao, L. Hou and H. Jiang, Anal. Chem., 2016, 88, 11791–11798 CrossRef CAS.
- K. Zhao and D. Li, Sens. Actuators, B, 2017, 250, 274–284 CrossRef CAS.
- L. Huang, P. Zhao and W. Wang, Lab Chip, 2018, 18, 2359–2368 RSC.
- G. Yesiloz, M. S. Boybay and C. L. Ren, Lab Chip, 2015, 15, 4008–4019 RSC.
- H. Cong, J. Chen and H. P. Ho, Sens. Actuators, B, 2018, 264, 224–233 CrossRef CAS.
- J. Chen, H. Cong, F. C. Loo, Z. Kang, M. Tang, H. Zhang, S. Y. Wu, S. K. Kong and H. P. Ho, Sci. Rep., 2016, 6, 1–13 CrossRef CAS.
- K. Zhang, Y. Ren, Y. Tao, X. Deng, W. Liu, T. Jiang and H. Jiang, Anal. Chim. Acta, 2020, 1096, 108–119 CrossRef CAS.
- E. Yakhshi-Tafti, H. J. Cho and R. Kumar, Appl. Phys. Lett., 2010, 96, 10–13 CrossRef.
- J. Chen, J. F. C. Loo, D. Wang, Y. Zhang, S. K. Kong and H. P. Ho, Adv. Opt. Mater., 2019, 1900829, 1–17 Search PubMed.
- J. Zheng, X. Xing, J. Evans and S. He, NPG Asia Mater., 2016, 8, 1–9 Search PubMed.
- J. Quispe, E. Muñoz and E. Vela, Appl. Phys. Lett., 2016, 109, 124102, DOI:10.1063/1.4963159.
- J. S. Donner, G. Baffou, D. McCloskey and R. Quidant, ACS Nano, 2011, 5, 5457–5462 CrossRef CAS.
- P. Rinklin, D. Afanasenkau, S. Wiegand, A. Offenhäusser and B. Wolfrum, Lab Chip, 2015, 15, 237–243 RSC.
- J. Park, J. H. Jung, G. Destgeer, H. Ahmed, K. Park and H. J. Sung, Lab Chip, 2017, 17, 1031–1040 RSC.
- J. Park, J. H. Jung, K. Park, G. Destgeer, H. Ahmed, R. Ahmad and H. J. Sung, Lab Chip, 2018, 18, 422–432 RSC.
-
A. Ostadfar, in Biofluid Mechanics, Elsevier, 2016, pp. 1–60 Search PubMed.
- S. Wiegand, J. Phys.: Condens. Matter, 2004, 16, R357–R379 CrossRef CAS.
- S. Fayolle, T. Bickel and A. Würger, Phys. Rev. E: Stat., Nonlinear, Soft Matter Phys., 2008, 77, 1–8 CrossRef.
- D. Niether and S. Wiegand, J. Phys.: Condens. Matter, 2019, 31, 503003 CrossRef CAS.
- Y. Zhou, C. Yang, Y. C. Lam and X. Huang, Int. J. Heat Mass Transfer, 2016, 101, 1283–1291 CrossRef CAS.
- Z. Y. Guo and Z. X. Li, Int. J. Heat Fluid Flow, 2003, 24, 284–298 CrossRef.
- L. Lin, X. Peng, Z. Mao, X. Wei, C. Xie and Y. Zheng, Lab Chip, 2017, 17, 3061–3070 RSC.
- Y. Yalikun and Y. Tanaka, Micromachines, 2016, 7, 12–14 CrossRef.
- Y. Tanaka, RSC Adv., 2013, 3, 10213–10220 RSC.
- Y. Yalikun, Y. Hosokawa, T. Iino and Y. Tanaka, Lab Chip, 2016, 16, 2427–2433 RSC.
- J. J. Shah, M. Gaitan and J. Geist, Anal. Chem., 2009, 81, 8260–8263 CrossRef CAS.
- C. B. Müller, K. Weiß, A. Loman, J. Enderlein and W. Richtering, Lab Chip, 2009, 9, 1248–1253 RSC.
- D. Ross, M. Gaitan and L. E. Locascio, Anal. Chem., 2001, 73, 4117–4123 CrossRef CAS.
- D. Ren, B. Wang, C. Hu and Z. You, Anal. Methods, 2017, 9, 2621–2632 RSC.
- J. Wang, Y. Wei, S. Zhao, Y. Zhou, W. He, Y. Zhang and W. Deng, PLoS One, 2017, 12, 1–16 Search PubMed.
- P. Oresta and A. Prosperetti, Phys. Rev. E: Stat., Nonlinear, Soft Matter Phys., 2013, 063014, 1–11 Search PubMed.
- M. M. Sharma, H. Chamoun, D. S. H. Sita Rama Sarma and R. S. Schechter, J. Colloid Interface Sci., 1992, 149, 121–134 CrossRef CAS.
- C. M. Cejas, F. Monti, M. Truchet, J. P. Burnouf and P. Tabeling, Phys. Rev. E, 2018, 98, 1–12 CrossRef.
- F. Rico, C. Chu, M. H. Abdulreda, Y. Qin and V. T. Moy, Biophys. J., 2010, 99, 1387–1396 CrossRef CAS.
- A. C. Vion, M. Kheloufi, A. Hammoutene, J. Poisson, J. Lasselin, C. Devue, I. Pic, N. Dupont, J. Busse, K. Stark, J. Lafaurie-Janvore, A. I. Barakat, X. Loyer, M. Souyri, B. Viollet, P. Julia, A. Tedgui, P. Codogno, C. M. Boulanger and P. E. Rautou, Proc. Natl. Acad. Sci. U. S. A., 2017, 114, E8675–E8684 CrossRef CAS.
Footnote |
| † Electronic supplementary information (ESI) available. See DOI: 10.1039/d0lc00523a |
|
| This journal is © The Royal Society of Chemistry 2020 |
Click here to see how this site uses Cookies. View our privacy policy here. 
 Open Access Article
 This Open Access Article is licensed under a
  ab,
Yaxiaer
Yalikun
*bc,
Yusufu
Aishan
ab,
Nobuyuki
Tanaka
ab,
Yaxiaer
Yalikun
*bc,
Yusufu
Aishan
ab,
Nobuyuki
Tanaka

 , and the velocity profile close to the wall is parabolic. Based on the symmetry of thermal convection, the whole velocity profile along the height direction is a pair of opposite parabolic shapes (Fig. 2). Under the Hagen–Poiseuille law, the velocity profile is30
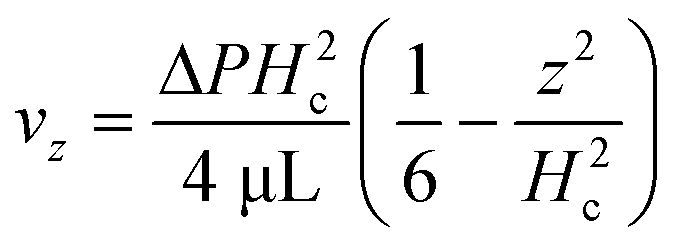


 , 32 fN). Under the thermophoretic force (9.9 fN), the 5 μm particle was trapped at the heat source. For these large particles (>10 μm), the gravitational force (FG is proportional to s3) is larger than the drag force (FD is proportional to r), indicating they can be trapped at the center of the heat source even without the thermophoretic force.