Centrifugal microfluidic device for the high-throughput synthesis of Pd@AuPt core–shell nanoparticles to evaluate the performance of hydrogen peroxide generation†
Hau Van
Nguyen‡
a,
Ki Yoon
Kim‡
a,
Hyobin
Nam
b,
Seung Yong
Lee
b,
Taekyung
Yu
 *a and
Tae Seok
Seo
 *b
*b
aDepartment of Chemical Engineering, Kyung Hee University, Yongin, 17104, South Korea. E-mail: TKYu@khu.ac.kr
bMaterials Architecturing Research Center, Korea Institute of Science and Technology, Seoul 02792, Republic of Korea. E-mail: seots@khu.ac.kr
First published on 13th July 2020
Abstract
We propose a novel high-throughput screening platform using a centrifugal microfluidic device for producing combinatorial tri-metallic catalysts. The centrifugal device was designed to perform 60 reactions under different conditions on a single device. As a model to search for an optimal tri-metallic catalyst, we synthesized a variety of Pd@AuPt nanoparticles (NPs), in which Pd nanocubes served as a core, and Au and Pt atoms formed a shell. The centrifugal microfluidic device was etched on the top and bottom sides, in which two zigzag-shaped microchannels were patterned on the top side, and 60 reaction chambers were fabricated on the bottom side. Through the sophisticated zigzag-shaped microchannels, Pt2+ ion and Pd nanocube solutions were injected into the channel in one shot, and the centrifugal force equally and automatically divided the injected solutions into 60 aliquots during the rotation. By controlling the sophisticated channel dimensions and designing the passive valve structure, the Pt2+ ion, Pd nanocube, and Au3+ solutions were loaded into the reaction chamber in sequential order depending on the programmed rotational direction and speed. Therefore, the ratio of Au to Pt to synthesize Pd@AuPt core–shell NPs was changed from 0.028![[thin space (1/6-em)]](https://www.rsc.org/images/entities/char_2009.gif) :
:![[thin space (1/6-em)]](https://www.rsc.org/images/entities/char_2009.gif) 1 to 12
1 to 12![[thin space (1/6-em)]](https://www.rsc.org/images/entities/char_2009.gif) :
:![[thin space (1/6-em)]](https://www.rsc.org/images/entities/char_2009.gif) 1, and accordingly, the resultant 60 types of Pd@AuPt catalysts presented with different ratios of metal atom compositions. Then, we screened the catalytic activity of the Pd@AuPt NPs for generating H2O2 according to the degree of coating of Au and Pt, and the Pd@AuPt catalyst with the Au/Pt ratio at 0.5 turned out to be the most effective.
1, and accordingly, the resultant 60 types of Pd@AuPt catalysts presented with different ratios of metal atom compositions. Then, we screened the catalytic activity of the Pd@AuPt NPs for generating H2O2 according to the degree of coating of Au and Pt, and the Pd@AuPt catalyst with the Au/Pt ratio at 0.5 turned out to be the most effective.
Introduction
Noble metal nanoparticles (NPs) have been applied in a variety of catalytic applications such as carbon dioxide reduction, water splitting, formic acid oxidation, and direct synthesis of hydrogen peroxide due to their specific electronic structures and large surface-to-volume ratios.1–3 In particular, bi- and tri-metallic NPs show superb performance in terms of catalytic activity in some cases owing to the synergistic effect of the metal atoms.4,5 Such multi-metallic catalysts form alloys, core–shell structures, and bimodal architectures, where the catalytic properties can be enhanced by modulating their electronic structures.6–9 Therefore, the tunability of the compositions and the morphologies of the metal atoms are crucial, as an optimal catalyst is desirable.10–13 When the catalysts consist of two or three types of metal atoms, the combinatorial number to produce the multi-metallic catalysts is somewhat limitless, considering the number of elements in the periodic table, the molar ratios between the two or three metals, and other variables such as synthetic temperature and pressure. To address this issue, a high-throughput screening platform is desirable that allows the synthesis of various types of catalysts simultaneously.14,15 Traditional optimization platforms are based on a batch scale reactor such as Erlenmeyer or round-bottomed flasks. These liter- and milli-liter scaled reactors are not adequate for automatic and high-throughput NP synthesis due to the large volume consumption of reagents, labor-intensiveness, and time-consuming processes. In addition, the large size of the reactor inevitably cannot prevent non-uniform mixing and thermal dynamics due to the dependence on manual operation, resulting in irreproducible data.An alternative way of overcoming the limitations of the current methodology is to reduce the volume scale to micro- to nano-liters using microfluidic technology. Microfluidic techniques can provide precise fluidic control, low liquid consumption, excellent thermal transfer, high mixing efficiency, automation, and high-throughput capability.16,17 Therefore, in order to obtain optimal compositions and morphologies of the multi-metallic catalysts, the use of microfluidic devices would be ideal. The most widely employed microfluidic device is the droplet generator chip. For example, a droplet generator chip with a stepwise concentration gradient has been used to synthesize quantum dots,18 Au/Ag NPs,19 and supramolecular NPs with distinct chemical compositions.20 Santana et al. reported a simple droplet reactor to control the shell thickness of Au@Pd nanostructures via adjusting the flow rates of reagents within the droplet microreactor.21 Gu et al. presented a microfluidic droplet generator in which a high electrical field was used for subsequent addition of the seed, growth, and control solution in the microdroplets.22 Niu et al. introduced an automatic droplet reactor with the installation of a porous PTFE separator to isolate the produced Pd NPs from the oil phase.23
However, the experimental set-up of the droplet microfluidic device requires external pumping systems, complex tubing connection, valve units, and advanced microfabrication protocols. On the other hand, centrifugal microfluidics have the unique advantages of a simple system without an external pump and tubing, facile rotational operation adequate for non-experts, and full automatic processes for mixing, aliquoting, valving on a single device regulated using a conventional rotary motor.24,25 Thus, this centrifugal microdevice has been extensively utilized for environmental pollutant monitoring,26 and bio-diagnostic fields,27 but only a few reports regarding the high-throughput synthesis of NPs have been published.28
In this study, we developed an advanced centrifugal microfluidic device for the high-throughput synthesis of Pd@AuPt core–shell catalysts in a portable rotary system. The device was designed with 60 reaction chambers and three reagent loading channels, so that tri-metallic catalysts can be simultaneously synthesized on a single chip via a simple rotational operation. Synthetic processes of the sample injection and the aliquoting into 60 reactors were automatically completed via programmed rotation in 10 min. By changing the concentration of the Au3+ ions, the molar ratio between Au and Pt was tuned from 0.028![[thin space (1/6-em)]](https://www.rsc.org/images/entities/char_2009.gif) :
:![[thin space (1/6-em)]](https://www.rsc.org/images/entities/char_2009.gif) 1 to 12
1 to 12![[thin space (1/6-em)]](https://www.rsc.org/images/entities/char_2009.gif) :
:![[thin space (1/6-em)]](https://www.rsc.org/images/entities/char_2009.gif) 1, producing 60 different kinds of Pd@AuPt core–shell catalysts in a high-throughput manner. In addition, we investigated the catalytic activities of Pd@AuPt NPs for H2O2 generation in a fast-screening platform, so the optimal compositions of the Pd@AuPt catalysts could be screened with high efficiency.
1, producing 60 different kinds of Pd@AuPt core–shell catalysts in a high-throughput manner. In addition, we investigated the catalytic activities of Pd@AuPt NPs for H2O2 generation in a fast-screening platform, so the optimal compositions of the Pd@AuPt catalysts could be screened with high efficiency.
Materials and methods
Materials
Sodium tetrapalladinate (Na2PdCl4, 98%), potassium tetrachloroplatinate (K2PtCl4, 99%), chloroauric acid (HAuCl4, 99.995%), L-ascorbic acid, polyvinylpyrrolidone (PVP, MW = 55![[thin space (1/6-em)]](https://www.rsc.org/images/entities/char_2009.gif) 000), and potassium bromide (KBr, 99%) were purchased from Sigma-Aldrich and were used without further purification. 3 mm-thick PMMA sheets were ordered from Acrytal (Korea), and PSA films were obtained from HJ-Bioanalytik GmbH (Germany).
000), and potassium bromide (KBr, 99%) were purchased from Sigma-Aldrich and were used without further purification. 3 mm-thick PMMA sheets were ordered from Acrytal (Korea), and PSA films were obtained from HJ-Bioanalytik GmbH (Germany).
Fabrication of the centrifugal microfluidic device
The proposed device was designed using Cut2D software (Vectric, UK). A computer numerical controlled (CNC) machine (Tinyrobo, Korea) was used to fabricate the micropattern on a PMMA sheet. The top and the bottom of the PMMA sheet was etched with the designated chambers and microchannels. The fabricated device was then cleaned in a sonicator with a surfactant before washing with water. Finally, two PSA films were used to seal the top and the bottom surfaces of the PMMA device in order to close the etched chambers and channels. Thus, the microdevice consists of three layers from top to bottom: a PSA film, a double-side etched PMMA layer, and a PSA film.Synthesis of Pd nanocubes
Pd nanocubes were synthesized using a previously reported method.29 37 mg of PVP, 300 mg of KBr, and 50 mg of L-ascorbic acid were dissolved in 8 mL of deionized water. After heating at 80 °C for 20 min, 3 mL of an aqueous solution containing 57 mg of Na2PdCl4 was added and the resulting solution was heated at 80 °C for 3 h. After the reaction, 0.5 mL of an aqueous L-ascorbic acid solution (0.832 M) was added and cooled down to room temperature.On-chip high-throughput synthesis of tri-metallic Pd@AuPt core–shell catalysts
To synthesize Pd@AuPt core–shell NPs, we prepared three solutions, namely, solution A, solution B, and solution C. Solution A was an aqueous suspension containing Pd nanocubes and L-ascorbic acid as mentioned above, solutions B and C were aqueous solutions containing K2PtCl4 and HAuCl4, respectively. The concentration of Pt in solution B was kept at 1.02 × 10⁻³ M. In the case of solution C, a total of 60 different Au concentrations from 28 × 10−3 to 0.0215 M were prepared, respectively. First, volumes of 10 μL of the 60 different concentrations of the HAuCl4 ion solution were individually injected into the control reservoirs. Second, the Pd nanocube solution was injected into the inner zigzag microchannel and the core reservoirs. The injected solution was equally divided into 60 aliquots with a volume of 16 μL. Finally, the K2PtCl4 solution was injected into the outer zigzag microchannel as well as the shell reservoirs, which were divided into 60 aliquots with a volume of 10 μL. After loading the three solutions into the device, the centrifugal microdevice was installed on the rotary equipment with a speed and time controller. The three solutions were aliquoted and introduced into the reaction chamber via a spinning program. The Pd core solution and the Pt2+ solution were first released into the reaction chamber at a speed of −2000 rpm for 30 s. The Au3+ solution was released later into the reaction chamber at a speed of +4000 rpm for 20 s. The device was then kept in a shaking incubator (Sejong Scientific, Korea) at 60 °C at 200 rpm. After 1 h of reaction time, the synthesized catalysts were recovered from the air vent hole in the reactor via pipette and the products were characterized.Characterization of the Pd@AuPt NPs
Transmission electron microscopy (TEM) and high-resolution TEM (HRTEM) images were obtained using a JEM-2100F microscope operated at 200 kV. High-angle annular dark field scanning TEM (HAADF-STEM), scanning transmission electron microscopy (STEM), and energy-dispersive X-ray spectroscopy (EDS) images were taken using a FEI Talos F200X (Super-X EDS) electron microscope. The elemental compositions of Pd, Au, and Pt in the nanoparticles were determined using an inductively coupled plasma mass spectrometry (ICP-MS, Agilent 7500cx).Measurement of the catalytic performance for the direct synthesis of H2O2
The direct synthesis of H2O2 was performed in a 24 well-plate of a fast-screening platform (Fig. S4†). The reaction medium (2 mL) was composed of ethanol and water (1![[thin space (1/6-em)]](https://www.rsc.org/images/entities/char_2009.gif) :
:![[thin space (1/6-em)]](https://www.rsc.org/images/entities/char_2009.gif) 4 ethanol
4 ethanol![[thin space (1/6-em)]](https://www.rsc.org/images/entities/char_2009.gif) :
:![[thin space (1/6-em)]](https://www.rsc.org/images/entities/char_2009.gif) water volume ratio) with 0.02 M phosphoric acid (H3PO4) and 0.9 mM sodium bromide (NaBr). The amount of Pd@AuPt NPs used for each reaction was 0.05 mg.30 The H2/Ar (H2
water volume ratio) with 0.02 M phosphoric acid (H3PO4) and 0.9 mM sodium bromide (NaBr). The amount of Pd@AuPt NPs used for each reaction was 0.05 mg.30 The H2/Ar (H2![[thin space (1/6-em)]](https://www.rsc.org/images/entities/char_2009.gif) :
:![[thin space (1/6-em)]](https://www.rsc.org/images/entities/char_2009.gif) Ar volume ratio = 4
Ar volume ratio = 4![[thin space (1/6-em)]](https://www.rsc.org/images/entities/char_2009.gif) :
:![[thin space (1/6-em)]](https://www.rsc.org/images/entities/char_2009.gif) 94) gas was injected at a flow rate of 50 mL min−1, and the O2 gas flow was 20 mL min−1 for each well. The total volumetric flow rate of the reactant gas stream was 70 mL min−1 (H2
94) gas was injected at a flow rate of 50 mL min−1, and the O2 gas flow was 20 mL min−1 for each well. The total volumetric flow rate of the reactant gas stream was 70 mL min−1 (H2![[thin space (1/6-em)]](https://www.rsc.org/images/entities/char_2009.gif) :
:![[thin space (1/6-em)]](https://www.rsc.org/images/entities/char_2009.gif) O2 volumetric ratio = 1
O2 volumetric ratio = 1![[thin space (1/6-em)]](https://www.rsc.org/images/entities/char_2009.gif) :
:![[thin space (1/6-em)]](https://www.rsc.org/images/entities/char_2009.gif) 10). The H2O2 synthesis reaction was carried out at 27 °C under 1 atm pressure for 1 h. After the reaction, the concentration of hydrogen peroxide was calculated using the iodometric titration method as follows.31 0.1 mL of the reaction medium and 2.3 mL of water were mixed in a cuvette. 0.3 mL of a 2,9-dimethyl-1,10-phenanthroline (DMP) solution (48 mM), 0.3 mL of a copper(II) sulfate solution (0.01 M), and 0.3 mL of a phosphate buffer (pH 7.0) solution were then added to the cuvette and were mixed. The blank solution was prepared in the same manner except that water was added instead of the reaction medium. The absorbance of the catalyst solution and the blank solution was measured and compared at 454 nm, respectively.
10). The H2O2 synthesis reaction was carried out at 27 °C under 1 atm pressure for 1 h. After the reaction, the concentration of hydrogen peroxide was calculated using the iodometric titration method as follows.31 0.1 mL of the reaction medium and 2.3 mL of water were mixed in a cuvette. 0.3 mL of a 2,9-dimethyl-1,10-phenanthroline (DMP) solution (48 mM), 0.3 mL of a copper(II) sulfate solution (0.01 M), and 0.3 mL of a phosphate buffer (pH 7.0) solution were then added to the cuvette and were mixed. The blank solution was prepared in the same manner except that water was added instead of the reaction medium. The absorbance of the catalyst solution and the blank solution was measured and compared at 454 nm, respectively.
Results and discussion
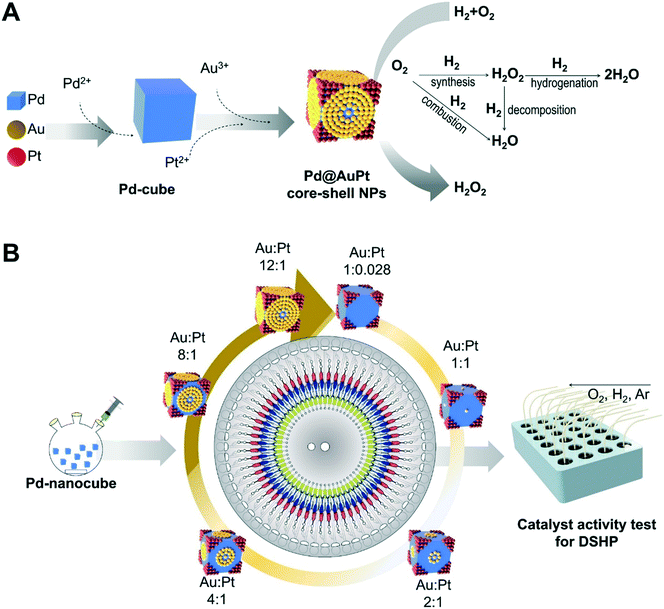
An overall schematic for producing the Pd@AuPt core–shell NPs is shown in Fig. 1A. As a proof-of-concept, we chose the synthesis of the Pd@AuPt catalysts, which are composed of Pd, Au, and Pt. In the first step, the Pd2+ was reduced to produce the Pd-cube, which serves as the core. Then, the Au3+ and Pt2+ were deposited on the surface of the Pd-cube, forming a shell. The resultant Pd@AuPt core–shell catalysts were evaluated for H2O2 generation (Fig. 1A). The centrifugal microdevice was designed to automatically perform 60 parallel reactions to synthesize Pd@AuPt catalysts with different concentrations of Au3+ in a high-throughput manner (Fig. 1B). While the concentration of the Pd-cube and Pt2+ was fixed, the concentration of Au3+ was varied, changing the molar ratio of Au and Pt from 0.028![[thin space (1/6-em)]](https://www.rsc.org/images/entities/char_2009.gif) :
:![[thin space (1/6-em)]](https://www.rsc.org/images/entities/char_2009.gif) 1 to 12
1 to 12![[thin space (1/6-em)]](https://www.rsc.org/images/entities/char_2009.gif) :
:![[thin space (1/6-em)]](https://www.rsc.org/images/entities/char_2009.gif) 1. The performance of the resultant Pd@AuPt catalytic activity for the generation of H2O2 was rapidly screened in a micro-reactor system, so the optimal Pd@AuPt catalysts were able to be discovered.
1. The performance of the resultant Pd@AuPt catalytic activity for the generation of H2O2 was rapidly screened in a micro-reactor system, so the optimal Pd@AuPt catalysts were able to be discovered.
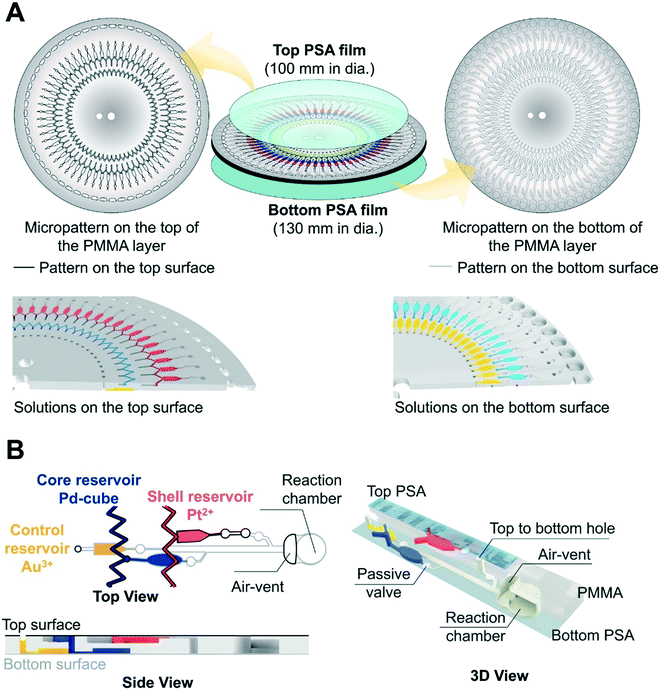
The micropatterned structure of the three layer (a PSA film-a PMMA layer-a PSA film) disc is shown in Fig. 2A. In the radial direction, there are 60 inlet holes for loading the Au3+ solution with different concentrations, the first zigzag microchannel for loading the Pd-cube solution, the second zigzag microchannel for loading the Pt2+ solution, and the 60 reaction chambers. The control reservoir (10 μL volume) containing the Au3+ solution and the core reservoir (16 μL volume) containing the Pd-cube solution were patterned on the bottom, and the shell reservoir (10 μL volume) for retaining the Pt2+ solution was fabricated on the top (Fig. 2A). All the reservoirs were connected to the reaction chambers via passive valves and the microchannels (Fig. 2B). The dimensions of all the microchannels connecting from the reservoirs to the passive valves were 0.2 mm [width] × 0.2 mm [depth]. The distance of each reservoir from the spindle axis was different (Fig. S1†), so a different centrifugal force was required to discharge each solution.
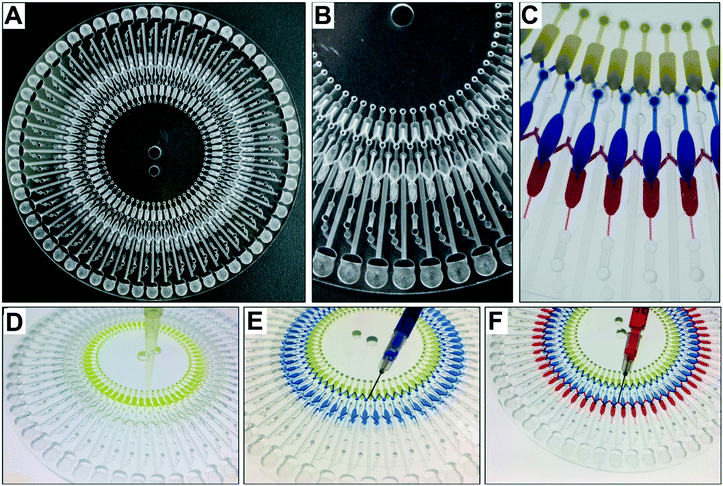
Fig. 3 shows digital images of the centrifugal microdevice. Fig. 3A shows the overall chip image and Fig. 3B displays the zoomed-in area. To demonstrate the sample loading and aliquoting operation on the device, we noted the colour of the Au3+ solution, the Pd-cube solution, and the Pt2+ solution as yellow, blue and red (Fig. 3C), respectively. In the loading step, the Au3+ solution was injected individually into the 60 holes using a pipette (Fig. 3D), which took 20 min. The other two solutions were injected using a syringe to fill the zigzag channels. Fig. 3E shows that when the Pd-cube solution was introduced into any hole, the solution was gradually filled in the channel as well as the core reservoirs on the bottom with one shot. The injection time was only 3 min. In a similar way, the Pt2+ solution (red color) was introduced into one hole and filled in the outer zigzag microchannel continuously on the top side (Fig. 3F). Since the capillary pressure (0.9 kPa) exerted sideward through the neighboring zigzag channel was less than that of the passive valve (3.4 kPa) which was positioned outward, the injected solution moved side-by-side to occupy the zigzag channel and the reservoirs. The capillary pressure of the rectangular microchannel was calculated using the following equation.32
The capillary pressure of the passive valve (Cp) was calculated as follows.33
Then, the injected solution was automatically divided into 60 aliquots to be loaded into the 60 reaction chambers. To discharge the filled solution into the reactors, the centrifugal force should be greater than the capillary pressure derived from the microchannel and the passive valve. In addition, the centrifugal force is exerted differently depending on the position from the axis. Therefore, we can orderly and automatically control the discharge of each solution into the reactor at different RPM. The starting RPM, at which the solution was ejected into the reactor, can be calculated using the following equation:32,33
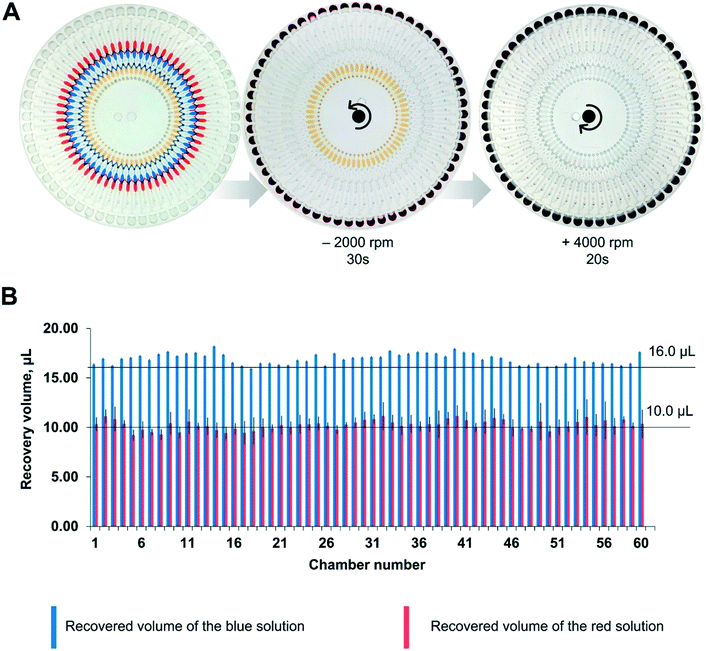
According to the equation, the starting RPM for the Pt2+ solution was 850 rpm, and that for the Pd-cube solution was 900 rpm in a counter-clockwise direction. To avoid any residue of the solution being left in the passive valves during the rotation, we set the speed at −2000 rpm to ensure the complete release of both solutions simultaneously. For ejecting the Au3+ solution, the open RPM was calculated as 1125 rpm in a clockwise direction. However, the reservoir of the Au3+ solution was introduced with an air plug in the injection hole due to the occupancy of the pipette tip during manual pipetting (Fig. S1†), necessitating the use of a much higher centrifugal force. Experimentally, we evaluated the starting RPM for the Au3+ solution, which was +4000 rpm. Fig. 4A and Video S1† show the sequential emission of the three solutions via a sophisticated spinning program in 1 min. Through this aliquoting process, the introduced solutions were equally divided into 60 aliquots and gathered in the reactor. To evaluate the aliquoting performance, we recovered the red and blue solutions from the reactor by punctuating the PSA film and measuring the volume. The volume of the red solution was theoretically 10 μL and the measured volume was 10.24 ± 0.48 μL (3.17% standard deviation). The volume of the blue solution should be 16 μL, and the measured value was 16.91 ± 0.54 μL (4.69% standard deviation). Thus, superb aliquoting performance of the three solutions was executed with high accuracy and reproducibility, remarkably reducing the tedious manual handling and the operation time for high-throughput screening.
In order to test the synthetic capability of the tri-metallic catalysts on the proposed centrifugal microdevice, we synthesized Pd@AuPt core–shell NPs under 60 different concentrations of Au3+ and evaluated the performance for the reaction of direct synthesis hydrogen peroxide (DSHP). By mixing an aqueous suspension containing Pd nanocubes and L-ascorbic acid with the Pt precursor and the Au ion solution in a consecutive order as described above, we obtained core–shell NPs, in which the Pd forms a core and the bimetallic Au and Pt constitutes a shell. On the proposed centrifugal microdevice, the concentration of Au constituting the bimetallic shell was adjusted to 60 different measurements, while keeping the same concentration of the Pd nanocubes and the Pt precursor solution. So, the ratio of Au to Pt was changed from 0.028![[thin space (1/6-em)]](https://www.rsc.org/images/entities/char_2009.gif) :
:![[thin space (1/6-em)]](https://www.rsc.org/images/entities/char_2009.gif) 1 to 12
1 to 12![[thin space (1/6-em)]](https://www.rsc.org/images/entities/char_2009.gif) :
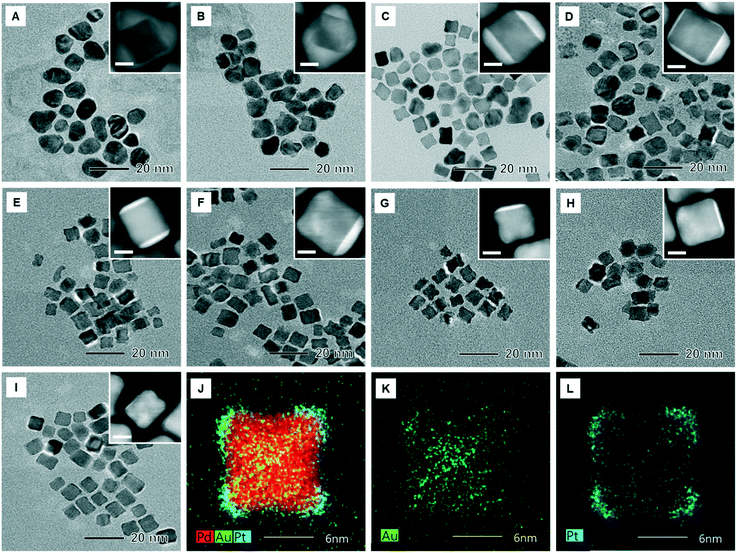
:![[thin space (1/6-em)]](https://www.rsc.org/images/entities/char_2009.gif) 1. Fig. S2† shows TEM images of the Pd and Pd@Pt core–shell NPs synthesized using a batch reactor (vial) as a reference. It showed that the Pd NPs have a cubic shape and the Pd@Pt NPs have a concave cubic morphology. Fig. 5A to I and S3† show the TEM images of the synthesized Pd@AuPt core–shell NPs on a chip with varying amounts of Au, indicating that the morphology of the NPs changed from quasi-spherical to cubic as the amount of the Au precursor decreased. At the same time, the number of planes covered by the Au shell also reduced from approximatively from 3 to 1 plane. Energy-dispersive spectroscopy (EDS) images of the Pd@AuPt NPs with the Au/Pt molar ratio of 0.36 show that the Pd core maintained its cubic shape after the formation of a core–shell structure with a diameter of 10–12 nm (Fig. 5J to L). This observation means that the galvanic replacement is not a major reaction for the formation of the Pd@AuPt core–shell structure. In addition, the location of Au and Pt on the Pd cube reveals that the Au shell covered the {100} plane of the Pd cube, while the Pt shell was located on mainly the {111} corners and partially on the {100} terrace. The elemental compositions of Pd, Au, and Pt of the synthesized Pd@AuPt were analysed using an inductively coupled plasma spectrometer (ICP), exhibiting that the amount of the Au in the core–shell NPs was proportional to the amount of the injected Au precursor (Table S1†).
1. Fig. S2† shows TEM images of the Pd and Pd@Pt core–shell NPs synthesized using a batch reactor (vial) as a reference. It showed that the Pd NPs have a cubic shape and the Pd@Pt NPs have a concave cubic morphology. Fig. 5A to I and S3† show the TEM images of the synthesized Pd@AuPt core–shell NPs on a chip with varying amounts of Au, indicating that the morphology of the NPs changed from quasi-spherical to cubic as the amount of the Au precursor decreased. At the same time, the number of planes covered by the Au shell also reduced from approximatively from 3 to 1 plane. Energy-dispersive spectroscopy (EDS) images of the Pd@AuPt NPs with the Au/Pt molar ratio of 0.36 show that the Pd core maintained its cubic shape after the formation of a core–shell structure with a diameter of 10–12 nm (Fig. 5J to L). This observation means that the galvanic replacement is not a major reaction for the formation of the Pd@AuPt core–shell structure. In addition, the location of Au and Pt on the Pd cube reveals that the Au shell covered the {100} plane of the Pd cube, while the Pt shell was located on mainly the {111} corners and partially on the {100} terrace. The elemental compositions of Pd, Au, and Pt of the synthesized Pd@AuPt were analysed using an inductively coupled plasma spectrometer (ICP), exhibiting that the amount of the Au in the core–shell NPs was proportional to the amount of the injected Au precursor (Table S1†).
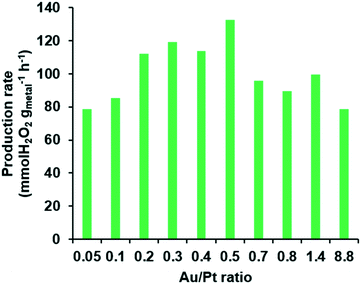
After producing a variety of Pd@AuPt NPs, the catalytic activity of the Pd@AuPt was investigated for DSHP in a fast-screening platform. In a typical reaction for DSHP using a conventional flask reactor, more than 0.4 mg of a catalyst is required per one reaction. To obtain such a quantity of the Pd@AuPt catalysts for DSHP, dozens of experiments are needed, which imposes limitations on the practicality of the proposed microsystem. To overcome this drawback, we utilized a fast and cost-effective screening method that uses only 0.05 mg of catalyst for one reaction (Fig. S4†).34 In this screening method, the reaction time took only 1 h by performing multiple reactions at once, whereas a typical DSHP experiment takes more than 3 h for each catalyst sample. Even though the reaction conditions of the fast-screening platform differ from those of the actual DSHP such as reaction temperature (27 °C) and pressure (1 atm), it allows us to quickly and easily measure the tendencies of the catalytic activities. Fig. 6 shows the relationship of the production rate of H2O2versus the Au/Pt ratio. The production rate of the Pd@AuPt catalysts increased gradually as the Au/Pt ratio was increased from 0.05 to 0.5. However, it decreased when the Au/Pt ratio exceeded 0.5. Thus, the optimal Au/Pt ratio for enhancing the catalytic activity of the Pd@AuPt was 0.5. In this study, we demonstrated the high-throughput screening capability of a centrifugal microdevice to determine the best ratio of Au/Pt in Pd@AuPt core–shell catalysts at high speed and low cost. Since there are many parameters that influence the catalytic activity, we believe that such factors can be optimized in the proposed platform.
Conclusions
Conventional batch reactors such as a flask and a vial require laborious, expensive, and time-consuming endeavours to synthesize multiple nanocatalysts. If the nanocatalyst consists of bi-metallic or tri-metallic components, it is almost impossible to screen all the combinatorial numbers of cases to obtain an optimal catalyst. Thus, a high-throughput screening system is necessary, which can be installed economically in normal laboratories. Our proposed centrifugal microdevice for high-throughput catalyst synthesis needs only a centrifugal microdevice and a spinning motor. In particular, we developed an innovative microfluidic device, which can perform 60 reactions simultaneously under the different synthetic conditions. Because the chip area is limited (13.0 cm in diameter), we designed microchannels and microchambers on the top and bottom of a single PMMA layer, resulting in a simplified one-layer chip structure. Through this sophisticated design, we were able to inject the three samples for 60 reactions in 30 min, and after incubation at 60 °C for 60 min, 60 Pd@AuPt core–shell nanocatalysts were produced in a high-throughput manner. The total volumes of the three reagents needed for the 60 reactions on a microfluidic device and a batch vial reactor were 2160 and 780![[thin space (1/6-em)]](https://www.rsc.org/images/entities/char_2009.gif) 000 μL, respectively, reducing the consumed volumes of the solutions by 360-fold on a chip. The total reaction time for the 60 different reactions was 1 h on a centrifugal microdevice, while the batch reactors with 60 vials required 300 h to produce comparable data, reducing the reaction time by 300-fold on a chip. In addition, we screened the activity of the resultant Pd@AuPt catalysts for DSHP in a fast-screening platform and found an Au/Pt ratio of 0.5 was optimal for H2O2 production in a high yield. As the chip area was enlarged, the throughput capability of the device increased accordingly. In addition, the incorporation of an optical module would be ideal to real-time monitor the nanoparticle synthesis, which is under way in our laboratory. Thus, we expect further superb high-throughput performance of the centrifugal microfluidic device, which can be applied for the synthesis of nanomaterials, the chemical reaction testing of catalysts, bio-diagnostics, etc.
000 μL, respectively, reducing the consumed volumes of the solutions by 360-fold on a chip. The total reaction time for the 60 different reactions was 1 h on a centrifugal microdevice, while the batch reactors with 60 vials required 300 h to produce comparable data, reducing the reaction time by 300-fold on a chip. In addition, we screened the activity of the resultant Pd@AuPt catalysts for DSHP in a fast-screening platform and found an Au/Pt ratio of 0.5 was optimal for H2O2 production in a high yield. As the chip area was enlarged, the throughput capability of the device increased accordingly. In addition, the incorporation of an optical module would be ideal to real-time monitor the nanoparticle synthesis, which is under way in our laboratory. Thus, we expect further superb high-throughput performance of the centrifugal microfluidic device, which can be applied for the synthesis of nanomaterials, the chemical reaction testing of catalysts, bio-diagnostics, etc.
Conflicts of interest
There are no conflicts of interest to declare.Acknowledgements
This work was supported by the Engineering Research Center of Excellence Program of Korea Ministry of Science, ICT & Future Planning (MSIP)/National Research Foundation of Korea (NRF) (2014R1A5A1009799) and the National Research Foundation of Korea (NRF), The Ministry of Science and ICT (MSIT) (2020R1A2C1003960).References
- L. Zhang, Z. J. Zhao and J. Gong, Angew. Chem., Int. Ed., 2017, 56, 11326–11353 CrossRef CAS PubMed.
- X. Li, X. Hao, A. Abudula and G. Guan, J. Mater. Chem. A, 2016, 4, 11973–12000 RSC.
- M. Neurock, M. Janik and A. Wieckowski, Faraday Discuss., 2009, 140, 363–378 RSC.
- X. Xia, S. Xie, M. Liu, H. C. Peng, N. Lu, J. Wang, M. J. Kim and Y. Xia, Proc. Natl. Acad. Sci. U. S. A., 2013, 110, 6669 CrossRef CAS PubMed.
- I. Kim, M. G. Seo, C. Choi, J. S. Kim, E. Jung, G. H. Han, J. C. Lee, S. S. Han, J. P. Ahn, Y. Jung, K. Y. Lee and T. Yu, ACS Appl. Mater. Interfaces, 2018, 10, 38109–38116 CrossRef CAS PubMed.
- S. Abate, G. Centi, S. Melada, S. Perathoner, F. Pinna and G. Strukul, Catal. Today, 2005, 104, 323–328 CrossRef CAS.
- S. W. Kang, Y. W. Lee, Y. Park, B. S. Choi, J. W. Hong, K. H. Park and S. W. Han, ACS Nano, 2013, 7, 7945–7955 CrossRef CAS PubMed.
- B. Lim, H. Kobayashi, T. Yu, J. Wang, M. J. Kim, Z. Y. Li, M. Rycenga and Y. Xia, J. Am. Chem. Soc., 2010, 132, 2506–2507 CrossRef CAS PubMed.
- B. Lim, M. Jiang, P. H. C. Camargo, E. C. Cho, J. Tao, X. Lu, Y. Zhu and Y. Xia, Science, 2009, 324, 1302 CrossRef CAS PubMed.
- B. T. Sneed, A. P. Young, D. Jalalpoor, M. C. Golden, S. Mao, Y. Jiang, Y. Wang and C. K. Tsung, ACS Nano, 2014, 8, 7239–7250 CrossRef CAS PubMed.
- X. Yuan, L. Zhang, L. Li, H. Dong, S. Chen, W. Zhu, C. Hu, W. Deng, Z. J. Zhao and J. Gong, J. Am. Chem. Soc., 2019, 141, 4791–4794 CrossRef CAS PubMed.
- C. Zhu, J. Zeng, J. Tao, M. C. Johnson, I. Schmidt-Krey, L. Blubaugh, Y. Zhu, Z. Gu and Y. Xia, J. Am. Chem. Soc., 2012, 134, 15822–15831 CrossRef CAS PubMed.
- C. W. Yang, K. Chanda, P. H. Lin, Y. N. Wang, C. W. Liao and M. H. Huang, J. Am. Chem. Soc., 2011, 133, 19993–20000 CrossRef CAS PubMed.
- P. Marchand, N. M. Makwana, C. J. Tighe, R. I. Gruar, I. P. Parkin, C. J. Carmalt and J. A. Darr, ACS Comb. Sci., 2016, 18, 130–137 CrossRef CAS PubMed.
- E. M. Chan, C. Xu, A. W. Mao, G. Han, J. S. Owen, B. E. Cohen and D. J. Milliron, Nano Lett., 2010, 10, 1874–1885 CrossRef CAS PubMed.
- M. Thiele, A. Knauer, D. Malsch, A. Csáki, T. Henkel, J. M. Köhler and W. Fritzsche, Lab Chip, 2017, 17, 1487–1495 RSC.
- S. E. Lohse, J. R. Eller, S. T. Sivapalan, M. R. Plews and C. J. Murphy, ACS Nano, 2013, 7, 4135–4150 CrossRef CAS PubMed.
- X. H. Ji, N. G. Zhang, W. Cheng, F. Guo, W. Liu, S. S. Guo, Z. K. He and X. Z. Zhao, J. Am. Chem. Soc., 2011, 21, 13380–13387 CAS.
- C. G. Yang, Z. R. Xu, A. P. Lee and J. H. Wang, Lab Chip, 2013, 13, 2815–2820 RSC.
- H. Wang, K. Liu, K. J. Chen, Y. Lu, S. Wang, W. Y. Lin, F. Guo, K. I. Kamei, Y. C. Chen, M. Ohashi, M. Wang, M. A. Garcia, X. Z. Zhao, C. K. F. Shen and H. R. Tseng, ACS Nano, 2010, 4, 6235–6243 CrossRef CAS PubMed.
- J. S. Santana, K. M. Koczkur and S. E. Skrabalak, Langmuir, 2017, 33, 6054–6061 CrossRef CAS PubMed.
- T. Gu, C. Zheng, F. He, Y. Zhang, S. A. Khan and T. A. Hatton, Lab Chip, 2018, 18, 1330–1340 RSC.
- G. Niu, L. Zhang, A. Ruditskiy, L. Wang and Y. Xia, Nano Lett., 2018, 18, 3879–3884 CrossRef CAS PubMed.
- O. Strohmeier, M. Keller, F. Schwemmer, S. Zehnle, D. Mark, F. von Stetten, R. Zengerle and N. Paust, Chem. Soc. Rev., 2015, 44, 6187–6229 RSC.
- S. Smith, D. Mager, A. Perebikovsky, E. Shamloo, D. Kinahan, R. Mishra, M. S. Torres Delgado, H. Kido, S. Saha, J. Ducrée, M. Madou, K. Land and G. J. Korvink, Micromachines, 2016, 7, 22 CrossRef PubMed.
- I. Maguire, R. O'Kennedy, J. Ducrée and F. Regan, Anal. Methods, 2018, 10, 1497–1515 RSC.
- H. V. Nguyen, V. D. Nguyen, H. Q. Nguyen, T. H. T. Chau, E. Y. Lee and T. S. Seo, Biosens. Bioelectron., 2019, 141, 111466 CrossRef CAS PubMed.
- B. H. Park, D. Kim, J. H. Jung, S. J. Oh, G. Choi, D. C. Lee and T. S. Seo, Sens. Actuators, B, 2015, 209, 927–933 CrossRef CAS.
- Q. Liu, J. C. Bauer, R. E. Schaak and J. H. Lunsford, Appl. Catal., A, 2008, 339, 130–136 CrossRef CAS.
- X. Xiao, T. U. Kang, H. Nam, S. H. Bhang, S. Y. Lee, J. P. Ahn and T. Yu, Korean J. Chem. Eng., 2018, 35, 2379–2383 CrossRef CAS.
- K. Kosaka, H. Yamada, S. Matsui, S. Echigo and K. Shishida, Environ. Sci. Technol., 1998, 32, 3821–3824 CrossRef CAS.
- A. Olanrewaju, M. Beaugrand, M. Yafia and D. Juncker, Lab Chip, 2018, 18, 2323–2347 RSC.
- S. Lai, S. Wang, J. Luo, L. J. Lee, S. T. Yang and M. J. Madou, Anal. Chem., 2004, 76, 1832–1837 CrossRef CAS PubMed.
- J. K. Edwards, J. Pritchard, L. Lu, M. Piccinini, G. Shaw, A. F. Carley, D. J. Morgan, C. J. Kiely and G. J. Hutchings, Angew. Chem., Int. Ed., 2014, 53, 2381–2384 CrossRef CAS PubMed.
Footnotes |
| † Electronic supplementary information (ESI) available. See DOI: 10.1039/d0lc00461h |
| ‡ These authors contributed equally to this work. |
| This journal is © The Royal Society of Chemistry 2020 |

