
 Open Access Article
 This Open Access Article is licensed under a Creative Commons Attribution-Non Commercial 3.0 Unported Licence
Double emulsion flow cytometry with high-throughput single droplet isolation and nucleic acid recovery†
Kara K.
Brower
ab,
Catherine
Carswell-Crumpton
c,
Sandy
Klemm
d,
Bianca
Cruz
e,
Gaeun
Kim
a,
Suzanne G. K.
Calhoun
f,
Lisa
Nichols
c and
Polly M.
Fordyce
 *abdg
*abdg
aDepartment of Bioengineering, Stanford University, Stanford, California, USA. E-mail: pfordyce@stanford.edu
bChem-H Institute, Stanford University, Stanford, California, USA
cCenter for Molecular and Genetic Medicine, Stanford University, Stanford, California, USA
dDepartment of Genetics, Stanford University, Stanford, California, USA
eDepartment of Physics, California State Polytechnic Institute, Pomona, CA, USA
fDepartment of Chemical Engineering, Stanford University, Stanford, California, USA
gChan-Zuckerberg Biohub, San Francisco, CA, USA
First published on 17th May 2020
Abstract
Droplet microfluidics has made large impacts in diverse areas such as enzyme evolution, chemical product screening, polymer engineering, and single-cell analysis. However, while droplet reactions have become increasingly sophisticated, phenotyping droplets by a fluorescent signal and sorting them to isolate individual variants-of-interest at high-throughput remains challenging. Here, we present sdDE-FACS (![[s with combining low line]](https://www.rsc.org/images/entities/char_0073_0332.gif) ingle
ingle ![[d with combining low line]](https://www.rsc.org/images/entities/char_0064_0332.gif) roplet
roplet ![[D with combining low line]](https://www.rsc.org/images/entities/char_0044_0332.gif) ouble
ouble ![[E with combining low line]](https://www.rsc.org/images/entities/char_0045_0332.gif) mulsion-FACS), a new method that uses a standard flow cytometer to phenotype, select, and isolate individual double emulsion droplets of interest. Using a 130 μm nozzle at high sort frequency (12–14 kHz), we demonstrate detection of droplet fluorescence signals with a dynamic range spanning 5 orders of magnitude and robust post-sort recovery of intact double emulsion (DE) droplets using 2 commercially-available FACS instruments. We report the first demonstration of single double emulsion droplet isolation with post-sort recovery efficiencies >70%, equivalent to the capabilities of single-cell FACS. Finally, we establish complete downstream recovery of nucleic acids from single, sorted double emulsion droplets via qPCR with little to no cross-contamination. sdDE-FACS marries the full power of droplet microfluidics with flow cytometry to enable a variety of new droplet assays, including rare variant isolation and multiparameter single-cell analysis.
mulsion-FACS), a new method that uses a standard flow cytometer to phenotype, select, and isolate individual double emulsion droplets of interest. Using a 130 μm nozzle at high sort frequency (12–14 kHz), we demonstrate detection of droplet fluorescence signals with a dynamic range spanning 5 orders of magnitude and robust post-sort recovery of intact double emulsion (DE) droplets using 2 commercially-available FACS instruments. We report the first demonstration of single double emulsion droplet isolation with post-sort recovery efficiencies >70%, equivalent to the capabilities of single-cell FACS. Finally, we establish complete downstream recovery of nucleic acids from single, sorted double emulsion droplets via qPCR with little to no cross-contamination. sdDE-FACS marries the full power of droplet microfluidics with flow cytometry to enable a variety of new droplet assays, including rare variant isolation and multiparameter single-cell analysis.
1 Introduction
Microfluidic droplet generation is a powerful technique for encapsulating biological molecules or cells within precisely controlled nL- to pL-volumes, making it possible to perform up to 107 reactions in parallel with low per-reaction costs.1 Microfluidic droplets have been used for a wide variety of applications, including directed evolution of enzymes and proteins,2–6 digital PCR,7 large-scale gene assembly,8 cell culture,9,10 and, recently, single-cell genomic, epigenomic, and transcriptomic analyses.11–14 In the past ten years, droplet technologies have been translated to a variety of commercial assays (e.g. ddPCR, Biorad; Chromium, 10X Genomics), representing perhaps the largest commercial adoption of microfluidic technologies to date. However, while the number of possible reactions within droplet microreactors has increased, screening, sorting, and isolating subpopulations of droplets for downstream processing remains technically challenging.15,16Fluorescent readouts in droplet assays allow for quantitative measurement of droplet phenotypes (e.g. reaction progress and outcome).17–20 When combined with an ability to sort droplets by their fluorescence, droplets can be binned by one or more signals and their nucleic acid content analyzed to identify variants responsible for activity (thereby linking genotype to phenotype).2,5,7,21 Currently, fluorescence-activated droplet sorting (FADS) remains the most common approach for droplet analysis and sorting.15 FADS and other variants of the technique (e.g. flow dropometry (FD) and picodispersion) analyze and sort water-in-oil (W/O) droplets based on fluorescence using a microfluidic chip with embedded electrodes and an associated optical assembly (for dielectrophoretic sorting and droplet imaging, respectively).18,22–24
While FADS allows accurate droplet screening, this technique requires custom devices and instruments that are technically demanding to build and operate, limiting adoption to a few laboratories worldwide.18,20,25 Moreover, only 1 or 2 fluorescence channels can be probed simultaneously and high accuracy sorting is limited to slow rates of 0.1–2 kHz.18,20,23 While single-droplet isolation and sorting has been accomplished via FADS, single droplet deposition rates are extremely slow (0.015 kHz, 2 orders of magnitude slower than single cell FACS).25
Fluorescence-activated cell sorting (FACS) instruments provide an appealing alternative to FADS. FACS cytometers boast excellent signal discrimination and sensitivity,26–29 unparalleled multi-parameter analysis capabilities (2–18 fluorescence channels),30–34 and the ability to reliably deposit single cells into wells of standard multiwell plates with >70% sorting efficiencies.35–40 FACS instruments are also commercially available, easy-to-operate, and widely available at most institutions. As a result, FACS remains the most ubiquitous technique for cellular phenotyping worldwide.41,42 The landmark demonstration of FACS for the detection and isolation of single cells followed by downstream nucleic acid recovery ushered in a new era of single-cell analysis,36,43 allowing high-throughput investigation of the linkage between genotype and phenotype for each cell across many cells in parallel.
The ability to sort single droplet microreactors at high-throughput via FACS would be equally transformative, enabling investigation of a wide variety of cellular phenotypes not currently compatible with traditional FACS, such as analysis of cell-secreted molecules or enzymatic turnover.43 Combined with downstream plate-based qPCR or sequencing, FACS sorting and isolation of individual droplets could allow tandem genomic, epigenomic, or transcriptomic11–14 analyses on the same cell, addressing a critical need for integrative single cell analysis techniques.43
However, sorting of single droplets via FACS has never been demonstrated, in part due to technical challenges associated with producing FACS-compatible droplets. FACS sorting requires the ability to suspend particles in an aqueous ‘sheath’ fluid that can be charged to allow electrostatic deflection of particles of interest.44 Standard water-in-oil (W/O) droplets used in FADS are therefore not suitable for FACS, as the insulating oil surrounding the aqueous core of W/O droplets is immiscible with aqueous sheath fluids.45
Water–oil–water (W/O/W) double emulsion (DE) droplets provide an alternate droplet architecture compatible with FACS. In DE droplets, the inner aqueous core (similar to typical single emulsions used in FADS) is encapsulated in an outer oil shell that is subsequently surrounded by additional aqueous fluid.19,46 DE droplets can therefore be suspended in aqueous FACS sheath buffers (e.g. PBS) for proper sort charging.
Prior work has established that FACS instruments can detect and sort DE droplets.2,5,7,19,45,47–49 However, none of these papers have reported isolation of individual DE droplets or recovery of encapsulated nucleic acids from single droplets, both of which are critical technical requirements for downstream single-cell assays. These failures were likely a result of extensive shear-induced droplet breakage during FACS, as evidenced by poor post-sort recovery (∼40–70% droplet survival post-FACS with visible ruptured droplets),7 and lack of optimization of critical cytometer parameters (e.g. sample pressure, charge trigger delays) that account for differences between DE droplets and cells.7,47 As a result, downstream nucleic acid recovery from double emulsions, especially at low droplet numbers, has been inefficient, unsuccessful, or dominated by cross-contamination between sort populations.2,5,47
Here, we demonstrate single-droplet double emulsion FACS (sdDE-FACS), a technique that allows high-throughput, quantitative phenotyping and sorting of individual DE droplets. sdDE-FACS discriminates droplet fluorescence signals spanning 5 orders of magnitude and recovers droplets with ∼60–70% efficiency and over 97% target specificity, equivalent to the capabilities of single cell FACS.35,42,50–52 In addition, downstream qPCR measurements on bulk and individual sorted droplets establish that all droplet-encapsulated DNA can be completely recovered, with little to no evidence of well-to-well cross-contamination. To our knowledge, this represents the first demonstration of high-efficiency single DE droplet sorting and complete nucleic acid recovery via FACS. sdDE-FACS paves the way for a wide variety of new assays linking droplet phenotype to genotype by combining the throughput of droplet microfluidics with the power of single-cell FACS.
2 Results and discussion
2.1 DE-FACS workflow and pipeline
To enable high-throughput sorting and analysis of DE droplet populations via FACS, we developed and optimized a 3-stage pipeline (sdDE-FACS:ingle roplet ouble mulsion ![[F with combining low line]](https://www.rsc.org/images/entities/char_0046_0332.gif)
![[A with combining low line]](https://www.rsc.org/images/entities/char_0041_0332.gif)
![[C with combining low line]](https://www.rsc.org/images/entities/char_0043_0332.gif)
![[S with combining low line]](https://www.rsc.org/images/entities/char_0053_0332.gif) , Fig. 1). During the first stage (DE droplet library generation, Fig. 1A), variant libraries (e.g. prokaryotic or eukaryotic cells, nucleic acids, or proteins) are encapsulated within the inner aqueous phase of DE droplets with a Poisson-distributed occupancy to ensure most droplets are either empty or contain a single variant. Each variant is co-encapsulated with any required assay reagents (e.g. enzymes, buffers, dyes, or antibodies) and surfactants to stabilize the W/O/W droplet architecture.7,53,54
, Fig. 1). During the first stage (DE droplet library generation, Fig. 1A), variant libraries (e.g. prokaryotic or eukaryotic cells, nucleic acids, or proteins) are encapsulated within the inner aqueous phase of DE droplets with a Poisson-distributed occupancy to ensure most droplets are either empty or contain a single variant. Each variant is co-encapsulated with any required assay reagents (e.g. enzymes, buffers, dyes, or antibodies) and surfactants to stabilize the W/O/W droplet architecture.7,53,54
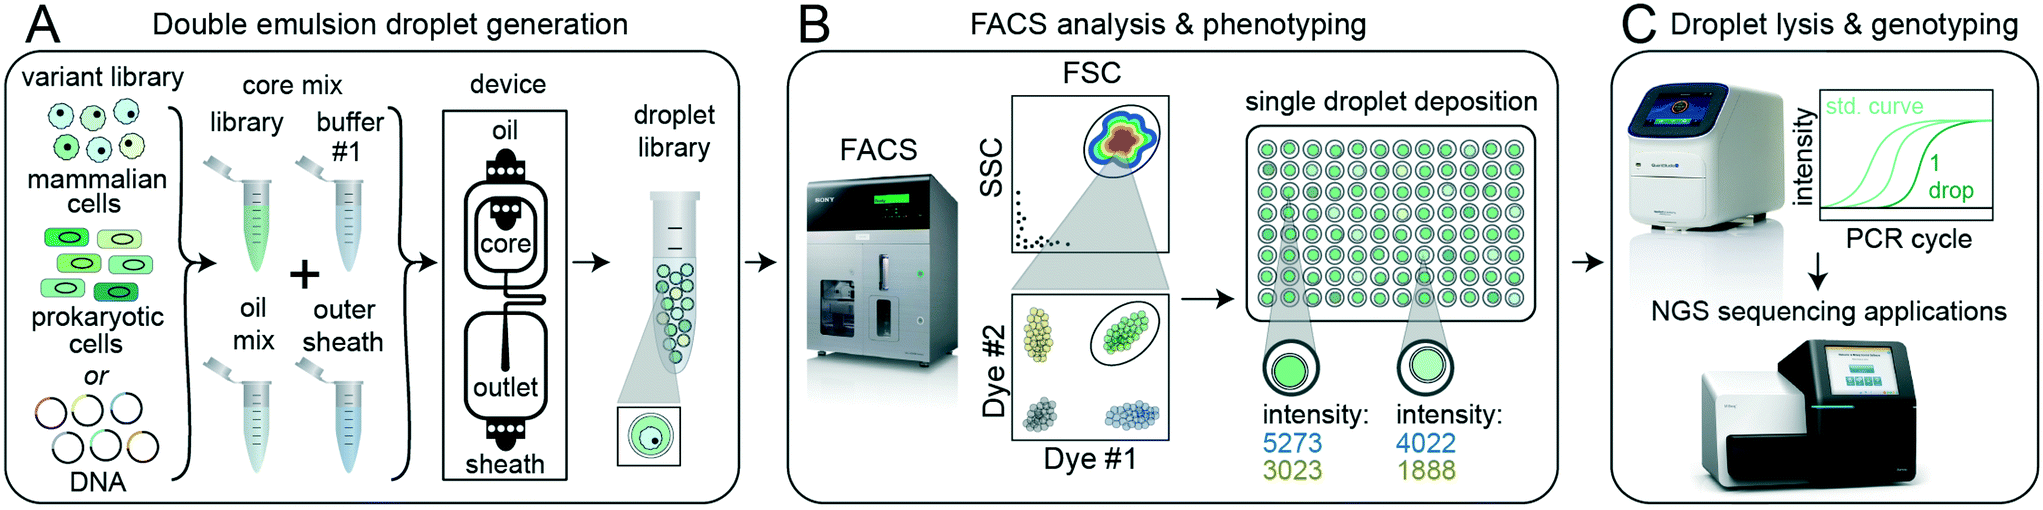 | ||
| Fig. 1 sdDE-FACS workflow. (A) Cell or DNA variants of interest are loaded into a DE droplet generator device to produce a library of droplets each containing a different variant. DEs can be generated for a wide variety of reactions by adjusting core mix reagents and buffers, number of core inlets, and droplet size. (B) DE droplets are analyzed via FACS to quantify morphology (FSC vs. SSC) and relevant fluorescence signals (by fluorescent intensity) and then sorted into wells of a multiwell plate. (C) Sorted DE droplets can be lysed to recover nucleic acids for downstream applications, such as qPCR or next-generation sequencing, that link droplet genotype to phenotype (e.g. enzymatic reaction turnover, presence of a specific cell type, or completion of a cellular reaction). | ||
In the next stage (FACS phenotyping, Fig. 1B), DE droplets are quantitatively analyzed based on size and fluorescence and sorted via FACS into designated wells of a multi-well destination plate or other sort vessel. Sorting can either collect many DE droplets from a desired population or deposit individual droplets into particular wells, thereby directly linking DE droplet phenotype to an output plate well location. After sorting, pools or individual DE droplets are lysed and processed downstream via various plate-based reaction techniques, including qPCR and next-generation sequencing (DE droplet genotyping, Fig. 1C).
2.2 Double emulsion droplet generation
Quantitative, high-throughput DE droplet phenotyping via FACS requires generation of highly monodisperse and stable DEs. To generate FACS-compatible DE droplets, we fabricated a one-step microfluidic dual-flow focusing device for W/O/W droplet generation based on previously-published designs55,56 (Fig. 2A and S1†). This device is easy and inexpensive to operate, requiring only syringe pumps and a low-cost microscope with a high-speed camera to visualize droplets within the device (Fig. S1 and Table S1†).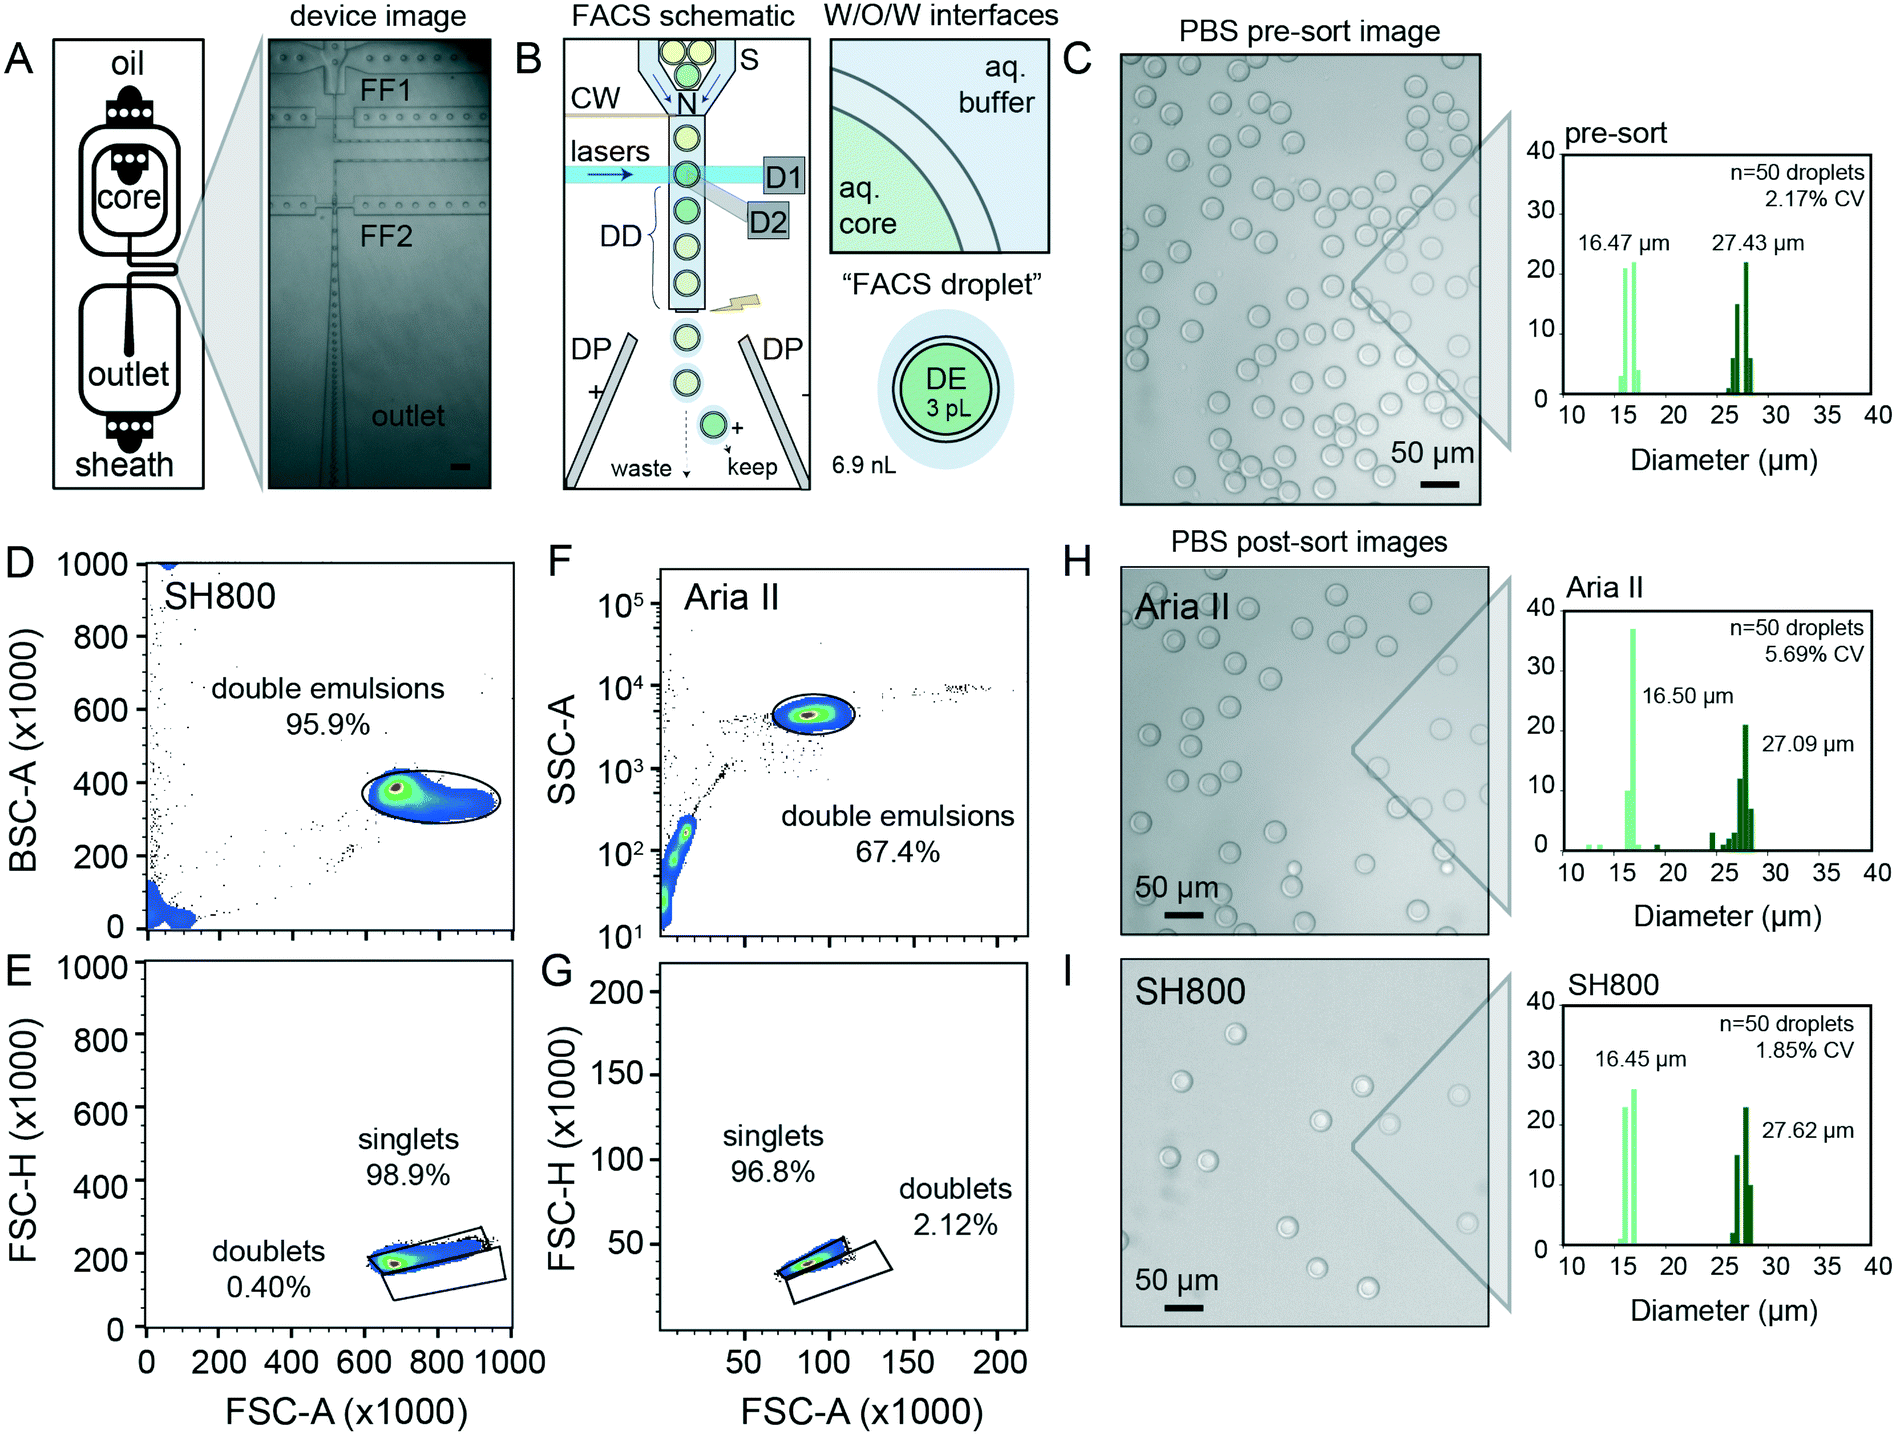 | ||
Fig. 2 DE droplet analysis via sdDE-FACs. (A) Schematic of dual flow-focuser (FF1, FF2) DE droplet generator and image of DE droplet generation. Scale bar is 200 μm. (B) Schematic of DE droplet manipulations during FACS. DE droplets pass through a nozzle (N) and are hydrodynamically focused by sheath flow (S) prior to interrogation via lasers within the flow cell. Signals are read out via detectors (examples: D1, D2). After a specified droplet delay (DD), the sheath stream is charged via a charge wire (CW) to charge an individual FACS droplet containing a DE-of-interest prior to break-off; charged droplets are then deflected to a specific well (keep) or waste (W) via fields generated between dielectric plates (DP). Insets show a “FACS droplet” with encapsulated DE (respective volumes of each droplet indicated) as well as associated surfactant-stabilized W/O/W interfaces to recover DEs-of-interest. (C) Representative image of pre-sort DE droplets and pre-sort size distributions (light green = inner diameter, dark green = outer diameter, CV = variation of total diameter). (D and F) FACS light scatter gates of DEs on the SH800 and Aria II, respectively (25![[thin space (1/6-em)]](https://www.rsc.org/images/entities/char_2009.gif) 000 total events visualized, randomly sampled). A 9.9 K threshold was applied to SH800 data eliminate small particulates/electronic noise/debris from gating. (E and G) Daughter singlet gates of the parental double emulsion populations per sorter. (H) Image and size distribution for DE droplets after sorting with the Aria II. I Image and size distribution for DE droplets after sorting with the SH800 (n = 50 droplets analyzed for all size histograms). 000 total events visualized, randomly sampled). A 9.9 K threshold was applied to SH800 data eliminate small particulates/electronic noise/debris from gating. (E and G) Daughter singlet gates of the parental double emulsion populations per sorter. (H) Image and size distribution for DE droplets after sorting with the Aria II. I Image and size distribution for DE droplets after sorting with the SH800 (n = 50 droplets analyzed for all size histograms). | ||
For successful sorting, DE droplets must be significantly smaller (10–50 μm in diameter) than commercial FACS nozzles (typically 70–130 μm in diameter) while simultaneously large enough to encapsulate variants of interest (0.005–3 pL for bacteria to large mammalian cells, respectively) within the inner core volume (2–50 pL).7,45 Smaller droplet sizes lower DE droplet deformation during FACS and thus minimize likelihood of DE droplet breakage.54 Devices were designed to produce W/O/W droplets significantly smaller than typical FACS nozzles (∼30 μm in diameter), with channel heights of 15 μm for the inner aqueous and oil phases (first flow focuser for W/O droplet generation) and 40 μm for outer aqueous phase (second flow focuser to wrap the oil shell with aqueous buffer and create the W/O/W droplet). Larger or smaller double emulsions can be generated with scaled versions of this device; we have generated DE droplet populations from 27.63–48.36 μm (see ESI†), all of which perform well with this workflow. Any custom or commercial device can be used to generate DE droplets compatible with sdDE-FACS as long as polydispersity is minimized (droplet CV <20%), as large variations in droplet sizes increase the change of clogging (largely due to free oil typically present in polydisperse samples).
2.3 Double emulsion surfactant selection
DE stability is critical to robust performance of sdDE-FACS. Appropriate surfactant choice in the aqueous and oil phases is required to stabilize the inner and outer water–oil interfaces of each DE throughout droplet formation, storage, and reaction processing.45,46,53 FACS sorting of DE droplets poses an even greater challenge, as DE droplets must remain intact even when exposed to high flow rates, shear forces, and FACS droplet breakoff during sorting (Fig. 2B, see extended discussion in ESI†).26,44,54Surfactants stabilize DE droplets by decreasing interfacial tension and distributing charge density.53,54 Surfactants locally crowd, absorb or “skin” at droplet oil–water and water–oil interfaces within the DE itself, between the DE and flow stream, and between the DE and larger “FACS droplet” to stabilize the droplet prior to and during FACS (Fig. 2B).7
Prior work sorting double or single emulsions via FACS and FADS, respectively, have employed a wide variety of surfactants (Table S2†). Based on these reports, we selected a fluorinated oil (HFE 7500) and ionic surfactant (PEG-Krytox FS-H 157) combination previously shown to exhibit excellent biocompatibility, no leakage between phases, and high stability under storage and reaction thermocycling.7,10,53 After systematic tests on aqueous phase surfactants to increase droplet stability and recovery rates, we deviated from prior work to optimize our formulations (Table 1) as follows: (1) to reduce DE core droplet deformation under shear, we decreased inner and outer aqueous phase viscosities (which lowers viscous stress), reduced inner aqueous phase non-ionic surfactant concentration, lowered FACS sheath flow rates and increased nozzle size, as recommended by prior experimental7 and theoretical work;54 (2) to reduce FACS stream instability and clogging, we increased carrier aqueous phase non-ionic surfactant concentrations (which lowers shear and appears to prevent satellite oil formation during droplet generation), and reduced overall surfactant in the FACS diluent buffer,54 and (3) we osmotically balanced the inner and outer aqueous phases during droplet manipulation to prevent osmotic droplet lysis.7 This formulation consistently yielded monodisperse (CV < 5%) DE droplets across hundreds of samples (representative population shown in Fig. 2C, mean diameter of 16.47 ± 0.47 μm and 27.43 ± 0.60 μm for the inner core and total droplet diameter, respectively (mean ± standard deviation) with an overall CV of 2.17%). For cellular applications, 0.1–1% Tween-20 can be replaced with 0.5–2% BSA without loss of DE stability. DE droplets produced using this formulation remain stable when stored for months to years.
| Droplet compartment | Surfactant mixture | Base buffer |
|---|---|---|
| Inner core | 0.1–1% Tween-20 | 1× PBS |
| Oil shell | 2.2% ionic Krytox 157 FS-H | HFE7500 |
| Outer sheath | 1% Tween-20, 2% Pluronic F68 | 1× PBS |
| FACS diluent | 1% Tween-20 | 1× PBS |
2.4 Droplet phenotyping using DE-FACS
Next, we tested the ability to visualize and sort DE droplet populations on two widely available FACS instruments, an Aria II (Becton Dickinson, BD) and a SH800 (Sony Biotechnologies). The Aria II couples piezoelectric droplet generation with a quartz cuvette for sample interrogation using high-powered lasers and emission optics gel-coupled to the cuvette; it represents the current literature standard for droplet flow cytometry, and is used here to benchmark our technique against prior work.7,45,57 The SH800 instead uses a microfluidic approach, where sample fluid channels, the laser interrogation window, and the sorting nozzle are integrated on a disposable chip; sample excitation uses lower-powered lasers and emission optics utilize a single optical fiber without gel-coupling. The Sony SH800 is relatively low cost, easy to operate, and requires minimal training; however, its use in double emulsion flow cytometry has not been previously demonstrated.DE droplets are larger and more deformable than typical cells;54 therefore, we conducted significant optimization of FACS instrument settings (e.g. scatter thresholds, laser gains, flow pressures, droplet harmonics, and droplet delays) to ensure consistent and quantitative droplet detection and sorting (Table 2). To minimize droplet shear and breakage, we employed a large (130 μm) sort nozzle for sdDE-FACS, in contrast to prior work on double emulsion FACS using smaller (70 μm or 100 μm) nozzles.7,19,45 We also found that careful tuning of the ‘droplet delay’ parameter on the Aria II, which specifies precise time delay between detection of droplet of interest and charging of the FACS fluid for electrostatic deflection of this droplet, was critical for high efficiency sorting of droplets, and is a significant change from FACS settings used for cellular analysis or in prior droplet literature (see ESI† for discussion). These parameters apply across similar sorters (see ESI† for Aria III use case) and are input by the user before each run. A full sort protocol is available in ESI† methods.
| Instrument parameter | Aria II (BD) | SH800 (Sony) |
|---|---|---|
| Nozzle size | 130 μm | 130 μm |
| ND filter | 1.5 ND | — |
| Trigger | FSC | FSC |
| Threshold | 1200 | 0.67% |
| FSC gain | 25 | 1 |
| SSC (BSC) gain | 170 | 28% |
| FITC gain | 439 | 39% |
| APC/A647 gain | 500 | 40% |
| Sample pressure | 3 flow rate | 9 psi |
| System pressure | 10 psi | 9 psi |
| Agitation | 300 rpm | High |
| Drop frequency | 14.5 kHz | 12 kHz |
With these optimized parameters, forward versus side scatter (FSC vs. SSC) distributions on the Aria II and the SH800 for the same population of DEs revealed distinct, tight clusters of DE droplets with limited scatter within 2 orders of magnitude (Fig. 2D and F). Compared to the previous Aria II literature benchmark of 43.9% for FSC vs. SSC purity (10000 events, with similar gating strategy),45 our workflow represents an overall increase in throughput of >25% (Fig. 2D and F). More importantly, extraneous scatter on both instruments is significantly decreased, indicating fewer droplet breakage events and less free oil with sdDE-FACS.7,19,45 Bivariate plots of double emulsion forward scatter height versus area (FSC-H vs. FSC-A, Fig. 2E and G) discriminate single droplets from doublets or larger clusters and establish that nearly all gated events are comprised of single DE droplets (doublet rates <3% on both instruments), consistent with post-sort microscopy images (Fig. 2E and G–I). These results replicate across multiple samples (Fig. S2†).
Images of DE droplets post-sort establish that populations remain monodisperse after sorting (Aria II: inner and total diameters of 16.50 ± 0.80 μm and 27.08 ± 0.51 μm, respectively; SH800: inner and total diameters of 16.45 ± 0.35 μm and 27.61 ± 0.52 μm, respectively (mean ± standard deviation)) with little breakage (Fig. 2H and I). Post-sort DE size CV was lower for the SH800 (1.85% CV) as compared to the Aria II (5.69%), likely due to lower shear forces inside the microfluidic chip and integrated sort nozzle used on the SH800. Interesting, the SH800 observed a droplet event lag time (Fig. S3†), perhaps due to packing of highly deformable DEs within the flow chip before droplets were metered under laminar flow. While smaller droplet sizes are known to lower droplet deformation during FACS and thus minimize likelihood of DE droplet breakage,54 we have used scaled versions of the same device to successfully generate and sort DE droplet populations across multiple size regimes (27.63–48.36 μm) with a wide range of shell-to-core ratios (0.2–0.59) with similar efficiencies, purity, and post-sort recovery, demonstrating sdDE-FACS compatibility with diverse droplet geometries (see ESI,† Fig. S4–S6).
2.5 Assessment of FACS dynamic range and limit of detection for double emulsions
FACS-based cell screening applications typically detect fluorescence emitted by cells containing fluorescent reporters with a dynamic range of ∼4 orders of magnitude.31,42,58 To quantify the dynamic range and lower limit of detection for sdDE-FACS, we loaded DE droplets with five concentrations (0.01, 0.1, 1, 10, and 100 μg mL−1) of either FITC-labeled or Alexa-Fluor 647-labeled bovine serum albumin (BSA) and quantified emitted fluorescence via FACS on both instruments (Fig. 3B, C, E and F). Brightfield images confirmed that DE droplets remained highly monodisperse when loaded with dye-labeled BSA (Fig. 3A and D). Measured intensities for DE droplets (gated by FSC vs. SSC) cluster tightly as a function of loaded dye concentration, with both instruments clearly discriminating 1–100 μg mL−1 labeled BSA from background (Fig. 3). The Aria II cytometer was capable of detecting <0.1 μg mL−1 dye (5 orders of magnitude) with a lower peak width per dye concentration, while the lower limit of detection for the SH800 was ∼0.1 μg mL−1 (4 orders of magnitude), likely due to higher-powered individual lasers and gel-coupled collection optics in this instrument (Fig. 3B, C, E and F).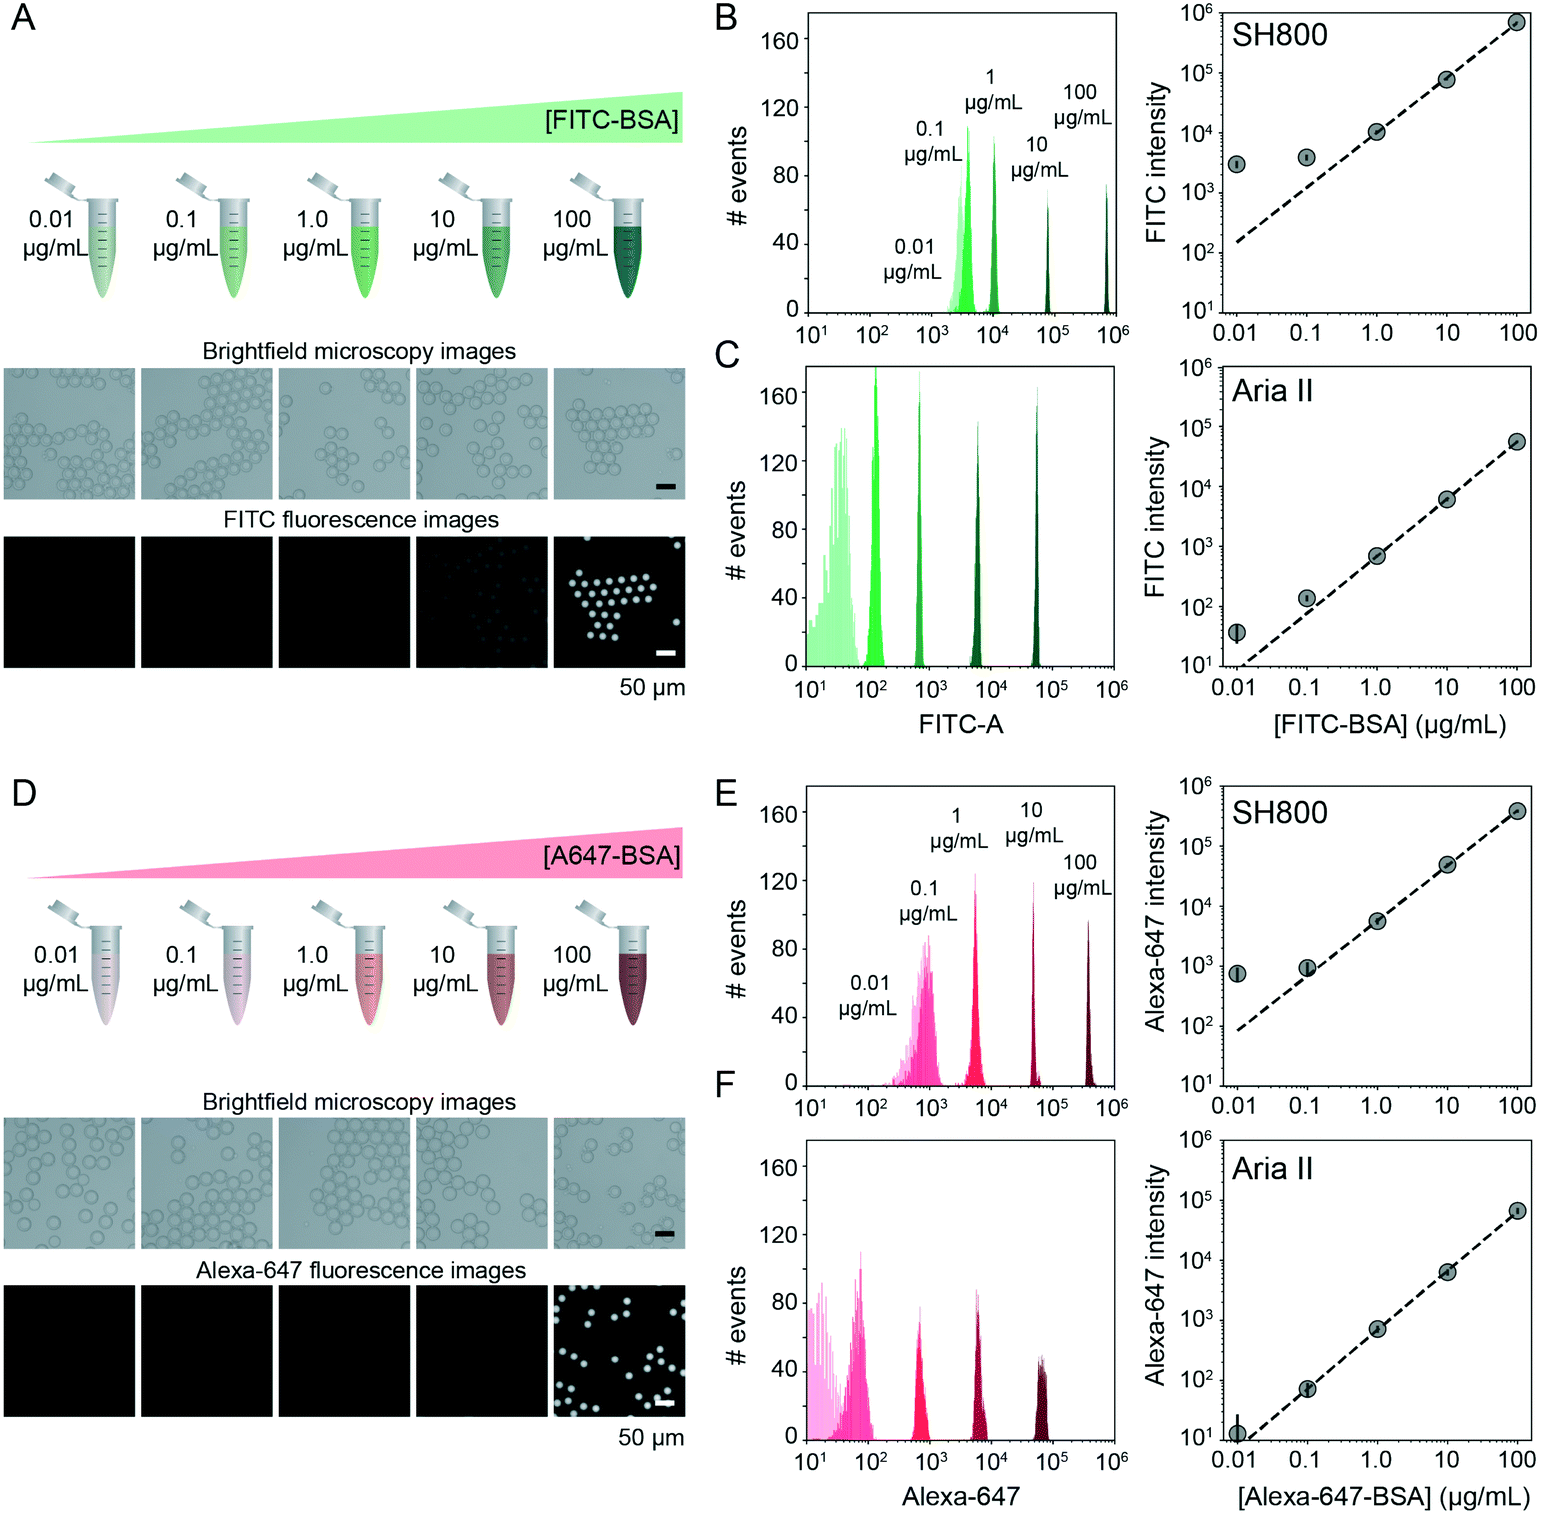 | ||
| Fig. 3 Dynamic range and limit of detection of DEs via sdDE-FACS. (A) Schematic and brightfield and fluorescence images of DE droplets containing multiple concentrations of FITC–BSA. (B and C) Histograms (left) and relationship between measured intensities and concentration for DE droplets measured on the SONY (B) and Aria (C) sorters (2500 events per condition). (D) Schematic and bright field and fluorescence images of DE droplets containing multiple concentrations of Alexa647–BSA. (E and F) Histograms (left) and relationship between measured intensities and concentration for DE droplets measured on the SH800 (E) and Aria II (F) sorters (2500 events per condition). | ||
Signal variance of labelled droplet populations (peak width of each population across the calibration series) shown in both dye calibration series (Fig. 3) is significantly narrower than previously reported for double emulsion flow cytometry45 (0.1 decade peak width compared to ∼1 decade peak width for 0.1 μg mL−1 FITC–BSA using the Aria II: a ∼10-fold improvement in signal discrimination), allowing for more precise quantification of both high- and low-range signals than prior DE FACS methods. The number of photons emitted by individual cells stained with common dyes is equivalent to the 1–10 μg mL−1 range of these calibration series (as determined by microscopy), establishing that sdDE-FACS should be compatible with typical single-cell assays.
2.6 Target enrichment for DE-FACS sorting
After detection, accurate sorting of individual DE droplets requires the ability to detect a DE of interest and then deflect that particular droplet, encapsulated in sheath buffer, into a destination well of an output plate (i.e. the sample stream must break into individual droplets containing DEs with the registration maintained so that the correct DE target is enriched in the destination well) (Fig. 2B). This registration depends on a calibrated droplet delay, which sets the delay time between when a DE droplet passes through the laser excitation and when charge is applied to target droplets after they leave the nozzle and reach the stable breakoff point.44 To determine the drop delay, both instruments use small (<10 μm) non-deformable calibration beads during instrument setup (e.g. AccuDrop beads). If a droplet delay is correct for a particle sample, sort efficiencies for that particle will be maximally efficient at that delay, without a reduction in target specificity such that the correct particle population is targeted, deflected, and recovered post-sort.51 Sorting efficiency is calculated as a percentage of the number of recovered particles (in this case, DEs) as compared to the number of desired particles targeted for sorting. Typical single-cell FACS sort efficiencies range from 50–90% by cellular type and size, with lower sorting efficiencies for larger particles.35,42,50–52 For the SH800, the bead-calibrated droplet delay was optimal for DE post-sort recovery efficiency for all droplet populations. By contrast, sorting efficiency on the Aria II was optimal at droplet delays significantly different from the Accudrop values, likely due to different flow metering and acoustic breakoff mechanisms between the two instruments (Fig. S7†). To derive appropriate droplet delay values for the Aria II, we therefore performed an additional calibration step for manual delay assessment to obtain maximally efficient DE sorting (see methods).To demonstrate the ability of sdDE-FACS to accurately select and sort rare targets, we attempted to enrich for a population of FITC–BSA-loaded DE droplets present at 20.4% in a parent population of blank DE droplets using optimal droplet delay times on both sorters (Fig. 4). Brightfield and fluorescence images of pre-sort droplet populations confirmed that FITC–BSA droplets were present at the target mixed abundance (Fig. 4A and B) and side vs. forward scatter profiles on the SH800 and Aria II showed a distinct cluster of DE droplets for the mixed population (Fig. 4C and D). Investigation of measured FITC intensities revealed clearly separated populations of blank and FITC-positive droplets, with estimates of dye-containing droplet populations consistent with expectations on both instruments (18.0% and 18.5% for the SH800 and Aria II, respectively) (Fig. 4C and D). Results were also consistent across different flow cell geometries (square flow cell replicate, Fig. S8†). Post-sort, both the Aria II and SH800 showed near-perfect enrichment of intact DE droplets in the target population (>98.9% and >99.9%, respectively, with 0 false positives observed over multiple fields of view for the SH800) (Fig. 4C and D). These results confirm the ability to selectively enrich post-sort for “rare” droplet populations with high target specificity via sdDE-FACS.
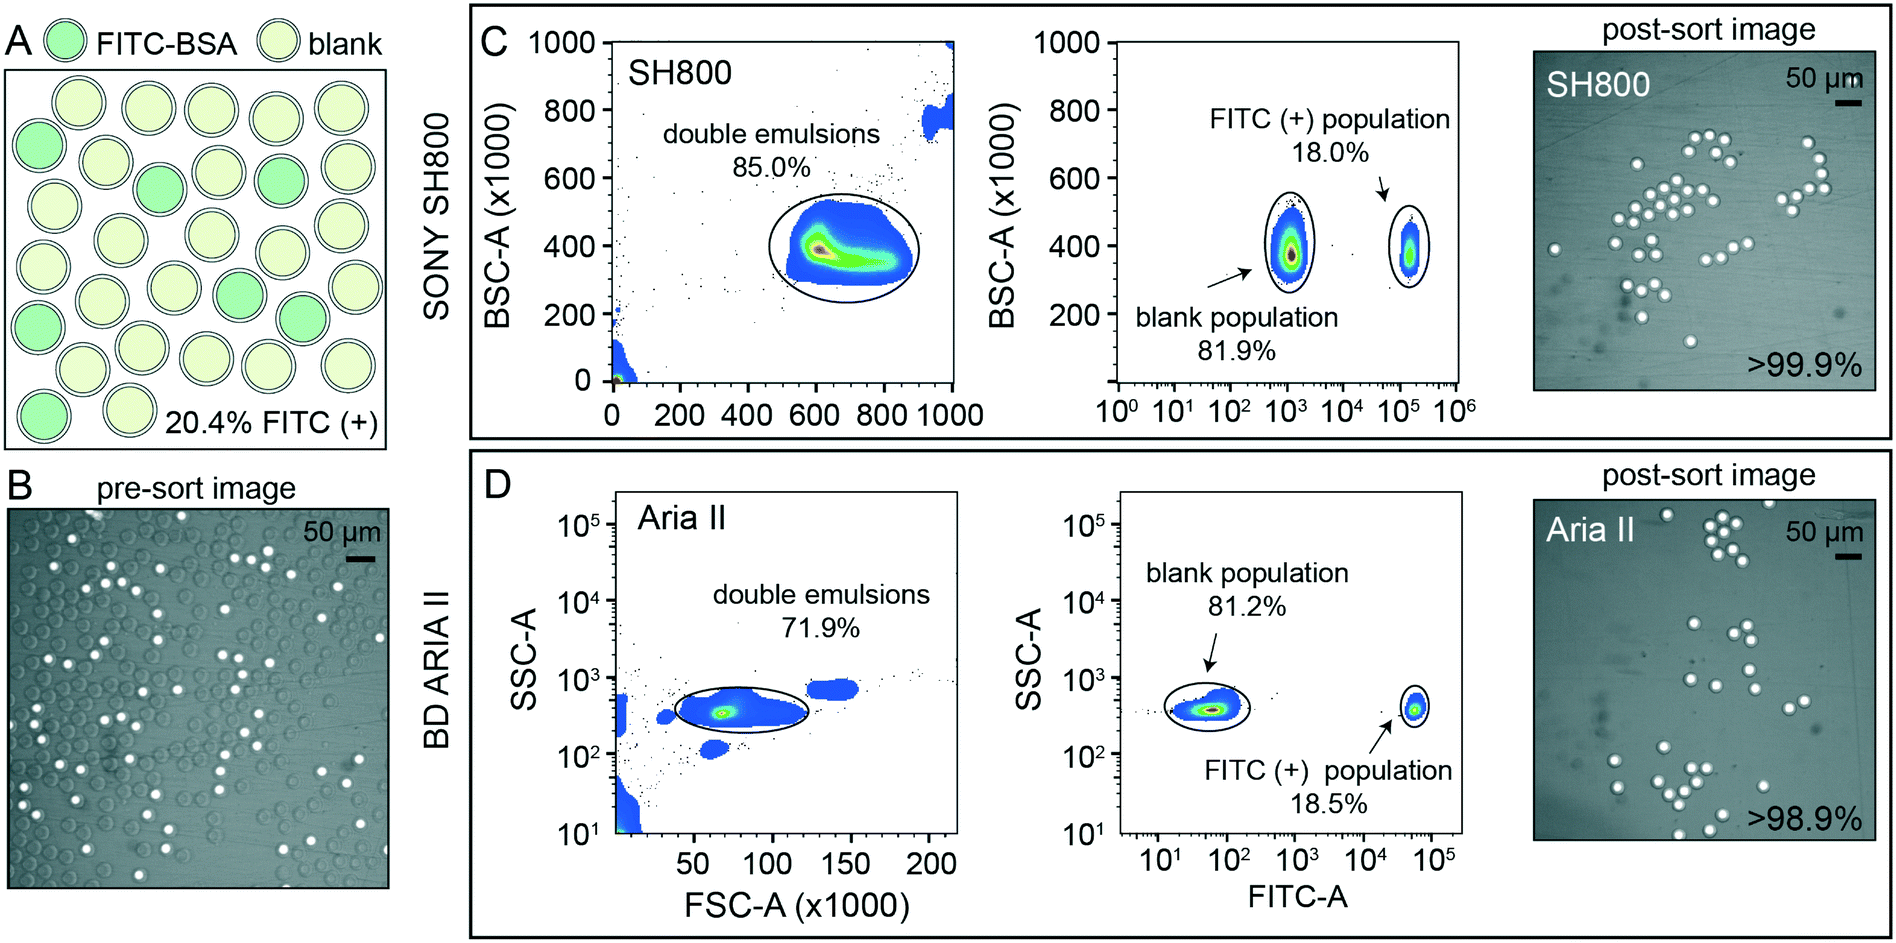 | ||
| Fig. 4 Rare population target enrichment via sdDE-FACS. (A and B) Schematic and microscopy image of pre-sort DE droplet populations containing 20.4% FITC-positive droplets as determined by manual count (62/303 droplets positive). (C) SH800 FACS gates and post-sort image of 100 droplet well with associated target enrichment sensitivity. (D) Aria II FACS gates and post-sort image of 100 droplet well with associated target enrichment sensitivity. Parental FACS gate shows 10000 events per condition, randomly sampled, for both sorters. | ||
2.7 Single droplet sorting using DE-FACS
Accurately linking genotype to phenotype for individual selected variants at high-throughput requires that droplet recovery be maximally sensitive in selecting for the correct variant from a mixed population. However, to enable high-throughput single-cell droplet applications, such as single cell sequencing from droplet microreactors, droplet sorting must also be maximally efficient (i.e. as many wells as possible are occupied by a single DE droplet). Further, droplets must also remain intact during sorting to prevent cross-contamination of material between wells. To quantify sorting efficiency, we generated populations of DE droplets and attempted to sort 100, 10, or 1 droplets into alternating wells of a 96-well destination plate containing fluid osmotically matched to the DE droplet core (Fig. 5). Empty wells systematically interspersed between destination wells enabled testing for spray-based DE droplet cross-contamination. After FACS droplet deposition, we imaged all wells and manually counted the number of recovered droplets (Fig. 5B).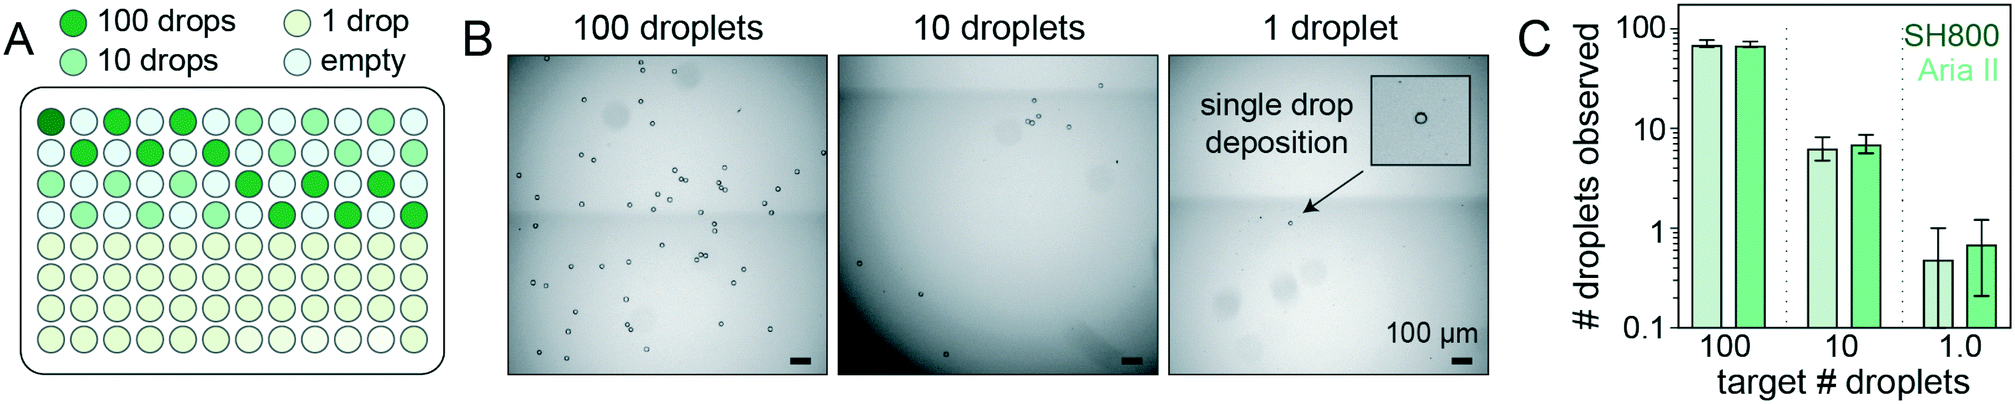 | ||
| Fig. 5 Plate-sorting statistics for DE droplets using sdDE-FACS workflow. (A) Schematic showing an target FACS droplet deposition in a 96-well plate (exemplary plate format; some plate formats contain greater or fewer 100, 10, or 1 droplet target wells, as noted). (B) Brightfield images of individual wells within a deep-well optical 96-well after sorting to deposit 100, 10, or 1 FACS droplets (each containing a single DE droplet). (C) 96-Well plate sorting statistics for a representative DE droplet population. Mean and SD error bars shown. Means by set point (Aria II, SH800): 100 droplets (71.2, 69.9; n = 11–12 wells), 10 droplets (6.1, 7.1; n = 36 wells), 1 droplet (0.5, 0.71; n = 24 wells). Additional plate statistics are available in Table S3.† | ||
Across droplet populations and for each plate, wells designed to contain 100 or 10 droplets contained (64.4–83.6) and (5.9–8.4) average droplets (n = 12–36 wells per plate per 100- or 10-droplet set points, respectively; range shown for multiple population averages) for the Aria II. For the SH800, wells designed to contain 100 or 10 droplets contained (46.2–69.9) and (4.9–7.1) average droplets (n = 12–36 wells per plate per 100- or 10-droplet set points, respectively), across droplet populations, for an estimated achievable droplet recovery rate of 60–80% for both instruments (Fig. 5C and Table S3†). These estimates represent the first reported quantitative sort efficiencies for DE post-sort recovery via FACS. Droplet size and oil shell thickness had only slight effects on sort efficiency after adjusted droplet delay (Table S3 and Fig. S7†). Imaged droplets remained intact (Fig. S9†) and, out of 193 total wells, only 5 negative control wells designated to contain 0 droplets were observed to contain a droplet.
Most importantly, single DE droplets can be reliably sorted and recovered using the optimized FACS parameters and droplet formulations of sdDE-FACS. Wells designated to receive a single DE followed a bimodal occupancy distribution where wells either contained a single deposited droplet or no droplet at all (Fig. 5C and 6B). Single droplet recovery efficiencies were typically ∼70% (between 0.50 and 0.83 average droplets, n = 36–48 single droplet wells per plate, range indicates multiple population averages), with the highest sort efficiency (83%) observed on the Aria II (Table S3†). Single droplet isolation has not previously been demonstrated quantitatively in DE literature (Table S2†).47 Single droplet plate counts (Fig. 5C and Table S3†) are consistent with prior recovery efficiency estimates for single-cell deposition via FACS,50–52 suggesting sdDE-FACS has reached instrument limits.
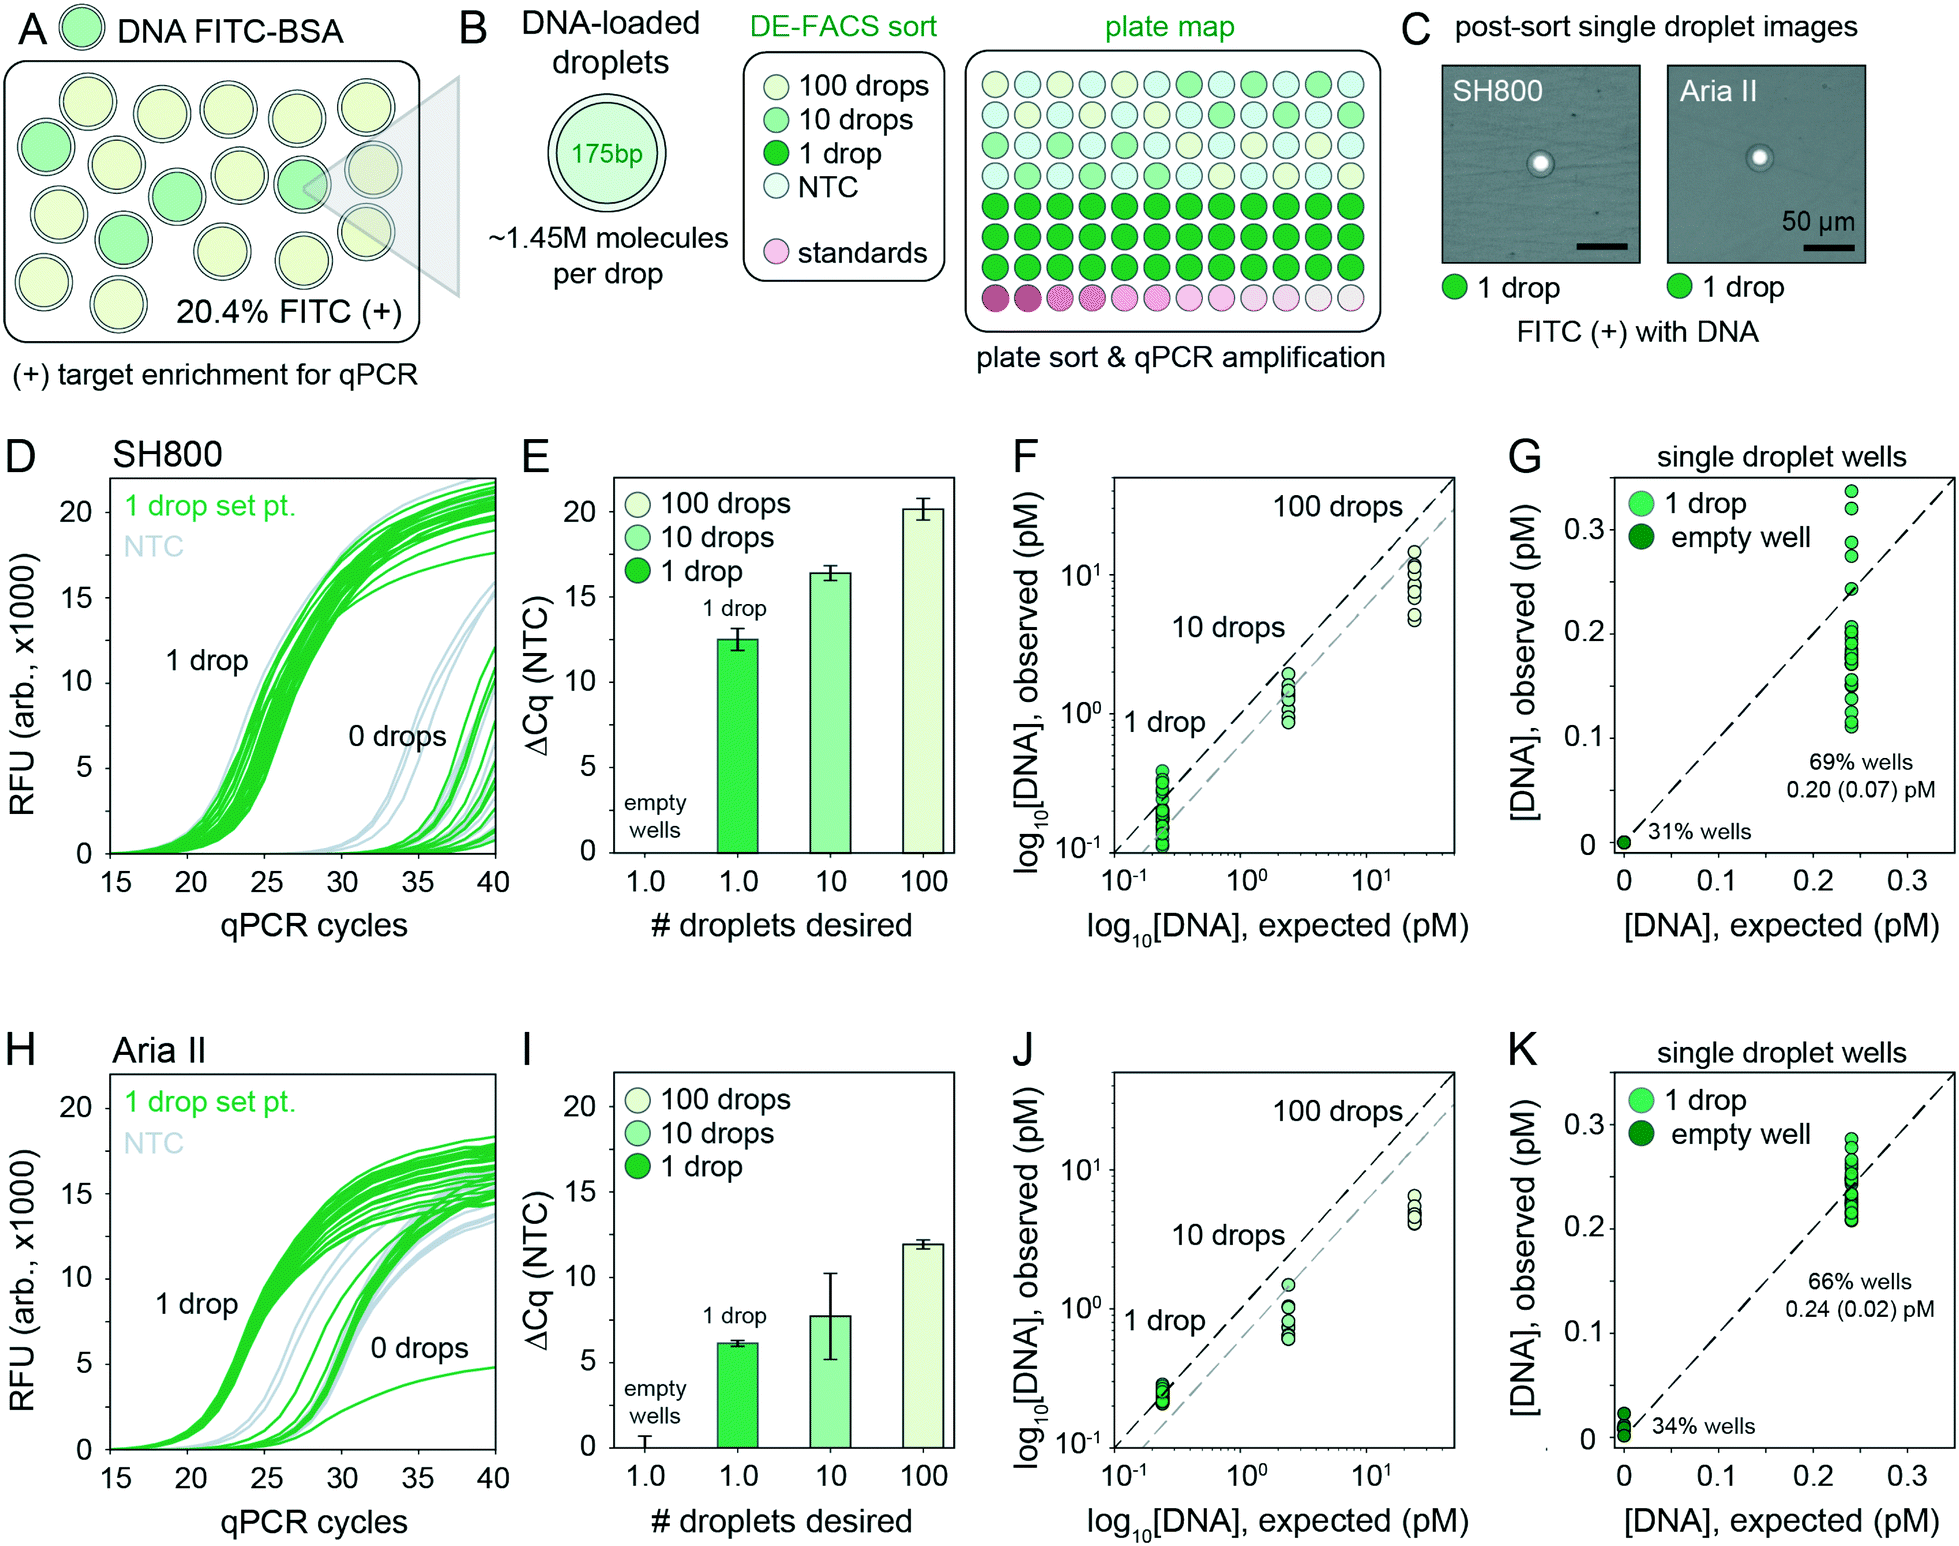 | ||
| Fig. 6 Downstream nucleic acid recovery and qPCR processing of DE droplets with sdDE-FACS. (A) Mixed populations containing DNA-loaded DEs labelled with FITC–BSA in a pool of blank droplets. (B) Plate map schematic for the qPCR assay (10 μL reactions). (C) Optical confirmation of post-sort enrichment for the SH800 and Aria II on single droplet wells. (D and H) Raw qPCR traces for single droplet wells (n = 36 wells per plate) for the SH800 and Aria II, respectively. (E and I) Cycling thresholds (NTC subtracted) for all droplet-designated wells for the SH800 and Aria II. (F and J) Absolute quantification using in-plate DNA standards for 100, 10, and 1 droplet per well set points with further analysis of single droplet designated wells, (G and K), as clustered by bimodal sorting statistics for the SH800 and Aria II, respectively. Mean (SD) recovered DNA concentrations are indicated; expected concentration is 0.24 pM per well. Each point represents an individual well measurement. | ||
2.8 Genotyping of double emulsions using DE-FACS
Successfully linking genotype to phenotype for individual variants via downstream nucleic acid interrogation assays (e.g. qPCR or next-generation sequencing) is a critical application of single cell FACS.39,40,43 Enabling similar capabilities for single DE droplet microreactors requires that DNA be recoverable from each droplet post-sort without loss of material or cross-contamination from breakage during sorting. Prior work on DE FACS has been unsuccessful in performing qPCR or sequencing on single, sorted double emulsions, relying instead on differential enrichment techniques which cannot directly link droplet genotype to phenotype.7,47To quantify nucleic acid recovery and sensitively detect cross-contamination, we generated a library of DE droplets (27.8 μm total diameter, 16.6 μm core) each containing ∼1.45 million molecules of a small 175-bp DNA fragment (a portion of the coding sequence for the GAPDH housekeeping gene) and 10 μg mL−1 FITC–BSA. DNA-containing DEs were mixed into a blank DE population of the same droplet size (Fig. 6A). Using the Aria II and SH800 cytometers, we then sorted 100, 10, or 1 DE droplets, targeted by FITC fluorescence, into alternating wells of a destination plate with in-plate DNA standards and systematically interspersed empty wells (Fig. 6B). Target droplet recovery efficiency was confirmed optically for each sort (Fig. 6C). DE droplets were lysed by depositing FACS-generated aerosolized droplets (containing single target DE droplets) into dry wells of a multiwell plate and allowing changing interfacial tension to drive lysis. This process took ∼30 seconds (Fig. S10†) and outperformed previously published methods that rely on bath sonication or chemical breakage of the emulsion (a known inhibitor of PCR).13,59 To sensitively quantify DNA recovery, we then performed plate-based qPCR using GAPDH-specific primers (Fig. 6D).
Across both instruments, cycle thresholds (Cq) for wells designed to contain 100 or 10 droplets cluster tightly within each group, with a lower spread across all droplet set points observed on the SH800 (Fig. 6E and I). Absolute quantification of the amount of DNA recovered from each well using in-assay standards demonstrates full recovery of all DNA from single DE droplets (1:1 line, Fig. 6F and J), a significant improvement from prior attempts unable to recover DNA from below 10 droplets.47 Between 1 and 10 droplet-containing wells we observe an expected near 10-fold increase in recovered DNA that reflects the observed 60–70% bulk sort recovery efficiency (Fig. 6F and J, blank line indicates 100% sort efficiency, grey line indicates projected 60% sort efficiency). Between the 100 and 10 droplet samples, further reduced recovery of nucleic acids beyond sort inefficiencies is likely due to decreased droplet lysis using the dry plate technique (Fig. S10†); 30–60 s of drying time is likely insufficient to fully evaporate 100 “FACS droplets,” each 6.9 nL in volume (total volume: 0.69 μL). Octanol extraction (using PFO) or similar bulk-based droplet lysis techniques may perform better in 100+ droplet recovery regimes.13,59
Of critical importance, nucleic acid recovery via sdDE-FACS reliably reproduces expected DNA concentrations for single droplets at high sort efficiencies (69%, SH800; 66% Aria II, single droplet isolation, Fig. 6G and K). qPCR traces for wells targeted to contain a single DE droplet show bimodal clustering consistent with optically-derived plate sorting statistics, with >60% of single droplet wells showing tightly clustered qPCR amplification traces above NTC (remaining single droplet wells cluster with no template negative control wells suggesting 0 droplet occupancy, Fig. 6D and H). Further investigation of single droplet wells with 1 or 0 droplet occupancy reveals excellent concordance with expected DNA concentration in wells containing a single droplet (0.20 ± 0.07 pM, SH800; 0.24 ± 0.02 pM, Aria II; 0.24 pM, expected), establishing full recovery of encapsulated DNA (Fig. 6F and J). Results are consistent across replicates and additional populations (Fig. S11†). These data indicate successful, complete recovery of nucleic acids via downstream qPCR in isolated single DEs via sdDE-FACS.
Conclusions
Here, we have demonstrated a high-throughput method (sdDE-FACS) capable of quantitatively phenotyping, sorting, and recovering nucleic acids from double emulsion droplet populations or individual droplets using standard FACS cytometry. The ability to robustly analyze and isolate single droplets via FACS increases sorting throughput and speed by 2 orders of magnitude relative to typical FADS-based sorting.18,21,23,25 Further, sorting individual droplets with FACS makes it possible to sensitively detect signals across multiple (up to 18) channels simultaneously, which is currently impossible using FADS-based techniques.2,28,32,33 As microfluidic droplet generation is a high-throughput process (1–100 M droplets per reaction; 10–30 kHz production rates), this increased plate sorting throughput, signal discrimination, and ease-of-access of sdDE-FACS realizes the full potential of droplet microfluidics for high-throughput screening of rare variants.sdDE-FACS also significantly lowers the barrier to entry for new droplet sorting assays, with no need for specialized equipment beyond that typically available at many universities and companies. The syringe pumps and setup used for emulsion generation are inexpensive and widely available. Further, we demonstrate that sdDE-FACS is compatible with 2 industry-standard sorting instruments, increasing the ease of translation of droplet sorting beyond microfluidic specialists. To facilitate broad adoption across labs, we provide detailed information about optimized instrument settings (laser settings, flow rates, and drop delays) and droplet formulations (surfactant, oil, and buffer mixtures) used for our workflow.
sdDE-FACS enables sensitive droplet phenotyping and single droplet isolation by several critical departures from previous droplet FACS attempts, with guidance from suggestions in both empirical and theoretical droplet sorting literature, including use of a large sort nozzle and low flow rates to reduce shear, adjustment of FACS parameters such as delay time and scatter thresholds to increase sort accuracy and target selection, and optimization of droplet surfactant formulations to reduce breakage during sorting. Using these optimizations, sdDE-FACS achieves 1) >25% increase in sorting throughput to prior work,45 with observed droplet breakage during sorting reduced from as high as 60% in literature7 to near-absent in our post-recovery images, 2) a 10-fold improved signal sensitivity to prior work45 and 5 orders of magnitude of droplet signal discrimination, 3) >70% droplet sort recovery efficiency, previously undemonstrated in droplet FACS literature and equivalent to cellular isolation efficiency limits in single cell FACS,29,42,50–52 4) >99% target specificity in DE variant identification, selection, and downstream isolation via FACS.
Beyond enhancing the throughput, sensitivity, and accessibility of droplet sorting, sdDE-FACS represents a critical first step towards realizing a broad suite of novel single-cell analysis assays. As one example, difficulties associated with buffer exchange in droplet microfluidics have limited the number of tandem assays that can be performed on the same single cell, requiring that researchers first identify a single buffer moderately compatible with both assays by tedious trial and error. sdDE-FACS enables a broad range of new “multi-omic” assays by making it possible to perform a first assay within a microfluidic droplet and then transfer this droplet to a well of a destination plate containing a second buffer.38,43,60–62 As the destination well contains a significantly higher volume than the droplet (∼10000×), this results in near complete buffer exchange and enables optimal performance of both reactions. This scheme also preserves the ability to link any quantitative fluorescent phenotype to cellular measurements, facilitating analyses of single-cell intracellular proteins, secreted proteins, labelled nucleic acids, or cellular activity (e.g. pH change or treatment response). If combined with existing droplet single cell genomic and transcriptomic measurements,3,12,13,59 cellular phenotype and genotype could be directly linked within each microreactor. The stringent single droplet isolation as enabled by sdDE-FACS also enhances existing DE assays (e.g. high throughput enzyme and functional product screening).2,5,63
Similar to the trajectory of single cell FACS, we anticipate this technique will pave the way for a wide variety of novel, highly quantitative droplet assays that link variant phenotype to genotype.
Materials and methods
Double emulsion device fabrication
Monodisperse DEs were generated using a one-step co-axial dual flow focusing device with flow filters and a flow resistor, similar in design to previous reports55,56 (Fig. S1†). Microfluidic Si wafer master molds were constructed using standard photolithography techniques with a 15 μm relief height for the first flow focuser (to generate water-in-oil emulsions) and a 40 μm relief height for the second flow focuser junction (to generate water-in-oil-in-water emulsions) using 2-layer SU8 2015 deposition prior to a development step. Poly(dimethylsiloxane) (PDMS) microfluidic devices were fabricated from the master molds using soft lithography at a 1:5 elastomer base:crosslinker ratio. Post-bake, droplet generation devices were hole punched using a 1 mm biopsy punch (PicoPunch) and monolithically bonded to a blank 1:10 PDMS slab (5 cm in height). Devices were baked for 48 hours, with longer baking times improving hydrophobicity of the resultant droplet generation devices. Immediately prior to generating double emulsions, the device outlet path was selectively O2 plasma treated for 4.5 min at 150 W plasma (Femto, Diener) by taping device inlets. This process allowed for the outer flow focuser of the device to switch to hydrophilic wettability while retaining hydrophobicity at the first flow focusing junction.56
Double emulsion generation
Double emulsions were generated using 3 syringe pumps (PicoPump Elite, Harvard Apparatus) for the inner, oil, and carrier fluids. The inner phase for the aqueous droplet core was composed of Tween-20 (Sigma) in PBS (Invitrogen), with additional reagents (e.g. FITC–BSA, Invitrogen) as indicated in (Table 1). BSA (0.5–2%) can be optionally substituted for Tween-20 (0.1–1%) in the droplet core to no adverse effect. The oil phase was composed of HFE7500 (Sigma) and ionic PEG-Kyrtox teholtze-biocompatible-2008, sukovich-sequence-2017 (FSH, Miller-Stephenson). The carrier phase contained Tween-20 (Sigma) and Pluronic F68 (Kolliphor P 188, Sigma) in PBS. Each phase was loaded into syringes (PlastiPak, BD; Hamilton, Sigma, see ESI† extended methods), and connected to the device via PE/2 tubing (Scientific Commodities). Typical flow rates were 275:75:2500 (oil:inner core:outer aqueous sheath) μL h−1. Droplet generation was monitored and recorded via a stereoscope (Amscope) and high-speed CMOS camera (ASI 174MM, ZWO) (Fig. S1†).
Preparation of double emulsions and instruments for FACS
Prior to FACS sorting, double emulsions were diluted 1:5 in FACS diluent buffer in a 12 × 75 mm round bottom FACS tube (BD Biosciences). For a typical run, 100 μL of double emulsion droplets were removed from the droplet pellet (containing high surfactant outer mix) and adding them to 500 μL of FACS diluent. Droplets were gently resuspended before analysis. See extended methods in ESI† for further discussion. Both instruments were thresholded on forward scatter, FSC, a sizing parameter, at extremely low values since DE droplets are large compared to typical cells (Table 1). Sort gates were widely permissive to show droplet purity (including sample free oil and dust, if present) compared to background. Thresholding is indicated in figure legends, if applicable. Event rates were capped below 300 events per s during sorting and 1000 events per s during analysis-only runs by modulating flow rate or flow pressure; the initial appearance of DE droplets for the Sony SH800 was typically delayed 100–200 s (see extended methods, Fig. S3†). All post-processing analysis was completed in FlowJo v10.5.3 (FlowJo) and using custom Python scripts.
FACS analysis on Aria II (BD)
DEs were loaded and analyzed on the FACS Aria II (BD) using a 1.5 ND neutral density filter in the optical path to visualize the droplet population and a 130 μm nozzle for sorting. Droplets were first gated on FSC and SSC profile, followed by singlet gating using FSC-H and FSC-A and subsequent gating on APC, FITC or DAPI fluorescence, as indicated. All flow and thresholding parameters are reported in Table 2. Sorts were completed with single cell purity mode.FACS analysis on SH800 (Sony)
DEs were loaded and analyzed on the FACS SH800 (Sony) using a standard 408 nm laser configuration and a 130 μm microfluidic chip for sorting. Droplets were first gated on FSC and SSC profile, followed by singlet gating using FSC-H and FSC-A and subsequent gating on APC, FITC or DAPI fluorescence, as indicated. All flow and thresholding parameters are reported in Table 2. Sorts were completed with single cell purity mode.Plate sorting of double emulsions
Plate sorting was conducted using 96-well optical plates (Fisher Scientific) or qPCR plates (Biorad) on the Aria II and SH800 using associated 96-well plate gantries for each instrument. Prior to sorting, 100 μL of osmotically-balanced outer phase buffer was loaded into each well. Optimal drop delay was calculated for the Aria II instrument by using a blank droplet population, run the same day as the sample of interest. A protocol is available in ESI† methods. Briefly, blank droplets were sorted at set point of 50 droplets per well after Accudrop calibration and laser compensation, with each well corresponding to a different droplet delay setting (manually input) from −2.5 to +2.5 delay units in increments of 0.25 delay units from the Accudrop automatic droplet delay (Fig. S7†). Droplets were manually counted using a low-cost benchtop stereoscope (Amscope) to decide on the highest efficiency drop delay per the population; the process takes ∼5–10 minutes and is a recommended step in calibration. Plate statistics were determined by 96-well optical images (EVOS microscope, 4× objective, Life Technologies) and manual counting. High-resolution droplet imaging used for size analysis and visualization was conducted using a Ti Eclipse microscope (Nikon) and sCMOS camera (Zyla 4.2, Andor) at 10× (16-bit, low-noise) with Brightfield Dichroic and eGFP filter sets (Semrock).Nucleic acid recovery and droplet genotyping
qPCR assays were conducted using the iTaq SYBR I qPCR master mix (BioRad) on a CX96 qPCR instrument (Biorad). Primers and fragment sequences are available in Table S4.† Droplets were lysed into a dry qPCR plate (Biorad) (see extended methods, Fig. S10†) for 1 min post-sort. Immediately after, 10 μL reaction mix Table S5† was added per well as shown in (Fig. 6A) and in-assay standards were added subsequently in the remaining row. The reaction was thermocycled according to the following program: 2 min 95C, [95C 0:05 s, 60 s 0:30 s] × 50. A melt curve with 2C increments from 65C–95C was performed after each run to distinguish on-target amplification from primer-dimer amplification.
Droplet size characterization
Droplets were characterized via a custom MATLAB script available via our Open Science Framework repository; methods are outlined in ESI.†Open Science Framework repository
An OSF repository is available for this project containing data, images, and associated software for this method, and is located at DOI: http://10.17605/OSF.IO/3AU4V.Author contributions
K. K. B, S. K., and P. M. F. conceived and designed the study. K. K. B. designed the methodology. K. K. B. and C. C. C. performed experiments with assistance from B. C. and S. G. K. C., G. K. and K. B. contributed software. S. K. and B. C. contributed resources. K. B., C. C. C., B. C., S. G. K. C., and G. K. conducted formal analysis, data curation, and validation, with input from L. N. and P. M. F., K. K. B., L. N., and P. M. F. wrote the manuscript, with input from all authors.Conflicts of interest
Methods and techniques outlined in this work are disclosed in a U.S. patent filing, U.S. PTO Application No. 62/693800, filed by co-authors K. K. B, S. K., and P. M. F.Acknowledgements
We acknowledge Dr. David Sukovich and Dr. Adam Abate for early discussions related to optimizing droplet FACS, demonstration of their flow cytometry workflow, and for the use of their device design. We also acknowledge Dr. David Parks, Dr. Lee Herzenberg, Dr. Aaron Cantor, and the Stanford Shared FACS facility for project guidance, advice, and technical support. We thank the Fordyce Laboratory and the Wang Laboratory, in particular Margarita Khariton, for their critical feedback and comments on the review of this manuscript. We additionally thank the Stanford FACS Core for use of their instruments and facilities as well as the Stanford Protein and Nucleic Acid (PAN) facility, in particular Dr. Mike Eckhart, for use of the Life Technologies EVOS microscope. K. K. B. acknowledges funding as Chem-H CBI fellow (NIH T32 GM 120007), an NSF GFRP fellow, and a Siebel Scholar. This work was supported by NIH grant 1DP2GM123641, and P. M. F. is a Chan Zuckerberg Biohub Investigator.References
- T. M. Tran, F. Lan, C. S. Thompson and A. R. Abate, J. Phys. D: Appl. Phys., 2013, 46, 114004 CrossRef
.
- E. Mastrobattista, V. Taly, E. Chanudet, P. Treacy, B. T. Kelly and A. D. Griffiths, Chem. Biol., 2005, 12, 1291–1300 CrossRef CAS PubMed
- P. Shahi, S. C. Kim, J. R. Haliburton, Z. J. Gartner and A. R. Abate, Sci. Rep., 2017, 7, 44447 CrossRef CAS PubMed
- J. J. Agresti, E. Antipov, A. R. Abate, K. Ahn, A. C. Rowat, J.-C. Baret, M. Marquez, A. M. Klibanov, A. D. Griffiths and D. A. Weitz, Proc. Natl. Acad. Sci. U. S. A., 2010, 107, 4004–4009 CrossRef CAS PubMed
- A. Aharoni, G. Amitai, K. Bernath, S. Magdassi and D. S. Tawfik, Chem. Biol., 2005, 12, 1281–1289 CrossRef CAS PubMed
- L. Granieri, J.-C. Baret, A. D. Griffiths and C. A. Merten, Chem. Biol., 2010, 17, 229–235 CrossRef CAS PubMed
- D. J. Sukovich, S. T. Lance and A. R. Abate, Sci. Rep., 2017, 7, 39385 CrossRef CAS PubMed
- H. F. Chan, S. Ma, J. Tian and K. W. Leong, Nanoscale, 2017, 9, 3485–3495 RSC
- J. Q. Boedicker, L. Li, T. R. Kline and R. F. Ismagilov, Lab Chip, 2008, 8, 1265 RSC
- J. Clausell-Tormos, D. Lieber, J.-C. Baret, A. El-Harrak, O. J. Miller, L. Frenz, J. Blouwolff, K. J. Humphry, S. KÃűster, H. Duan, C. Holtze, D. A. Weitz, A. D. Griffiths and C. A. Merten, Chem. Biol., 2008, 15, 427–437 CrossRef CAS PubMed
- S. C. Kim, I. C. Clark, P. Shahi and A. R. Abate, Anal. Chem., 2018, 90, 1273–1279 CrossRef CAS PubMed
- C. A. Lareau, F. M. Duarte, J. G. Chew, V. K. Kartha, Z. D. Burkett, A. S. Kohlway, D. Pokholok, M. J. Aryee, F. J. Steemers, R. Lebofsky and J. D. Buenrostro, Nat. Biotechnol., 2019, 37, 916–924 CrossRef CAS PubMed
- E. Macosko, A. Basu, R. Satija, J. Nemesh, K. Shekhar, M. Goldman, I. Tirosh, A. Bialas, N. Kamitaki, E. Martersteck, J. Trombetta, D. Weitz, J. Sanes, A. Shalek, A. Regev and S. McCarroll, Cell, 2015, 161, 1202–1214 CrossRef CAS PubMed
- D. J. Eastburn, A. Sciambi and A. R. Abate, Anal. Chem., 2013, 85, 8016–8021 CrossRef CAS PubMed
- H.-D. Xi, H. Zheng, W. Guo, A. M. Ganan-Calvo, Y. Ai, C.-W. Tsao, J. Zhou, W. Li, Y. Huang, N.-T. Nguyen and S. H. Tan, Lab Chip, 2017, 17, 751–771 RSC
- L. Mazutis, J. Gilbert, W. L. Ung, D. A. Weitz, A. D. Griffiths and J. A. Heyman, Nat. Protoc., 2013, 8, 870–891 CrossRef CAS PubMed
- I. C. Clark and A. R. Abate, Lab Chip, 2017, 17, 2032–2045 RSC
- A. Sciambi and A. R. Abate, Lab Chip, 2015, 15, 47–51 RSC
- A. Zinchenko, S. R. A. Devenish, B. Kintses, P.-Y. Colin, M. Fischlechner and F. Hollfelder, Anal. Chem., 2014, 86, 2526–2533 CrossRef CAS PubMed
- J.-C. Baret, Y. Beck, I. Billas-Massobrio, D. Moras and A. D. Griffiths, Chem. Biol., 2010, 17, 528–536 CrossRef CAS PubMed
- P.-Y. Colin, B. Kintses, F. Gielen, C. M. Miton, G. Fischer, M. F. Mohamed, M. Hyvonen, D. P. Morgavi, D. B. Janssen and F. Hollfelder, Nat. Commun., 2015, 6, 10008 CrossRef CAS PubMed
- J.-C. Baret, O. J. Miller, V. Taly, M. Ryckelynck, A. El-Harrak, L. Frenz, C. Rick, M. L. Samuels, J. B. Hutchison, J. J. Agresti, D. R. Link, D. A. Weitz and A. D. Griffiths, Lab Chip, 2009, 9, 1850 RSC
- F. Gielen, R. Hours, S. Emond, M. Fischlechner, U. Schell and F. Hollfelder, Proc. Natl. Acad. Sci. U. S. A., 2016, 113, E7383–E7389 CrossRef CAS PubMed
- H. Zhou and S. Yao, Lab Chip, 2013, 13, 962 RSC
- R. H. Cole, S.-Y. Tang, C. A. Siltanen, P. Shahi, J. Q. Zhang, S. Poust, Z. J. Gartner and A. R. Abate, Proc. Natl. Acad. Sci. U. S. A., 2017, 114, 8728–8733 CrossRef CAS PubMed
- L. A. Herzenberg, R. G. Sweet and L. A. Herzenberg, Sci. Am., 1976, 12 Search PubMed
- E. Lugli, M. Roederer and A. Cossarizza, Cytometry, Part A, 2010, 77, 705–713 CrossRef PubMed
- L. A. Herzenberg, J. Tung, W. A. Moore, L. A. Herzenberg and D. R. Parks, Nat. Immunol., 2006, 7, 681–685 CrossRef CAS PubMed
- J. Picot, C. L. Guerin, C. Le Van Kim and C. M. Boulanger, Cytotechnology, 2012, 64, 109–130 CrossRef PubMed
- S. P. Perfetto, P. K. Chattopadhyay and M. Roederer, Nat. Rev. Immunol., 2004, 4, 648–655 CrossRef CAS PubMed
- S. C. De Rosa, L. A. Herzenberg, L. A. Herzenberg and M. Roederer, Nat. Med., 2001, 7, 245–248 CrossRef CAS PubMed
- P. K. Chattopadhyay and M. Roederer, Am. J. Transplant., 2015, 15, 1155–1161 CrossRef CAS PubMed
- J. P. Robinson and M. Roederer, Science, 2015, 350, 739–740 CrossRef CAS PubMed
- P. K. Chattopadhyay and M. Roederer, Cytometry, Part A, 2010, 77, 614–622 CrossRef PubMed
- S. Picelli, A. K. Bjorklund, O. R. Faridani, S. Sagasser, G. Winberg and R. Sandberg, Nat. Methods, 2013, 10, 1096–1098 CrossRef CAS PubMed
- A. Gross, J. Schoendube, S. Zimmermann, M. Steeb, R. Zengerle and P. Koltay, Int. J. Mol. Sci., 2015, 16, 16897–16919 CrossRef CAS PubMed
- P. Hu, W. Zhang, H. Xin and G. Deng, Front. Cell Dev. Biol., 2016, 4 DOI:10.3389/fcell.2016.00116
- P. Angerer, L. Simon, S. Tritschler, F. A. Wolf, D. Fischer and F. J. Theis, Current Opinion in Systems Biology, 2017, 4, 85–91 CrossRef
- T. Kalisky and S. R. Quake, Nat. Methods, 2011, 8, 311–314 CrossRef CAS PubMed
- A.-E. Saliba, A. J. Westermann, S. A. Gorski and J. Vogel, Nucleic Acids Res., 2014, 42, 8845–8860 CrossRef CAS PubMed
- L. A. Herzenberg, D. Parks, B. Sahaf, O. Perez, M. Roederer and L. A. Herzenberg, Clin. Chem., 2002, 9 Search PubMed
- P. K. Chattopadhyay and M. Roederer, Methods, 2012, 57, 251–258 CrossRef CAS PubMed
- T. Stuart and R. Satija, Nat. Rev. Genet., 2019, 20, 257–272 CrossRef CAS PubMed
-
H. M. Shapiro, Practical flow cytometry, Wiley-Liss, 4th edn, 2003 Search PubMed
- S. W. Lim and A. R. Abate, Lab Chip, 2013, 13, 4563 RSC
- J. Yan, W.-A. Bauer, M. Fischlechner, F. Hollfelder, C. Kaminski and W. Huck, Micromachines, 2013, 4, 402–413 CrossRef
- S. T. Lance, D. J. Sukovich, K. M. Stedman and A. R. Abate, Virol. J., 2016, 13, 201 CrossRef PubMed
- A. Sciambi and A. R. Abate, Biomicrofluidics, 2013, 7, 044112 CrossRef PubMed
- Y. Zhang, Y.-P. Ho, Y.-L. Chiu, H. F. Chan, B. Chlebina, T. Schuhmann, L. You and K. W. Leong, Biomaterials, 2013, 34, 4564–4572 CrossRef CAS PubMed
- G. W. Osborne, Cytometry, Part A, 2010, 77, 983–989 CrossRef PubMed
- O. R. Rodrigues and S. Monard, Cytometry, Part A, 2016, 89, 594–600 CrossRef CAS PubMed
- C. Stowe, A. Pizzey, T. Kalber, A. Badar, M. Lythgoe and M. Pule, PLoS One, 2015, 10, e0140730 CrossRef PubMed
- C. Holtze, A. C. Rowat, J. J. Agresti, J. B. Hutchison, F. E. Angile, C. H. J. Schmitz, S. Koster, H. Duan, K. J. Humphry, R. A. Scanga, J. S. Johnson, D. Pisignano and D. A. Weitz, Lab Chip, 2008, 8, 1632 RSC
- S. Ma, W. T. S. Huck and S. Balabani, Lab Chip, 2015, 15, 4291–4301 RSC
- A. R. Abate, J. Thiele and D. A. Weitz, Lab Chip, 2011, 11, 253–258 RSC
- S. C. Kim, D. J. Sukovich and A. R. Abate, Lab Chip, 2015, 15, 3163–3169 RSC
- D. J. Sukovich, S. C. Kim, N. Ahmed and A. R. Abate, Analyst, 2017, 142, 4618–4622 RSC
- B. E. McLaughlin, N. Baumgarth, M. Bigos, M. Roederer, S. C. De Rosa, J. D. Altman, D. F. Nixon, J. Ottinger, C. Oxford, T. G. Evans and D. M. Asmuth, Cytometry, Part A, 2008, 73, 400–410 CrossRef PubMed
- A. Klein, L. Mazutis, I. Akartuna, N. Tallapragada, A. Veres, V. Li, L. Peshkin, D. Weitz and M. Kirschner, Cell, 2015, 161, 1187–1201 CrossRef CAS PubMed
- S. L. Klemm, Z. Shipony and W. J. Greenleaf, Nat. Rev. Genet., 2019, 20, 207–220 CrossRef CAS PubMed
- E. Hedlund and Q. Deng, Mol. Aspects Med., 2018, 59, 36–46 CrossRef CAS PubMed
- E. Shapiro, T. Biezuner and S. Linnarsson, Nat. Rev. Genet., 2013, 14, 618–630 CrossRef CAS PubMed
- F. Ma, M. Fischer, Y. Han, S. G. Withers, Y. Feng and G.-Y. Yang, Anal. Chem., 2016, 88, 8587–8595 CrossRef CAS PubMed
Footnote |
| † Electronic supplementary information (ESI) available. See DOI: 10.1039/d0lc00261e |
| This journal is © The Royal Society of Chemistry 2020 |