 Open Access Article
Creative Commons Attribution 3.0 Unported Licence
3-Step flow focusing enables multidirectional imaging of bioparticles for imaging flow cytometry†
Andreas
Kleiber
a,
Anuradha
Ramoji
 ab,
Günter
Mayer
a,
Ute
Neugebauer
acb,
Jürgen
Popp
acb and
Thomas
Henkel
 *a
*a
aLeibniz Institute of Photonic Technology, Albert-Einstein-Straße 9, D-07745 Jena, Germany. E-mail: thomas.henkel@leibniz-ipht.de
bCenter of Sepsis Control and Care (CSCC), Jena University Hospital, Am Klinikum 1, D-07747 Jena, Germany
cInstitute of Physical Chemistry and Abbe Center of Photonics, Helmholtzweg 4, D-07743 Jena, Germany
First published on 13th April 2020
Abstract
Multidirectional imaging flow cytometry (mIFC) extends conventional imaging flow cytometry (IFC) for the image-based measurement of 3D-geometrical features of particles. The innovative core is a flow rotation unit in which a vertical sample lamella is incrementally rotated by 90 degrees into a horizontal lamella. The required multidirectional views are generated by guiding all particles at a controllable shear flow position of the parabolic velocity profile of the capillary slit detection chamber. All particles pass the detection chamber in a two-dimensional sheet under controlled rotation while each particle is imaged multiple times. This generates new options for automated particle analysis. In an experimental application, we used our system for the accurate classification of 15 species of pollen based on 3D-morphological information. We demonstrate how the combination of multi directional imaging with advanced machine learning algorithms can improve the accuracy of automated bio-particle classification. As an additional benefit, we significantly decrease the number of false positives in the classification of foreign particles, i.e. those elements which do not belong to one of the trained classes by the 3D-extension of the classification algorithm.
Introduction
Particles are ubiquitous entities of life and matter and their morphological analysis is an important part of material research, nutrition, health, life sciences, plant breeding and many other fields. Often many particles have to be analysed at once in an automated manner. Information like size, shape, substructure or even specific labels are used. In flow cytometry (FC), each particle is measured while passing through a flow cell. In the last 30 years, conventional flow cytometry has become the gold standard for the high-throughput analysis of particle collections. Here, particles pass a flow cell one after the other to measure their optical properties. For each particle, multiple color channels can be measured, the throughput being more than 100![[thin space (1/6-em)]](https://www.rsc.org/images/entities/char_2009.gif) 000 particles per second. However, with this technique, the spatial distribution of the particles' texture and their compartmentalization cannot be resolved. This limitation has been overcome by imaging flow cytometry (IFC), which provides a microscopic image for each particle and the imaging channel, respectively.1 Different bright field contrast methods can be combined with multichannel fluorescence imaging for up to 12 channels and an imaging rate of up to 5000 cells per second.2,3 Therefore, this method significantly extends conventional flow cytometry by generating detailed information on the compartmentalization and spatial distribution of biomarkers marked with fluorescents in bio-particles.4 A more detailed overview on high-throughput IFC has recently been published by Stavrakis et al.5 However, each image represents only a 2D-projection of a three-dimensional bio-particle, i.e. the data obtained depends on the particular orientation of the particle at the time of imaging. Three-dimensional imaging presents an opportunity to resolve this issue. Many groups are active in developing new concepts for 3D-imaging flow cytometry with enhanced throughput and spatial resolution. In 1999, Reichle et al. captured particles in a three-dimensional micro-electro octopole driven by a rotating electric field in MHz range.6 Later, Chau et al. (2013)7 and Benhal et al. (2014)8 also used AC electric fields for cell rotation. In 2004, Shelby and Chiu used micro vortices for the controlled rotation of biological micro- and nano-particles.9 Kolb et al. used a so-called optical flow rotator to induce a rotation of cells in motion (2015).10 In 2016, Merola et al. combined optical tweezers inducing the self-rotation of sperm cells with digital holography for 3D-imaging.11 A controlled rotation and translation of spherical particles or living cells has been demonstrated by Bernard et al. using surface acoustic waves (2017).12 The acoustic field pressure of ultra-sonic standing waves in combination with digital holography was used by Cacace et al.13 (2019) for the assembly and rotation of erythrocyte aggregates. A concept for label-free imaging flow cytometry using Doppler-spectrally encoded imaging was shown at the Hamamatsu research laboratory and published in 2014 by Iwai et al.14 Recently, Gualda et al. reviewed the use of light-sheet fluorescence microscopy (LSFM) for three-dimensional IFC.15 In 2013, Wu et al. introduced the first LSFM imaging flow cytometer for water quality control.16 In 2019, Han et al. published their camera-less high-throughput 3D-imaging flow cytometer based on a combination of light-sheet scanning illumination and spatial–temporal transformation detection.17 Another approach to create 3D-fluorescence images in flow using slanted channels instead of light sheet illumination has been published by Jagannadh et al. in 2016.18 In contrast to LSFM, here, the stack collection is generated by the samples that come into and out of the focus as they flow through the slanted channel and pass the microscope's imaging field of view. In contrast to this, both Merola19 (2017) and Funamizu20 (2018) performed tomographic imaging flow cytometry of tumbling red blood cells (RBC) using digital holography. The random self-rotation of the RBC is induced automatically by the shear flow of a fluid when the shear rate (
000 particles per second. However, with this technique, the spatial distribution of the particles' texture and their compartmentalization cannot be resolved. This limitation has been overcome by imaging flow cytometry (IFC), which provides a microscopic image for each particle and the imaging channel, respectively.1 Different bright field contrast methods can be combined with multichannel fluorescence imaging for up to 12 channels and an imaging rate of up to 5000 cells per second.2,3 Therefore, this method significantly extends conventional flow cytometry by generating detailed information on the compartmentalization and spatial distribution of biomarkers marked with fluorescents in bio-particles.4 A more detailed overview on high-throughput IFC has recently been published by Stavrakis et al.5 However, each image represents only a 2D-projection of a three-dimensional bio-particle, i.e. the data obtained depends on the particular orientation of the particle at the time of imaging. Three-dimensional imaging presents an opportunity to resolve this issue. Many groups are active in developing new concepts for 3D-imaging flow cytometry with enhanced throughput and spatial resolution. In 1999, Reichle et al. captured particles in a three-dimensional micro-electro octopole driven by a rotating electric field in MHz range.6 Later, Chau et al. (2013)7 and Benhal et al. (2014)8 also used AC electric fields for cell rotation. In 2004, Shelby and Chiu used micro vortices for the controlled rotation of biological micro- and nano-particles.9 Kolb et al. used a so-called optical flow rotator to induce a rotation of cells in motion (2015).10 In 2016, Merola et al. combined optical tweezers inducing the self-rotation of sperm cells with digital holography for 3D-imaging.11 A controlled rotation and translation of spherical particles or living cells has been demonstrated by Bernard et al. using surface acoustic waves (2017).12 The acoustic field pressure of ultra-sonic standing waves in combination with digital holography was used by Cacace et al.13 (2019) for the assembly and rotation of erythrocyte aggregates. A concept for label-free imaging flow cytometry using Doppler-spectrally encoded imaging was shown at the Hamamatsu research laboratory and published in 2014 by Iwai et al.14 Recently, Gualda et al. reviewed the use of light-sheet fluorescence microscopy (LSFM) for three-dimensional IFC.15 In 2013, Wu et al. introduced the first LSFM imaging flow cytometer for water quality control.16 In 2019, Han et al. published their camera-less high-throughput 3D-imaging flow cytometer based on a combination of light-sheet scanning illumination and spatial–temporal transformation detection.17 Another approach to create 3D-fluorescence images in flow using slanted channels instead of light sheet illumination has been published by Jagannadh et al. in 2016.18 In contrast to LSFM, here, the stack collection is generated by the samples that come into and out of the focus as they flow through the slanted channel and pass the microscope's imaging field of view. In contrast to this, both Merola19 (2017) and Funamizu20 (2018) performed tomographic imaging flow cytometry of tumbling red blood cells (RBC) using digital holography. The random self-rotation of the RBC is induced automatically by the shear flow of a fluid when the shear rate (![[small gamma, Greek, dot above]](https://www.rsc.org/images/entities/i_char_e0a2.gif) ) deviates from zero. Villone et al.21 (2018) also used a microfluidic holographic microscope to perform a full-angle tomographic phase microscopy of rolling cells in a straight microfluidic channel.
) deviates from zero. Villone et al.21 (2018) also used a microfluidic holographic microscope to perform a full-angle tomographic phase microscopy of rolling cells in a straight microfluidic channel.
All methods given above can be categorized into three different groups. In the works of the first, the particle rotation for tomographic imaging is induced by fluid mechanics.9,19–21 In the works of the second group, particle rotation is induced by external forces.6–8,10,11,13,14 For the works of the third group, the particles undergo no self-rotation while passing the flow cell.15–18 Despite all the advances outlined above, up to now it remains a challenging task to obtain a 3D-visualization of the particles in an automated high-throughput manner which, however, is often required for a reliable, unambiguous identification of particles in mixed complex suspensions. In this paper, we present a multi-directional imaging flow cytometer (mIFC) which can overcome the shortcomings of implementing high-throughput 3D-imaging in flow cytometry. The main benefits of the 3D-approach are improvements in the precision of the identification of individual particles in mixed particle populations and the opportunity for a 3D-reconstruction of the particles, including their internal structures.
Our new implementation of multi-directional imaging flow cytometry offers high flexibility in particle focusing, particle rotation, particle velocity and particle arrangement in the field of view. The innovative core of the microfluidic device is a 3D-flow focusing unit which automatically aligns all particles in a horizontal, planar 2D-sheet at an adjustable z-position. Particles passing the flow cell as a 2D-sheet can be measured in parallel, which significantly improves the data rate compared to conventional single file mode flow cells. Particle rotation, as required for recording tomographic tilt-image series, is induced by the shear rate of the carrier fluid at off-center positions.
The use of powerful tomographic 3D-imaging in human medical radiology has revolutionized diagnostics and surgery as it facilitates precise imaging and increases the information content of the resulting datasets – in the unperturbed natural environment (patient). Yet this is not the only field where there is a high demand for the reliable, automated characterization of particles. The application fields are broad, covering the life sciences, nutrition, health, catalysis and material science. For a first demonstration of the high potential of mIFC, we present an example from the life sciences/health sector. It covers the automated analysis of pollen, an application which would be of use for airborne pollen monitoring,22,23 honey certification,24 or paleoecology.25,26 Up to now, the manual microscopic classification of pollen grains is still the standard procedure. Reliable automated palynology methods have not yet been found as the requirements for pollen analysis are very complex. Apart from the reliable classification of pollen, an automated pollen analyser would have to be able to deal with other particles contaminating the samples such as spores, minerals and debris or with highly damaged pollen grains. Recently, publications have begun to address this issue, often making use of machine learning.24,27–31 In their work from 2014 Holt and Bennett give a profound overview on the principles and methods for automated palynology32 and highlight the specific application-related requirements for automation, such as on-site analysis for airborne pollen, the ability to deal with lots of debris and damaged pollen grains for paleoecology.
Our system has been experimentally applied for pollen–particle identification using deep convolutional neural networks (DCNN). Here, the information obtained is improved significantly by the three-dimensionality of our data. Native pollen samples often contain foreign particles. Thus, the reduction of false positive classifications and the identification of foreign particles remains a challenging task.33 We demonstrate how such foreign particles can be reliably identified by our extended algorithm. As a proof of concept we show the suitability of our mIFC image series for 3D-reconstruction, demonstrated on human blood cells and pollen.
General concepts
 | (1) |
 | (2) |
 | (3) |
 | (4) |
![[small gamma, Greek, dot above]](https://www.rsc.org/images/entities/i_char_e0a2.gif) for a spherical particle can now be calculated by eqn (5).
for a spherical particle can now be calculated by eqn (5). | (5) |
Results and discussion
Particle alignment in the flow field
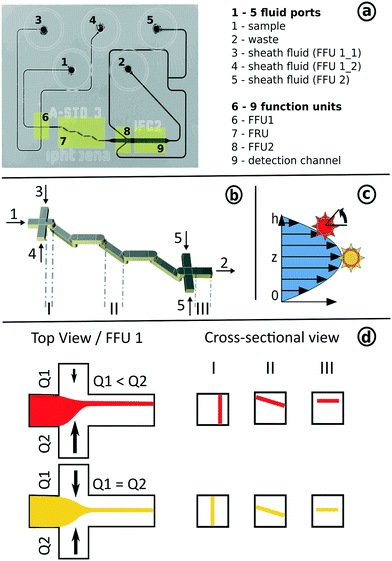
The implementation of the concept of 3D-hydrodynamic focusing is implemented in 3-step flow focusing composed of a horizontal compression step to form a vertical sample lamella, a 90-degree rotation aligning the lamella with the horizontal imaging plane and a horizontal compression step. This concept also allows for the precise control of the z-position of the resulting horizontal lamella (Fig. 2d). It has to operate at low transport velocities in order to minimize the influence of motion blur and to allow for long exposure times of a few milliseconds. Furthermore, all particles have to be aligned in a narrow sheet within the depth of focus of the microscope objective used. This was achieved with the help of a newly developed 3D-flow focusing unit that operates at pure laminar flow conditions at Reynolds numbers Re < 10.In a first step, a hydrodynamic flow focusing unit (FFU 1) was used to confine all particles into a vertical fluid sheet (Fig. 3b). The x-position of the sample-sheet and its width can be controlled by the flow rate ratios of the lateral sheath fluids (FFU1_1 and FFU1_2). In the subsequent flow rotation unit (FRU), this lamella was rotated incrementally for exactly 90 degrees, while its planarity was kept.
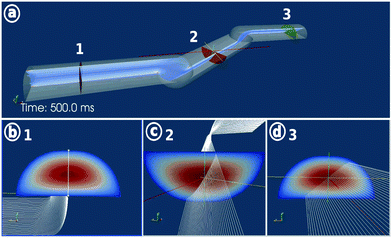
The fluid rotation was implemented in a two-layer system, composed of the bent transition of an upper half-channel to a lower half-channel and vice versa. For a full 90° rotation, a sequence of 6 transitions was implemented.42 During rotation, the x-position of the fluid sheet was transformed into a z-position. As outlined in Fig. 2c and d, the yellow vertical lamella is created at the center position at FFU 1 (equal flow rates for QFFU1_1 and QFFU1_2). It will also pass the observation chamber at the center z-position. The red lamella is focused at an off-center position (QFFU1_1 ≠ QFFU1_2) and will also pass the observation chamber at an off-center z-position. This way, the z-position within the parabolic velocity profile of the observation chamber can also be controlled simply by the flow rate ratios of the two sheath fluids at FFU 1. A second flow focusing unit (FFU 2) was added behind the FRU to remove the particles from near-wall positions to avoid near-wall imaging artefacts or to confine them into a single file arrangement e.g. for the combination with tomographic imaging-based particle sorting as a future extension to the device.
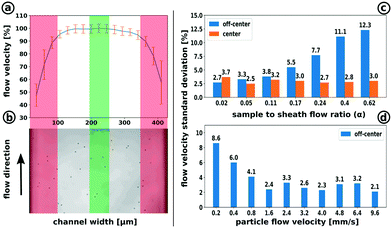
The correct operation of the 3D-focusing unit was experimentally proved by measuring the particle flow velocity of 2.2 μm polystyrene particles under various conditions. Fig. 4b shows a measurement image of the detection channel including particles. A series of up to 1000 images was used for the calculation of the particle flow velocity profile and its standard deviation at various positions in flow direction (Fig. 4a). The plot clearly shows how the focusing conditions decrease at near-wall positions (red area). It also indicates a plateau area with stable flow conditions. As mentioned before, the second focusing unit (FFU2) can be used to displace particles located at near-wall positions to the plateau area. To reduce the effect of the dependency between the particles' location and their flow velocity, only a small band of 70 μm width (green area) was analysed regarding the focusing quality.
In order to verify the particle focusing quality, we gradually increased the sample lamella height by increasing the sample flow to sheath flow ratio α. With an increasing α, particles are distributed within an increasing shear flow of the parabolic flow profile, orthogonally to the flow direction. A high quality of particle focusing is then reflected by a low standard deviation of the flow velocity.
The measurements where performed at two focus positions at z = 1/2 (center) and z = 1/4 (off-center) as outlined in Fig. 2c. Particles focused at the center positions show a narrow flow velocity standard deviation between 3.7% and 2.5% which was not influenced by the sample lamella height. This indicates a very small shear gradient within the investigated height range. It provides no information about the focusing quality. In comparison, the measurements at the off-centre position are located at a steeper shear gradient where a small variation of the particle z-position leads to a significant change in flow velocity. The results show strong focusing conditions at α between α = 0.02 to 0.11 with a flow velocity standard deviation below 4%.
To investigate the focusing quality at different particle flow velocities, we ran the experiments at a fixed α = 0.05 at z = 1/4. The particle flow velocity was increased incrementally from u = 0.2 mm s−1 to u = 9.6 mm s−1. Strong focusing conditions could be found in a range between 0.8 mm s−1 and 9.6 mm s−1. Flow velocities above 9.6 mm s−1 could not be measured due to the limitation of the image acquisition frame rate providing less than two images per particle for the calculation of the individual particle displacement. The achievable particle throughput is strongly influenced by experimental conditions such as particle size, particle concentration and flow rates. For the velocity measurements at α = 0.05, throughput rates (complete channel width) between 350 particles per second (9.6 mm s−1) and 36 particles per second (0.8 mm s−1) were achieved. In summary, we have demonstrated a high focusing quality corresponding to the flow rate ratio α. We also showed stable focusing conditions within a particle velocity range between 0.8 mm s−1 and 9.6 mm s−1. Throughput rates up to 350 particles per seconds have been reached.
Multi-directional imaging
In our approach of multi-directional imaging flow cytometry, the particles were imaged from multiple orientations while passing through the flow cell (Fig. 5). Particles focused at the channel center position at z = 1/2 showed almost no self-rotation while particles focused at an off-center position at z ≠ 1/2 underwent a continuous self-rotation due to their position in the shear field of the parabolic flow profile (Fig. 1 and 2c). Apart from the velocity shear gradient, morphology properties such as size and shape have a strong influence on the particle rotation behaviour.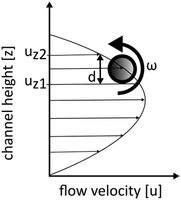 | ||
| Fig. 1 Schematic sketch for spherical particle rotation in shear flow. Symbols refer to eqn (3) and (5). | ||
We distinguish between 3 rotation modes, i.e. flipping, tumbling and rotation with a unique axis. Flipping appears for particles with a very high aspect ratio. The shear forces acting on the particle depend on the orientation of the major axis of the particle. If the major axis is orientated in flow direction, a small shear gradient along the particle minor axis leads to very small angular velocity. Once the major axis is rotated orthogonally to the flow direction, the shear gradient distinctly increases, resulting in a high angular velocity. Tumbling occurs when particles have an asymmetric shape, e.g. biconcave red blood cells. Due to their asymmetric shape, these particles have more than one rotation axis. The disc shape of the red blood cells further creates an additional flipping effect.
Spherical particles have only one unique rotation axis. The axis is in a horizontal plane and is oriented orthogonally to the direction of flow. The horizontal velocity profile also influences the orientation of the rotation axis. The rotation behaviour is important to know for the 3D-reconstruction models. The number of observations per particle depends on the particle flow velocity and the image acquisition rate of the imaging system.
To sum up, our system is able to induce a controlled particle rotation by controlling the particles' z-position within the parabolic flow profile. The rotation behaviour such as velocity angle and rotation axis is strongly influenced by the particle's morphology. Examples for the rotation behaviour are shown in ESI† Movie S2.
Application example: pollen classification
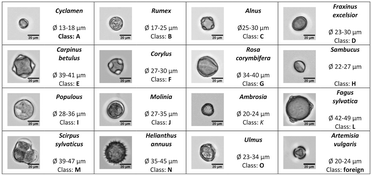
To demonstrate the usability of our tomographic IFC platform for biological applications, we ran a label-free population analysis of 15 pollen species (Fig. 6). The workflow contains individual modules for image acquisition, image processing, classification, and statistics. A more detailed description can be found in the section “Materials and methods”. We made use of the fact that each species can be classified by its unique morphological properties to train a deep convolutional neural network (DCNN) based on a set of 138![[thin space (1/6-em)]](https://www.rsc.org/images/entities/char_2009.gif) 373 single 2D-images containing all classes and view directions. For the DCNN model, we only trained the last two dense layers of a pre-trained VGG16 deep convolutional network.43 The trained network reached a validation accuracy of 98.90% after 20 iterations. The validation accuracy for the individual classes ranged from 97.5% to 100%.
373 single 2D-images containing all classes and view directions. For the DCNN model, we only trained the last two dense layers of a pre-trained VGG16 deep convolutional network.43 The trained network reached a validation accuracy of 98.90% after 20 iterations. The validation accuracy for the individual classes ranged from 97.5% to 100%.
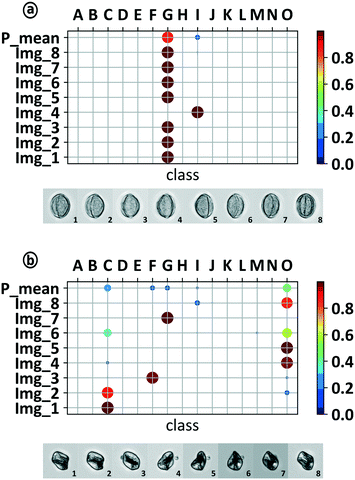
For the pollen classification experiments, we used the 2D-image series of a rotating pollen grain as shown in Fig. 5. The validation for a whole series allowed for the classification based on class-specific tomographic information and led to an increase in prediction accuracy. Each 2D-image belonging to the same series was classified separately by the trained DCNN. Subsequently, the mean prediction over the whole image series was calculated and used for classification. The prediction for a complete image series is plotted in Fig. 7. Each row displays the prediction distribution over all 15 classes. The sum over all classes of each row represents 100%. For 7 out of the 8 images in Fig. 7a, the prediction shows a clear assignment to class “G” (Rosa corymbifera) while Img_4 is classified with 100% prediction to class “I” (Populous). The calculation of the mean prediction over the complete series gave a Pmean = 87.4% assignment for class “G”. With this method, the false prediction of Img_4 can be filtered out. Performing pollen measurements with native samples can cause a number of difficulties potentially distorting classification results, such as debris, off-focus pollen or even foreign pollen species. To prevent false positive predictions, it is important to identify foreign particles which cannot be clearly assigned to one of the trained classes. The assumption for the identification of foreign pollen or particles is that the DCNN only knows the pollen species it has been trained for. Each image fed to the DCNN will result in a prediction result which is limited to the number of trained classes. The predictions of foreign particles will necessarily lead to false positive classifications. The prediction results for such a foreign pollen is shown in Fig. 7b. It shows a strong variance between the different predictions within the mIFC series. The high diversity between the single image predictions (2D) leads to a weak maximum mean prediction value for the mIFC image series of Pmean = 44.2% for class “O” (ulmus). This again underlines the fact that a single image classification can be very strong but highly inhomogeneous over the whole series. The calculated Pmean can now be used to choose a prediction threshold (Pthresh) where a prediction is accepted to be true or unknown.
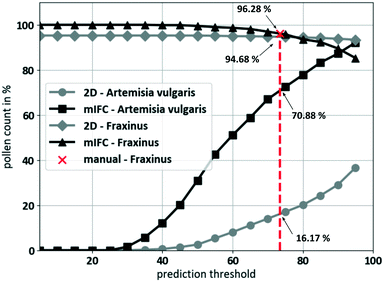
To determine an appropriate Pthresh, we further compared the DCNN classification results of a pollen species (Artemisia vulgaris) that had not been part of the training set and a pollen species (Fraxinus excelsior) that had. Afterwards, we compared the results for mIFC (tilt series) and 2D (single image). Each mIFC tilt series contains up to 16 images of each pollen grain. For 2D-classification, any single image of the tilt series was classified as individual pollen. In total, the number of investigated images was the same for both methods. Fig. 8 shows the number of detected pollen as a function of the Pthresh value. For the species that had not been in the training set, a pollen is counted as detected and labeled as unknown if Pmean < Pthresh. Any Pmean > Pthresh would lead to a false positive classification. For the evaluation of the known species, the pollen were detected and counted as “true” if Pmean > Pthresh and the predicted class equal to class D (Fraxinus excelsior). If the conditions were not fulfilled, the pollen was labeled as unknown. Both methods were very strong for the classification of the known pollen species (Fraxinus excelsior). 591 pollen resulting in 9113 pollen images were analysed. At lower thresholds, the averaging effect of the mIFC method led to a higher performance which decreased at high thresholds. The classification accuracy even for the 2D-methods exactly matched the high training and validation accuracy of the DCNN. For the identification of foreign pollen species (Artemisia vulgaris), 697 pollen (10![[thin space (1/6-em)]](https://www.rsc.org/images/entities/char_2009.gif) 311 images) were analysed. The mIFC method exhibits a markedly higher performance compared to 2D. The reason for this can be seen in Fig. 7b, where we show that a single false prediction (2D) might be very strong but can result in a weaker mean prediction over the complete mIFC image series. For further experiments, we had to choose a fixed threshold value where the classified pollen was labeled as known or unknown. Therefore, we made use of the current standard method of pollen classification and performed a manual classification of the Fraxinus excelsior pollen based on the raw images. We set the threshold value (red line) to Pthresh = 0.735 (73.5% prediction to a certain class) where the result of the manual classification (96.12%) was as good as the mIFC classification (96.28%). At the chosen threshold, the mIFC-based prediction was able to detect 96.11% of the fraxinus pollen compared to 94.68% for the 2D-classification. For the identification of the foreign pollen species, our mIFC method was able to identify 70.88% of all Artemisia vulgaris pollen as foreign while the 2D-methods only reached 16.17%. Thus, we were able to reduce the number of false positive classifications of a foreign species from 83.83% for 2D to 29.12% for the mIFC method.
311 images) were analysed. The mIFC method exhibits a markedly higher performance compared to 2D. The reason for this can be seen in Fig. 7b, where we show that a single false prediction (2D) might be very strong but can result in a weaker mean prediction over the complete mIFC image series. For further experiments, we had to choose a fixed threshold value where the classified pollen was labeled as known or unknown. Therefore, we made use of the current standard method of pollen classification and performed a manual classification of the Fraxinus excelsior pollen based on the raw images. We set the threshold value (red line) to Pthresh = 0.735 (73.5% prediction to a certain class) where the result of the manual classification (96.12%) was as good as the mIFC classification (96.28%). At the chosen threshold, the mIFC-based prediction was able to detect 96.11% of the fraxinus pollen compared to 94.68% for the 2D-classification. For the identification of the foreign pollen species, our mIFC method was able to identify 70.88% of all Artemisia vulgaris pollen as foreign while the 2D-methods only reached 16.17%. Thus, we were able to reduce the number of false positive classifications of a foreign species from 83.83% for 2D to 29.12% for the mIFC method.
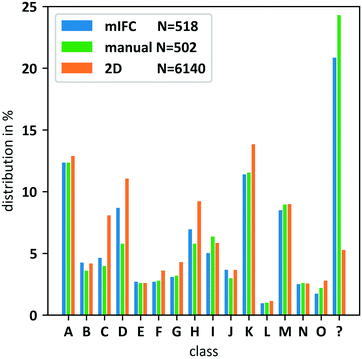
For final validation, we performed a population analysis of the 15 trained pollen species (class A–O, Fig. 6, ESI† Movie S4) including an additional foreign pollen species (Artemisia vulgaris, class foreign, Fig. 6). To evaluate the results, a manual classification of all detected particles was performed. Automated classification was run applying a Pthresh = 0.735. The population results in Fig. 9 show a good conformity between all three methods. However, the manual counting gave a number of 24.3% foreign particles. With the mIFC methods we were able to classify 20.85% as foreign compared to 5.28% for the 2D-classification. The differences led to a higher number of false positive classifications for the 2D method especially for the species C, D, H and K.
At full frame, bio-particles were imaged at an ROI size of 300 × 480 μm2 at a frame rate of 32.2 FPS. Depending on the particle size, different numbers of particles can potentially be imaged within this region. Our experiments showed that the throughput rate does not only depend on the particle velocity but also on particle properties such as size, density, and morphology. These parameters have a significant influence on the particle delivery from the sample syringe to the detection channel of the microfluidic chip. For example, in our pollen classification experiments we achieved up to 280 images per second. For an image series of 16 images per pollen we reached throughput rates of up to 13 pollen per s. At 5 images per pollen a throughput of 56 pollen per s was achieved.
In summary, we see that the increased information content generated from the multidirectional views enhances the prediction accuracy of the neural network. Especially in the case of the identification of unknown particles, the system is highly beneficial.
Application example: 3D-reconstruction of various bio-particles
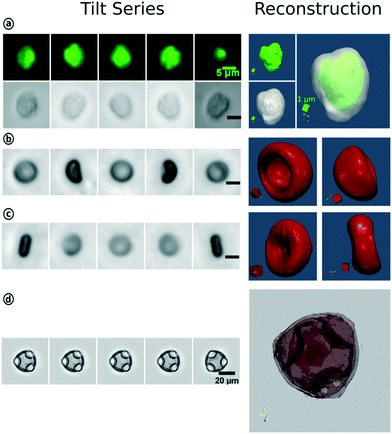
As a proof on concept, we applied our image series to the tomviz open source software for tomographic image reconstruction. Here, we show that our system provides the flexibility and quality to handle a wide range of bio-particles for 3D-reconstruction.The system can provide stable flow and focusing conditions for rotating bio-particles at various flow velocities as shown in Fig. 4. With that, we are able to create images free of motion blur up to 3 ms exposure time; as used for the fluorescence imaging of white blood cells. Stable flow conditions are also important for the calculation of the rotation axis and the angular velocity. For particles with only one rotation axis, we extracted both morphological and intensity-based features for each particle. An example is given in the ESI.† The particle flow velocity can be determined by calculating the Euclidean distance of the center of the mass positions of two particles following each other. The center of mass position is also used for image registration to align the image tilt series for 3D-reconstruction.
To sum up, in Fig. 10 we show that the tilt series provided by our system is suitable for 3D-reconstruction.
Materials and methods
Microfluidic devices
Two layer glass microfluidic chip devices were prepared by photolithography and wet etching of the glass wafers (thickness 0.7 mm) with hydrofluoric acid with a uniform etching depth of 100 μm, using a nickel–chromium metallization as mask. Two micro-structured wafers were bonded face to face in order to create the full channels and geometries for the different operation units. Chip dimensions were 16 × 12.5 mm. A total of five fluid interconnection ports were prepared by ultrasonic drilling. The observation chamber width was 430 μm. Channel height was 100 μm with a planar channel bottom. Cover-glass thickness for imaging was 0.7 mm with a refractive index of 1.47.Optical setup and microfluidic control
The optical setup comprised a self-made microscope on an optical bench using a 20× microscopy objective Mitutoyo, NA = 0.42, WD 20 mm, with a 200 mm tube lens. The system allows for upright fluorescence imaging for excitation with a laser 488 nm/20 mW (LDM 488.20.TA Omicron-Laserage) in combination with bright field transmission mode imaging. The emitted light is split by an emission beam splitter filter cube (dichroic SEM-FF560-FDi01-25x36) and projected on two CMOS cameras acA1920-40um (Basler GmbH, Ahrensburg, Germany). For the green channel, an emission bandpass filter (F39-527 524/24 BrightLine HC), for the red channel an emission band pass filter (FF02-650/100-25) was mounted on the emission filter cube. For upright fluorescence excitation, a beamsplitter (HC BS 506) and an excitation low pass filter (F37-473 475/35 BrightLine HC) were integrated into the excitation filter cube. Transmission mode imaging was realized by an LED illumination with a condenser, NA = 0.32. The synchronization of the light sources and cameras was realized by a programmable LED trigger controller RTCC4 (Gardasoft Vision Limited, Cambridge, UK).Buffers and samples
For the focusing quality measurements, we used 2.2 μm polystyrene particles (BS-Partikel GmbH) diluted 1/50 in tab-water. Tab-water was also used as run buffer.For the blood cell measurements, isolated fixed white blood cells were obtained from healthy, young volunteers after informed consent according to the Ethics Committee of the University Hospital Jena. 1× PBST containing 0.05% Tween 20 (w/vol) was used as run buffer. The samples were centrifuged at 2000 rpm for 10 min (centrifuge: Hettich Universal RF, Rotor: 1612, Andreas Hettich GmbH & Co. KG, Tuttlingen Germany) and re-suspended in 100 μl run buffer. Subsequently, 3 μl Dyomics DY-V13 (Dyomics GmbH, Jena, Germany), 50 μg ml−1 in water were added.
For the RBC measurements, total blood samples (EDTA stabilized) were obtained from healthy, young volunteers after informed consent according to the Ethics Committee of the University Hospital Jena. Each blood sample was diluted 1/100 in X-VIVO15 without phenol red (Lonza). X-VIVO15 was also used as run buffer.
The pollen samples were provided in a dried state by the University Hospital Jena. A 50% sucrose solution containing 0.05% Tween 20 (w/vol) was used as sample and run buffer. 20 mg of pollen samples were diluted in 2 ml tab-water and filtered through a 70 μm mesh (MACS® SmartStrainer 70 μm). The filtered solution was centrifuged for 5 min at 2500 rpm and re-suspended in 100 μl sample buffer.
Experimental details
Chips were mounted to the microscope and connected to syringe pumps (NemeSys, Cetoni Germany) using PTFE-HPLC tubing OD 1.6 mm, ID 0.5 mm. Image acquisition and LED-triggering was run at 32.2 FPS.Image processing
Image processing and parts of the data analysis were done using a self-made Java-based software, utilizing the openCV Java interface for the image processing tasks. For post-processing and classification, also self-made Python scripts were used. The recorded full-frame images were processed by our Java software. To make the data comparable, all settings regarding the image processing were kept equal during the whole experiment and saved as .xml files. Our image processing toolbox generates a .csv-file for each image sequence, containing a wide range of morphological and gray value-based parameters gained from the object detection algorithms, such as position information, morphological and intensity-based features. It also provides the normalized cropped images for each detected particle, which we later used to train the DCNN model and to classify the mixed population. With this normalization, images from different experiments become comparable.Particle tracking
Particle tracking was performed using the x- and y-position of the center of mass value for each detected particle provided by the .csv-files. Particle linking was achieved by calculating the minimum distance of a candidate particle to its expected position. A maximum threshold distance was applied to avoid false linking. In a first step, a global expected x- and y-shift was applied to the particle. The global shift was calculated by FFT cross-correlation of the first frames. After linking two particles, their calculated x- and y-shift were further used as individual expected shift.Focusing quality measurements
The particle velocity could be measured directly from the recorded image sequences by the available particle tracking routines, which were available and utilized for the data analysis of the imaging flow cytometry experiments. Thus, the measurements could be easily reproduced and rerun for each recorded dataset and experiment. The exposure time was set to 50 μs to avoid motion blur effects.Training of the DCNN
For automated classification, we used the Keras implementation of the VGG16 convolutional neural network. Using fine-tuning to adjust the network to our needs, we kept the model architecture and used its default weights as starting values. The output layers of the DCNN were replaced by 4 layers (flatten, dense, dropout, and dense). Subsequently, only the added layers of the model have been trained by a training set of 138![[thin space (1/6-em)]](https://www.rsc.org/images/entities/char_2009.gif) 373 single pollen images. Each training image belongs to one of the various pollen types and was extracted from the IFC-data by our Java software. The trained model was later used for the population analysis of a pollen grain mixed population. All training data sets of the 15 classes were measured in individual experiments. A random offset and random noise was applied to the single pollen images to avoid an unwanted classification just by the illumination condition changes between each measurement. Later, images containing doublets, debris, and objects which had not been captured completely were removed automatically based on information such as x- and y-position, size, and circularity gained from the results tables.
373 single pollen images. Each training image belongs to one of the various pollen types and was extracted from the IFC-data by our Java software. The trained model was later used for the population analysis of a pollen grain mixed population. All training data sets of the 15 classes were measured in individual experiments. A random offset and random noise was applied to the single pollen images to avoid an unwanted classification just by the illumination condition changes between each measurement. Later, images containing doublets, debris, and objects which had not been captured completely were removed automatically based on information such as x- and y-position, size, and circularity gained from the results tables.
DCNN based pollen classification
The image classification was divided into three major processing steps. First, another pre-processing step was applied to the extracted particle images to remove doublets, debris, and objects which had not been captured completely. In a second step, a particle tracking routine was run to link all extracted images belonging to the same pollen grain. In a last step, the single pollen images were fed to the classifier for individual classification (2D) and the calculation of the mean prediction of the entire series (3D).3D-reconstruction
The reconstruction was performed using the tomviz 1.5.1 software (http://tomviz.org). The generated tilt series from the mIFC were reconstructed using weighted back projection.Conclusion
Here, we present a new two-layer microfluidic system for tomographic imaging flow cytometry at stokes flow. Our system is able to process a variety of different particle types such as pollen grains, human blood cells and polystyrene particles under highly controllable flow conditions. The controllable z-position of the focused plane allows for a controlled particle rotation within the shear-field of the parabolic flow profile without any channel–wall interaction. Strong focusing conditions have been demonstrated for particle flow velocities between 0.8 mm s−1 and 9.6 mm s−1. Focusing quality measured at flow velocities higher than 9.6 mm s−1 was limited due to the imaging system. Even if high velocities are important in terms of throughput rates, strong focusing conditions under very slow flow velocities can be interesting for applications where longer acquisition times are needed such as Raman activated flow cytometry.44 We also showed that our system can address high-throughput applications. In our pollen classification experiments, we achieve up to 280 images per second gaining throughput rates between up to 13 pollen per s at 16 images per pollen and up to 56 pollen per s at 5 images per pollen. Additional speed especially for larger particles such as pollen and cells might be realized with higher frame rates of the camera used.As application example we combined the mIFC tilt series with machine learning algorithms to improve the prediction quality for pollen identification. Besides the high predication accuracy, the major benefits of the mIFC methods are the identification and reduction of false positive classifications and a reliable identification of foreign particles (e.g. foreign pollen species, debris or dust).
We further showed the capability of our system to provide image series which address the requirements for 3D-reconstruction.
Since the chip design covers the possibility for a single file arrangement of the focused particles, a future sorting option is under development. Apart from the pollen analysis, the mIFC might prove to be an interesting tool for medical imaging.
Contributions
AK: preparation of optical setups, performance of measurements, development of data analysis for particle tracking and the neural classification network, writing of manuscript. AR: development of cell preparation and staining and preparation of blood cells. GM: development and fabrication of microfluidic devices. UN and JP: design, plan and preparation of experiments with leukocytes and discussion of results. TH: designed of microfluidic devices and concepts for tomographic imaging flow cytometry. Development of core software components for data analysis and discussion of results. All authors have contributed to writing the manuscript and read and accepted its final version.Conflicts of interest
The authors have no conflict of interest to declare.Acknowledgements
We acknowledge the microsystem group and the cleanroom staff at the Leibniz-IPHT for the preparation of the microfluidic units and A. Koch (Jena University Hospital) for providing the pollen samples. The funding from BMWi (Pollen3D–ZF4006816CR8), the European Union (HemoSpec, FP7-ICT-611682), as well as the BMBF (CSCC, FKZ 01EO1502) is gratefully acknowledged.Notes and references
- B. K. McFarlin and M. A. Gary, Methods, 2017, 112, 1–8 CrossRef CAS PubMed.
- D. A. Basiji, in Imaging Flow Cytometry: Methods and Protocols, ed. N. S. Barteneva and I. A. Vorobjev, Springer New York, New York, NY, 2016, pp. 13–21, DOI:10.1007/978-1-4939-3302-0_2.
- Y. Han, Y. Gu, A. C. Zhang and Y.-H. Lo, Lab Chip, 2016, 16, 4639–4647 RSC.
- M. Doan, I. Vorobjev, P. Rees, A. Filby, O. Wolkenhauer, A. E. Goldfeld, J. Lieberman, N. Barteneva, A. E. Carpenter and H. Hennig, Trends Biotechnol., 2018, 36, 649–652 CrossRef CAS PubMed.
- S. Stavrakis, G. Holzner, J. Choo and A. de Mello, Curr. Opin. Biotechnol., 2018, 55, 36–43 CrossRef PubMed.
- C. Reichle, T. Uller, T. Schnelle and U. Fuhr, J. Phys. D: Appl. Phys., 1999, 32, 2128–2135 CrossRef CAS.
- L.-H. Chau, W. Liang, F. W. K. Cheung, W. K. Liu, W. J. Li, S.-C. Chen and G.-B. Lee, PLoS One, 2013, 8, e51577 CrossRef CAS PubMed.
- P. Benhal, J. G. Chase, P. Gaynor, B. Oback and W. Wang, Lab Chip, 2014, 14, 2717–2727 RSC.
- J. P. Shelby and D. T. Chiu, Lab Chip, 2004, 4, 168–170 RSC.
- T. Kolb, S. Albert, M. Haug and G. Whyte, J. Biophotonics, 2015, 8, 239–246 CrossRef CAS PubMed.
- F. Merola, L. Miccio, P. Memmolo, G. Di Caprio, A. Galli, R. Puglisi, D. Balduzzi, G. Coppola, P. Netti and P. Ferraro, Lab Chip, 2013, 13, 4512–4516 RSC.
- I. Bernard, A. A. Doinikov, P. Marmottant, D. Rabaud, C. Poulain and P. Thibault, Lab Chip, 2017, 17, 2470–2480 RSC.
- T. Cacace, P. Memmolo, M. M. Villone, M. De Corato, M. Mugnano, M. Paturzo, P. Ferraro and P. L. Maffettone, Lab Chip, 2019, 19, 3123–3132 RSC.
- H. Iwai, T. Yamauchi, M. Miwa and Y. Yamashita, Opt. Commun., 2014, 319, 159–169 CrossRef CAS.
- E. J. Gualda, H. Pereira, G. G. Martins, R. Gardner and N. Moreno, Cytometry, Part A, 2017, 91, 144–151 CrossRef PubMed.
- J. Wu, J. Li and R. K. Y. Chan, Opt. Express, 2013, 21, 14474–14480 CrossRef CAS PubMed.
- Y. Han, R. Tang, Y. Gu, A. C. Zhang, W. Cai, V. Castor, S. H. Cho, W. Alaynick and Y.-H. Lo, Optica, 2019, 6, 1297–1304 CrossRef.
- V. K. Jagannadh, M. D. Mackenzie, P. Pal, A. K. Kar and S. S. Gorthi, Opt. Express, 2016, 24, 22144–22158 CrossRef CAS PubMed.
- F. Merola, P. Memmolo, L. Miccio, R. Savoia, M. Mugnano, A. Fontana, G. D'Ippolito, A. Sardo, A. Iolascon, A. Gambale and P. Ferraro, Light: Sci. Appl., 2017, 6, e16241 CrossRef CAS PubMed.
- H. Funamizu and Y. Aizu, J. Biomed. Opt., 2018, 24, 031012 Search PubMed.
- M. M. Villone, P. Memmolo, F. Merola, M. Mugnano, L. Miccio, P. L. Maffettone and P. Ferraro, Lab Chip, 2018, 18, 126–131 RSC.
- J. Oteros, G. Pusch, I. Weichenmeier, U. Heimann, R. Möller, S. Röseler, C. Traidl-Hoffmann, C. Schmidt-Weber and J. T. M. Buters, Int. Arch. Allergy Immunol., 2015, 167, 158–166 CrossRef PubMed.
- U. Heimann, K. Haus and D. Zuehlke, Proceedings OPTO 2009 & IRS2 2009, 2009, pp. 125–128, DOI:10.5162/opto09/op3.
- R. Lagerstrom, K. Holt, Y. Arzhaeva, L. Bischof, S. Haberle, F. Hopf and D. Lovell, in Signal and Image Analysis for Biomedical and Life Sciences, ed. C. Sun, T. Bednarz, T. D. Pham, P. Vallotton and D. Wang, Springer International Publishing, Cham, 2015, pp. 207–226, DOI:10.1007/978-3-319-10984-8_12.
- M. Lindbladh, R. O'Connor and G. L. Jacobson Jr, Am. J. Bot., 2002, 89, 1459–1467 CrossRef PubMed.
- L. Mander and S. W. Punyasena, in Methods in Paleoecology, Springer, 2018, pp. 215–234 Search PubMed.
- V. Sevillano and J. L. Aznarte, PLoS One, 2018, 13, e0201807 CrossRef PubMed.
- A. B. Gonçalves, J. S. Souza, G. G. D. Silva, M. P. Cereda, A. Pott, M. H. Naka and H. Pistori, PLoS One, 2016, 11, e0157044 CrossRef PubMed.
- K. C. Riley, J. P. Woodard, G. M. Hwang and S. W. Punyasena, Rev. Palaeobot. Palyno., 2015, 221, 117–127 CrossRef.
- P. J. S. Gonçalves, L. M. Estevinho, A. P. Pereira, J. M. C. Sousa and O. Anjos, Food Chem., 2018, 267, 36–42 CrossRef PubMed.
- R. Gallardo-Caballero, C. J. García-Orellana, A. García-Manso, H. M. González-Velasco, R. Tormo-Molina and M. Macías-Macías, Sensors, 2019, 19, 3583 CrossRef PubMed.
- K. A. Holt and K. D. Bennett, New Phytol., 2014, 203, 735–742 CrossRef CAS PubMed.
- D. O. Cardoso, J. Gama and F. M. G. França, Mach. Learn., 2017, 106, 1547–1567 CrossRef.
- A. Einstein, Ann. Phys., 1906, 324, 289–306 CrossRef.
- G. B. Jeffery and L. N. G. Filon, Proc. R. Soc. London, Ser. A, 1922, 102, 161–179 Search PubMed.
- B. J. Trevelyan and S. G. Mason, J. Colloid Sci., 1951, 6, 354–367 CrossRef CAS.
- X. Feng, Y. Ren and H. Jiang, Biomicrofluidics, 2013, 7, 054121 CrossRef PubMed.
- R. H. Liu, M. A. Stremler, K. V. Sharp, M. G. Olsen, J. G. Santiago, R. J. Adrian, H. Aref and D. J. Beebe, J. Microelectromech. Syst., 2000, 9, 190–197 Search PubMed.
- H. Mensinger, T. Richter, V. Hessel, J. Döpper and W. Ehrfeld, Micro Total Analysis Systems, ed. A. van den Berg and P. Bergfeld, Kluwer Academic Publishers, 1995, pp. 237–243 Search PubMed.
- C. Liu and G. Hu, Micromachines, 2017, 8, 73 CrossRef.
- X. Xuan, J. Zhu and C. Church, Microfluid. Nanofluid., 2010, 9, 1–16 CrossRef.
- T. Henkel, Germany Pat., DE102015115343B4, 2015 Search PubMed.
- K. Simonyan and A. Zisserman, Very deep convolutional networks for large-scale image recognition, 2014, arXiv preprint, arXiv:1409.1556 Search PubMed.
- P. Zhang, L. Ren, X. Zhang, Y. Shan, Y. Wang, Y. Ji, H. Yin, W. E. Huang, J. Xu and B. Ma, Anal. Chem., 2015, 87, 2282–2289 CrossRef CAS PubMed.
Footnote |
| † Electronic supplementary information (ESI) available. See DOI: 10.1039/d0lc00244e |
| This journal is © The Royal Society of Chemistry 2020 |

