
 Open Access Article
 This Open Access Article is licensed under a Creative Commons Attribution-Non Commercial 3.0 Unported Licence
Electrostatically gated nanofluidic membrane for ultra-low power controlled drug delivery†
Nicola
Di Trani‡
 ab,
Antonia
Silvestri‡
ac,
Antons
Sizovs
a,
Yu
Wang
a,
Donald R.
Erm
a,
Danilo
Demarchi
c,
Xuewu
Liu
a and
Alessandro
Grattoni
*ade
ab,
Antonia
Silvestri‡
ac,
Antons
Sizovs
a,
Yu
Wang
a,
Donald R.
Erm
a,
Danilo
Demarchi
c,
Xuewu
Liu
a and
Alessandro
Grattoni
*ade
aDepartment of Nanomedicine, Houston Methodist Research Institute, Houston, TX, USA. E-mail: agrattoni@houstonmethodist.org; Tel: +1 (713) 441 7324
bUniversity of Chinese Academy of Science (UCAS), Shijingshan, 19 Yuquan Road, Beijing 100049, China
cDepartment of Electronics and Telecommunications, Polytechnic of Turin, Turin, Italy
dDepartment of Surgery, Houston Methodist Hospital, Houston, TX, USA
eDepartment of Radiation Oncology, Houston Methodist Hospital, Houston, TX, USA
First published on 2nd April 2020
Abstract
Patient-centered therapeutic management for chronic medical conditions is a desired but unmet need, largely attributable to the lack of adequate technologies for tailored drug administration. While triggered devices that control the delivery of therapeutics exist, they often rely on impractical continuous external activation. As such, next generation continuously tunable drug delivery systems independent of sustained external activation remain an elusive goal. Here we present the development and demonstration of a silicon carbide (SiC)-coated nanofluidic membrane that achieves reproducible and tunable control of drug release via electrostatic gating. By applying a low-intensity voltage to a buried electrode, we showed repeatable and reproducible in vitro release modulation of three model analytes. A small fluorophore (Alexa Fluor 647), a large polymer poly(sodium 4-styrenesulfonate) and a medically relevant agent (DNA), were selected as representatives of small molecule therapeutics, polymeric drug carriers, and biological therapeutics, respectively. Unlike other drug delivery systems, our technology performed consistently over numerous cycles of voltage modulation, for over 11 days. Importantly, low power consumption and minimal leakage currents were achieved during the study. Further, the SiC coating maintained integrity and chemical inertness, shielding the membrane from degradation under simulated physiological and accelerated conditions for over 4 months. Through leveraging the flexibility offered by electrostatic gating control, our technology provides a valuable strategy for tunable delivery, setting the foundation for the next generation of drug delivery systems.
Introduction
Personalized care and precision medicine are emerging as fundamental approaches for the prevention and treatment of pathologies. Patient-focused therapeutic management can be achieved by taking into account genetics, patient-to-patient variability, and environmental conditions.1 Such approaches challenge the widespread ‘one-size-fits-all’ paradigm where treatment and prevention are designed around conventional disease archetypes. Despite the substantial resources dedicated to achieving precision medicine, personalized prevention and treatment remain largely unmet clinical needs.Patient-focused therapeutic management requires advanced technologies for tailored drug administration. For example, sensors are needed for continuous monitoring of intra- and inter-patient variabilities to effectively achieve an individualized approach. Further, drug delivery technologies that allow for ad hoc rapid and simple adjustment of drug doses represent a desirable feature. An ideal drug delivery system includes integration of the following factors: 1) sensing of physical or biological signals that can trigger the release, adjustment or interruption of drug release, 2) a drug delivery actuator that can continuously modulate, activate or interrupt the drug administration, 3) a feedback loop architecture that allows for further control of drug release, 4) remote communication and control capabilities to enable clinicians to adjust drug delivery independently. In the pursuit of such technology, wearable and implantable systems have gained significant interest. This is especially evident in the management of chronic diseases such as type 1 diabetes,2–4 and posterior eye conditions in ophthalmology,5 among others, where continuous monitoring and adjustment of drug doses are imperative. Along with offering long-term controlled drug delivery, implants can eliminate the widespread issue of non-compliance to treatment,6 and pill- and treatment-fatigue. Non-adherence to chronic medications is reported at a staggering ∼50%,7 accounting for up to 50% of treatment failures, 125![[thin space (1/6-em)]](https://www.rsc.org/images/entities/char_2009.gif) 000 deaths, and approximately 25% of hospitalizations in the United States, yearly.8 Another important consideration is that implantable systems can offer enhanced bioavailability of drugs, afford lower drug doses and hence reduce adverse effects by keep drug concentration within the therapeutic window, as well as avoid the onset of drug resistance.9
000 deaths, and approximately 25% of hospitalizations in the United States, yearly.8 Another important consideration is that implantable systems can offer enhanced bioavailability of drugs, afford lower drug doses and hence reduce adverse effects by keep drug concentration within the therapeutic window, as well as avoid the onset of drug resistance.9
Considering the vast opportunities offered by autonomous “smart” delivery, numerous sensing technologies have been developed.10,11 Notable examples are glucose monitoring devices,12 implantable sensors for heart failure,13 and epidermal wearable systems,14 among others. Despite significant developments in sensing technologies, there is a lack of implantable drug delivery actuators that could be interfaced with sensors to yield a technological platform capable of personalized patient care.
Current approaches to tunable drug delivery systems are comprised of stimuli responsive devices. These devices rely on membranes that can change their permeability to drug upon external excitation. Particle embedded membranes that respond to a magnetic field,15 near-infrared irradiation,16,17 or ultrasound18 are notable examples. The embedded particles increase the temperature locally upon external excitation, generating a conformational change in the polymeric structure and increasing the membrane permeability. Alternatively, magnetic particles, can be controlled by an external magnetic field and can act as valves to open or close the membrane.19,20 These technologies are valuable strategies for controllable drug delivery. However, they require continuous external intervention to function, which compromises their application to the next generation of autonomous drug delivery systems.
Generally, an ideal drug delivery actuator should allow for continuous and reproducible dose adjustment without the need for cumbersome and bulky external triggers. It should be robust and functional in a wide range of physiological conditions for timeframes that extends over months, years or possibly decades. Moving components, which could be prone to failure and limit the lifespan of the system, should be limited. Further, they must require minimal energy consumption for extended function, minimizing the volume of batteries and implants. Beyond advanced functionality, this is important in the context of patient acceptability of the technology.
To address these needs, here we present a nanofluidic membrane actuator that leverages electrostatic gating to control drug release via modulation of membrane permeability.21 Using fabrication techniques derived from the semiconductor industry, we developed a silicon carbide (SiC)-coated membrane featuring a buried doped polysilicon electrode. The electrode extends under the whole surface of densely packed nanochannels. The SiC dielectric layer acts as an electrode insulator providing low leakage currents, thus reducing energy loss. Further, it provides biocompatibility and chemical inertness for extended use in an implantable system. In this study, we characterized the membrane bioinertness in simulated physiological conditions at 37 °C and under accelerated setting at 77 °C. To evaluate energy consumption, we characterized the SiC insulation in comparison to commonly used SiO2. Finally, we demonstrated in vitro release rate modulation of three charged model molecules including Alexa Fluor® 647, poly(sodium 4-styrenesulfonate), and DNA. These were chosen as representative models for small molecule pharmaceutics, polymeric drug vectors, and surrogate for gene therapy, respectively. Overall, we present the proof-of-concept of a robust, ultra-low-power actuator technology capable of efficient and reproducible control of the release of molecules. We envision that when integrated with the state-of-the-art sensing technologies, our gated membrane could provide a valuable solution to achieve personalized treatment of patients affected by chronic diseases.
Materials and methods
Nanofluidic membrane fabrication
The membranes employed in this study were fabricated starting from a 4-inch p-doped silicon-on-insulator (SOI) substrate with a device layer (10 μm), a buried oxide layer (1 μm) and a handle wafer (400 μm; Ultrasil Corporation, Hayward, CA). The fabrication steps are illustrated in Fig. 1. First, a 600 nm thermal oxide was deposited on the surface of the SOI wafer to act as mask layer for photolithography (Fig. 1A). Arrays of template nanoslits (500 nm width by 6 um length) were patterned on the device layer by using standard photolithography on a contact aligner (SUSS MA6). After transferring the pattern into the oxide mask layer by reactive ion etching (RIE), nanoslit patterns were etched through the 10 μm device layer via deep RIE (DRIE) on an ICP deep silicon etcher (PlasmaTherm, VERSALINE®), and stopped at the middle oxide of the SOI (Fig. 1B). On the other side of the SOI, the handle wafer was patterned using double side alignment on the aligner (SUSS MA6). The layout of the handle wafer was designed with a high density of hexagonally arranged circular microchannels to provide mechanical stability.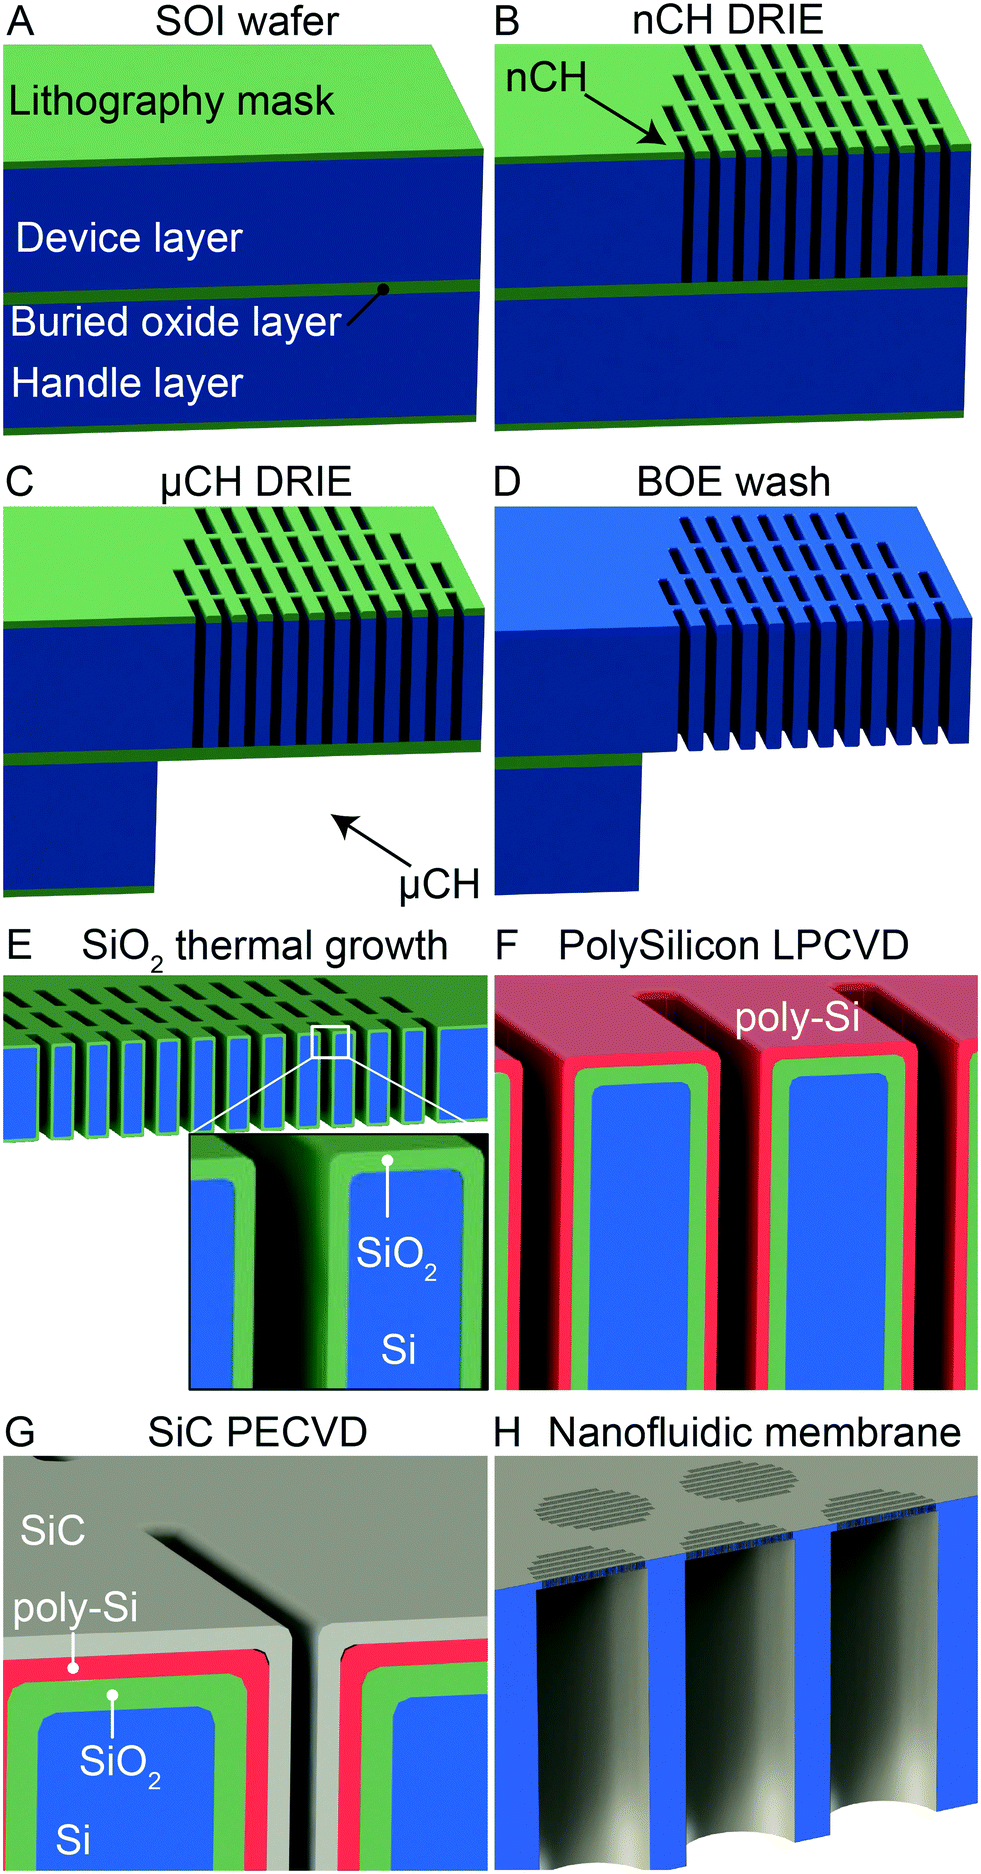 | ||
| Fig. 1 Fabrication process schematics. A) Silicon on insulator (SOI) wafer with lithography mask B) deep reactive ion etching (DRIE) for nanochannel (nCH) patterning. C) DRIE for microchannel (μCH) pattern. D) SiO2 mask removal. E) SiO2 thermal oxidation growth. F) Conductive poly-Si deposition. G) Insulating SiC deposition. H) Membrane structure. | ||
ICP deep silicon etching was used to etch through the 400 μm handle wafer, stopping at the buried oxide layer (Fig. 1C). After cleaning the polymer build up on the sidewalls of nanoslits and macrochannels, the buried oxide layer of the SOI was removed in a buffered oxide etchant (BOE) solution to connect the nanoslits and macrochannel mesh (Fig. 1D). More details can be found in ESI† note 2. The resulting nanoslits have a height of 770 nm. Following, a wet thermal oxidation was performed at 1055 °C in ultra-high-purity (UHP) water vapor for 11 min, resulting in a high temperature oxide (HTO) SiO2 formation that shrinks the nanochannel height to 580 nm (Fig. 1E). To form the gate electrodes, phosphorus doped polysilicon (poly-Si) was deposited (121 nm thickness) via low-pressure chemical vapor deposition (LPCVD; Fig. 1F). The whole wafer structure was coated with a 64 nm SiC dielectric layer via plasma-enhanced chemical vapor deposition PECVD (Fig. 1G). To expose the highly doped poly-Si, two contacts pads (∼1 mm2) were created at the edge of the membranes by selective removal of SiC by fluorine-based RIE.
Each wafer features 120 membrane chips, which were diced into individual membranes (6 × 6 mm2) via a dicing Saw (ADT 7100 Dicing Saw). Each chip presents 199 round microchannels organized in a hexagonal spatial configuration (Fig. 1H). Every microchannel is connected to 1400 identical slit nanochannels (length 10 μm) organized in 19 rows and 96 columns. Each membrane chip features a total of 278600 nanochannels.
Membrane degradation
To test the inertness of the membrane in view of implantable applications, we performed an in vitro study in simulated physiological conditions at 37 °C as well as in accelerated conditions at 77 °C. We employed two sets of membranes: 1) in the first set, the fabrication procedure was stopped at the thermal oxidation (set A), resulting in the outmost layer of SiO2 (∼300 nm), 2) the second set of membranes (set B) featured an outmost layer of SiC (∼70 nm), which was deposited as previously described right after SiO2 (∼270 nm) thermal growth. Each set of membranes was divided into 3 groups: the first group was soaked in 4 mL of 2 μM sodium fluoride (NaF) in PBS at 77 °C, the second group was soaked in the same solution at 37 °C and the third group – in 2 μM NaF in PBS also containing 16 mg mL−1 BSA at 37 °C. This resulted in a total of 6 groups with n = 4 replicates for each. To prevent exposure of SiO2 from the side in the set B, we covered the sides of each membrane with thermal epoxy (354-T Epoxy Technologies, Inc.) and cured at 150 °C for 30 minutes.The degradation study was run for a total of 120 days with timepoints every 15 to 30 days depending on the group. At each timepoint, the membranes were removed from the solution and triple rinsed in deionized water (DI H2O) followed by isopropyl alcohol (IPA) before being dried. To assess degradation, we measured surface roughness (AFM Catalyst), surface composition (EDAX, Nova NanoSEM 230) and thickness of the different layers (J. A. Woollam M2000U ellipsometer).
Focused ion beam (FIB), scanning electron microscope (SEM) imaging
The structure and fabrication repeatability of the nanofluidic membrane was assessed by imaging with a dual-ion beam (FIB) system FEI 235 at the nanofabrication facility of the University of Houston, Texas. Nanochannel cross sections were obtained using gallium ion milling. The resulting structures where imaged at a 52° angle using scanning electron microscopy (SEM).Electrode connection
Insulated high-temperature 36 AWG wires (9510T1, McMaster Carr, Douglasville, GA) were connected to the exposed contact using conductive silver epoxy (H20E, Epoxy Technology, MA) and cured at 150 °C for 1 hour. The conductive contact was then isolated with UV epoxy (OG116, Epoxy Technologies, Inc.) and cured with a UV lamp (UVL-18, UVL) for 2 hours.Dielectric leakage current
Gate leakage studies were performed in a custom made two reservoir fixture made of transparent poly(methyl methacrylate) (PMMA) (McMaster Carr, Douglasville, GA). Each reservoir contains 2 mL of solution. The membrane under testing was sandwiched between the two reservoirs by means of two silicon rubber O-rings (Apple Rubber, Lancaster, NY). The entire assembly was secured together by 4 SS316L M3 screws. Each reservoir contained two Ag/AgCl electrodes. Both reservoirs were filled with either 1xPBS, 0.1xPBS or 0.01xPBS solution. The voltage was applied between the gate electrode (working electrode) and the two Ag/AgCl electrodes (counter and reference electrodes) in the reservoir facing the nanochannels using an electrochemical workstation (CH Instruments, Inc. 660E). A staircase of 250 mV steps was applied from −3 V and +3 V. Each step was held for 30 s to allow for stable measurement and avoid confounding effects of transient phenomena.Conductance and I–V curves
Conductance and I–V curves were performed in the same two-reservoir fixture previously described for the leakage current. Conductance measurements were performed with a 4-electrode configuration, two for each side of the membrane. We employed KCl solution with concentrations ranging from 0.1 μM to 100 mM. The solution in both reservoirs was replaced after each measurement. The voltages were applied using an electrochemical workstation (CH Instruments, Inc. 660E). A staircase of 250 mV steps was applied from −1.5 V and +1.5 V. Each step was held for 30 s to achieve stable measurements unaffected by transients. The conductance measured as the ratio between current and applied voltage was calculated for each step and averaged. Each membrane was tested 3 times. Three different membranes were tested using the same procedure. No gate voltage was applied during conductance measurements.For current–voltage (I–V) curves we employed a two-reservoir fixture that featured 3 Ag/AgCl electrodes in one chamber to serve as a reference for the gate voltage. A 10 μM KCl solution was employed for these measurements. Voltages across the membrane (VDS) were applied using an electrochemical workstation (CH Instruments, Inc. 660E) in 4-electrode configuration. A staircase of 250 mV steps was applied from −1 V and +1 V. Each step was hold for 30 s to overcome transient phenomena. The gate voltage was applied between the gate electrode and the Ag/AgCl electrode in solution using an electrochemical analyzer (CH Instruments, Inc. 621D). A constant voltage of either −1.5 V, 0 V or 1.5 V was applied, and the current monitored.
Both measurements were performed on membranes with a poly-Si buried electrode and a SiC insulating layer with a nanochannels size of ∼300 nm.
In vitro release fixture
Release modulation experiments were performed with a custom made, two reservoirs fixture comprising of a macro cuvette (sink reservoir) and a drug reservoir. The cuvette was glued with UV epoxy (OG116, Epoxy Technologies, Inc.) to a PMMA (McMaster Carr, Douglasville, GA) membrane holder. The drug reservoir (500 μL capacity), made of PMMA, was secured to the membrane holder through 2 SS316L M3 screws. The membrane under testing was clamped between the two PMMA pieces, with 2 O-rings (2418T113, McMaster Carr, Douglasville, GA) to avoid solution leakage. The reservoir was capped with a silicone plugs (9277K87, McMaster Carr, Douglasville, GA).In vitro release modulation
Release modulation experiments were performed using 300 nm membranes with both poly-Si and SiC deposition. After the electrode connection, membranes were immersed in isopropyl alcohol for 1 h to ensure proper channel wetting, rinsed in deionized H2O at least three times and immersed in a sink solution of 0.01xPBS overnight. After filling the sink reservoir with 4.45 mL of 0.01xPBS solution, the membranes were assembled in the diffusion fixture. The source reservoir of the diffusion fixture was loaded with either 300 μg mL−1 Alexa Fluor 647 (Thermo Fisher Scientific, Waltham, MA) (N = 1) in 0.01xPBS, 200 μg mL−1 of poly(sodium 4-styrenesulfonate) (243051-5G, Sigma Aldrich, St. Louis, MO) in 0.01xPBS (N = 4) or 1 mg mL−1 of DNA (deoxyribonucleic acid sodium salt from herring testes; D6898-1G, Sigma Aldrich, St. Louis, MO) in 0.01xPBS (N = 2). At pH 7.4, all molecules are negatively charged: −3q (= −4.8 × 10⁻¹⁹ C) for Alexa Fluor, ∼−380q (= −608 × 10−19 C) for poly(sodium 4-styrenesulfonate) and highly charged DNA fragment which charge depends on the fragment length. A proof of concept release was performed with poly(sodium 4-styrenesulfonate) (N = 1) in 1xPBS both in the source and sink reservoir. A reference Ag/AgCl pellet electrode (Harvard Apparatus, Holliston, MA) was positioned in the source reservoir.The assembled diffusion fixtures were then loaded in a custom robotic carousel22 connected to a Cary 50 UV-vis spectrophotometer (Agilent Technologies). Absorbance measurements of the sink reservoir were automatically performed every 5 minutes. Between each measurement, the sink solution was under constant stirring to ensure sample homogeneity. Wavelengths used for detection were 647 nm for Alexa Fluor, 256 nm for poly(sodium 4-styrenesulfonate) and 260 nm for DNA. Electrical DC potentials were applied between the reference and the gate electrode using an arbitrary waveform generator (Keysight Technologies 33522A) in a succession of passive (0 V) and active (−1.5 V or −3 V) phases. Phase durations were 12 h and 8 h for passive and active, respectively. Phases where shortened for DNA release, due to its high molar extinction coefficient to 6 h and 4 h for passive and active, respectively. These shortened phases were also used for the controlled release of polySS in 1xPBS for a total of 4 cycles.
Statistical analysis
Graphs were plotted and statistical data analyses were performed with GraphPad Prism 8 (version 8.1.1; GraphPad Software, Inc., La Jolla, CA). Data are represented as mean ± SD. Statistical significance was determined using two-tailed paired t-tests. For statistical analyses, the cumulative release of each phase was fitted with a first order polynomial using MATLAB® polyfit function. The resulting angular coefficient represent the release rate of the considered phase.Results and discussion
Nanofluidic membrane
To assess the quality of the fabrication process, all chip membranes were first visually inspected trough optical microscopy. We then performed gas test characterization on all chips to assess the nanochannel dimension uniformity across the wafer. We employed a previously developed model to predict the nanochannels dimension from the measurement of transmembrane nitrogen gas flow upon application of a pressure difference.23 A Gaussian non-linear fit (R2 = 0.99) of the cumulative distribution of the obtained values shows a predicted nanochannel size of 292 ± 44 nm. Selected chips were further analyzed using FIB-SEM imaging (Fig. 2). Fig. 2A shows a picture of a single diced chip which has a size 6 × 6 mm2 and a thickness of 400 μm. The membrane features 199 cylindrical microchannels which measure 200 μm in diameter and 390 μm in length.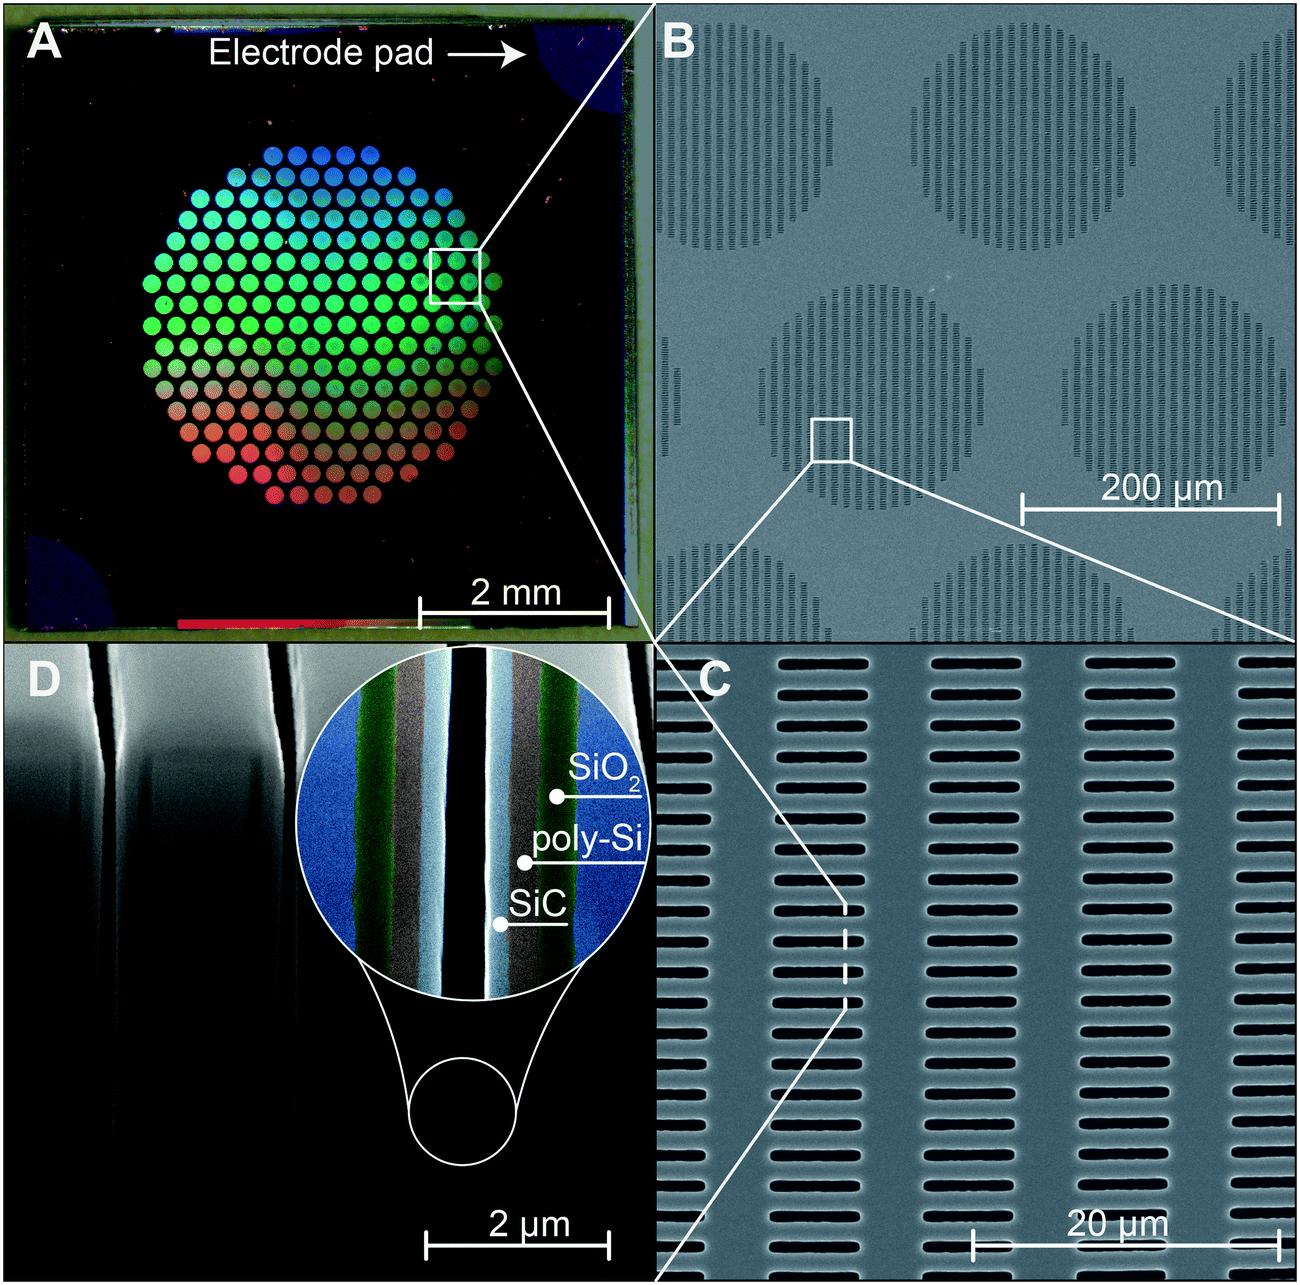 | ||
| Fig. 2 Nanofluidic membrane. A) Picture of the nanofluidic membrane which measure 6 mm × 6 mm with a total thickness of 400 μm. B) SEM image of the top face of the membrane (device layer) that shows the vertically etched nanochannels arranged in circles. C) SEM image of nanochannels array. D) FIB-SEM image of nanochannel cross-section which shows the vertical nanochannels and highlight the layer stack on the nanochannels walls. In order from the innermost (silicon, blue) to the outermost layer there is silicon dioxide (SiO2, 175 nm, green), n-doped polycrystalline silicon (poly-Si, 121 nm, red) and silicon carbide (SiC, 64 nm, gray). The different layers in the FIB image are artificially colored for clarity. | ||
The hexagonal configuration of the cylindrical microchannel ensures high channel density and structural mechanical robustness. Nanochannels are efficiently aligned in a circular pattern that matched the microchannel area (Fig. 2B and C). Fig. 2D shows FIB cross sections of the slit nanochannels where despite the high aspect ratio, all deposited layers show high uniformity (inset of Fig. 2D). The innermost SiO2 layer created via slow thermal oxidation allows for tight control of the nanochannels dimension. The poly-Si is used as a distributed gate electrode that extends for the whole nanochannels area to offer high electrostatic gating performances. External connection to the poly-Si layer is possible through the conductive pads at the edge of the chip (Fig. 2A). The outer-most layer of SiC forms an excellent bio-inert coating, while serving as an insulating layer for the gate electrodes. As the SiC deposition is performed on both sides of the wafer, a slightly thicker layer of SiC can be noted at the entrance and exit of nanochannels due to the limited diffusivity of precursor gases in nanoconfinement during deposition. We do not expect this slight non-uniformity to decrease the performance of our membrane, instead, it can potentially increase it. In fact, as the nanochannel narrows, the electrostatic effect on charged particles increases, resulting in a more pronounced gating effect.
As compared to our previous technology24–26 the present membrane presents two key advantages: i) the streamlined fluidic structure, with cylindrical microchannels directly connected to the array of through nanochannels allows for a substantially simplified fabrication process;27 ii) by accounting for same nanochannel size, the fluidic architecture achieves a 45% and 37% reduction in diffusive length and resistance, respectively. As compared to other AAO-based gating systems,28 which dispersed pores size can affect performances,29 the present membrane possesses monodispersed channel dimensions. This is important in the context of the tight control of drug delivery. Further, in contrast to most gated fluidic systems, designed for the evaluation of electrostatic phenomena,30 our technology achieves molecular transport rates suitable for medical applications.
Degradation study
In vitro degradation testing was performed to evaluate the membrane chemical robustness in view of its application for implantable drug delivery. The testing conditions in PBS at 37 °C were chosen as they represent an established model of biological fluids in subcutaneous tissues. Accelerated conditions at 77 °C allowed us to monitor long-term degradation within a shorter timeframe, while maintaining relevance with respect to the physiologic conditions. Moreover, because fluoride ions are known to readily erode various types of silicon containing materials, we tested membrane stability in solutions containing NaF. Fluoride is present in small quantities in drinking water as well as in physiological fluids. Importantly, in humans, fluoride ions are not regulated homeostatically and fluoride concentration in plasma averages at 0.01 ppm.31 We therefore decided to conservatively use a solution containing almost 4 times the average fluoride concentration found in human plasma (2 μM).Fig. 3A, D and G show the surface composition of the chips analyzed through energy dispersive X-ray spectroscopy (EDX). For SiO2 chips in accelerated conditions (Fig. 3A), the relative abundance of silicon and oxygen peaks significantly changed during the first 30 days, resulting in an increasing trend of silicon presence. EDX analyses a volume deeper than the thickness of our SiO2 layer, including the underlying silicon. Therefore, the shift in composition toward silicon suggests an erosion of the initial SiO2 layer (∼300 nm). The reduction in silicon oxide thickness was corroborated by ellipsometry measurements (Fig. 3C), which show a constant decreasing trend. However, surface roughness (Fig. 3B) did not show any significant changes during the first 30 days, hinting small to no change in solid–liquid interface composition. Interpolation of the ellipsometry measurements during the first 30 days yields a corrosion rate of 8.5 nm per day, which predicts the complete degradation of the silicon oxide layer in ∼35 days. In fact, the surface roughness (Fig. 3B) increase after day 30 suggesting a change in surface composition, likely due to a change in exposed surface from silicon oxide to silicon. The presence of oxygen in the EDX for the 45 and 60 days timepoints does not exclude the hypothesis that the thermal grown oxide is completely corroded. This can be explained by the formation of Si–O–Si bonds that occurs due to nucleophilic attack of oxygen from OH-terminated Si to nearby surface Si atoms with dangling bonds.32 The silicon surface is concurrently oxidized and hydrolyzed by the surrounding water. The rate of this corrosion process is likely higher than the silicon oxide corrosion rate, resulting in an increased surface roughness as reported by the AFM measurements (Fig. 3B).
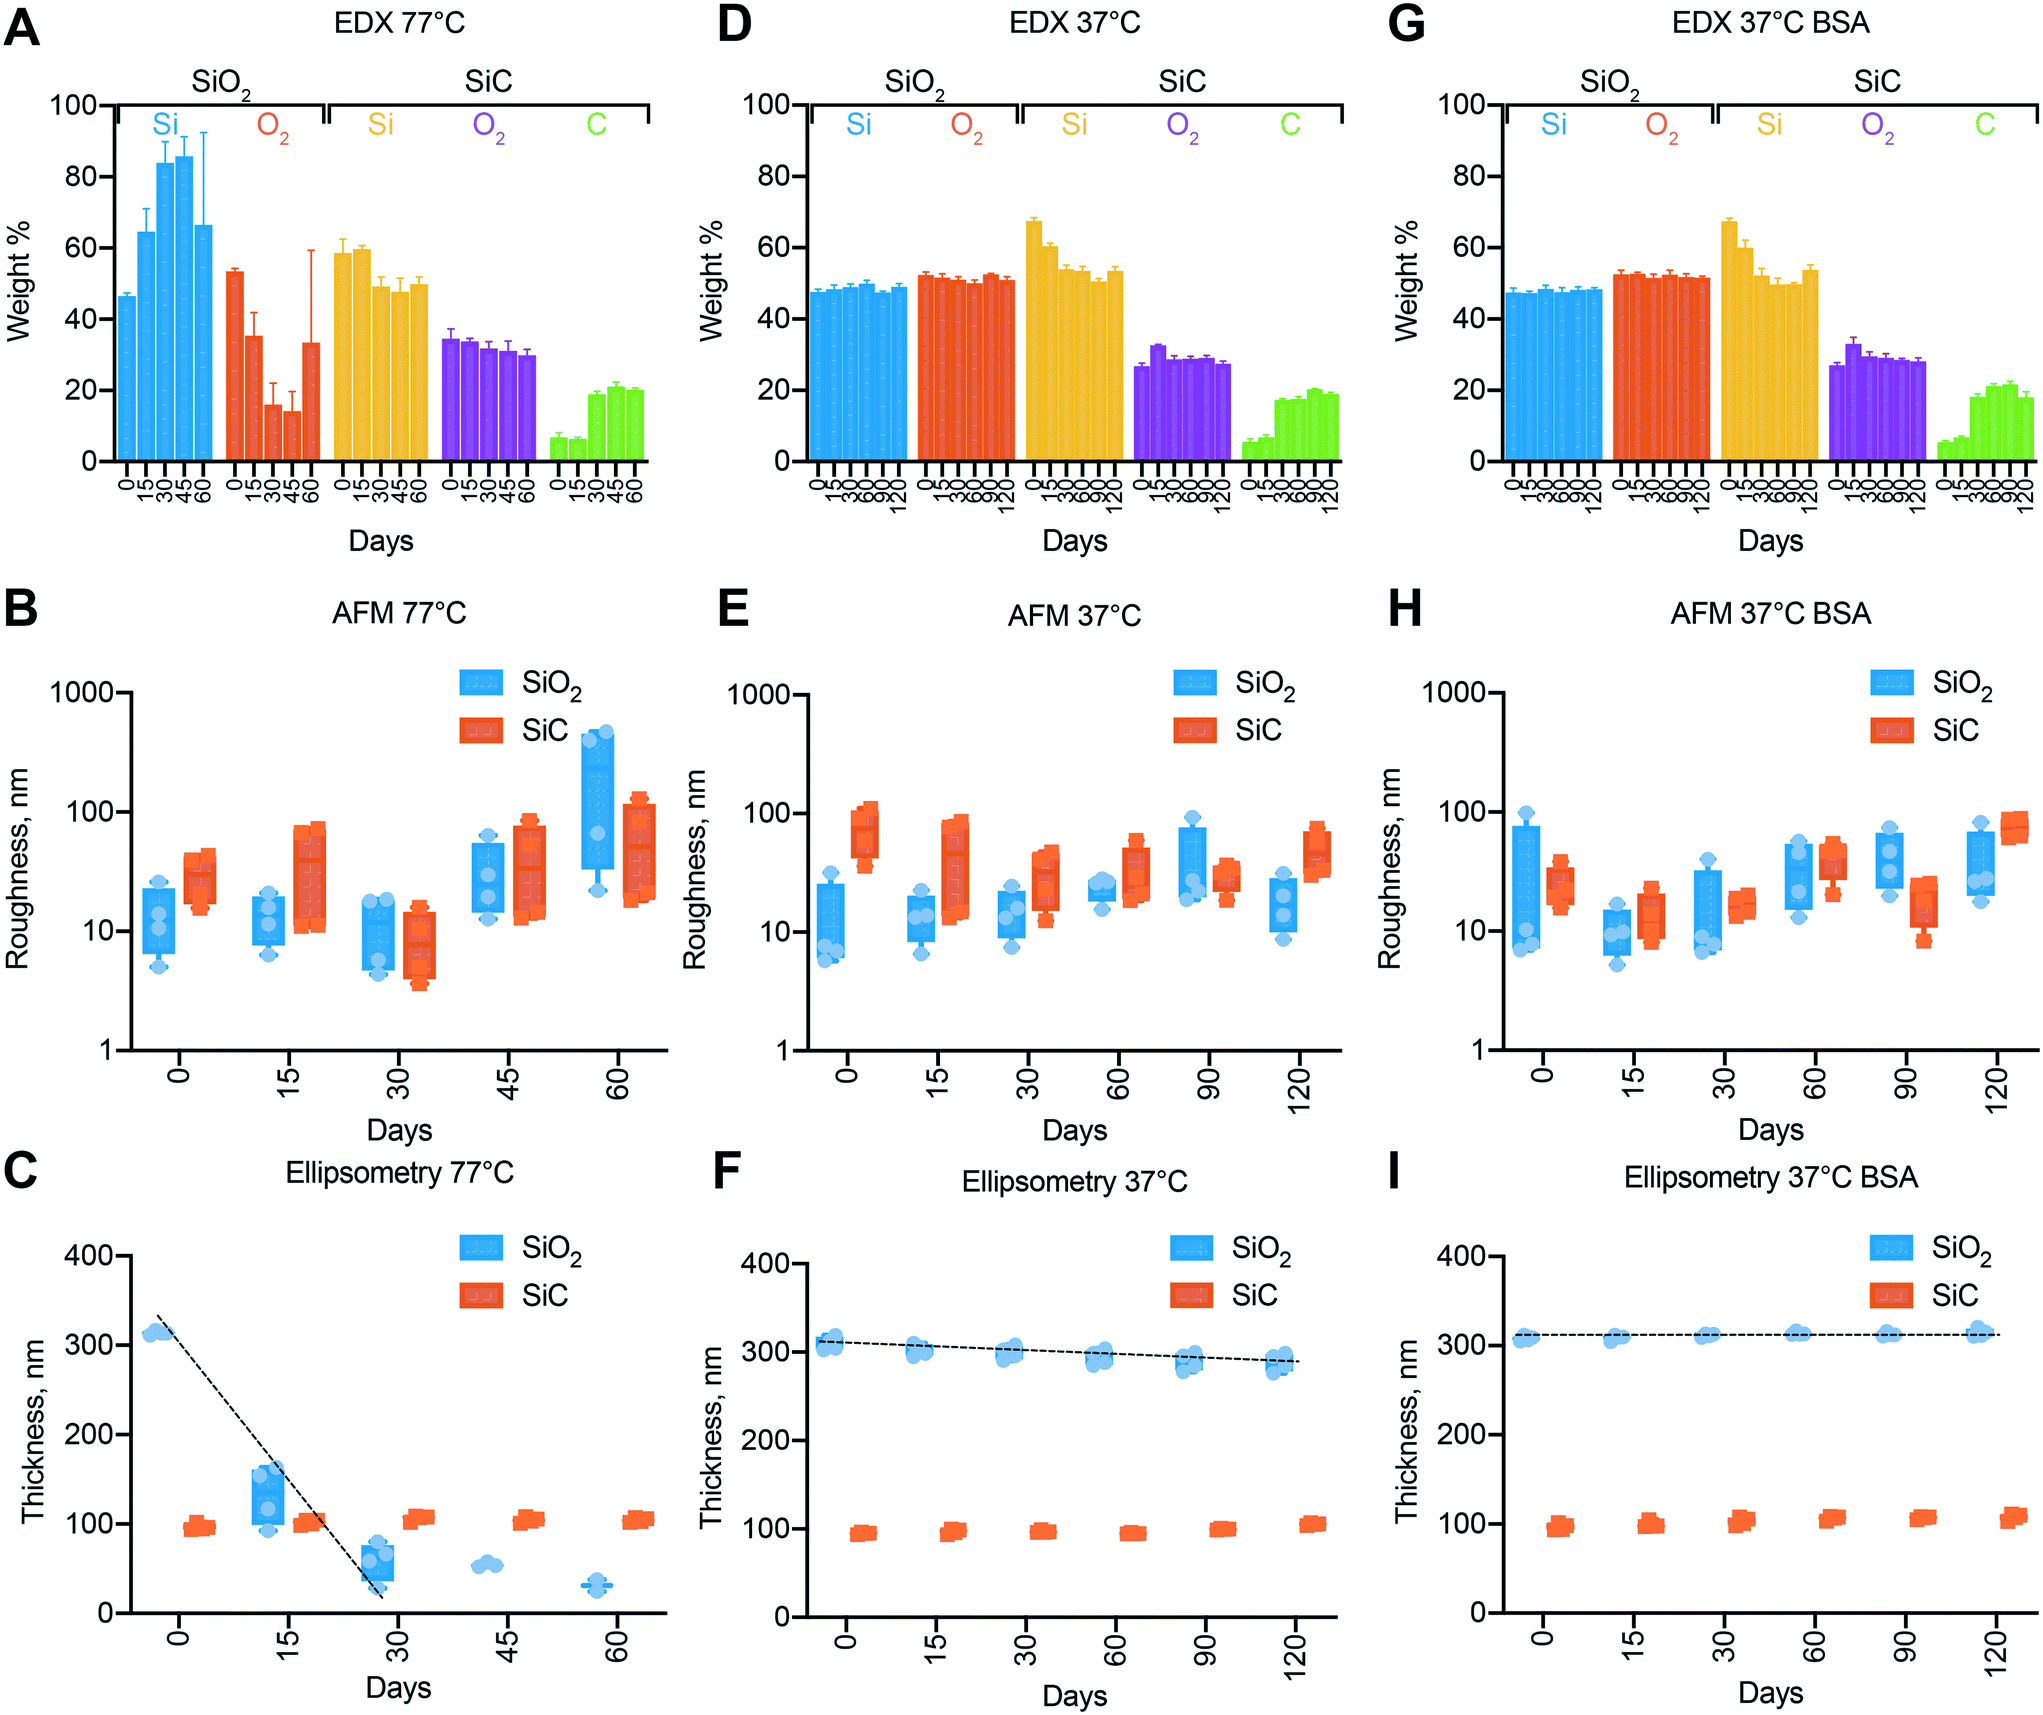 | ||
| Fig. 3 Nanofluidic membrane degradation. Energy-dispersive X-ray spectroscopy (EDX) for membranes coated with SiO2versus SiC at 77 °C (A), 37 °C (D) and at 37 °C with BSA (G). Surface roughness calculated with atomic force microscopy (AFM) for membranes coated with SiO2versus SiC at 77 °C (B), 37 °C (E) and at 37 °C with BSA (H). Layer thicknesses fitted through ellipsometry data for membranes coated with SiO2versus SiC at 77 °C (C), 37 °C (F) and at 37 °C with BSA (I). | ||
In contrast with SiO2 coating, membranes presenting a SiC outmost layer did not show appreciable trends of degradation (Fig. 3A–C). The thickness of SiC measured with ellipsometry (Fig. 3C) was constant over the whole duration of the experiment, demonstrating inertness of SiC in electrolytic solutions, even in the presence of fluoride ions. It should be noted that EDX revealed a sharp increase in abundance of carbon concurrent with the reduction of silicon at 30 days (Fig. 3A). Due to the abrupt rather than continuous change and the absence of carbon source, we attribute this observation to a poor fitting of the EDX spectrum which suffers from suboptimal signal-to-noise ratio.
No notable trends were observed in either the surface composition or roughness at 37 °C (Fig. 3D and E). However, the thickness of the silica layer was slowly decreasing as evident by ellipsometry (Fig. 3F). The degradation rate was obtained by fitting the data points and is equal to 0.17 nm per day. To evaluate the effect of the addition of fluorine ions on degradation we calculated the temperature coefficient (γ) of silica degradation by assuming linear degradation kinetics and adopting the Arrhenius equation33 (see ESI† note 2). A higher value that reported in the literature (typically γ = 2–2.3)34 was obtained (γ = 2.7), which is indicative of the harsher degradation conditions generated by fluorine ions. Even in this setting, SiC coated membrane showed no sign of degradation, demonstrating superior chemical inertness and suitability for long-term implantable applications.
Further, we investigated the influence of protein adsorption on surface degradation (Fig. 3G, H and I). Membranes were incubated at 37 °C in PBS solution containing 1.6% BSA, concentration compatible to what previously reported in the subcutaneous space.35 Ellipsometry measurements showed no evidence of surface silica loss throughout the whole duration of the experiment. While in solution, BSA adsorb to the silica surface, creating a uniform layer that has been reported to exhibit properties typical of BSA.36 In these conditions the adsorbate masks the silica properties and limits the diffusive access of water to the surface. Thus, protecting the underlying silica from corrosion.32
Overall, we found that silicon oxide erodes at appreciable rate in the absence of proteins at 37 °C and very fast at 77 °C. Despite the spontaneous formation of protective protein layer, it is not reliable for long term use in vivo. In contrast, silicon carbide showed superior stability and no evidence of degradation was observed across all tested conditions, including incubation in 2 μM fluoride buffer at 77 °C.
Gate leakage current, SiO2vs. SiC
To test the performance of SiC as a dielectric insulator, we measured gate leakage current and compared it to an equivalent chip with a SiO2 insulator layer instead of SiC. SiO2 and in general metal oxides represent the standard for gate dielectrics in solid electronics.37 However, lack of durability and reliability of SiO2 in aqueous environment leads to the adoption of alternative materials such as SiC. As the leakage current is affected by the ionic strength of the solution,38 we analyzed leakage for both SiO2 (Fig. 4A) and SiC (Fig. 4B) at three different ionic strengths. | ||
| Fig. 4 Gate leakage current. Gate leakage current at different solution concentrations for SiO2 dielectric layer (A) and SiC dielectric layer (B). | ||
Our results clearly show a linear dependence of the leakage current on the ionic strength of solution for both dielectric materials, hinting that the origin of this phenomena lies on the ionic charges in solution. As opposed to solid electronics where SiO2 and SiC have high intrinsic breakdown voltages, ∼15 MV cm−1 (ref. 39) and ∼2 MV cm−1 (ref. 40) respectively, we measured leakage currents in the order of μA for 0.5 MV cm−1. These findings are related to the ‘non-ideality’ of the insulating materials as the presence of defects and irregularities both in the oxide layer or at the Si–SiO2 interface can increase the current flow at low electric fields.41
Although this phenomena has been investigated for more than 50 years, several aspects of the time-dependent dielectric breakdown are not yet fully understood, especially in the presence of aqueous solutions.39 The most accepted theory (percolation model) postulates that with the application of an external electric field, electrons are injected and trapped into the oxide. There they can create clusters that, when within tunneling distance, create percolating paths (known also as conductive filaments).42 These lead to increased currents trough the insulating films.43 In aqueous solutions, formation of defects can be accelerated by the migration of protons in the insulating material44 where the dissolution of a percolating path can create nanometric pores.45 Therefore, high ionic strength of solution results in a high probability of the defect formation and thus high leakage currents.
Interestingly, the current for negative applied voltages is significantly higher than the respective positive voltages especially for SiC. We attributed this asymmetry to two factors: 1) as a “not ideal” conductor, doped poly-Si suffers from polydepletion,46 where, a depletion region can form at the poly-Si/dielectric interface. Depending on the gate voltage, polydepletion can either help or prevent the channel formation (in an equivalent MOSFET)47 resulting in the asymmetry we observed; 2) the mechanism of formation of conductive filaments inside the insulating material depends on the voltage applied. With a negative voltage, the electric field pulls protons from the solution to the solid interface. Protons travel through the insulator and can interact with electrons when they reach the insulator/poly-Si interface. This mechanism promotes the formation of a conductive filament in the insulating material, resulting in high currents. Conversely, a positive voltage, pushes the protons toward the solution, resulting in the breaking of eventual conductive filaments already present significantly lowering leakage currents.
Both dielectrics seem to be affected by these phenomena. However, in aqueous environment SiC has the advantage of being more stable. In light of this, we selected it for the following experiments.
Mechanism of electrostatically gated diffusion in nanochannels
Molecular diffusion in nanoconfinement exhibits peculiar phenomena which are typical of the nanoscale.48,49 Charged particles electrostatically interact with the charged surfaces of the nanochannel walls creating an ionic distribution known as electric double layer (EDL). The EDL can extend several nanometers into the solution depending on parameters such as ionic strength and surface charge. In our case, SiO2 exposes negative silanol (SiO−) groups when in aqueous solution (pH 7.4) resulting in a net negative charge at the solid/liquid interface.50 Albeit in smaller density, SiC also exposes negative silanol groups resulting in an interface behavior similar to SiO2.51,52 The extent of electrostatic interaction with the wall has a characteristic dimension called Debye length and the potential distribution at the solid–liquid interface is often described using the Poisson–Boltzmann equation.53 In this region, every charged molecule electrostatically interacts with the surface charge and their distribution is such that the nanochannel maintains electrostatic neutrality. The surface charge dictates the total concentration of charged molecules in the channel. Thus, control over the surface charge affords modulation of nanochannel selectivity toward charged molecules. In principle, the surface charge could be increased to completely impede a co-ion from entering the channel, creating an electrostatic gate.54The surface charge can be modified by applying a potential between poly-Si and the electrolyte solution. When no voltage is applied, free diffusion of negative molecules occurs (Fig. 5A). When negative potential is applied, the increase in exposed surface charge results in larger Debye length and increased repulsion of negatively charged molecules from the channel (Fig. 5B). The surface charge can be assessed through membrane conductivity measurements, while the change in permeability can be investigated measuring the I–V characteristic.
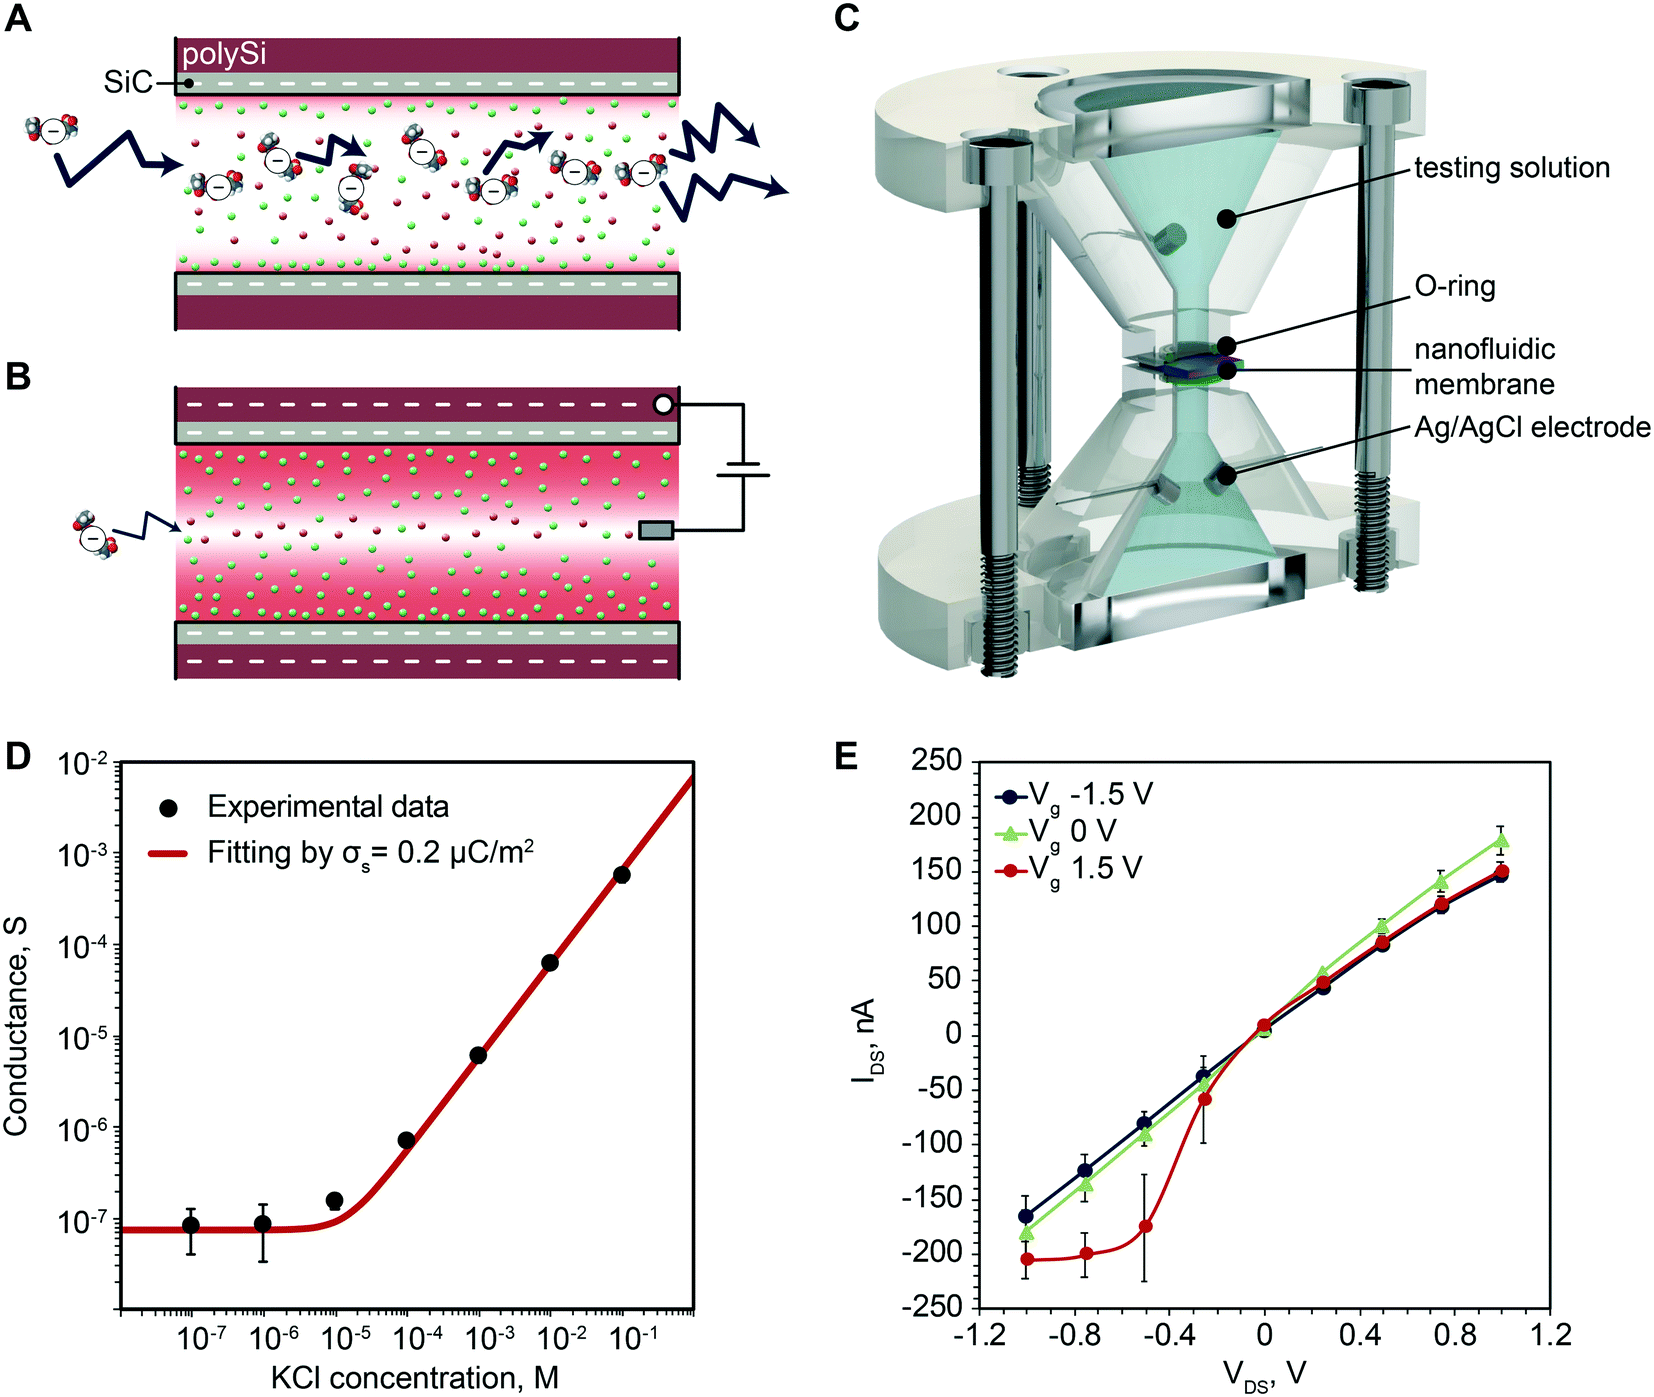 | ||
| Fig. 5 Electrochemical characterization. A) Concentration driven diffusion of negatively charged molecule. B) Gated diffusion of negatively charged molecule. C) Rendering of ad hoc device for electrochemical measurements. D) Measured ionic conductance of the membrane. E) Current–voltage (I–V) curves for the membrane. | ||
Electrochemical characterization of the nanofluidic membrane
To test the ability to modulate the membrane surface charge we first investigated the ionic conductivity at different electrolyte concentration and then measured the I–V characteristics. We employed a custom-made fixture (Fig. 5C) to hold the membrane between two reservoirs, which and allows membrane wetting exclusively at the nanochannel area.
Fig. 5D shows the measured ionic conductance. Two regimes can clearly be highlighted, the bulk conductance region and the surface dominated conductance region.55 For high concentrations, the nanochannel height over Debye length ratio is h/λ ≫ 1. The measured conductance is consistent with that of bulk electrolyte solution, and proportional to its ionic strength. For h/λ ∼ 1 or h/λ < 1, where the Debye length is comparable with characteristic dimension of the channel, the conductivity becomes independent of the ionic strength and channel height. In this scenario, channels are enriched in counter-ions to compensate for the surface charge and reach local neutrality. Thus, the measured conductance only depends on the exposed surface charge. For our membranes the transition between bulk and surface dominated conductance happens in a 10 μM KCl solution, where the Debye length is expected to be ∼200 nm. The experimental results are in good agreement with the known conductance equation:55
Fig. 5E shows representative I–V curves where a clear dependence of transmembrane current with gate voltage can be seen. Specifically, we observed an increase in conductance with the application of a positive gate potential especially for negative transmembrane voltages. Although unusual for SiO2 nanochannels, where the conductance decreases when a positive gate voltage is applied, it has been previously reported and attributed to a slip flow at the wall.57 This phenomenon happens for SiO2 channels when the external VDS is intense enough to overcome the attraction of the K+ ions within the Stern layer and move along the Stern layer, tangential to the surface. This explanation is further corroborated by the fact that the SiC surface exhibits a significantly smaller surface charge (0.2 μC m−2) when compared to SiO2 (1–100 mC m−2).58
In vitro release rate modulation of Alexa Fluor 647
As a proof of concept for the controlled release of small molecule therapeutics, which represent the vast majority of drugs,59 we investigated Alexa Fluor 647 (AF647). AF647 is a fluorescent dye that offers high photostability and sensitivity. AF647 presents a molecular weight of ∼1 kDa, and is a good surrogate for charged small molecule therapeutics. The release was performed in a custom-made release fixture (Fig. 6A) where an external voltage generator (represented as battery) switched the applied voltage between 0 V and −1.5 V in alternating phases. | ||
| Fig. 6 Modulated release of Alexa Fluor 647. A) Rendering of custom device used for in vitro release rate modulation. B) In vitro cumulative release modulation of Alexa Fluor (top). Release rate for every phase, normalized to the average of the passive phases. Blue and red line represent the average of the passive and active (−1.5 V) phases respectively. | ||
Fig. 6B shows the cumulative release of the negatively charged AF647 where the passive (12 h) and active (8 h) phases are highlighted by the blue and red background respectively. During the passive phases the molecules are released following a concentration driven diffusion, achieving a constant release rate. Upon application of the active phase, co-ions repulsion reduces the concentration of negatively charged molecules in the channel, AF647 included, resulting in a reduced transmembrane diffusion. The phase switching is repeated for 14 cycles, demonstrating repeatability of the electrostatic gating phenomena. We observed smooth release rate transitions, which can be attributed to various factors, including i) capacitive charge/discharge of the poly-Si gate; ii) transient formation or dissolution of percolating paths in the dielectric; iii) rearrangement of charged species in nanochannels. While it is difficult to pinpoint the contribution of each of these factors, smooth transitions are desired therapeutic administration. In fact, they can avoid peak-and-trough plasma fluctuations that can elicit adverse side effects and negatively impact treatment.60
For ease of comparison, release rates calculated for each phase form cumulative profiles are plotted in Fig. 6B (bottom bar graph). To quantify the effect of gating we averaged the release rate of each phase (horizontal lines) and compared the active to the passive release. We observed a 60% reduction of release rate during active phase and an average release rate of ∼1 μg per day during passive phases. Release rates in the order of μg per day are in line with daily therapeutic doses for numerous small molecule therapeutics. This is the case for glucocorticoids,5 antivirals61 and hormone therapeutics,62 among others.
In vitro release modulation of polystyrene sulfonate
More than 40% of newly developed drugs are poorly soluble in water63,64 and require vehicles for their administration. In this context, to assess the ability of our membrane to modulate the release of larger molecular constructs such as drug carriers,65 we adopted poly(sodium 4-styrenesulfonate). PolySS (70–1000 kDa) is a polyelectrolyte used for the treatment of acute and chronic kidney disease66 and for the encapsulation of pharmacologically active compounds that exhibit poor water solubility.67,68 Additionally, polySS presents high exposed charge, which allow for effective transport modulation via electrostatic gating.Fig. 7A shows the cumulative release of polySS when alternating passive (blue) and active phases (brown or red). During the first 5 active phases (brown) a voltage of −3 V was applied to the gate electrode, while during the last 3, the voltage was reduced to −1.5 V. As previously shown for AF647, the application of a gate voltage consistently decreased the release rate when compared to the passive phases, where a sustained release was observed. It is important to notice how for −3 V the release rate was almost completely stopped while for −1.5 V the release rate was considerably reduced, but not interrupted. We calculated the slope of each cumulative release and then normalized it to the passive release rate (Fig. 7A, bottom) to clearly show the differences between the release rates of active and passive phases. More importantly, the reduction and restoring of the release upon change of the applied voltage is consistently repeated demonstrating that electrostatic gating performances do not degrade over time. During the passive phases, we measured an average release rate of 12 μg per day, which is clinically relevant in the context of hormone replacement therapies.69 In these applications, our technology could emulate the function of the body by providing hormone release profiles that mimic the circadian cycle of hormone secretion.70
 | ||
| Fig. 7 Modulated release of poly(sodium 4-styrenesulfonate). A) In vitro cumulative release modulation of polySS (top). Release rate for every phase, normalized to the average of the passive phases (bottom). B) In vitro cumulative release modulation of DNA (top). Release rate for every phase, normalized to the average of the passive phases. Red line represents the average of the active (−1.5 V) phases. | ||
In vitro release modulation of DNA salt
To demonstrate the controlled delivery of gene therapeutics we performed a release study with DNA salt as a surrogate for plasmid DNA (pDNA) or small interfering RNA (siRNA). pDNA and siRNA are the two main vectors used in gene therapy for the treatment of incurable diseases such as cancer or various genetic disorder.71Fig. 7B shows the cumulative release of DNA when alternating passive (blue) and active phases (red). As for the AF647 and polySS, the application of a negative voltage (−1.5 V) led to a substantial decrease of release rate with respect to the passive phase. Release rate analysis and normalization to the passive phases (Fig. 7B bottom) resulted in an average reduction of release rate of 50% of the passive release (Fig. 7B bottom red line). The passive phase yielded an average release rate of 89 μg per day. A target therapeutic dose for siRNA cannot be clearly identified, in part due to the fact that gene silencing therapies are still under development.72 However, this result provides confidence of the ability of our system to function in conjunction with biologics, and control molecular transport at rates that are within the same order of magnitude of experimental therapies.73Performance of release modulation through electrostatic gating
To better demonstrate the performance of electrostatic gating, Fig. 8 shows the normalized release rates of the molecules used in this study, when grouped by applied voltage. For AF647 the application of −1.5 V resulted in a ∼60% reduction of the release rate. | ||
| Fig. 8 Statistical analysis of release modulation. Release rates grouped by typology and compared. | ||
Similarly, for polySS both applied voltages in the active phases yielded a significant reduction in release rate of 77% and a remarkable 98% for −1.5 V and −3 V respectively. Importantly, for polySS the two active phases lead to a diffusivity reduction proportional to the intensity of the applied voltage, which is easily justifiable by different EDL extents when the surface charge density is changed. In fact, if the EDL extends to the whole nanochannel volume, co-ions repulsion results in an almost complete interruption of analyte diffusion. The analyte charge plays a central role in gating performances, as a higher charge leads to greater repulsion forces. Indeed, our results show that polySS yielded a more pronounced reduction in release rate compared to AF647 with the application of −1.5 V.
In the case of DNA release, we were also able to show a statistically significant difference in release rate when grouping the calculated slopes by phase typology. In this context, it is remarkable how even despite the presence of the DNA molecules of different lengths, dimensions and overall charge, the gating effect produced by our membrane was consistently and repeatedly able to decrease the diffusion rate through the nanofluidic channels. Nonetheless, we recognize that the performance achieved with the modulation of DNA is slightly less impressive than the one observed with polySS and we attribute the difference to the lower overall charge of DNA molecules. In fact, even though we expected a 60–70% reduction with the application of −1.5 V, we achieved a 50% reduction, likely due to small DNA fragments diffusion through the bulk region of the nanochannels.
Fig. 8 also shows the release rate modulation of polySS in PBS solution. We performed this release as a proof of concept of the ability of our current gated membrane to control drug release in an environment that mimics in vivo ionic strength conditions (1xPBS). An average reduction of release rate of 55% was achieved with the application of −1.5 V. Even though the modulation (decrease) of release rate results less dramatic as compared to the results obtained with 0.01xPBS (77% decreased release rate), our results indicate that electrostatic gating is a viable strategy for drug release modulation in vivo. Moreover, the same results obtained with 0.01xPBS could be obtained in high ionic strengths fluids using higher wall potentials or smaller nanochannels. As increasing the applied potential would increase power consumption, we intend to adopt smaller nanochannels for further development of the technology.
It is worth mentioning that although in this study we have investigated the release modulation of negatively charged molecules, our membrane can be employed with positive molecules as well. However, our approach to drug release modulation is using electrostatic gating to increase the charge selectivity of channels and effectively generate a reduction in transport of co-ions. In this context, we start from negatively charged nanochannels to further increase the negative surface charge to limit the trans-membrane diffusion of negative charged species. We chose this approach as it represents the most energy efficient method to modulate drug release. While inverting the native silica surface charge from negative to positive is feasible, this requires higher applied gating potential and high corresponding leakage currents.74 In turn, this negatively affect the energy efficiency of our system. In light of these consideration, we focused this proof of concept manuscript on adjusting the release rate of negatively charged molecules only. The same principle can be applied to positively charged molecule replacing SiC with a material that exposes positive charges, such as alumina.
Electrostatic gating energy efficiency
In our analysis, power consumption ranging from 1.5 μW to 45 μW was measured depending on the applied voltage. Accordingly, commercially available and implant compatible 200 mA h batteries could support implant autonomy from 6 months to a few years, depending on the schedule of applied voltages. Compared to our previous work,75,76 we were able to reduce power consumption by almost one order of magnitude. This was achieved by adopting electrostatic gating as opposed to electrophoresis or ionic concentration polarization, which were associated with substantially higher currents. In electrostatic gating the energy consumption is determined by leakage currents through the dielectric film. Materials such as high-k dielectrics can achieve very low leakage currents. However, they lack biocompatibility and bioinertness. Thus we chose SiC as it showed exceptional bioinertness and achieved power consumptions comparable to previously developed gating devices.29,77Conclusions and future outlook
Here we presented a nanofluidic membrane that, by leveraging electrostatic gating, achieves efficient and reliable release rate modulation of charged analytes. The SiC coating guarantees superior chemical bioinertness for long-term implantation78,79 and the high nanochannels density allows for release rates suitable for medical applications. Moreover, the proportional response observed between the applied voltage and release rate reduction offers straightforward implementation as a drug delivery actuator in sensor-based systems. In this scenario, membranes can be connected to control circuitry that autonomously, under remote control, or with a pre-established schedule can deliver therapeutics tailored to patient needs.Our future investigations focus on the integration of the present technology in our previously developed implantable device for remote control of drug administration. Upon successful integration we will move toward in vivo demonstration of repeatable administration of therapeutic agents. Moreover, due to unavoidable limited lifespan of batteries we are exploring alternative strategies for power source such inductive rechargeable batteries and energy harvesting from the human body.
Although further developments are needed, this study paved the way toward the use of electrostatic gating as a mean of repeatable modulation of drug delivery. The ability to reversibly control the permeability of a nanofluidic membrane with the simple application of an external voltage renders this technology an ideal actuator for drug delivery. In fact, it could be integrated with a completely implantable platform that provides a low-intensity power source that could either be a rechargeable battery or an energy harvesting device, avoiding constant external energy supply. This technology offers promise as a drug delivery actuator for the next generation of closed-loop drug delivery systems for personalized medicine.
Author contribution
NDT: conceptualization, data curation, formal analysis, investigation, software, visualization, and writing original draft. ASilvestri: conceptualization, data curation, methodology, formal analysis, investigation and visualization. ASizovs: conceptualization, supervision and validation. YW: methodology and investigation. DRE: methodology and investigation. DD: validation. XL: conceptualization, methodology, investigation. AG: conceptualization, funding acquisition, project administration, writing original draft and validation.Conflicts of interest
All the authors declare no conflicts of interest.Acknowledgements
We thank Valentina Serafini for her support in experimental studies and Dr. Jianhua (James) Gu from the electron microscopy core of the Houston Methodist Research Institute. Funding support was provided by the Houston Methodist Research Institute and NIH-NIGMS R01GM127558. Additional support was received through the Frank J. and Jean Raymond Centennial Chair Endowment.References
- S. A. Dugger, A. Platt and D. B. Goldstein, Drug development in the era of precision medicine, Nat. Rev. Drug Discovery, 2018, 17, 183–196, DOI:10.1038/nrd.2017.226.
- U. R. M. Mujeeb, M. H. Nazari, M. Sencan and W. V. Antwerp, A Novel Needle-Injectable Millimeter scale Wireless Electrochemical Glucose Sensing Platform for Artificial Pancreas Applications, Sci. Rep., 2019, 9, 17421, DOI:10.1038/s41598-019-53680-7.
- M. J. Taylor, et al. Closed-loop glycaemic control using an implantable artificial pancreas in diabetic domestic pig (Sus scrofa domesticus), Int. J. Pharm., 2016, 500, 371–378, DOI:10.1016/j.ijpharm.2015.12.024.
- M. Farina, J. F. Alexander, U. Thekkedath, M. Ferrari and A. Grattoni, Cell encapsulation: Overcoming barriers in cell transplantation in diabetes and beyond, Adv. Drug Delivery Rev., 2019, 139, 92–115, DOI:10.1016/j.addr.2018.04.018.
- M. N. Yasin, D. Svirskis, A. Seyfoddin and I. D. Rupenthal, Implants for drug delivery to the posterior segment of the eye: a focus on stimuli-responsive and tunable release systems, J. Controlled Release, 2014, 196, 208–221, DOI:10.1016/j.jconrel.2014.09.030.
- W. M. Compton and N. D. Volkow, Improving Outcomes for Persons With Opioid Use Disorders Buprenorphine Implants to Improve Adherence and Access to Care, JAMA, J. Am. Med. Assoc., 2016, 316, 277–279, DOI:10.1001/jama.2016.8897.
- L. Osterberg and T. Blaschke, Drug therapy - Adherence to medication, N. Engl. J. Med., 2005, 353, 487–497, DOI:10.1056/NEJMra050100.
- P. V. Burkhart and E. Sabate, Adherence to long-term therapies: Evidence for action, J. Nurs. Scholarsh., 2003, 35, 207–207 Search PubMed.
- F. P. Pons-Faudoa, A. Ballerini, J. Sakamoto and A. Grattoni, Advanced implantable drug delivery technologies: transforming the clinical landscape of therapeutics for chronic diseases, Biomed. Microdevices, 2019, 21, 47, DOI:10.1007/s10544-019-0389-6.
- J. Heikenfeld, et al. Wearable sensors: modalities, challenges, and prospects, Lab Chip, 2018, 18, 217–248, 10.1039/c7lc00914c.
- H. Lin, et al., A rapid and low-cost fabrication and integration scheme to render 3D microfluidic architectures for wearable biofluid sampling, manipulation, and sensing, Lab Chip, 2019, 19, 2844–2853, 10.1039/c9lc00418a.
- K. Scholten and E. Meng, A review of implantable biosensors for closed-loop glucose control and other drug delivery applications, Int. J. Pharm., 2018, 544, 319–334, DOI:10.1016/j.ijpharm.2018.02.022.
- F. M. Merchant, G. W. Dec and J. P. Singh, Implantable sensors for heart failure, Circ.: Arrhythmia Electrophysiol., 2010, 3, 657–667, DOI:10.1161/CIRCEP.110.959502.
- J. Kim, A. S. Campbell, B. E. de Avila and J. Wang, Wearable biosensors for healthcare monitoring, Nat. Biotechnol., 2019, 37, 389–406, DOI:10.1038/s41587-019-0045-y.
- T. Hoare, et al. Magnetically triggered nanocomposite membranes: a versatile platform for triggered drug release, Nano Lett., 2011, 11, 1395–1400, DOI:10.1021/nl200494t.
- B. P. Timko, et al. Near-infrared-actuated devices for remotely controlled drug delivery, Proc. Natl. Acad. Sci. U. S. A., 2014, 111, 1349–1354, DOI:10.1073/pnas.1322651111.
- K. Kim, et al. Externally controlled drug release using a gold nanorod contained composite membrane, Nanoscale, 2016, 8, 11949–11955, 10.1039/C6NR00362A.
- K. W. Ferrara, Driving delivery vehicles with ultrasound, Adv. Drug Delivery Rev., 2008, 60, 1097–1102, DOI:10.1016/j.addr.2008.03.002.
- S. H. Lee, et al. Implantable multireservoir device with stimulus-responsive membrane for on-demand and pulsatile delivery of growth hormone, Proc. Natl. Acad. Sci. U. S. A., 2019, 116, 11664–11672, DOI:10.1073/pnas.1906931116.
- M. Farina, Remote magnetic switch off microgate for nanofluidic drug delivery implants, Biomed. Microdevices, 2017, 8 Search PubMed.
- Gated Nanofluidic Valve For Active And Passive Electrosteric Control Of Molecular Transport, And Methods Of Fabrication, U.S. Provisional Pat. Ser. No. 62/961, 437, filed Jan 15, 2020.
- T. Geninatti, E. Small and A. Grattoni, Robotic UV-Vis apparatus for long-term characterization of drug release from nanochannels, Meas. Sci. Technol., 2014, 25, 027003 CrossRef.
- G. Scorrano, et al. Gas Flow at the Ultra-nanoscale: Universal Predictive Model and Validation in Nanochannels of Ångstrom-Level Resolution, ACS Appl. Mater. Interfaces, 2018, 10, 32233–32238, DOI:10.1021/acsami.8b11455.
- S. Ferrati, et al. Leveraging nanochannels for universal, zero-order drug delivery in vivo, J. Controlled Release, 2013, 172, 1011–1019, DOI:10.1016/j.jconrel.2013.09.028.
- N. Di Trani, A. Grattoni and M. Ferrari in 2017 IEEE International Electron Devices Meeting (IEDM). 40.46.41 (IEEE).
- N. Di Trani, et al. Nanofluidic microsystem for sustained intraocular delivery of therapeutics, Nanomedicine, 2019, 16, 1–9, DOI:10.1016/j.nano.2018.11.002.
- D. Fine, et al. A robust nanofluidic membrane with tunable zero-order release for implantable dose specific drug delivery, Lab Chip, 2010, 10, 3074–3083 RSC.
- G. Jeon, S. Y. Yang, J. Byun and J. K. Kim, Electrically actuatable smart nanoporous membrane for pulsatile drug release, Nano Lett., 2011, 11, 1284–1288, DOI:10.1021/nl104329y.
- S. Kim, E. I. Ozalp, M. Darwish and J. A. Weldon, Electrically gated nanoporous membranes for smart molecular flow control, Nanoscale, 2018, 10, 20740–20747, 10.1039/C8NR05906C.
- S. Prakash and A. T. Conlisk, Field effect nanofluidics, Lab Chip, 2016, 16, 3855–3865, 10.1039/C6LC00688D.
- D. Kanduti, P. Sterbenk and B. Artnik, Fluoride: a review of use and effects on health, Mater. Sociomed., 2016, 28, 133–137, DOI:10.5455/msm.2016.28.133-137.
- Y. K. Lee, et al. Dissolution of Monocrystalline Silicon Nanomembranes and Their Use as Encapsulation Layers and Electrical Interfaces in Water-Soluble Electronics, ACS Nano, 2017, 11, 12562–12572, DOI:10.1021/acsnano.7b06697.
- K. A. Connors, Chemical kinetics: the study of reaction rates in solution, Wiley-VCH Verlag GmbH, 1990 Search PubMed.
- D. Zhou, B. Mech and R. Greenberg, Accelerated corrosion tests on Silicon wafers for implantable medical devices, 2000, vol. 363 Search PubMed.
- G. Rutili and K. E. Arfors, Protein concentration in interstitial and lymphatic fluids from the subcutaneous tissue, Acta Physiol. Scand., 1977, 99, 1–8, DOI:10.1111/j.1748-1716.1977.tb10345.x.
- M. Wiśniewska, K. Szewczuk-Karpisz and D. Sternik, Adsorption and thermal properties of the bovine serum albumin–silicon dioxide system, J. Therm. Anal. Calorim., 2015, 120, 1355–1364, DOI:10.1007/s10973-014-4300-7.
- J. Robertson, High dielectric constant gate oxides for metal oxide Si transistors, Rep. Prog. Phys., 2005, 69, 327–396, DOI:10.1088/0034-4885/69/2/R02.
- H. Wang, J. Gao, Z. Chen and W. Wu, 2014 12th IEEE International Conference on Solid-State and Integrated Circuit Technology (ICSICT), pp. 1–3 Search PubMed.
- A. Padovani, D. Z. Gao, A. L. Shluger and L. Larcher, A microscopic mechanism of dielectric breakdown in SiO2 films: An insight from multi-scale modeling, J. Appl. Phys., 2017, 121, 155101, DOI:10.1063/1.4979915.
- A. Oliveros, A. Guiseppi-Elie and S. E. Saddow, Silicon carbide: a versatile material for biosensor applications, Biomed. Microdevices, 2013, 15, 353–368, DOI:10.1007/s10544-013-9742-3.
- J. F. Verweij and J. H. Klootwijk, Dielectric breakdown I: A review of oxide breakdown, Microelectron. J., 1996, 27, 611–622, DOI:10.1016/0026-2692(95)00104-2.
- J. Yao, L. Zhong, D. Natelson and J. M. Tour, In situ imaging of the conducting filament in a silicon oxide resistive switch, Sci. Rep., 2012, 2, 1–5, DOI:10.1038/srep00242.
- C. H. Tung, et al. Percolation path and dielectric-breakdown-induced-epitaxy evolution during ultrathin gate dielectric breakdown transient, Appl. Phys. Lett., 2003, 83, 2223–2225, DOI:10.1063/1.1611649.
- J. Godet and A. Pasquarello, Proton Diffusion Mechanism in Amorphous SiO2, Phys. Rev. Lett., 2006, 97, 155901, DOI:10.1103/PhysRevLett.97.155901.
- J. Yun, et al. Dielectric Breakdown and Post-Breakdown Dissolution of Si/SiO2 Cathodes in Acidic Aqueous Electrochemical Environment, Sci. Rep., 2018, 8, 1911, DOI:10.1038/s41598-018-20247-x.
- N. D. Arora, E. Rios and H. Cheng-Liang, Modeling the polysilicon depletion effect and its impact on submicrometer CMOS circuit performance, IEEE Trans. Electron Devices, 1995, 42, 935–943, DOI:10.1109/16.381991.
- V. E. Houtsma, Gate Oxide Reliability of Poly-Si and Poly-SiGe CMOS Devices, PhD Thesis, Universiteit Twente, Enschede, The Netherlands, 2000, p. 174 Search PubMed.
- G. Bruno, et al. Unexpected behaviors in molecular transport through size-controlled nanochannels down to the ultra-nanoscale, Nat. Commun., 2018, 9, 1682 CrossRef PubMed.
- N. Di Trani, A. Pimpinelli and A. Grattoni, Finite-Size Charged Species Diffusion and pH Change in Nanochannels, ACS Appl. Mater. Interfaces, 2020, 12, 12246–12255, DOI:10.1021/acsami.9b19182.
- S. H. Behrens and D. G. Grier, The charge of glass and silica surfaces, J. Chem. Phys., 2001, 115, 6716–6721, DOI:10.1063/1.1404988.
- D. M. K. Abro, P. Dablé, H. Girault, V. Amstutz and F. Cortez-Salazar, Characterization of Surface State of Inert Particles: Case of Si and SiC, J. Miner. Mater. Charact. Eng., 2016, 4, 720–726, DOI:10.4236/jmmce.2016.41007.
- S. F. Cogan, D. J. Edell, A. A. Guzelian, Y. Ping Liu and R. Edell, Plasma-enhanced chemical vapor deposited silicon carbide as an implantable dielectric coating, J. Biomed. Mater. Res., Part A, 2003, 67, 856–867, DOI:10.1002/jbm.a.10152.
- R. B. Schoch, J. Han and P. Renaud, Transport phenomena in nanofluidics, Rev. Mod. Phys., 2008, 80, 839–883, DOI:10.1103/RevModPhys.80.839.
- A. Grattoni, et al. Gated and near-surface diffusion of charged fullerenes in nanochannels, ACS Nano, 2011, 5, 9382–9391 CrossRef PubMed.
- G. Yossifon, P. Mushenheim, Y.-C. Chang and H.-C. Chang, Nonlinear current-voltage characteristics of nanochannels, Phys. Rev. E: Stat., Nonlinear, Soft Matter Phys., 2009, 79, 046305 CrossRef PubMed.
- A. Grosjean, M. Rezrazi and M. Tachez, Study of the surface charge of silicon carbide (SIC) particles for electroless composite deposits: nickel-SiC, Surf. Coat. Technol., 1997, 96, 300–304, DOI:10.1016/S0257-8972(97)00180-1.
- U. Vermesh, et al. Fast nonlinear ion transport via field-induced hydrodynamic slip in sub-20-nm hydrophilic nanofluidic transistors, Nano Lett., 2009, 9, 1315–1319 CrossRef PubMed.
- R. Karnik, et al. Electrostatic control of ions and molecules in nanofluidic transistors, Nano Lett., 2005, 5, 943–948 CrossRef PubMed.
- D. F. Veber, et al. Molecular Properties That Influence the Oral Bioavailability of Drug Candidates, J. Med. Chem., 2002, 45, 2615–2623, DOI:10.1021/jm020017n.
- A. Ahmad and W. R. Garnett, Simulated fluctuations in plasma drug concentrations for patients receiving oxcarbazepine or carbamazepine extended-release capsules, Clin. Drug Invest., 2005, 25, 669–673, DOI:10.2165/00044011-200525100-00006.
- N. C. Charles and G. C. Steiner, Ganciclovir intraocular implant, A clinicopathologic study, Ophthalmology, 1996, 103, 416–421, DOI:10.1016/s0161-6420(96)30677-5.
- R. Langer and D. Efficacy, Safety, and Tolerability of Low-Dose Hormone Therapy in Managing Menopausal Symptoms, J. Am. Board Fam. Med., 2009, 22, 563, DOI:10.3122/jabfm.2009.05.080134.
- K. T. Savjani, A. K. Gajjar and J. K. Savjani, Drug solubility: importance and enhancement techniques, ISRN Pharm., 2012, 2012, 195727–195727, DOI:10.5402/2012/195727.
- F. P. Pons-Faudoa, et al. 2-Hydroxypropyl-β-cyclodextrin-enhanced pharmacokinetics of cabotegravir from a nanofluidic implant for HIV pre-exposure prophylaxis, J. Controlled Release, 2019, 306, 89–96, DOI:10.1016/j.jconrel.2019.05.037.
- C. Celia, et al. Sustained zero-order release of intact ultra-stable drug-loaded liposomes from an implantable nanochannel delivery system, Adv. Healthcare Mater., 2014, 3, 230–238 CrossRef PubMed.
- M. Burton, A. Patel, A. Voluse and D. Konkle-Parker, Measuring Adherence to Direct Acting Antiviral Medications in Hepatitis C Infected Veterans: A Correlation Between the Visual Analogue Scale and Pill Counts, Gastroenterology, 2016, 150, S1156–S1157, DOI:10.1016/S0016-5085(16)33907-5.
- E. M. Shchukina and D. G. Shchukin, LbL coated microcapsules for delivering lipid-based drugs, Adv. Drug Delivery Rev., 2011, 63, 837–846, DOI:10.1016/j.addr.2011.03.009.
- J. Zhang, C. Li, Y. Wang, R.-X. Zhuo and X.-Z. Zhang, Controllable exploding microcapsules as drug carriers, Chem. Commun., 2011, 47, 4457–4459, 10.1039/C1CC10337G.
- C. A. Mashchak, et al. Comparison of pharmacodynamic properties of various estrogen formulations, Am. J. Obstet. Gynecol., 1982, 144, 511–518, DOI:10.1016/0002-9378(82)90218-6.
- S. H. Lee, et al. Implantable multireservoir device with stimulus-responsive membrane for on-demand and pulsatile delivery of growth hormone, Proc. Natl. Acad. Sci. U. S. A., 2019, 116, 11664–11672, DOI:10.1073/pnas.1906931116.
- C. Scholz and E. Wagner, Therapeutic plasmid DNA versus siRNA delivery: Common and different tasks for synthetic carriers, J. Controlled Release, 2012, 161, 554–565, DOI:10.1016/j.jconrel.2011.11.014.
- I. V. Chernikov, V. V. Vlassov and E. L. Chernolovskaya, Current development of siRNA bioconjugates: From research to the clinic, Front. Pharmacol., 2019, 10, 444 CrossRef.
- S. R. Kumar, D. M. Markusic, M. Biswas, K. A. High and R. W. Herzog, Clinical development of gene therapy: results and lessons from recent successes, Mol. Ther.--Methods Clin. Dev., 2016, 3, 16034, DOI:10.1038/mtm.2016.34.
- Z. Jiang and D. Stein, Electrofluidic Gating of a Chemically Reactive Surface, Langmuir, 2010, 26, 8161–8173, DOI:10.1021/la9044682.
- G. Bruno, et al. Leveraging electrokinetics for the active control of dendritic fullerene-1 release across a nanochannel membrane, Nanoscale, 2015, 7, 5240–5248 RSC.
- N. Di Trani, et al. Remotely controlled nanofluidic implantable platform for tunable drug delivery, Lab Chip, 2019, 19, 2192–2204, 10.1039/C9LC00394K.
- G. Bruno, et al. The active modulation of drug release by an ionic field effect transistor for an ultra-low power implantable nanofluidic system, Nanoscale, 2016, 8, 18718–18725 RSC.
- C. Y. X. Chua, et al. Transcutaneously refillable nanofluidic implant achieves sustained level of tenofovir diphosphate for HIV pre-exposure prophylaxis, J. Controlled Release, 2018, 286, 315–325 CrossRef CAS.
- C. Y. X. Chua, et al. Nanofluidic drug-eluting seed for sustained intratumoral immunotherapy in triple negative breast cancer, J. Controlled Release, 2018, 285, 23–34, DOI:10.1016/j.jconrel.2018.06.035.
Footnotes |
| † Electronic supplementary information (ESI) available. See DOI: 10.1039/d0lc00121j |
| ‡ Equal contribution. |
| This journal is © The Royal Society of Chemistry 2020 |