
 Open Access Article
 This Open Access Article is licensed under a Creative Commons Attribution-Non Commercial 3.0 Unported Licence
Microfluidic label-free bioprocessing of human reticulocytes from erythroid culture†
Kerwin Kwek
Zeming‡
 a,
Yuko
Sato‡
b,
Lu
Yin‡
c,
Nai-Jia
Huang
d,
Lan Hiong
Wong
e,
Hooi Linn
Loo
e,
Ying Bena
Lim
f,
Chwee Teck
Lim
fg,
Jianzhu
Chen
hi,
Peter R.
Preiser
*ej and
Jongyoon
Han
*akl
a,
Yuko
Sato‡
b,
Lu
Yin‡
c,
Nai-Jia
Huang
d,
Lan Hiong
Wong
e,
Hooi Linn
Loo
e,
Ying Bena
Lim
f,
Chwee Teck
Lim
fg,
Jianzhu
Chen
hi,
Peter R.
Preiser
*ej and
Jongyoon
Han
*akl
aCritical Analytics for Manufacturing of Personalized Medicine, Singapore-Massachusetts Institute of Technology Alliance for Research and Technology, 138602, Singapore
bDepartment of Microbiology and Immunology, Keio University School of Medicine, Tokyo, 160-8582, Japan
cBioprocessing Technology Institute, Agency for Science, Technology and Research, 138668, Singapore
dWhitehead Institute for Biomedical Research, Cambridge, Massachusetts 02142, USA
eAnti-Microbial Resistance, Singapore-Massachusetts Institute of Technology Alliance for Research and Technology, 138602, Singapore
fDepartment of Biomedical Engineering, National University of Singapore, 117583, Singapore
gMechanobiology Institute, National University of Singapore, 117411, Singapore
hDepartment of Biology, Massachusetts Institute of Technology, Cambridge, Massachusetts 02139, USA
iThe Koch Institute for Integrative Cancer Research, Massachusetts Institute of Technology, Cambridge, Massachusetts 02142, USA
jSchool of Biological Sciences, Nanyang Technological University, 637551, Singapore. E-mail: PRPreiser@ntu.edu.sg
kDepartment of Biological Engineering, Massachusetts Institute of Technology, Cambridge, Massachusetts 02139, USA. E-mail: jyhan@mit.edu
lDepartment of Electrical Engineering and Computer Science, Massachusetts Institute of Technology, Cambridge, Massachusetts 02139, USA
First published on 14th August 2020
Abstract
In vitro erythroid cultures from human hematopoietic stem cells produce immature red blood cells (RBCs) called reticulocytes, which are important for RBCs production, and are widely used in scientific studies of malaria pathology, hematological diseases and protein translation. However, in vitro reticulocyte cultures contain expelled cell nuclei and erythroblasts as undesirable by-products and current purification methods such as density gradient centrifugation and fluorescence-activated cell sorting (FACS) are not optimal for integrated bioprocessing and downstream therapeutic applications. Developments in Dean flow fractionation (DFF) and deterministic lateral displacement (DLD) microfluidic sorting methods are ideal alternatives due to label-free size sorting, throughput scalability and low manufacturing cost. DFF sorting of reticulocytes from whole erythroid culture showed a 2.4-fold increase in cell recovery compared to FACS albeit with a lower purity; DLD sorting showed comparable cell recovery and purity with FACS using an inverse-L pillar structure to emphasize size and deformability sorting of reticulocytes. The viability and functional assurance of purified reticulocytes showed conserved cell deformability and supported the propagation of malaria parasites. Collectively, our study on label-free RBCs isolation represents a significant technical advancement towards developing in vitro generated viable human RBCs, opening opportunities for close-loop cell manufacturing, downstream therapeutic and research purposes.
1. Introduction
Reticulocytes are nucleus-free, immature red blood cells (RBCs) originating from self-renewing hematopoietic stem and progenitor cells (HSPCs) within the bone marrow. Reticulocytes are important in various clinical prognosis and diagnosis applications,1–4 are commercially used to produce cell-free protein translation systems as they contain high levels of ribosome and are free from deoxyribonucleic acid (DNA),5 and are potential precursors for in vitro RBCs production.6 Reticulocytes are also the preferable invasion targets for malaria parasites, including Plasmodium vivax and Plasmodium falciparum,7–10 making them important for investigating malaria pathology. However, biological and medical advancements in these areas are limited by the availability of reticulocytes as they are transient in the human body and comprise only 0.5–2.5% of blood cells.11,12 The ability to manufacture reticulocytes in vitro will circumvent the need for large volume blood draws and laborious cell isolation processes.
In vitro erythroid cultures of reticulocytes have progressed significantly achieving more than 60% purity with >300![[thin space (1/6-em)]](https://www.rsc.org/images/entities/char_2009.gif) 000 fold expansion.13 However, this process requires erythroblasts, to eject their nuclei resulting in a viscous culture medium due to the accumulation of the expelled nuclei contaminants.6 Downstream applications such as cell-free protein translation, RBCs production and malaria invasion of reticulocytes require purified reticulocytes free from extra-cellular DNA. Thus, the expelled nuclei as well as erythroblasts must be removed from the culture, so as not to interfere with the downstream applications of reticulocytes.
000 fold expansion.13 However, this process requires erythroblasts, to eject their nuclei resulting in a viscous culture medium due to the accumulation of the expelled nuclei contaminants.6 Downstream applications such as cell-free protein translation, RBCs production and malaria invasion of reticulocytes require purified reticulocytes free from extra-cellular DNA. Thus, the expelled nuclei as well as erythroblasts must be removed from the culture, so as not to interfere with the downstream applications of reticulocytes.
Current reticulocyte purification protocols are mainly developed for cord blood and peripheral blood using, leukocyte reduction filters,14–16 density gradient centrifugation,17,18 and magnetic- and fluorescence-activated cell sorting (MACS; FACS).19–22 These methods have limited yield (ranging from 64–80% purity), throughput and scalability due to the need for discontinuous sample handling processes, cell-labeling and cost. Density gradient methods though well-established are challenged to purify these cultured cells as the expelled nuclei have varying density depending on the degree of degradation. While MACS has been employed to purify reticulocytes from blood samples based on the CD71 surface marker, this cannot be used in an erythroid culture where all the cells express CD71. Thus, an alternative sorting method that is continuous, efficient and low-cost is required to process erythroid cultures for the bulk production of reticulocytes.
Recent advances in microfluidic cell sorting systems have enabled label-free continuous sorting of cells based on biophysical parameters, such as size, deformability, electrical and acoustic properties.23,24 Given that erythroid cultures contain mainly reticulocytes, nucleated erythroblasts and expelled nuclei, which are different in size, shape and deformability,25 we investigate here two microfluidic sorting methods for the isolation of human reticulocytes generated from HSPCs; namely Dean flow fractionation (DFF)26,27 and deterministic lateral displacement (DLD).28 Both DFF and DLD are passive cell size dependent sorting methods and have shown high efficiency in blood cell sorting.27,29–31 These methods do not require cell labelling, are low cost and are scalable using modular and parallel device setups.32–35 DFF systems dominate in ultra-high processing rates of mL min−1,36 while DLD systems enable precision in cell shape, size and deformability discrimination.30,37
In this study, we employed a trapezoidal cross-section design in DFF sorting to enable circulating purification of reticulocytes integrated with an automated continuous culture platform. For DLD sorting, high reticulocyte purity was achieved using the sorting properties of an inverse L-shape pillar structure that allows selective isolation of the larger and deformable reticulocytes from the smaller and rigid nuclei in the erythroid culture. We show that both DFF and DLD could sort 100 million cells significantly faster at 1.5 to 2 hours compared to FACS, which is considered as the gold-standard method that requires 4 hours. DFF sorting of reticulocytes yields close to 72.3% recovery with 80.0% purity, while DLD sorting has a lower yield of 27.6% recovery with 97.4% purity. The DLD sorting is comparable to FACS system for which the sorting recovery is 30.6% with more than 99.7% purity.
Finally, we demonstrated the retention of the biological function of DFF and DLD sorted reticulocytes by assessing the cell deformability by micropipette assay and overall viability by malaria parasite infectivity, which require purified and healthy host cells for their growth. Collectively, our results represent technical advancements towards human RBCs manufacturing and downstream label-free applications for therapeutic, diagnostic and research purposes.
2. Results and discussion
2.1. Cell composition of the in vitro erythroid culture from CD34+ HSPCs
Stem cells have the potential to multiply continuously and are the key to achieving large quantities for the manufacturing of blood.38,39 Large-scale synchronized axenic culture system based on peripheral CD34+ HSPCs has the highest yield and enucleation rate reported so far.13 The entire erythroid culture consists of an expansion of HSPCs, followed by 5 differentiation phases with varying cell density, cytokines and growth factors resulting in a 14700-fold expansion over 23 days (Fig. S1, ESI†). A day 12 intermediary cryogenic storage protocol was developed to reduce the culture time for terminal differentiation down to 11 days post cell thaw. This eliminates the need for continuous 23 day blood manufacturing. Throughout the culture, synchronous differentiation of erythroid cells was monitored by flow cytometry-based detection of surface markers (Fig. S1a, ESI†) and by Wright–Giemsa staining to observe the cell morphology (Fig. S1f–k, ESI†). The final in vitro culture contains approximately 66.4% reticulocytes, 19.2% nuclei and 13.6% erythroblasts (Fig. 1a and b). The corresponding enucleation rate is more than 80%.
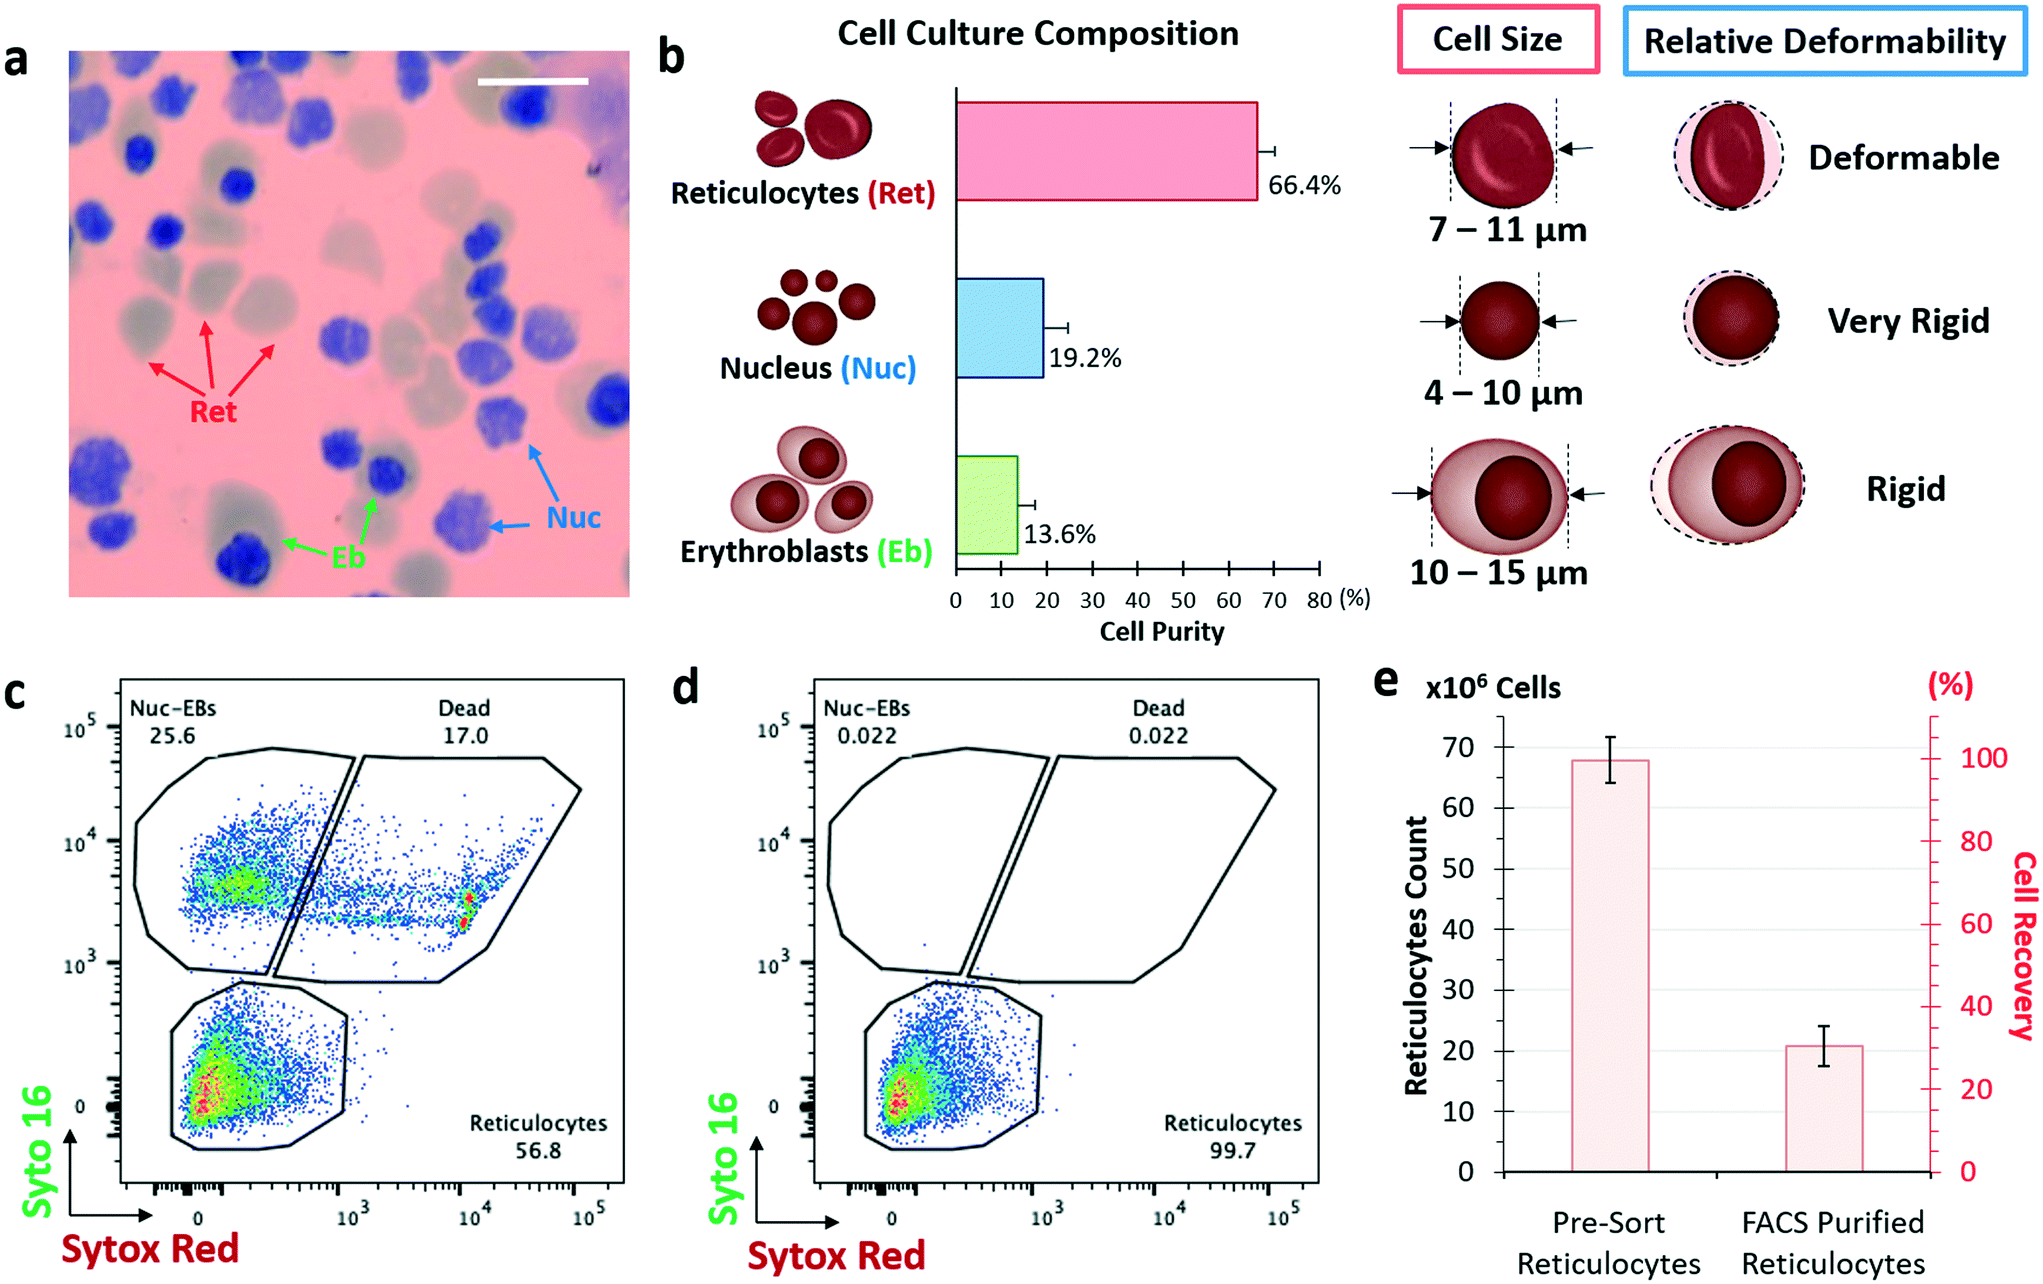 | ||
| Fig. 1 Large-scale in vitro erythroid culture from CD34+ HSPCs. a) Schematic of the 6 phases in vitro erythroid culture with a representative image of Giemsa stain of day 23 erythroid culture. Indicated with arrows are reticulocytes (Ret), expelled nuclei (Nuc) and nucleated erythroblasts (Eb). Scale bar denotes 20 μm. b) Shows day 23 cell culture composition of reticulocytes (Ret), nuclei (Nuc) and erythroblasts (Eb) (n = 3; ±SD) with schematics of the biophysical properties of each cell types, which are size and deformability. c) Shows representative FACS pseudo-color density plots of day 23-erythroid culture. Staining of SYTO 16 vs. SYTOX red dyes, where indication corresponds to reticulocytes, nuclei and erythroblasts. Double positive cells are dying and dead cells. d) Shows the re-analysis of reticulocytes purified by FACS sorting. e) both reticulocyte count and recovery were analysed for pre-sorted reticulocytes and FACS purified samples (n = 3 and error bars of mean represent SD). | ||
To evaluate the biological functionality of the culture-derived reticulocytes, the entire crude erythroid culture was tested for its ability to sustain Plasmodium falciparum infection. P. falciparum is the most virulent of human malaria species that can propagate in reticulocytes and mature RBCs.40 However, using the crude erythroid culture, we observed that the parasitemia failed to increase (Fig. S2a, ESI†). Giemsa-stained thin smears of the P. falciparum culture revealed intact expelled nuclei (Fig. S2b, ESI†) that eventually became degraded (Fig. S2c, ESI†). There was no apparent parasite expansion in the crude culture as compared to a parallel infection using RBCs from the peripheral blood. A likely explanation is that the high density of degrading extracellular DNA in the erythroid culture trap and interfere with invasion of the newly released parasites. Therefore, the elimination of nuclei and erythroblasts are essential for the downstream usage of the erythroid culture and in this study we have compared reticulocyte purification by FACS and two innovative microfluidics sorting using DFF and DLD techniques.
2.2. FACS sorting of reticulocytes
FACS is the gold standard for cell sorting due to well-established protocols and high specificity. The reticulocytes isolation from the erythroid culture was conducted by SYTO16 (permeable DNA stain) and SYTOX red (non-permeable to live intact cells) staining to differentiate reticulocytes, nucleated particles and dead cells (Fig. 1c).41,42 It is noted that the CD71 marker, which is used to isolate reticulocytes from whole blood, is not used as a label here as all erythroblasts and reticulocytes express CD71 (Fig. S1e, ESI†). Nuclei and erythroblasts were further differentiated based on granularity and cell size (Fig. S3, ESI†).100 million cells from the day 23 erythroid culture with reticulocyte count of 67.9 ± 3.7 million cells at a purity of 66.4% were subjected to purification by FACS sorting (BD ARIA II FACS machine). After FACS sorting, the reticulocyte count dropped to 20.8 ± 1.8 million, which accounted to a cell recovery of 30.6% (Fig. 1e) and reticulocyte purity of 99.7% (Fig. 1d). The low cell recovery may be due to cell death from high-shear stress sorting events by squeezing 6000–10000 cells per second in a 100 μm nozzle. Sample preparation including centrifugation, staining and washing steps could also contribute to the significant cell loss. Additionally, to ensure >99% reticulocyte purity, a tight gating is required to exclude overlapping events which may also remove reticulocytes to the waste channel (Fig. S4†). The total time taken to sort 100 million cells was more than 4 hours (excluding the time required for pre-sorting processing).
2.3. DFF microfluidic design for the enrichment of reticulocytes
Others and we have previously reported various applications of DFF microfluidics for size-based cell separation.26,27,43–47 Cells flowing in spiral DFF microchannel experience lift force and centrifugal acceleration-induced Dean drag force, which results in the formation of two Dean vortices on the cross-sectional plane of the channel. Interplay of the lift and Dean drag forces cause cells to migrate laterally while flowing through the microchannel, and stay at a lateral position where the net force is zero (Fig. 2a and b). The magnitudes of the lift and Dean drag forces experienced by a cell correlate with the cell size, thus cells with different sizes focus at different lateral positions, enabling size-based cell separation.26,46 A trapezoidal cross-section spiral microfluidic chip with one inlet and two outlets was employed for DFF-based purification of the reticulocytes from erythroblasts and free nuclei (Fig. 2a and b). This DFF microfluidic chip design was developed from a similar design described in our previous study on the separation of blood cells.27 The widths of the two outlets were modified to be equal (250 μm) in order to accommodate the different composition of cell population in this study. The use of trapezoidal cross-section geometry could improve separation resolution as compared to conventional rectangular shape.48 It also removes the need of sheath buffer at the inlets to synchronize the initial position of cells,27,47 which greatly enhances the volumetric sorting rate and enables low concentration sorting. To demonstrate the performance of the chip, each population of reticulocytes, erythroblasts and nuclei were first prepared by FACS sorting. The FACS-purified reticulocytes, erythroblasts and nuclei were then pumped into the DFF microfluidic chip respectively at the same flow rate (0.8 mL min−1), and their focusing positions at the outlet branching point were recorded using a high-speed camera (Movie S1, ESI†). Results showed that majority of reticulocytes were sorted to the collection outlet (Fig. 2c). Almost all erythroblasts were sorted to the waste outlet (Fig. 2d), demonstrating efficient separation between the erythroblasts and reticulocytes. Nuclei had approximately equal chance to be sorted into the two outlets due to wider size distribution compared to erythroblasts and reticulocytes (Fig. 2e).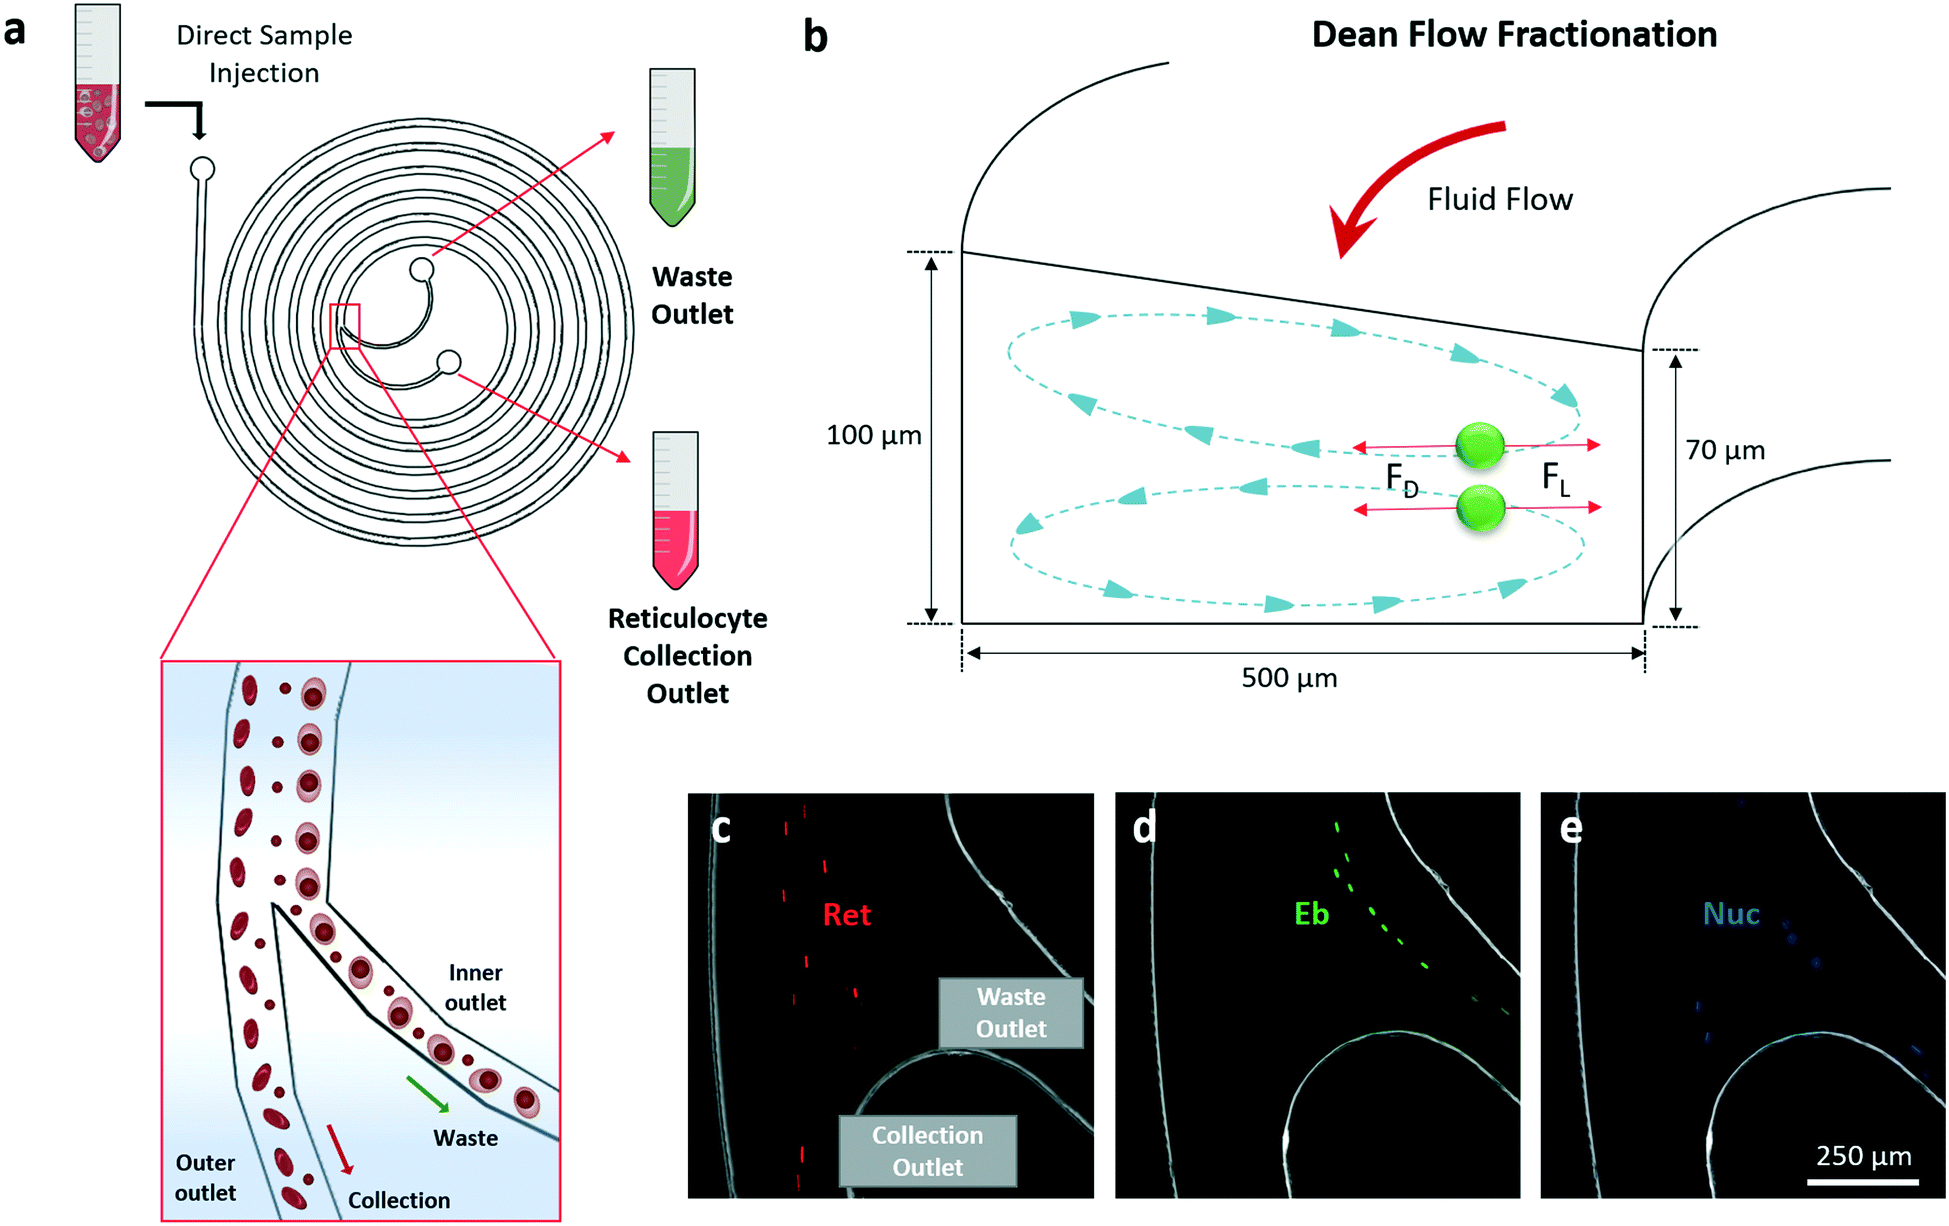 | ||
| Fig. 2 DFF microfluidics for reticulocytes sorting. a) Design of a DFF microfluidic chip with a single inlet injection of erythroid culture samples and two bifurcated outlets of cells sorting to collection and waste outlets. b) Schematics of secondary fluid flow on the cross-sectional plane of the DFF device. The Dean vortices created inside the spiral channel would align the particles based on size by the balance of drag force (FD) and lift force (FL). The schematics are not drawn to scale. Purified samples of reticulocytes (Ret), erythroblasts (Eb) and nuclei (Nuc) are used to characterise the sorting dynamics in DFF microfluidics at 0.8 mL min−1 sorting flow rate as shown in c)–e) respectively. Scale bar shows length of 250 μm. | ||
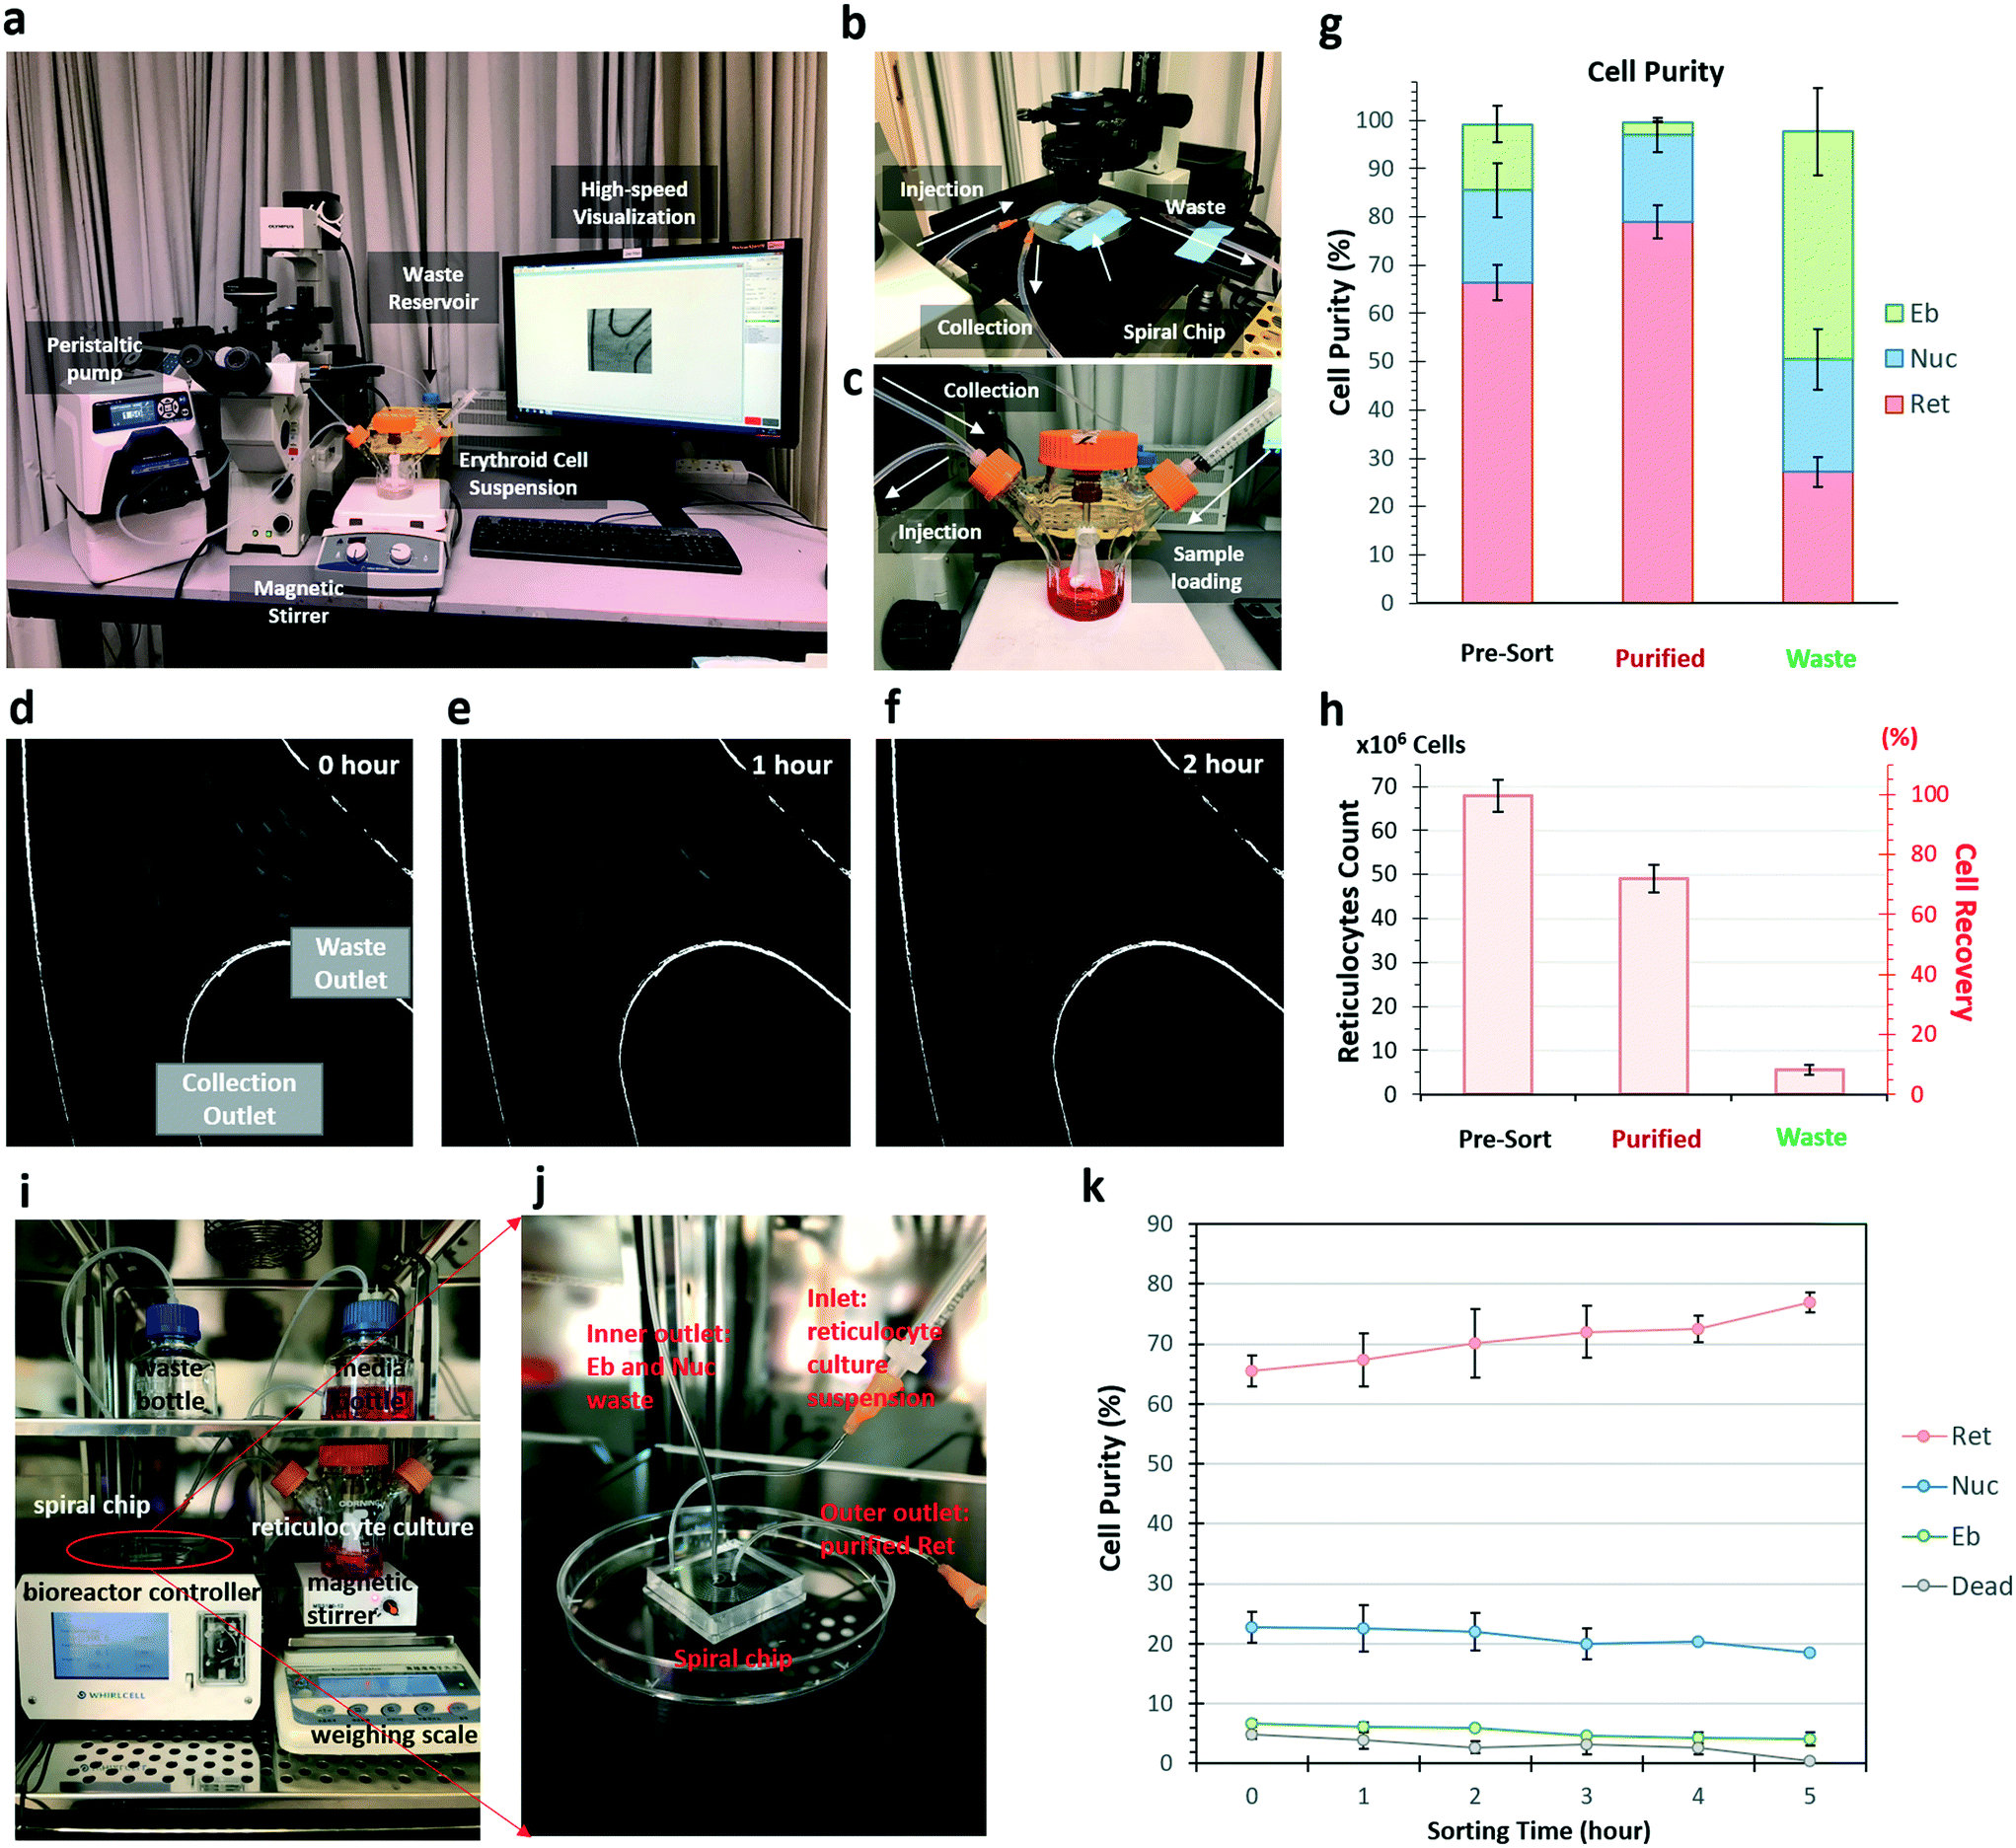 | ||
| Fig. 3 Circulated sorting of reticulocytes with DFF and application in perfusion bioreactor. a) Setup of a benchtop circulated sorting system. b) DFF microfluidics on the microscope stage showing the fluid flow of samples injection, collection and waste outlets. c) A spinner flask containing the erythroid cell suspension. The sample injection inlet and the collection outlet, which redirects purified reticulocytes back to the spinner flask, are indicated. Representative images of sorting paths at outer outlet captured by high-speed camera during the circulated sorting. Real-time monitoring of cell collection at waste outlet at 0 hour d), 1 hour e) and 2 hours f) of circulation. g) Percentage of reticulocytes (red), nuclei (blue) and erythroblasts (green) from g) in the pre-sort, purified and waste populations. Results represent mean values (±SD) from three independent experiments (n = 3). h) Absolute number of reticulocytes and recovery percentages from outer (purified) and inner (waste) outlets are counted after 2 hours of DFF microfluidic sorting (n = 3; bars represent mean, and error bars represent SD). i) A continuous perfusion bioreactor setup for reticulocyte purification inside CO2 incubator. j) A close view of the DFF microfluidic chip coupled with the bioreactor system for perfusion and purification. k) Change of various cell compositions in the culture system during continuous perfusion. | ||
Employing real-time high-speed video recording, we observed that large amounts of cells were sorted into waste outlet at the beginning of the circulation, and drastically decreased after an hour (Fig. 3d–f). The circulated sorting was completed after 2 hours, when no more cells were sorted into the waste outlet (Fig. 3f). FACS analysis of the erythroid culture before (pre-sort) and after (purified) sorting, and the cells collected from the waste outlet (waste) was performed to quantify the cell compositions (Fig. S5, ESI†). In the purified cell population, reticulocytes were enriched from 66.4% to 80.0% after 2 hour recirculated sorting, erythroblast was reduced from 13.6% to 2.7% (Fig. 3g). From an initial 100 million cells (containing 67 million reticulocytes), 49 ± 1.1 million reticulocytes were recovered after purification. This corresponded to a recovery of 72.3% of the reticulocytes with a purity of 80.0% (Fig. 3h).
2.4. High purity reticulocyte isolation using the DLD device with inverse-L pillars
Purification of reticulocytes using size alone is challenging due to the large over-lapping size distribution of the expelled nuclei and reticulocytes (Fig. 1b). This is due to the fact that degradation of the expelled nuclei results in their size expansion from its compact 4 μm to a size similar to reticulocytes (Fig. 1a). Guzniczak et al. have investigated both mechanical and size properties of HSPCs and showed that deformability is a vital parameter to differentiate between reticulocytes and nuclei.25To sort reticulocytes from the erythroid culture, we utilized an inverse-L DLD microfluidic technique to rapidly isolate reticulocytes with high purity using size and deformability sorting (Fig. 4a and S6, ESI†). Previously, inverse-L DLD structures showed distinct sorting profiles of 3.0 μm rigid spherical beads relative to bi-concaved shaped RBCs in a fixed DLD device critical cut-off size (Dc) of 3.3 μm (see eqn (1)).37 The earlier study suggests effective sorting based on bi-concave RBC shape however the current DLD study on erythroid culture eliminates the shape effect as reticulocytes are deformable with a spherical morphology.
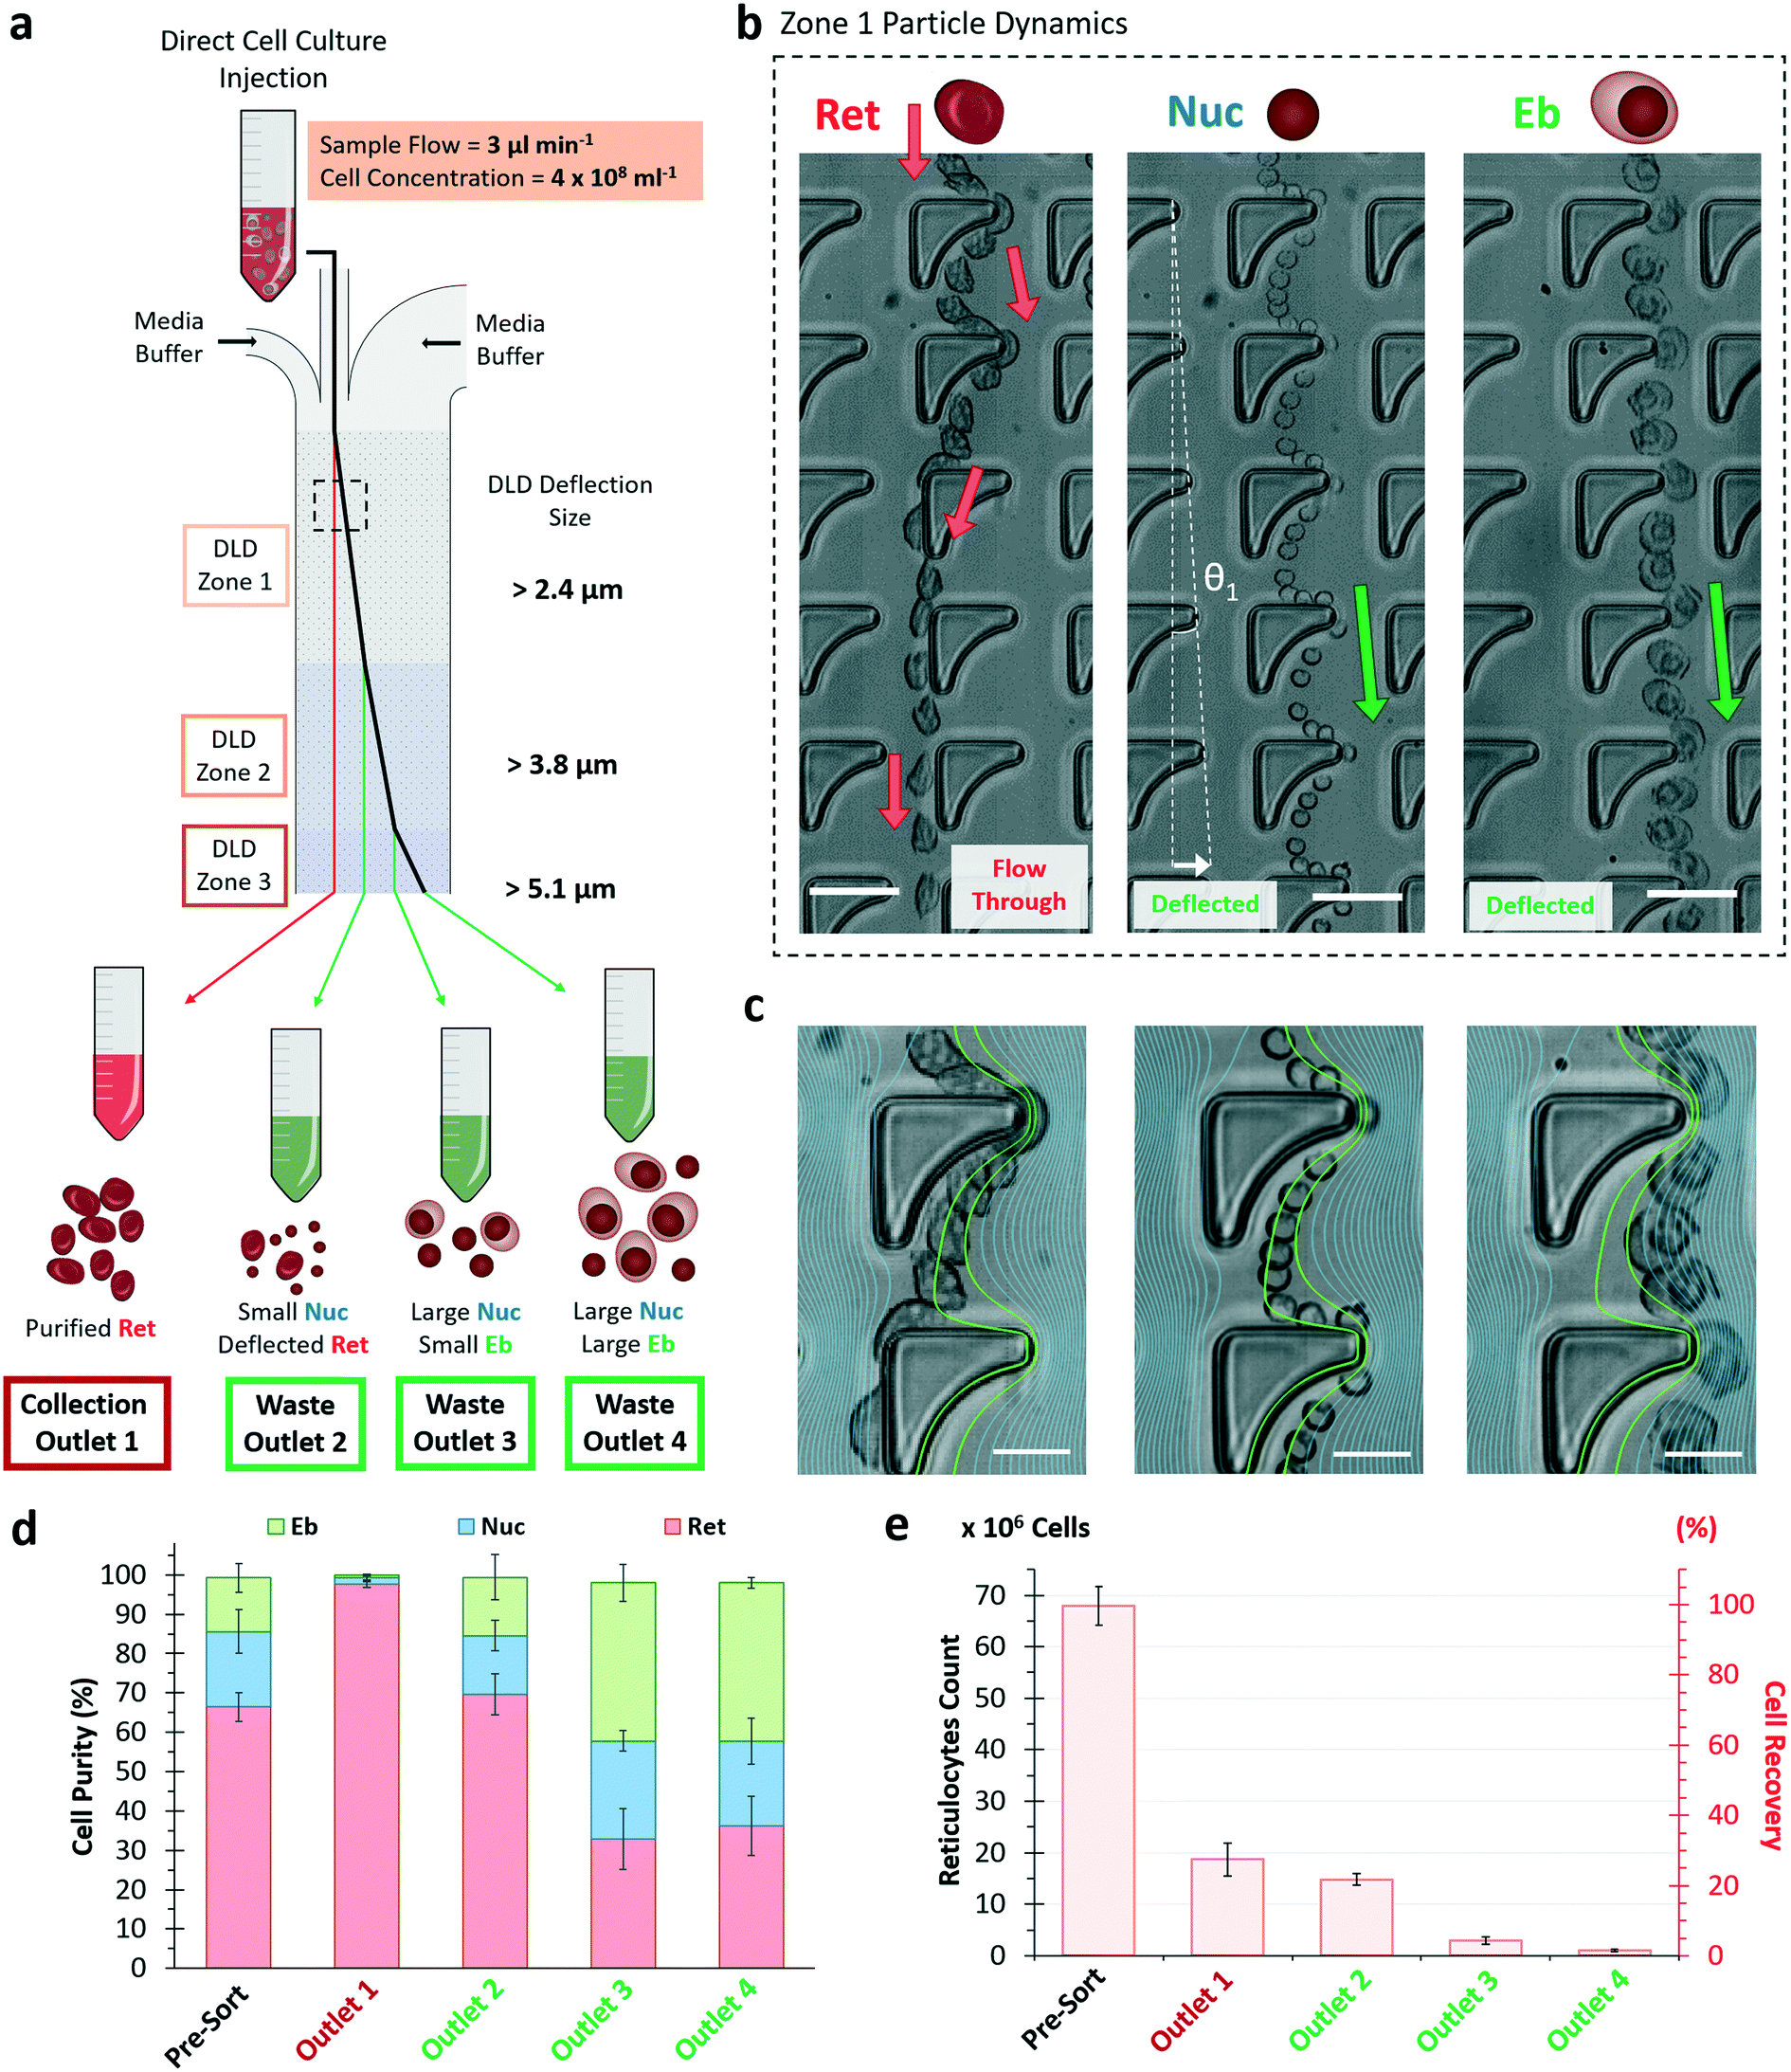 | ||
| Fig. 4 Design of DLD device for microfluidic sorting of in vitro erythroid culture. a) Schematics of the sorting performance and expected outlet distribution of cell types from the erythroid culture. The concentrated sample (400 million cells per mL) with a volume of 250 μL is injected to the device at a rate of 3 μL per min. The four device outlets are designated as reticulocyte collection outlet 1, waste outlet 2, 3 and 4 respectively. b) Particle dynamic motions of Ret, Nuc and Eb within the inverse-L pillar structure in zone 1 of the DLD device shown by the image sequence overlay. The angle of deflection is denoted as θ1 = 1.0° and red (Ret) and green (Nuc and Eb) arrows indicated the paths of each cells. The white arrow denotes the lateral displacement length for the given section. Scale bar, 20 μm. (c) Simulated fluid streamlines are overlaid on the magnified image for comparison of the particle migration trajectories within inverse-L DLD structures for Ret, Nuc and Eb respectively (from left to right). The green streamlines denote the two closest streamline boundaries to the pillar protruded edge. The scale bar shows 10 μm. d) Percentage of the cell distribution for pre-sort, FACS sorted and cells collected from DLD outlets 1–4 for Ret (red), Nuc (grey) and Eb (white). DLD outlet 1 for reticulocyte collection is highlighted in blue. e) Reticulocyte number from pre-sort sample and collected after FACS and DLD device with n = 3 and error bars represent SD. | ||
Thus, the designed DLD microfluidic chip has 3 inlet ports with a narrow sample injection stream sandwiched by 2 media buffers (Fig. S6, ESI†). As the sample enters the device, the biological particles flow through zones 1 to 3 of Dc 2.4, 3.8 and 5.1 μm respectively. Large particles (more than specified Dc) deflect laterally into waste outlets 2 to 4, while small particles (less than all Dc) are collected from outlet 1. This design was based on the hypothesis that reticulocytes deform significantly and have an apparent size smaller than the smallest Dc of 2.4 μm. It is also important to note that the Dc is a DLD apparent cut-off cell size, a parameter of the dynamic cell size and does not reflect the actual physical size under static measurement.
To understand and visualize the individual sorting dynamics of the sample components of Ret, Nuc and Eb, a flow of 50 million cells per mL sample was observed in zone 1 (Dc = 2.4 μm) (Fig. 4b). Reticulocytes were more deformable and interacted with the surrounding fluids via compression, transverse and rotational motion (Movie S2, ESI†). This complex hydrodynamic interaction resulted in reduced deflection in DLD. They slipped past the pillar and flowed towards the collection outlet as though its overall net flow direction was unhindered as shown in the red arrows (Fig. 4b). Meanwhile, nuclei and erythroblasts both experienced a deflected flow path. Thus, the inverse L-shape amplifies differences between rigid bodies and deformable bodies of similar size.
To elucidate the effects of deformability in cell migration within the inverse-L structures, streamline profiles of the inverse-L structure was overlaid onto a magnified view of the cell trajectory (Fig. 4c). The green streamlines denote the closest two simulated streamline boundaries to the protrusion of the inverse-L structure where sorting of DLD occurs. These green streamlines cut through the center of the Ret and Nuc as they flow past the inverse-L protrusion. The Ret being deformable and pliant, wraps around the apex of the protrusion with a horizontal width comparable to the nuclei diameter (see ESI† Fig. S7). As the cells flow past the protrusion of the inverse-L, reticulocytes deform, relax back into an elliptical shape and slip out of the streamline boundaries while nuclei maintain their spherical shape and trajectory within the green streamline boundaries. Erythroblasts being larger and more rigid follow the streamline trajectory and DLD pillar gradient.
We directly injected the crude erythroid culture samples at a flow velocity of 3 μL per minute using 250 μL of cells at 400 million cells per mL (equivalent to ∼3–4% hematocrit) into the DLD device, which processed 100 million cells in 1.5 hours. This concentration is approximately 15× blood dilution and various DLD works have shown effective sorting performance even up to whole blood density.52,53 Increasing the cell concentration to 400 million cells per mL show that the cells are still relatively sparse ensuring DLD pillar interactions for effective cell sorting (Movie S3, ESI†).
The final purity of reticulocytes at outlet 1 was 97.4% with 27.6% cell recovery with little variation from independent culture samples (Fig. 4d and e). Outlet 2, 3 and 4 showed significant reduction in reticulocyte purity at 64.9%, 23.4% and 22.3% respectively (Fig. S8†). Outlet 2 consisted of a relatively large number of reticulocytes, which suggest that some of these cells could have an apparent size larger than 2.4 μm. Most of erythroblasts were sorted into outlets 3 and 4.
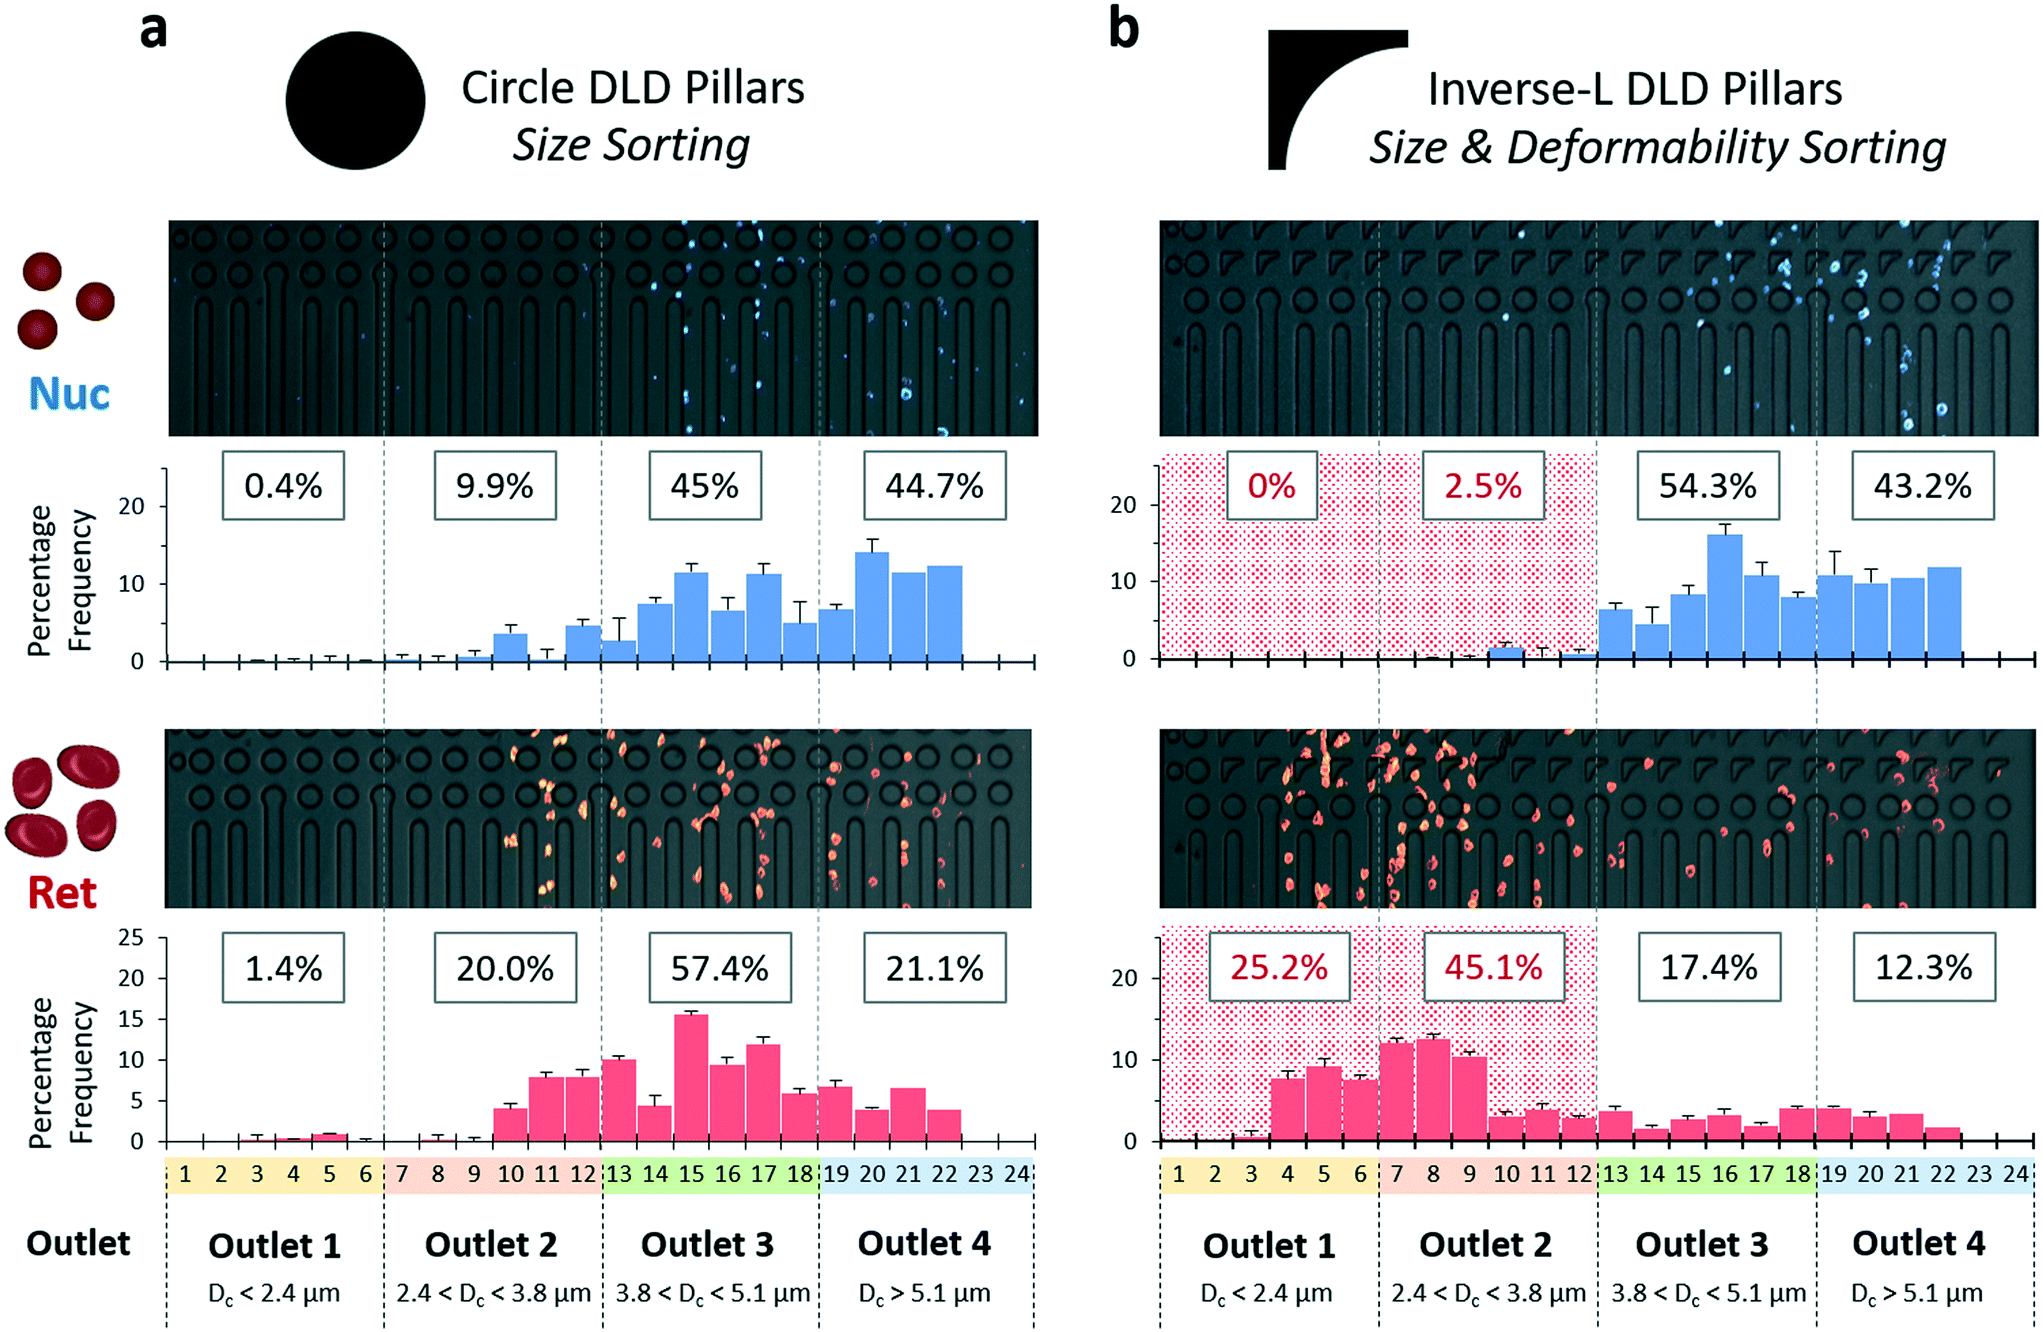 | ||
| Fig. 5 Sorting characterization of cells by DLD devices. The sorting characteristics of both a) circle DLD pillars and b) inverse-L DLD pillars can be seen respectively. A FACS purified sample of nuclei (Nuc) and reticulocytes (Ret) from the erythroid culture were infused at a particle concentration of 2 million per mL to evaluate the sorting performance of the different pillar structures. The 24 sub-channels correspond to 4 outlets (1, 2, 3 and 4 respectively with increasing Dc size bins). The image for the output region is an image stack from high-speed camera footages with pseudo-coloring. The frequency histogram of the output region was tabulated by particle counting for each sub-channel. Histogram bin and total particle count per histogram range from 150 to 600. | ||
2.5. Quality assessment of microfluidic purified reticulocytes
Reticulocytes mature into erythrocytes whose deformability is vital for blood microcirculation. Reduction in deformability will result in poor blood circulation or even more serious clogging and clotting issues within capillaries. Thus, we compared the deformability of reticulocytes before and after sorting to evaluate their quality for downstream RBCs production using micropipette assay. It was found that all sorting methods (FACS, DFF and DLD) did not change reticulocyte cell deformability significantly (Fig. 6a). The mean shear modulus for all categories was seen to fluctuate around 6–10 pN μm−1.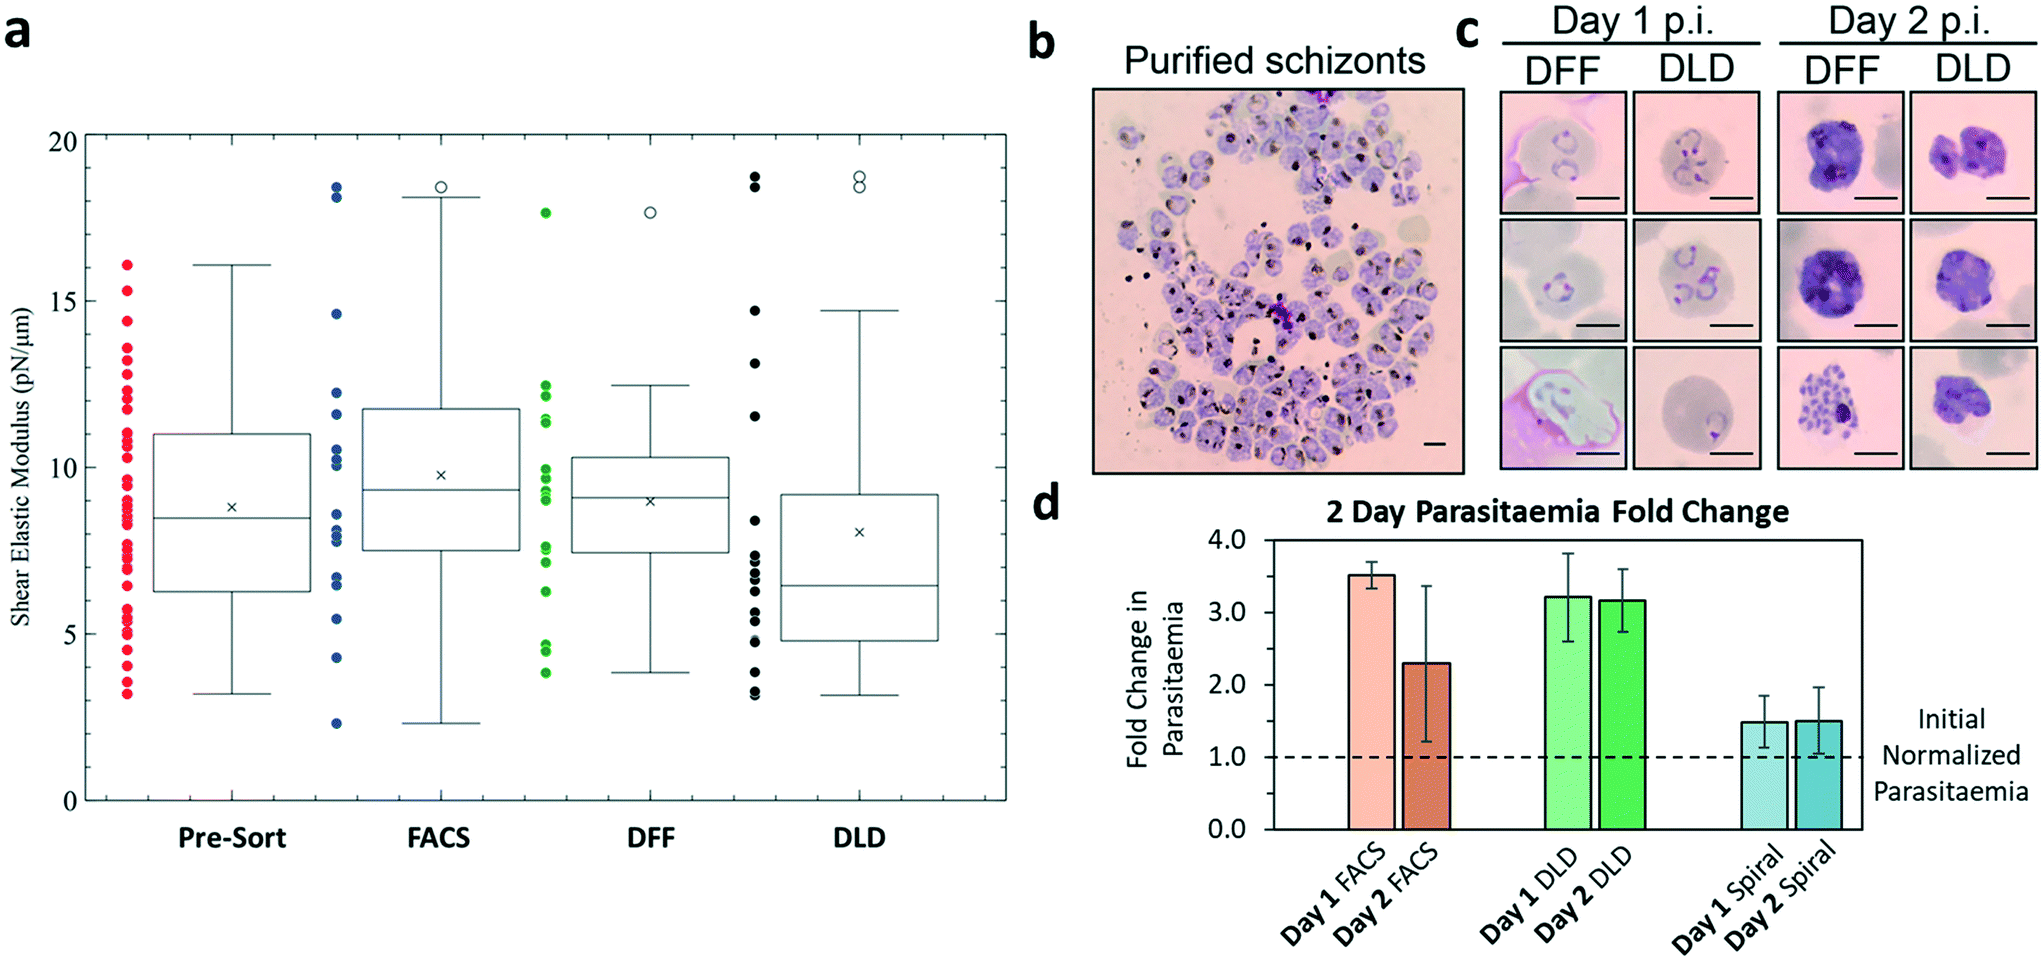 | ||
| Fig. 6 Validation of biological functionality of microfluidic purified reticulocytes via cell deformability measurement and infection of malaria parasites, Plasmodium falciparum 3D7 strain. a) The shear elastic modulus was analysed by micropipette aspiration of reticulocytes from day 23 crude erythroid culture (red, pre-sort), from purified reticulocytes by FACS (blue), DFF (green) and DLD (red). The mean shear modulus for all categories can be seen to fluctuate around 6–10 pN μm−1 (n = 30, ±SD). b) Giemsa stain of purified Pf3D7 schizonts (>99% purity) that were inoculated to test the biological functionality of purified reticulocytes. Schizonts were purified using magnetic column. c) 5 million purified reticulocytes were inoculated with 0.5% initial parasitemia. Shown are images of infected reticulocytes with Pf3D7 rings on day 1 post infection (p.i.) and schizonts by day 2 p.i. Some cells are infected by more than one parasite, which is due to preferential invasion of reticulocytes by P. falciparum. Day 1 and day 2 cultures showed changes in the P. falciparum infected cells with day 1 showing ring stage and day 2 showing schizont stage. d) Parasitemia fold change quantified by microscopic examination of Giemsa-stained culture smear. The change in parasitemia over two days is compared with initial seeded parasitemia density of a normalized value of 1. Results represent mean values (±SD) from two independent experiments. Parasitemia initial concentration of infected cells was loaded with reticulocytes. The graph shows successful invasion and development of parasites for the increase in parasitemia for FACS, DLD and DFF sorted cells. | ||
Finally, we verified the viability and functional quality of in vitro generated and purified reticulocytes using malaria parasites. The infection of reticulocytes by malaria parasites is an important indicator of their robustness and biological function, as the parasite development require membrane integrity for efficient nutrient uptake from the medium as well as metabolites available directly from the infected reticulocytes. The microfluidic-sorted reticulocytes were infected by Plasmodium falciparum 3D7 strain (Fig. 6b). Fig. 6c shows the ring-stage formation on day 1 and mature schizont development on day 2 within the sorted cells from both DFF and DLD after inoculation with 0.5% parasitemia. The specific invasion of parasites into sorted reticulocytes was further confirmed using CFSE labeling of host cells prior to infection (Fig. S13, ESI†). Both DLD and FACS sorted samples showed a 3 fold increase in parasitemia (Fig. 6d) while DFF sorted cells showed a smaller increase of 50%. The compromised infection efficiency of DFF-purified culture as compared to the FACS and DLD-purified cultures was likely due to the residual nuclei, which might inhibit parasite invasion (Fig. S2, ESI†). Together, these assays confirmed that biophysical marker-based microfluidic purification of reticulocytes from in vitro erythroid culture resulted in viable reticulocytes with normal biophysical property and bio-functionality.
3. Outlook and conclusions
Currently, FACS purification of fluorescently labeled cells is the common method of choice for most biologists, however the technique has many issues such as cell yield, speed, and cost. These issues are even more problematic when one considers large-scale processing, as in cell therapy for example. As an alternative to utilizing cell surface markers, biophysical markers are relatively new and are gaining momentum as unique biomarker for cell identification. Masaeli et al., Nawaz et al. and Nitta et al. have developed label-free biophysical cytometers using image analysis and microfluidic structures to measure cell deformation and size albeit with limited sorting throughput of 100 cells per s.23,55,56 DFF devices are scalable and have been shown to process samples at mL per minute, while DLD have been shown to sort cell at high cell concentrations. In this study, we further developed the DFF and DLD technology for the label-free biophysical marker sorting of reticulocytes from erythroid culture and compared the outcome with the current gold standard of FACS sorting. A trapezoidal cross-section DFF chip was applied to simultaneously perform reticulocyte purification and media exchange in a continuous perfusion culture, while an inverse-L shape DLD device showed label-free biophysical isolation of reticulocytes with comparable yield and purity to FACS.Compared with conventional cell purification by FACS, the DFF and DLD microfluidic purification methods were label-free and high-throughput (Table 1). 1 million cells can be processed within approximately 1 minute with a single DFF microfluidic chip, in contrast to at least 10–15 minutes by FACS. Note that a single pass through DFF will completely purify100 million cells within 30 min at a sorting concentration of 4 million per mL, although in this study a circulated sorting approach was applied to progressively purify reticulocytes in a continuous perfusion culture setup. DFF only achieved 80.0% reticulocyte purity, as compared to greater than 97% with DLD and FACS. This is mainly due to its lower efficiency in separating free nuclei from reticulocytes. Narrower DFF chip designs hold a potential to achieve better separation resolution, however, the sorting speed and reticulocyte recovery would be inevitably compromised.
| FACS | DLD | DFF re-circulation | |
|---|---|---|---|
| Recovery (cell no.) | 30.6% (20.8 million) | 27.6% (18.7 million) | 72.3% (49.1 million) |
| Purity | 99.7% | 97.4% | 80.0% |
| Throughput | ∼8000 cells per s |
∼20![[thin space (1/6-em)]](https://www.rsc.org/images/entities/b_char_2009.gif) 000 cells per s 000 cells per s
|
∼16000 cells per s
|
| Processing time (total cell no.) | 4 hours (108 cells) | 1.5 hours (10 8 cells) | 2 hours (10 8 cells) |
| Cell density | 1 million per mL | 400 million per mL | 4 million per mL |
| System cost | >$500000 (FACS) |
$1500–$15000
(syringe pump + Mold)
|
$1500–$15000
(peristaltic pump + Mold)
|
| Cost per sort | ∼$35 (nuclear staining) | ∼$10 PDMS Chip | ∼$10 PDMS Chip |
| Sorting method | Cell nucleus staining | Cell size and deformability | Cell size |
The performance of DLD and FACS are comparable with close to 97.4% purity and 27.6% recovery. Unlike FACS where cells experience high shear stress resulting in potential cell death, DLD is advantageous as the sorting is relatively gentle on the cells. Reticulocytes tethered to expelled nuclei during the enucleation process are observed to remain intact during the sorting process (Fig. S12 and Movie S4, ESI†). During the infusion process, the settling of cells in the syringe and tubing results in loss during infusion. Loss of cells during the insertion of tubing into the DLD chip is inevitable to ensure a bubble-free tubing connection. Notwithstanding, DLD sorting using inverse-L pillars shows engineering precision and control over the selection of biological cells using biophysical properties of size and deformability.
In this study, we have demonstrated the robustness of both DFF and DLD techniques for processing more than 100 million cells in short-term operations (few hours). The lateral position of cells in DFF systems are a function of flow rate, thus fluctuations in flow rates would inevitably compromise the robustness of cell separation. The DLD microfluidic method is less sensitive to changing flow rates as the sorting is performed within Reynolds number <1 where effects of inertial forces is negligible. By employing a circulating DFF sorting in the bioreactor setup, we minimise the effects of fluid flow fluctuation raised from peristaltic pump pulsation (Fig. 3). The use of circulated sorting in long-term culture impose an extremely high requirement on the microfluidic chip's resistance to clogging. The large cross-sectional area and high sorting speed of DFF guarantee very low chance of clogging. In contrast, the same operational modality may not be ideal for DLD, as cell aggregates and debris may gradually clog up the dense pillars. Although DLD has a higher chance of clogging than DFF in general, the clogging in DLD usually takes place in a gradual manner, and would not impair the sorting until certain threshold of the pillar structures are clogged; while when clogging happens in DFF especially at the outlet bifurcation, the cell separation is likely to be affected immediately.
Combined, these results demonstrate that microfluidic biophysical sorting methods, if properly optimized, are able to provide comparable level of sorting purity, but with significantly higher efficiency and lower cost and technical difficulty. The potential applications of these biophysical cell-sorting technologies using label-free biophysical markers extend beyond reticulocyte purification into realms of disease diagnostics, bacterial pathogenicity and stem cell therapy. With the emerging large-scale applications such as cell therapy production, these are important advantages over more convention techniques such as FACS and MACS. The different features of DFF and DLD also make them suitable for different applications respectively. In scale-up manufacturing processes, DFF should be firstly considered for its' high volumetric throughput. In scenarios where cell purity is pivotal, DLD's high precision feature holds great advantage.
In conclusion we have generated reticulocytes from in vitro erythroid culture derived from HSPCs, where the end-stage erythroid cultures contain a complex mixture of progenitor cells, expelled nuclei and reticulocytes. To effectively purify the reticulocytes, we developed two label-free and scalable microfluidic techniques based on cell size and deformability. The DFF system, employing a trapezoidal cross-section design to enhance separation resolution and throughput, retained a high 72.3% recovery of reticulocytes while achieving 80.0% purity in circulated perfusion cultures. The DLD system on the other hand achieved 97.4% purity with a lower 27.6% recovery by adopting an inverse-L shape pillar structure, which selectively deflect rigid particles into waste outlets and retains the softer and deformable reticulocytes. Compared to the current gold standard FACS sorting, these two microfluidic sorting technologies showed great potential for large scale processing and purification of erythroid cultures. This study sheds light on large-scale high-purity label-free reticulocyte production for therapeutic and research purposes.
4. Experimental section
Ethics statement
All the experimental methods were carried out in accordance with the approved guidelines. The blood donation from healthy individuals was approved by Institutional Review Board (IRB) of National University of Singapore (NUS-IRB Ref Code: 10-285). Written approval consents were obtained prior to blood collection.In vitro erythroid culture
A total of 1 million adult peripheral blood CD34+ HSPCs (Fred Hutchinson Cancer Center), mobilized by granulocyte-colony stimulating factor were thawed gradually. Cells were then placed in expansion medium (day 0–5), differentiation phase 1 (day 5–9) and 2 (day 9–12) media, as reagents and cell density are described previously.13 Aliquots of 50 million erythroid cells were made on day 12 and cell pellets (centrifuged at 600 g, 3 minutes) were gently resuspended in 50 μL of FBS. 550 μL of freezing solution, 15% DMSO and 75% FBS, were added gently and samples were frozen gradually at −80 °C, then transferred to liquid nitrogen. When reticulocytes were desired, cryo-preserved erythroblasts were gradually thawed as for HSPCs. Thawed cells were then placed in differentiation phase 3 (day 12–16), 4 (day 16–20) and 5 (day 20–23) media.13 At the end of differentiation stage 5, each batch of aliquoted 50 million in vitro erythroid culture resulted on average in 735 million erythroid cells. The final expansion for the entire erythroid culture is approximately 14700 fold, which could yield close to 15 billion erythroid cells from 1 million HSPCs.
Flow cytometry based sorting of reticulocytes
On day 23 of erythroid culture, cells were stained in a batch of 50 million cells and maximum total of 200 million cells at once for sorting by BD ARIA II (BD Biosciences). Erythroid cells were centrifuged at 600 g for 3 minutes, washed in 1 mL of Hank's balanced salt solution (Thermo Fisher Scientific, 14025076), then stained in 1 mL of HBSS with 18 μL of SYTOX red (Thermo Fisher Scientific, S34859) and 22.5 μL of 1:100 SYTO16 (Thermo Fisher Scientific, S7578) for 10 minutes at room temperature in the dark.41,42 Cells were washed once in 1 mL of HBSS, resuspended in 1 mL HBSS, then filtered through 70 μm pre-separation filters (Miltenyi Biotec, 130-095-823) into 5 mL Polystyrene round bottom tube (Corning, 352058). Filters were rinsed with additional 200 μL of HBSS and tubes were capped and stored on ice until the acquisition. Reticulocytes were sorted with 100 μm nozzle, 2- or 4-way ppurity precision mode and 6000 to 10000 events per second. Reticulocytes were collected into 15 mL Falcon tubes coated with 3 mL of FBS to minimize the hemolysis. Sorted cells were centrifuged at 600 g for 5 minutes and resuspended in plain IMDM (Thermo Fisher Scientific, 12440) and stored at 4 °C until downstream experiments. For microscopic categorization of Heilmeyer stages, 1 μL of packed reticulocytes were mixed with 1 μL of new methylene blue dye (Streck, 340235-6) for 15 minutes at room temperature. Thin-blood smears were prepared on a glass slide, dried immediately and quantified on a microscope (ESI† Fig. S11).
Design and fabrication of spiral DFF microfluidic chip
The mold for producing the DFF microfluidic chip was designed with SolidWorks software (Dassault Systèmes, France), and fabricated from a piece of 50 × 50 × 8 mm aluminum plate using micro-milling technology (Whits Technologies, Singapore). The chip possessed a DFF microchannel with one inlet and two outlets (Fig. 1). The two outlets were named as inner and outer outlets respectively, with the inner outlet being closer to the center of spiral. The spiral DFF microchannel had 8 loops with diameter decreasing from 26.2 mm to 10.6 mm (from inlet to outlets). The cross-section of the microchannel had a trapezoidal shape with 500 μm width, 70 μm inner height, and 100 μm outer height. The ratio of inner to outer outlet width was approximately 1:1 (250 μm each).
The top piece of the DFF microfluidic chip was produced from the mold using standard soft lithography. Liquid phase polydimethylsiloxane (PDMS) elastomer (10:1 mixture of base and curing agent. Sylgard 184, Dow Corning, USA) was poured into the mold, and cured at 80 °C in an oven. After solidification, three tubing accessing holes with 1.5 mm diameter were punched at inlet and outlets, and a 3 mm-thick PDMS base was irreversibly bonded to the top piece of the chip with air plasma treatment (COVANCE, Femato Science, Korea). The assembled chip was placed at 80 °C overnight in an oven for tight bonding.
DFF-based purification of reticulocytes with spiral microfluidic chip
The cultured erythroid cells were suspended in erythroid culture medium at concentration of 1 million cells per mL, and pumped into the chip at 0.8 mL min−1. Purified reticulocytes were collected from the outer outlet of the chip, and unwanted erythroblasts and free nuclei were removed from the inner outlet (Fig. 1).Re-circulation setup for DFF microfluidic purification of reticulocyte
Fifty milliliters of cell suspensions at 2 million cells per mL were loaded in a 125 mL spinner flask (ProCulture, Corning). A magnetic stirrer (Thermo Fisher Scientific, USA) was used to agitate the cell suspension at 35 rpm to avoid cell settlement during the re-circulated sorting process. The cell suspension was pumped into the DFF chip through silicone tubing (Masterflex L/S 14, Cole-Parmer) with a peristaltic pump (Cole-Parmer) at 0.8 mL min−1 (Fig. 3a). Cells separated to the outer outlet of the chip were circulated back to the spinner flask through silicone tubing (Cole-Parmer). Cells separated to the inner outlet of the chip were collected using a 50 mL Falcon tube (BD Biosciences, USA) as waste. All the silicon tubing and the spinner flask were autoclaved before use.DFF microfluidic purification of reticulocyte in continuous perfusion culture
A perfusion culture was setup inside CO2 cell culture incubator by connecting a 125 mL spinner flask to an automated perfusion culture controller system (WhirlCell, Singapore), which utilizes a DFF microfluidic chip as the cell retention device. For clearer imaging and illustration purpose, the DFF device was unmounted from a removable cartridge of controller machine. Similarly, 2 million cells per mL suspension in the spinner flask was injected into the DFF chip through the pumps at 0.8 mL min−1 controlled by the perfusion system. The DFF chip separated erythroblasts and free nuclei in suspension, and discard them with the old media into a waste bottle. Meanwhile, the purified reticulocytes were circulated back to the spinner flask. With old media being continuously removed, the perfusion system sensed a weight change in the culture vessel, and automatically fed fresh media into the vessel to maintain the working volume at 100 mL.DLD microfluidics design and fabrication
DLD is a sensitive size-based sorting technique, using a regularly spaced pillar array where the separation can be determined by the established empirical formula:| Dc = 1.4gtanθ0.48 | (1) |
θ = 1/N. A complete DLD segment is defined when a particle is displaced laterally by λ after passing N number of pillars (Fig. S6d, ESI†). Each DLD zone will consist of 6 repeating DLD segments and a complete displacement will shift a particle laterally by 6λ. Hence, each of the four outputs is designed for a shift of 6 sub-channels which correspond to the various sizes such that outlet 1 would contain cells less than a Dc of 2.4 μm, i.e. these cells are not displaced laterally within the device as their apparent size is smaller than the designed 2.4 μm; outlet 2 would contain cells between Dc of 2.4–3.8 μm; outlet 3 contains cells between 3.2 and 5.1 μm while outlet 4 contain cells larger than 5.1 μm. Outlet 1 is designed to be the collection outlet for reticulocytes as the inverse-L shape is predicted to selectively deflect rigid particles along the gradient while allowing the deformable reticulocytes to slip. As reticulocytes are very similar to RBCs, 2.4 μm cut-off size would not deflect these cells and enable the separation of rigid nuclei and deformable RBCs despite a smaller diameter of the condensed nuclei. The DLD PDMS device is made from an SU-8 mold which is fabricated using standard photolithography techniques. A chrome mask is used to develop these fine circle and inverse-L shape features. Briefly, SU-82025 is spin-coated on a 4 inch silicon wafer to a height of 18 μm and a soft bake step is performed. The SU-8 is exposed under a UV-mask aligner and the DLD features are developed after a post-exposure bake. The final SU-8 mold is treated with trichloro(1H,1H,2H,2H-perfluorooctyl)silane (Sigma, Singapore) using chemical vapour deposition for an hour. This process renders the surface of the silicon wafer hydrophobic due to the carbon-fluorine groups in the molecule which prevents PDMS from sticking and the final device is easily peeled off from this SU-8 mold.
DLD device preparation and setup
DLD microfluidic chips were UV-sterilized and mounted on an inverted microscope (IX71, Olympus, Japan) equipped with a high-speed CCD camera (Phantom v9, Vision Research, USA) for real-time visualization of cell focusing and separation inside the channel. The recorded videos were processed using ImageJ software (NIH, USA) for images. Buffers or cell suspension were loaded in syringes (Terumo Medical, Japan), and pumped into the chip through UV-sterilized polyethylene tubing (Scientific Commodities, BB31695-PE/2) using syringe pumps (PHD 2000, Harvard Apparatus, USA). The chips were first primed with 1% poloxamer 188 (Sigma-Aldrich, P5556) in Milli-Q water to avoid sticking of cells to the channel walls during sorting, followed by 1× PBS to wash off the residual water inside the microchannel.DLD sorting parameters for erythroid culture
The 100 million erythroid culture cells were first filtered using a 40 μm filter to remove large clumps of cells. The cells were washed in DMEM medium and added ∼2000 units of DNase for 15 min (Sigma-Aldrich, 10104159001) to remove extracellular DNA, which would trap cells within the device. The cells were directly concentrated to 50 million per mL for characterisation tests and 400 million per mL (final volume of 250 μL) for high-throughput sorting. All sorting flows were performed at 3 μL per minute syringe infusion rate. To prevent cell settlement within the syringe, the Harvard pump was oriented vertically such that the syringe plunger is perpendicular to the ground. 4 outlets holes of 1.0 mm in diameter were punch into the PDMS device. 1.09 mm outer diameter polyethylene tubing (Scientific Commodities, BB31695-PE/2) of approximately 7 cm long was inserted into each outlet. The tubes were inserted into a custom orifice of 2 mm in the cap of the 1.5 mL Eppendorf tube. All components were sterilized using UV exposure for 10 min.Microscopic and flow cytometric monitoring of erythroid cells
Cell number and viability were monitored after each phases of erythroid culture using trypan blue and counting chamber. A total of 5 million erythroid cells were used for Wright–Giemsa stain (Sigma-Aldrich, WG16). Erythroid cells were washed in 1× PBS buffer then thin-blood smears were prepared on a glass slide. Samples were immediately air dried, covered with the dye for 30 seconds then rinsed thoroughly with water. Images were captured using a light microscope (Olympus, CX31), iPhone (Apple, 6S) and iDu LabCam iPhone 6 Microscope adapter (iDu Optics). This image capturing methods were also used for Heilmeyer and Giemsa stained slides in this study. Erythroid cells (approximately 100000 cells) after each phases of culture were stained with following anti-human antibodies: CD49d-PE (Biolegend, 9F10), CD36-FITC (Biolegend, 5-271), CD71-PeCy7 (Biolegend, CY1G4), CD235α-PE (Biolegend, HI264) and CD34-APC (Biolegend, 561). All cells were stained in FACS buffer (0.2% BSA, 0.05% sodium azide in PBS) for 10 minutes on ice, washed twice in FACS buffer and resuspended in FACS buffer containing 1:1000 DAPI (Thermo Fisher Scientific, 62248) for the viability analysis. Stained live cells were acquired using BD LSR II (BD Biosciences) and analyzed by FlowJo software (Tree Star).
P. falciparum culture
P. falciparum 3D7 strain was maintained in RPMI-based malaria culture medium, MCM, (RPMI 1640 supplemented with HEPES, hypoxanthine, sodium bicarbonate and Albumax II) at 2.5% hematocrit. Schizonts were purified by LS magnetic column57 (Miltenyi Biotec, 130-042-401) and inoculated to 5 million host cells in 200 μL of MCM in 96-well plate. MCM was replaced every other day. Parasitemia was monitored daily by microscopy with Giemsa-stained thin blood smears.Immunofluorescence detection of P. falciparum parasites
To confirm the successful invasion, csRET (20 million) was stained in 0.5 μM of CellTrace CFSE Proliferation Kit (Thermo Fisher Scientific, C34554) following the manufacturer's protocol. Stained cells were either resuspended in pre-warmed culture medium for P. falciparum. As a control, mature RBCs (20 million) was also stained in 2.5 μM of CellTrace Far Red Proliferation Kit (Thermo Fisher Scientific, C34564). The efficiency of cell labeling was verified by acquiring the samples with MACSQuant Analyzer 10 (Miltenyi Biotec). A total of 5 million labeled cells were inoculated with purified schizonts for the parasite culture.
P. falciparum samples were settled on poly-L-lysine coverslips (VWR, BD354085) for 15 minutes, supernatant were removed, air-dried immediately and fixed with ice-cold methanol for 5 minutes. Samples were stained at 37 °C, by first blocking with 3% BSA for 30 minutes, probed with 1:800 dilution of PfEXP2 antibody (Genscript, generated using the peptide KNIESGKYEFDVD) for 45 minutes and 1:1000 dilution of goat anti-rabbit Alexa Fluor 568 (Thermo Fisher Scientific, A-11010) for 45 minutes. Samples were also stained for DNA using 1:1000 dilution of Hoechst 33342 (Thermo Fisher Scientific, 62249) for 10 minutes at room temperature, and then mounted on a glass slide using a drop of ProLong Diamond Antifade Mountant (Thermo Fisher Scientific, P36970). Images were taken using confocal microscope (Zeiss, LSM700).
Micropipette data acquisition
Shear elastic moduli of reticulocytes were measured using the micropipette aspiration technique. The set-up comprises a micromanipulator (TransferMan NK2, Eppendorf) mounted on a microscope (IX71, Olympus). First, borosilicate glass capillaries (1.0 mm outer diameter, 0.75 mm inner diameter, Sutter Instruments Co.) were prepared using a micropipette puller (P-97, Sutter Instruments Co.). The tips of the pulled glass capillaries were then cut using a microforge (MF-900, Narishige Group) to inner diameters ranging from 1.5 to 1.6 μm. After mounting the micropipette, each reticulocyte was aspirated at a constant rate of 10 mL per hour using a syringe pump (NE-1000, New Era Pump Systems Inc.). Images of the reticulocyte entering the micropipette were acquired at 1 frame per s using a camera (GP-660 V, Kunshan Gaopin Precision Instrument Co. Ltd.) connected to the microscope.Micropipette data analysis
The raw images captured were analyzed using imageJ software (NIH, USA). More specifically, the length of the reticulocyte in the micropipette for each frame and the inner diameter of the micropipette were measured. Subsequently, these values were fitted into the model by Chien et al.58 Two-tailed student's t-test with unequal variance was then employed to compare the different treatments with the control.Fluid streamline simulation
The simulation of fluid streamline was performed using Comsol Multiphysics 5.3a. The cad drawing was importing into the simulation and a single-phase laminar flow physics module was used to simulate the flows. The shallow channel option was checked with a device height of 18 μm. The results was exported into streamlines and flow 2D flow profile.Statistical analysis
Statistics were assessed using GraphPad Prism 5 (GraphPad Software). Statistical significance was calculated using a Mann–Whitney test and 2 way ANOVA, Sidak's multiple comparison test. P value of <0.05 was considered significant.Conflicts of interest
There are no conflicts to declare.Acknowledgements
We thank Farzad Olfat and Narayanan Balasubramanian for the administrative support. We also thank Prof Harvey Lodish for fruitful discussion and expert input in the initial phase of this work. This research is supported by the National Research Foundation, Prime Minister’s Office, Singapore under its Campus for Research Excellence and Technological Enterprise (CREATE) programme, through Singapore MIT Alliance for Research and Technology (SMART): Anti-Microbial Resistance (AMR) and Critical Analytics for Manufacturing Personalised-Medicine (CAMP) Inter-Disciplinary Research Group. Y. S. was funded by the SMART Postdoctoral Fellowship program. YS, LY, KKZ, JC, JH, and PRP conceived and designed the experiments. YS, LY, KKZ, LHW, HLL, YBL and performed the experiments. YS, LY, KKZ, LHW, HLL and YBL analyzed the data. CTL and NJH contributed reagents/materials/analysis tools. YS, LY and KKZ wrote the manuscript with input from JC, JH, and PRP.References
- C. Briggs and B. J. Bain in Dacie and Lewis Practical Haematology, Elsevier, 12th edn, 2017, pp. 18–49 Search PubMed.
- C. Brugnara, Use of reticulocyte cellular indices in the diagnosis and treatment of hematological disorders, Int. J. Clin. Lab. Res., 1998, 28, 1–11, DOI:10.1007/s005990050011.
- S. Syed, et al., Use of Reticulocyte Hemoglobin Content in the Assessment of Iron Deficiency in Children With Inflammatory Bowel Disease, J. Pediatr. Gastroenterol. Nutr., 2017, 64, 713–720, DOI:10.1097/mpg.0000000000001335.
- P. Strati, et al., Novel hematological parameters for the evaluation of patients with myeloproliferative neoplasms: the immature platelet and reticulocyte fractions, Ann. Hematol., 2017, 96, 733–738, DOI:10.1007/s00277-017-2956-3.
- S. Chong, Overview of Cell-Free Protein Synthesis: Historic Landmarks, Commercial Systems, and Expanding Applications, Current protocols in molecular biology, ed. F. M. Ausubel, et al., 2014, vol. 108, p. 16.30.11, DOI:10.1002/0471142727.mb1630s108.
- K. Miharada, T. Hiroyama, K. Sudo, T. Nagasawa and Y. Nakamura, Efficient enucleation of erythroblasts differentiated in vitro from hematopoietic stem and progenitor cells, Nat. Biotechnol., 2006, 24, 1255–1256 CrossRef CAS PubMed.
- N. Anstey, B. Russell, T. W. Yeo and R. Price, The pathophysiology of vivax malaria, 2009, vol. 25 Search PubMed.
- J. K. Baird, N. Valecha, S. Duparc, N. J. White and R. N. Price, Diagnosis and Treatment of Plasmodium vivax Malaria, Am. J. Trop. Med. Hyg., 2016, 95, 35–51, DOI:10.4269/ajtmh.16-0171.
- L. Martín-Jaular, et al., Reticulocyte-prone malaria parasites predominantly invade CD71 hi immature cells: implications for the development of an in vitro culture for Plasmodium vivax, Malar. J., 2013, 12, 434 CrossRef PubMed.
- G. Pasvol, D. Weatherall and R. Wilson, The increased susceptibility of young red cells to invasion by the malarial parasite Plasmodium falciparum, Br. J. Haematol., 1980, 45, 285–295 CrossRef CAS PubMed.
- E. Piva, C. Brugnara, L. Chiandetti and M. Plebani, Automated reticulocyte counting: state of the art and clinical applications in the evaluation of erythropoiesis, Clin. Chem. Lab. Med., 2010, 48, 1369–1380 CAS.
- D. H. Ryan, Examination of the blood, Williams hematology, 2001, vol. 6, pp. 9–16 Search PubMed.
- N.-J. Huang, et al., Genetically engineered red cells expressing single domain camelid antibodies confer long-term protection against botulinum neurotoxin, Nat. Commun., 2017, 8, 423 CrossRef PubMed.
- R. E. Griffiths, et al. The ins and outs of human reticulocyte maturation: autophagy and the endosome/exosome pathway, Autophagy, 2012, 8, 1150–1151 CrossRef CAS PubMed.
- K. Trakarnsanga, et al., An immortalized adult human erythroid line facilitates sustainable and scalable generation of functional red cells, Nat. Commun., 2017, 8, 14750 CrossRef CAS PubMed.
- L. Kobari, et al., Human induced pluripotent stem cells can reach complete terminal maturation: in vivo and in vitro evidence in the erythropoietic differentiation model, Haematologica, 2012, 97, 1795–1803 CrossRef PubMed.
- A. A. Kumar, et al., Enrichment of reticulocytes from whole blood using aqueous multiphase systems of polymers, Am. J. Hematol., 2015, 90, 31–36, DOI:10.1002/ajh.23860.
- W. Roobsoong, et al., Improvement of culture conditions for long-term in vitro culture of Plasmodium vivax, Malar. J., 2015, 14, 297 CrossRef PubMed.
- B. Malleret, et al., Significant biochemical, biophysical and metabolic diversity in circulating human cord blood reticulocytes, PLoS One, 2013, 8, e76062 CrossRef CAS PubMed.
- B. Malleret, et al., Plasmodium vivax: restricted tropism and rapid remodeling of CD71-positive reticulocytes, Blood, 2015, 125, 1314–1324 CrossRef CAS PubMed.
- S. R. Goodman, K. M. Hughes, D. G. Kakhniashvili and S. Neelam, The isolation of reticulocyte-free human red blood cells, Exp. Biol. Med., 2007, 232, 1470–1476 CrossRef CAS PubMed.
- J. Büsch, P. Huber, E. Pflüger, J. Holtz and A. Radbruch, Enrichment of fetal cells from maternal blood by high gradient magnetic cell sorting (double MACS) for PCR-based genetic analysis, Prenatal Diagn., 1994, 14, 1129–1140 CrossRef PubMed.
- M. Masaeli, et al., Multiparameter mechanical and morphometric screening of cells, Sci. Rep., 2016, 6, 37863 CrossRef CAS PubMed.
- M. Herbig, et al., Real-time deformability cytometry: label-free functional characterization of cells, Methods Mol. Biol., 2018, 1678, 347–369 CrossRef CAS PubMed.
- E. Guzniczak, et al., High-throughput assessment of mechanical properties of stem cell derived red blood cells, toward cellular downstream processing, Sci. Rep., 2017, 7, 14457, DOI:10.1038/s41598-017-14958-w.
- A. A. Bhagat, S. S. Kuntaegowdanahalli and I. Papautsky, Continuous particle separation in spiral microchannels using Dean flows and differential migration, Lab Chip, 2008, 8, 1906–1914, 10.1039/b807107a.
- L. Wu, G. Guan, H. W. Hou, A. A. Bhagat and J. Han, Separation of leukocytes from blood using spiral channel with trapezoid cross-section, Anal. Chem., 2012, 84, 9324–9331, DOI:10.1021/ac302085y.
- L. R. Huang, E. C. Cox, R. H. Austin and J. C. Sturm, Continuous particle separation through deterministic lateral displacement, Science, 2004, 304, 987–990, DOI:10.1126/science.1094567.
- K. K. Zeming, S. Ranjan and Y. Zhang, Rotational separation of non-spherical bioparticles using I-shaped pillar arrays in a microfluidic device, Nat. Commun., 2013, 4, 1625 CrossRef PubMed , http://www.nature.com/ncomms/journal/v4/n3/suppinfo/ncomms2653_S1.html.
- J. P. Beech, S. H. Holm, K. Adolfsson and J. O. Tegenfeldt, Sorting cells by size, shape and deformability, Lab Chip, 2012, 12, 1048–1051 RSC.
- C. W. Shields, C. D. Reyes and G. P. López, Microfluidic Cell Sorting: A Review of the Advances in the Separation of Cells from Debulking to Rare Cell Isolation, Lab Chip, 2015, 15, 1230–1249, 10.1039/c4lc01246a.
- M. E. Warkiani, et al., An ultra-high-throughput spiral microfluidic biochip for the enrichment of circulating tumor cells, Analyst, 2014, 139, 3245–3255, 10.1039/c4an00355a.
- J. T. Smith, et al., Integrated nanoscale deterministic lateral displacement arrays for separation of extracellular vesicles from clinically-relevant volumes of biological samples, Lab Chip, 2018, 18, 3913–3925, 10.1039/C8LC01017J.
- D. W. Inglis, M. Lord and R. E. Nordon, Scaling deterministic lateral displacement arrays for high throughput and dilution-free enrichment of leukocytes, J. Micromech. Microeng., 2011, 21, 054024 CrossRef.
- R. Campos-González, et al., Deterministic Lateral Displacement: The Next-Generation CAR T-Cell Processing?, SLAS Technol., 2018, 23, 338–351, DOI:10.1177/2472630317751214.
- M. E. Warkiani, et al., Slanted spiral microfluidics for the ultra-fast, label-free isolation of circulating tumor cells, Lab Chip, 2014, 14, 128–137, 10.1039/c3lc50617g.
- S. Ranjan, K. K. Zeming, R. Jureen, D. Fisher and Y. Zhang, DLD pillar shape design for efficient separation of spherical and non-spherical bioparticles, Lab Chip, 2014, 14, 4250–4262, 10.1039/c4lc00578c.
- M.-C. Giarratana, et al., Proof of principle for transfusion of in vitro–generated red blood cells, Blood, 2011, 118, 5071–5079 CrossRef CAS PubMed.
- M.-C. Giarratana, et al., Ex vivo generation of fully mature human red blood cells from hematopoietic stem cells, Nat. Biotechnol., 2005, 23, 69–74 CrossRef CAS PubMed.
- T. Triglia, et al., Identification of Proteins from Plasmodium falciparum That Are Homologous to Reticulocyte Binding Proteins in Plasmodium vivax, Infect. Immun., 2001, 69, 1084–1092 CrossRef CAS PubMed.
- H. Yoshida, et al., Phosphatidylserine-dependent engulfment by macrophages of nuclei from erythroid precursor cells, Nature, 2005, 437, 754–758, DOI:10.1038/nature03964.
- D. G. Konstantinidis, et al., Signaling and cytoskeletal requirements in erythroblast enucleation, Blood, 2012, 119, 6118–6127, DOI:10.1182/blood-2011-09-379263.
- T. H. Kim, H. J. Yoon, P. Stella and S. Nagrath, Cascaded spiral microfluidic device for deterministic and high purity continuous separation of circulating tumor cells, Biomicrofluidics, 2014, 8, 064117, DOI:10.1063/1.4903501.
- W. C. Lee, A. A. Bhagat and C. T. Lim, High-throughput synchronization of mammalian cell cultures by spiral microfluidics, Methods Mol. Biol., 2014, 1104, 3–13, DOI:10.1007/978-1-62703-733-4_1.
- Z. Poon, et al., Bone marrow regeneration promoted by biophysically sorted osteoprogenitors from mesenchymal stromal cells, Stem Cells Transl. Med., 2015, 4, 56–65, DOI:10.5966/sctm.2014-0154.
- D. Di Carlo, D. Irimia, R. G. Tompkins and M. Toner, Continuous inertial focusing, ordering, and separation of particles in microchannels, Proc. Natl. Acad. Sci. U. S. A., 2007, 104, 18892–18897, DOI:10.1073/pnas.0704958104.
- H. W. Hou, et al., Isolation and retrieval of circulating tumor cells using centrifugal forces, Sci. Rep., 2013, 3, 1259 CrossRef PubMed , http://www.nature.com/srep/2013/130212/srep01259/abs/srep01259.html#supplementary-information.
- G. Guan, et al., Spiral microchannel with rectangular and trapezoidal cross-sections for size based particle separation, Sci. Rep., 2013, 3, 1475, DOI:10.1038/srep01475.
- B. L. Khoo, et al., Clinical validation of an ultra high-throughput spiral microfluidics for the detection and enrichment of viable circulating tumor cells, PLoS One, 2014, 9, e99409, DOI:10.1371/journal.pone.0099409.
- M. Rafeie, J. Zhang, M. Asadnia, W. Li and M. E. Warkiani, Multiplexing slanted spiral microchannels for ultra-fast blood plasma separation, Lab Chip, 2016, 16, 2791–2802, 10.1039/C6LC00713A.
- T. Kwon, et al., Microfluidic Cell Retention Device for Perfusion of Mammalian Suspension Culture, Sci. Rep., 2017, 7, 6703, DOI:10.1038/s41598-017-06949-8.
- J. A. Davis, et al., Deterministic hydrodynamics: taking blood apart, Proc. Natl. Acad. Sci. U. S. A., 2006, 103, 14779–14784, DOI:10.1073/pnas.0605967103.
- S. H. Holm, et al., Microfluidic Particle Sorting in Concentrated Erythrocyte Suspensions, Phys. Rev. Appl., 2019, 12, 014051, DOI:10.1103/PhysRevApplied.12.014051.
- R. Vernekar and T. Krüger, Breakdown of deterministic lateral displacement efficiency for non-dilute suspensions: A numerical study, Med. Eng. Phys., 2015, 37, 845–854 CrossRef CAS PubMed.
- A. A. Nawaz, et al. Using real-time fluorescence and deformability cytometry and deep learning to transfer molecular specificity to label-free sorting, bioRxiv, 2019, p. 862227, DOI:10.1038/s41592-020-0831-y.
- N. Nitta, et al., Intelligent Image-Activated Cell Sorting, Cell, 2018, 175, 266–276.e213, DOI:10.1016/j.cell.2018.08.028.
- N. T. Huy, T. Kariu, K. Tajima and K. Kamei, One-step concentration of malarial parasite-infected red blood cells and removal of contaminating white blood cells, Malar. J., 2004, 3, 7 CrossRef PubMed.
- S. Chien, K. L. Sung, R. Skalak, S. Usami and A. Tözeren, Theoretical and experimental studies on viscoelastic properties of erythrocyte membrane, Biophys. J., 1978, 24, 463–487 CrossRef CAS PubMed.
Footnotes |
| † Electronic supplementary information (ESI) available. See DOI: 10.1039/c9lc01128e |
| ‡ Co-first authors. |
| This journal is © The Royal Society of Chemistry 2020 |