
 Open Access Article
 This Open Access Article is licensed under a
 Creative Commons Attribution 3.0 Unported Licence
Single cell migration profiling on a microenvironmentally tunable hydrogel microstructure device that enables stem cell potency evaluation†
Enrique
Ros
 ab,
Matías
Encina
ab,
Fabián
González
ab,
Rafael
Contreras
c,
Patricia
Luz-Crawford
c,
Maroun
Khoury
abd and
Juan Pablo
Acevedo
*abd
ab,
Matías
Encina
ab,
Fabián
González
ab,
Rafael
Contreras
c,
Patricia
Luz-Crawford
c,
Maroun
Khoury
abd and
Juan Pablo
Acevedo
*abd
aCells for Cells, Santiago, Chile
bConsorcio Regenero, Chilean Consortium for Regenerative Medicine, Santiago, Chile
cLaboratorio de Inmunología Celular y Molecular, Centro de Investigación Biomédica, Facultad de Medicina, Universidad de los Andes, Santiago, Chile
dLaboratory of Nano-Regenerative Medicine, Faculty of Medicine, Universidad de los Andes, Santiago, Chile. E-mail: jpacevedo@uandes.cl
First published on 28th January 2020
Abstract
Cell migration is a key function in a myriad of physiological events and disease conditions. Efficient, quick and descriptive profiling of migration behaviour in response to different treatments or conditions is highly desirable in a series of applications, ranging from fundamental studies of the migration mechanism to drug discovery and cell therapy. This investigation applied the use of methacrylamide gelatin (GelMA) to microfabricate migration lanes based on GelMA hydrogel with encapsulated migration stimuli and structural stability under culture medium conditions, providing the possibility of tailoring the microenvironment during cell-based assays. The actual device provides 3D topography, cell localization and a few step protocol, allowing the quick evaluation and quantification of individual migrated distances of a cell sample by an ImageJ plugin for automated microscopy processing. The detailed profiling of migration behaviour given by the new device has demonstrated a broader assay sensitivity compared to other migration assays and higher versatility to study cell migration in different settings of applications. In this study, parametric information extracted from the migration profiling was successfully used to develop predictive models of immunosuppressive cell function that could be applied as a potency test for mesenchymal stem cells.
Introduction
Cell migration is an essential biological function involved in a myriad of physiological and disease events, such as embryogenesis and development, axon and dendrite growth, immunological cell activities, angiogenesis, cell differentiation, tissue regeneration and cancer. For the study of cell migration in vitro, researchers have been struggling with several limitations presented by commercial cell migration assays (e.g. scratch assay1 and Boyden chamber assay2,3). These broadly used systems present many limitations including difficulties in evaluating cell velocity, directionality and population migration index. Scratch and Boyden chamber assays do not have good performance in dealing with heterogeneous cell populations since end-point results are quantified based on a whole sample response, without resolving differences between different cell subpopulations. They require extensive experimental settings to define the best conditions and timing in order to find significant differences between experimental groups. On the other hand, the new generation of migration assays based on microfluidics4–6 shows important advances in acquiring time-lapse information and controlling spatio-temporal presentation of physicochemical cues. However, they require microfluidic pumping systems and often continuous recording under cell culture conditions. Therefore, they become cost- and time-consuming systems, hampering their wide implementation in cell biology laboratories and high-throughput capability. The desired features of migration assays identified by researchers7 are robust quantification of cell migration, involvement of a few step protocol, 3D cell culture environments, co-culturing capability of multiple cell types, and systems that can reproduce migration conditions similar to those found in vivo. In this work, we present the concept, design, fabrication and use of a novel micro-device based on methacrylamide gelatin.8 This new tool is capable of enclosing migration-inducing factors, and hence, replicating relevant physicochemical cues found in the natural cell niche. For this purpose, microtechnology and microfluidics has been applied in this study for the fabrication of cell microenvironments within an easy-to-use platform for testing cell migration activity. Cells perform uniaxial migration in a system that allows microscopy imaging inspection and easy migration analysis. This device incorporates many of the desired features identified in surveys from end-users.7 Additionally, the special features of this new concept were benchmarked with commercially available migration assays. Finally, relevant applications are shown in this work, notably by the use of the migration profiles as a functional potency assay for mesenchymal stem cells.Results
Chip design, channels, seeding and biomaterial
The device was conceptually designed to speed up and simplify cell migration assays while increasing their resolution and biological significance in comparison with actual systems. To create an easy to implement operable system, the device was designed to be used without the need for expensive specialized equipment and reagents.The system comprised a collection of open parallel migration lanes limited by parallel hydrogel walls and a bottom substrate for cell adherence. The migration units were mounted on a cell culture polystyrene dish of 35 mm in diameter that is used without the need for a microfluidic pumping system. The cell migration device allows cell migration along physically restricted lanes harbouring a topographically 3D microenvironment. Cells are confined within parallel gelatin-based hydrogel walls that form the migration lanes of variable width (10–200 μm) (Fig. 1).
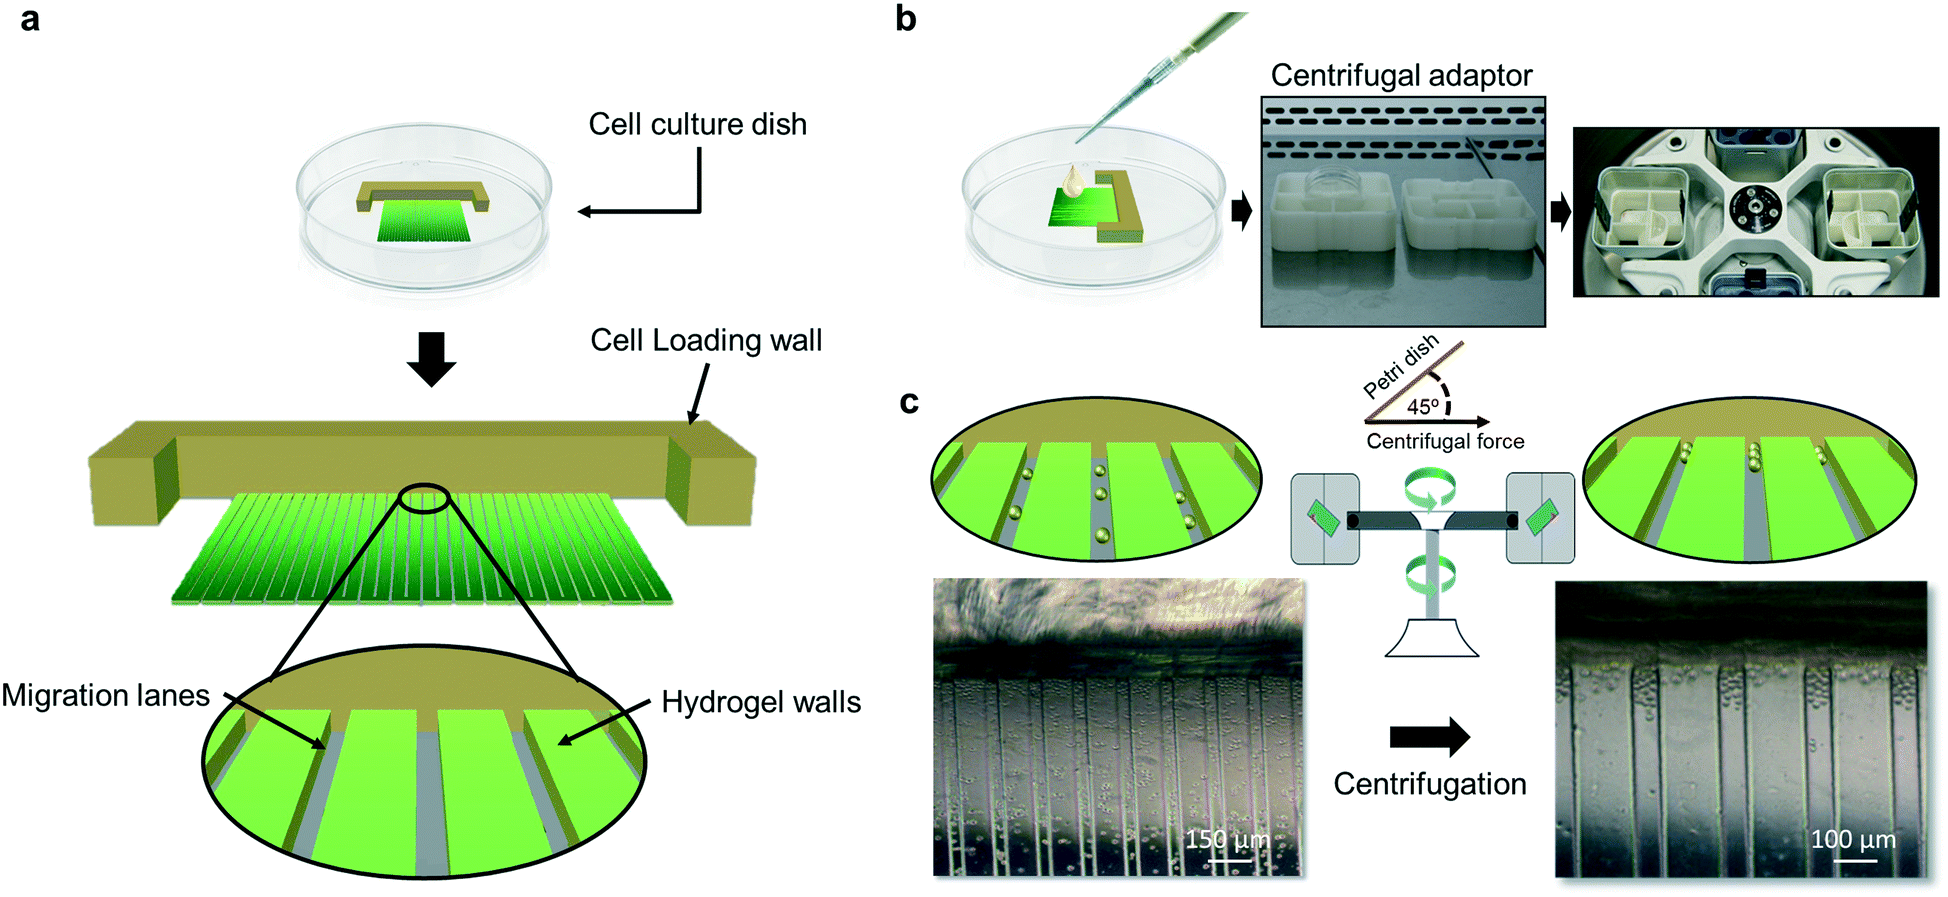 | ||
| Fig. 1 Schematic representation of the cell migration device. a) Cell loading wall supports cell alignment by trapping the cells after the centrifugal steps. After centrifugation, cells are localized at the starting line of the migration lanes. Migration lanes are defined physically by hydrogel walls, and the open ceiling allows direct contact of seeded cells with the culture medium added into the Petri dish. Schematic methodology for cell seeding. b) Cells are loaded by dropping the cell suspension followed by centrifugation using an adaptor that permits application of centrifugal force at 45° with respect to the plane defined by the culture dish bottom. c) Centrifugal force locates all dispersed cells in the vehicle solution to the beginning of the migration lanes. | ||
To trigger cell migration, migration-inducing factors were supplemented to the medium or incorporated within the hydrogel walls, to be then steadily released into the migration lanes and be in intimate contact with the cells. Physical and linear confinement allowed for a rapid uniaxial migration of the cells, which physiologically resulted in a faster cell migration and a better assay resolution, while preserving the heterogenous migration capabilities of the different cell populations.9–11
Fabrication materials pose important challenges for the manufacturing of such devices. The device was fabricated by microinjection of a photo-crosslinkable polymer solution in a polydimethylsiloxane (PDMS) mold, previously mounted and bonded to the surface of a cell culture dish. After UV irradiation and photo-crosslinking, the PDMS mold was detached and the hydrogel walls and migration lanes remained stamped at the bottom of the dish (Fig. S1†). According to the design, the wall's material should allow structural integrity of the migration lanes, but also the encapsulation of soluble migration factors for controlled delivery.
Gelatin solutions can be thermally activated to a triple helix conformation at lower temperature, forming a hydrogel due to gelation, also known as physical crosslinking. This process is reversed toward an aqueous random coil configuration at increased physiological temperatures.12 To avoid melting of gelatin hydrogels, methacrylamide functionalization at lysine amino acid sites was carried out to generate photo-induced inter- and intra-polymeric covalent crosslinking in the presence of a photo-initiator and UV-light.13 This resulted in the formation of thermally stable hydrogels. If photo-crosslinking is conducted after physical crosslinking (thermal gelation), the stiffer triple-helix folding of gelatin polypeptides is fixed, avoiding thermally induced melting and swelling (Fig. S2–S4†). This strategy allowed structural stability and a good substrate for cell–ECM interaction (ESI†). In regard to the final material formulation, methacrylamide gelatin (GelMA) solutions at concentrations of 10% (w/v) supplemented with 0.5% (w/v) photo-initiator (2-hydroxy-4′-(2-hydroxyethoxy)-2-methylpropiophenone) resulted in a hydrogel with minimal swelling. Although the height of patterned channels in the PDMS mold was designed to be 50 μm, the hydrogel walls stamped after photo-crosslinking and swelling resulted in 55 ± 5 μm height. Variability and deviation from 50 μm could be explained in part by common variations in the PDMS mold, swelling and variations in the effect of oxygen-inhibition of free radical photopolymerization at different sections of the device.14 Interestingly, this natural polymer can encapsulate different soluble factors, allows integrin-derived cell adhesion and can be remodelled or hydrolysed by cell-derived metalloproteinases, which can be naturally secreted at the front end of migrating cells.15–18
Device use and result analysis
In the device, cells are initially localized at the starting point of migration lanes by simply placing a cell suspension of a few thousand cells (3000–18![[thin space (1/6-em)]](https://www.rsc.org/images/entities/char_2009.gif) 000 cells) on top of the device, followed by a centrifugation step with the force applied at a 45° angle relative to the plane of the device bottom (Fig. 1). This would pack the cell population at the beginning of the migration lanes. Migration of individual cells was quantified by measuring the distance of each migrated cell from a common starting point (beginning of migration lanes or the cell packing zone), which permitted a direct and rapid assessment of results. For cell seeding, a cell suspension contained in a rich cell culture medium (e.g. DMEM supplemented with 10% fetal bovine serum (FBS)) is used; therefore, after centrifugation, the cells can undergo quick cell attachment at the cell packing zone once in the cell incubator. Alternatively, the device can be coated before cell seeding with cell attachment substrates, such as fibronectin or laminin. After cell seeding and attachment, the cell culture medium can be maintained during the migration assay or exchanged to a specific migration medium. The last could contain, for example, reduced availability of nutrients to avoid cell expansion during the assay, specific migration-inducing factors or drugs to test their effect in migration responses. The assay is carried out in the presence of medium and using traditional cell culture incubators.
000 cells) on top of the device, followed by a centrifugation step with the force applied at a 45° angle relative to the plane of the device bottom (Fig. 1). This would pack the cell population at the beginning of the migration lanes. Migration of individual cells was quantified by measuring the distance of each migrated cell from a common starting point (beginning of migration lanes or the cell packing zone), which permitted a direct and rapid assessment of results. For cell seeding, a cell suspension contained in a rich cell culture medium (e.g. DMEM supplemented with 10% fetal bovine serum (FBS)) is used; therefore, after centrifugation, the cells can undergo quick cell attachment at the cell packing zone once in the cell incubator. Alternatively, the device can be coated before cell seeding with cell attachment substrates, such as fibronectin or laminin. After cell seeding and attachment, the cell culture medium can be maintained during the migration assay or exchanged to a specific migration medium. The last could contain, for example, reduced availability of nutrients to avoid cell expansion during the assay, specific migration-inducing factors or drugs to test their effect in migration responses. The assay is carried out in the presence of medium and using traditional cell culture incubators.
Quantification software
For the quick analysis of migration response, a plugin running in the “Fiji” version of ImageJ19 was developed. Briefly, the software is capable of stitching overlapped microscopy images of the entire migration device, at time zero of migration, at different intervals, or at the end of the migration assay.In order to facilitate individual cell localization by the plugin, live cell nuclear staining can be utilized (e.g. Hoechst 33342). This software is capable of identifying the cell nucleus and precisely measuring migrated distances within migration lanes. As raw data, the software assigns individual cell indexes, identifies the specific migration lane where migration occurred and quantifies the distance for every identified cell (Fig. 2a and b). As depicted in Fig. 2, the plugin gives detailed information of the migration response of a cell population by identifying migrated distances for each individual cell. This software quantifies migrated distances of cells exclusively located within the migration lanes, discarding any cell that could have been seeded or migrated on top of hydrogel walls.
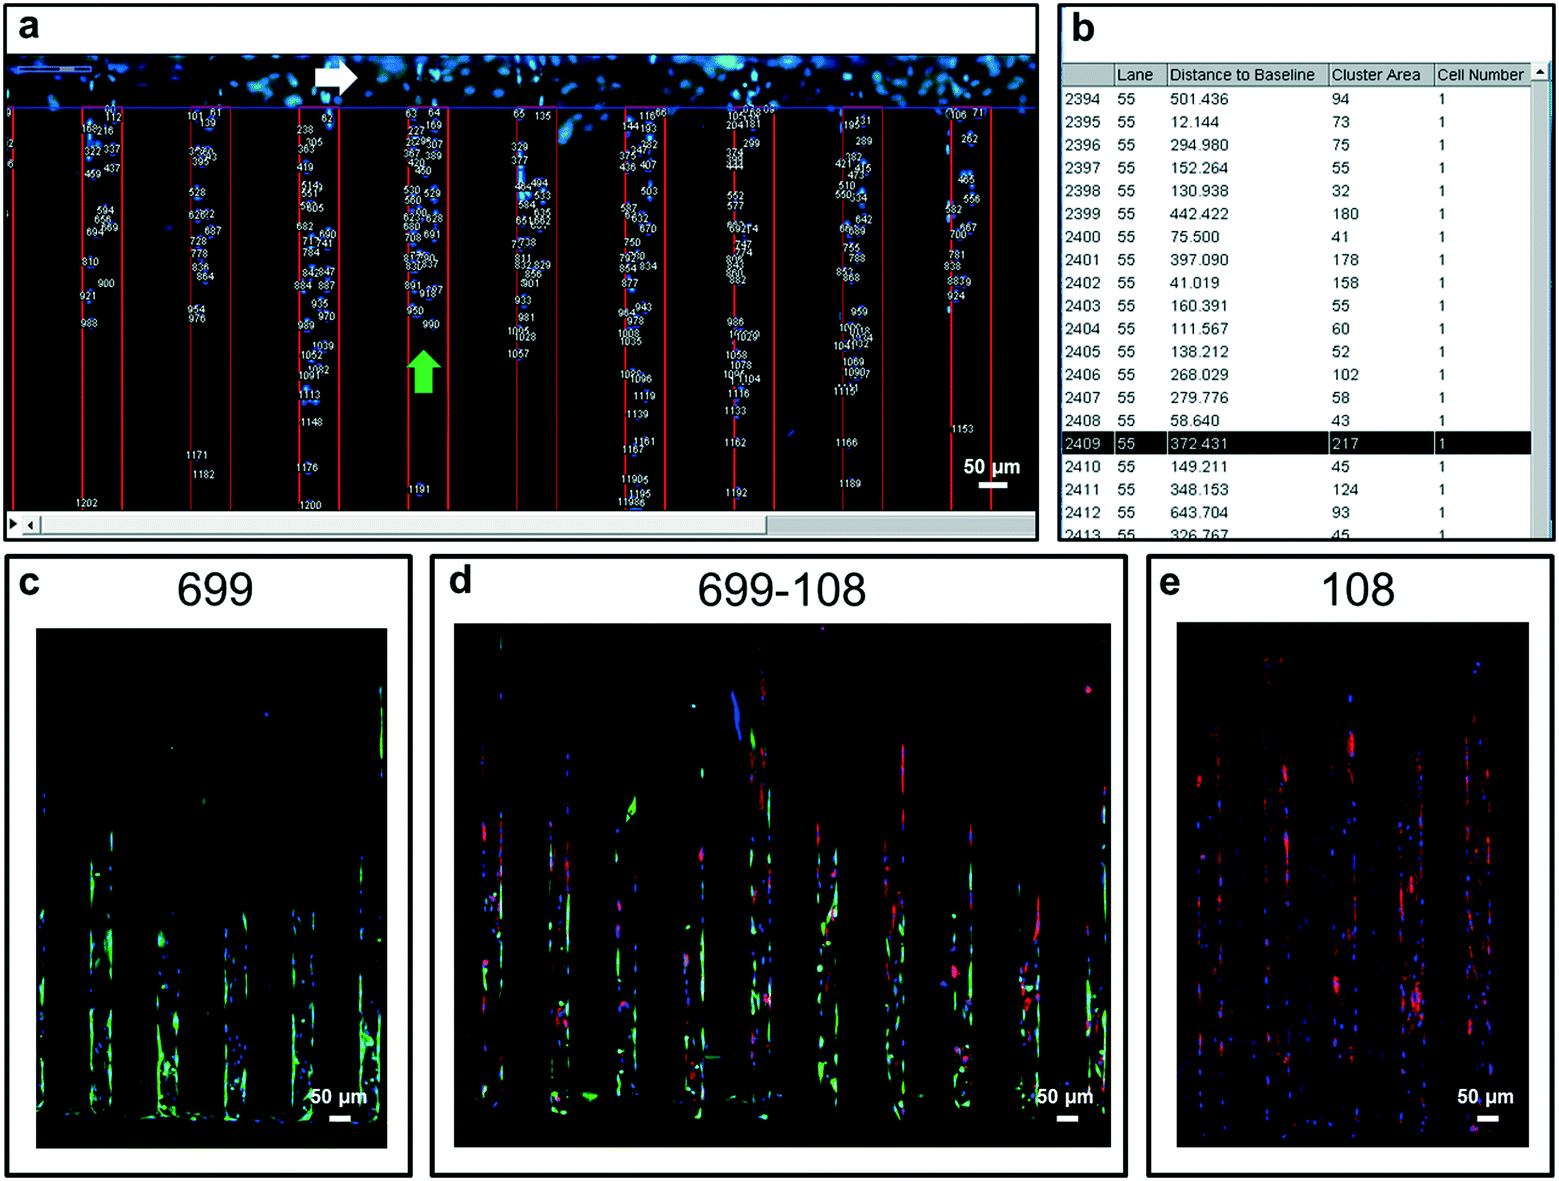 | ||
| Fig. 2 Quantification software. a) After acquiring the overlapped fluorescence microscopy images of the migration device, the software reconstructs a complete image of the device with the nucleus-stained cells. Afterward the software identifies the migration lane areas (green arrow) and the cell packing zone or beginning of the migration lanes (white arrow). The next steps are the localization of individual cell nuclei, assignment of individual cell indexes, assignment of the migration lane to which they belong and finally migrated distance quantification. b) After quantification, the software output is a raw data that corresponds to a collection of migration distance measurements (distance to baseline) assigned to each individual cell that performed migration out from the cell packing zone. Cell migration and co-culturing capabilities of the new device (c–e). c) Migrated cell sample of umbilical cord-derived mesenchymal stem cells (UC-MSCs) of donor code 699 with nuclear (blue) fluorescent staining in combination with membrane (green) fluorescent staining. d) Simultaneous migration profile of a co-cultured cell sample of UC-MSCs of donor code 699 and donor code 108 with nuclear (blue) fluorescent staining in combination with membrane (green for donor code 699 and red for donor code 108) fluorescent staining. e) Migrated cell sample of UC-MSCs of donor code 108 with nuclear (blue) fluorescent staining in combination with membrane (red) fluorescent staining. | ||
Additionally, migration experiments using this device were compatible with confocal microscopy analysis and different live cell staining assays can be applied to identify, for example, specific cell subpopulations in single or co-culturing cell migration settings, broadening the scope of possible experimental conditions and applications (Fig. 2 and S5†)
To simplify the migration data, the information can be optionally presented as descriptors of the whole population, such as the average migration distance or the number of total migrated cells. Alternatively, the quantified data can be presented as a descriptive graph of the distribution of migrated distances, such as the frequency, cumulative frequency or density distribution in different ranges of migrated distances. For instance, density distributions of migrated distances can be numerically described using fitted multiparametric functions, such as generalized gamma distribution (GGD) (Fig. S6†). These graphics and parametric information of the distribution of migrated distances throughout the device may help in understanding the effect of different stimuli, conditions or drugs on the migration performance, and the existence of different subpopulations in a heterogeneous cell sample with distinguishable migration behaviour. It is important to notice that the 3-parameter-based generalized gamma distribution (GGD) was capable of describing with good fidelity the density distribution of migrated cells in different umbilical cord derived mesenchymal stem cells (UC-MSCs) using the new device (Fig. S6†).
Factor encapsulation and delivery
The design of this new migration device considers the presence of ECM-based hydrogel walls in intimate interaction with cells during migration, and also the encapsulation of migration-stimulating factors to resemble the conditions that cells encounter during migration in the interstice of tissues under in vivo conditions.20,21Encapsulation and local delivery of factors has the advantage of being a very cost-effective strategy.22 In comparison to supplying migration factors in the cell culture medium in a 35 mm culture dish, encapsulation requires 100 times less amount of the factor.
In an attempt to understand the extent to which it is possible to control the delivery of encapsulated factors and induce cell migration in this device, hydrogels were prepared containing a concentration of 100 ng ml−1 VEGF and subjected to VEGF release assays. On measuring the cumulative release of VEGF into the medium for 5 days at 37 °C, an initial burst of VEGF release was detected at early hours of the assay, then it stabilized between 12 and 24 h. This initial release is probably derived from residual VEGF maintained in the periphery and solvent accessible porosity of the formed hydrogel, and not from encapsulated VEGF in the biomaterial (Fig. 3). Likewise, cumulative detection of non-crosslinked GelMA polymers had an initial burst that also stabilized after 24 h, demonstrating that both come from spatially solvent accessible zones (Fig. 3a). The following 92 h of cumulative VEGF measurements did not show further significant release from the hydrogel, presuming that the encapsulation does not allow free and continuous delivery of VEGF. To test if the release of the encapsulated VEGF can be controlled by degradation of the hydrogel, VEGF-encapsulating hydrogels were subjected to 24 h incubation at 37 °C in the presence of increasing concentration of collagenase type II (Fig. 3b). An increasing detection of delivered VEGF at higher concentration of collagenase was observed, which correlates with the increasing dose of hydrolysed gelatin in the medium. However, there was a peak of VEGF detection at collagenase concentration between 2.7 and 5 U ml−1, and a higher collagenase concentration generated a lower VEGF detection, possibly due to the hydrolytic effect of the collagenase on the VEGF peptide. These results confirm that the delivery of encapsulated factors can effectively be controlled by enzymatic degradation of the GelMA based scaffold. In this design, the degradation of the GelMA based scaffold will be exerted by the same cells in intimate proximity to hydrogels through the secretion of metalloproteinases for ECM remodelling and migration.
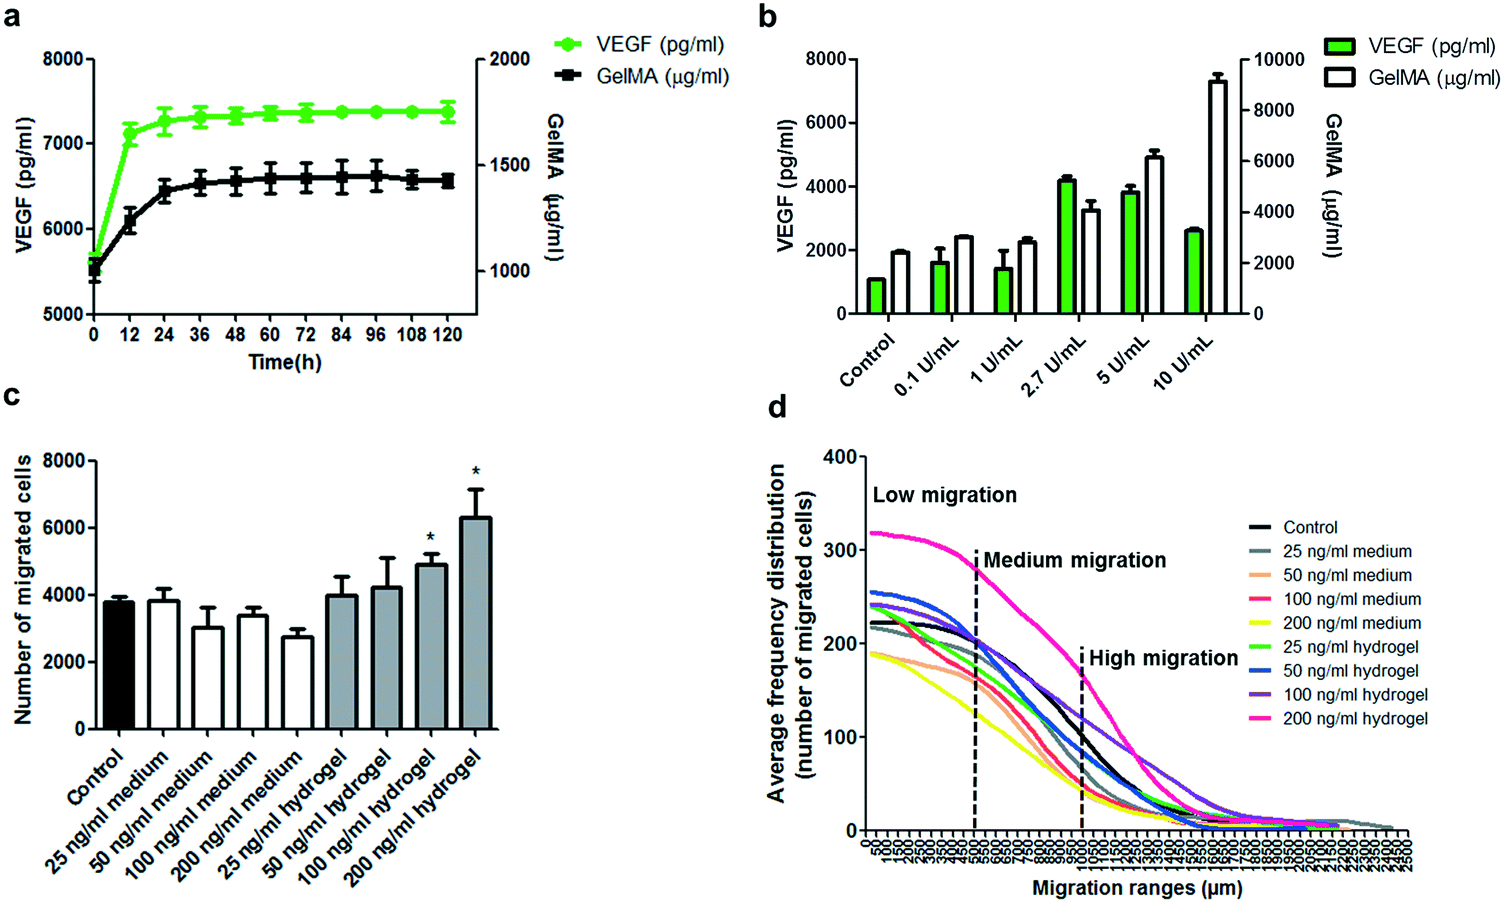 | ||
| Fig. 3 Delivery of encapsulated VEGF and migration induction derived from encapsulated VEGF. a) Quantification of VEGF and non-crosslinked GelMA released from hydrogels into the supernatant. For hydrogel fabrication, GelMA solution was supplemented with 100 ng ml−1 VEGF. Hydrogels were incubated in PBS 1× pH 7.4 and 1% BSA at 37 °C for 120 h, and VEGF and GelMA quantification performed on the collected supernatant at different time intervals. b) Quantification of VEGF and partially digested GelMA polymers released from hydrogels into the supernatant. For hydrogel fabrication, GelMA solution was supplemented with 10 ng ml−1 VEGF. Hydrogels were incubated in PBS 1× pH 7.4, 1% BSA and different concentrations of collagenase type II at 37 °C for 24 h. VEGF and GelMA quantification was performed on the collected supernatant at the end of the assay. c and d) Migration results and distribution of migrated cells of a UC-MSC population using encapsulated VEGF or soluble VEGF in the medium using the new migration device. c) Number of cells that migrated out from the cell packing zone in response to different concentrations of VEGF present in the medium or encapsulated in the hydrogel walls. d) Average frequency distribution of migrated cells in different ranges of migration in response to different concentrations of VEGF present in the medium or encapsulated in the hydrogel walls. Every point of frequency calculation corresponds to the number of cells within the 50 μm range along the migration lane. Subpopulations of low, medium and high migration are indicated, where low migration cells are located from 0 to 500 μm, medium migration from 500 to 1000 μm and high migration from 1000 μm to the location of the most distanced cell. Control = no treatment or 0 ng ml−1 of VEGF. Statistical analysis was conducted using two tailed Mann–Whitney U test, 95% of confidence was used and significance was denoted as *p ≤ 0.05. Results are presented as mean ± SEM. n = 4 independent experiments. | ||
To understand the optimal presentation of migration inducing factors in this system, comparative analyses were performed using the migration device and a UC-MSC sample. VEGF, a well-known chemotaxis factor for MSCs,23 was present either in the cell culture medium or encapsulated in the hydrogel at a concentration of 0, 25, 50, 100 and 200 ng ml−1 (Fig. 3c and d). Results show that VEGF either has no effect or inhibitory effect on migration when present in the medium, while for encapsulated factors, increasing concentration of VEGF showed incremental migration responses in the number of migrated cells and slight but not significant changes in the average migration distance (Fig. 3c and S7a†). Considering the distribution of individual cell responses in the cell sample, the percentage of cells showing higher migration levels also increases with higher concentration of encapsulated VEGF, while the opposite case is observed for VEGF in the medium (Fig. 3d and S7b†). It is not completely understood how VEGF stimulates cell migration in this device; however, these results are possibly associated with a mechanism of cell-derived degradation of the hydrogel and formation of a cell-induced local gradient of VEGF generated during migration.24–26 This is in line with the cell-induced gradient operating naturally during directed cell migration in tissues.27–29 Alternatively, the improved migration induction derived from encapsulated VEGF could be related to a slow delivery, increased life-time and the consequent persistent induction of encapsulated VEGF compared to the low stability and transitory induction of VEGF in the medium.22,30
Cell density, channel size and migration
Cell density has been considered an important factor that influences cell migration behaviour;31–35 therefore, it has to be treated carefully for experimental settings and designs, especially in Boyden chamber and scratch assays.1 In this work, the effect of the number of seeded cells on the migration results has been evaluated using UC-MSCs and results are detailed in the ESI.† These results demonstrate, in general terms, the robustness against variations in the number of seeded cells within a certain range; however, it must be considered that too much reduction (<3000) or increase (>12000) in the number of seeded cells could slightly affect the migration distribution.
In this study, an evaluation of the effect of the lane width on migration responses of cell samples was also conducted. Overall, narrower channels resulted in a reduction of the number of migrated cells, whereas overly broad lanes resulted in a reduction in the average migration distance (Fig. S9†). The optimal width, at least for the two tested cell types with different average diameters, human umbilical vessel endothelial cells (HUVEC) (∼15 μm) and UC-MSCs (∼30 μm),36,37 was 50 μm. Further analysis and discussion can be found in the ESI.†
Head-to-head comparison with available migration systems
To evaluate the level of information acquired by this device in comparison to the classical migration assays, migration experiments were performed using three donor codes of UC-MSCs in three different assays: scratch assay, Boyden chamber assay and migration assay using the new device.In scratch assays, the evaluation considers the results of collective migration from a cell-confluent zone toward a clean zone in a 2D cell culture setting (Fig. 4). Cell migration at different time points can be measured as the percentage of the original clean area covered by cells at a defined time interval, or alternatively as the number of cells found within the clean zone at a certain time interval. On the other hand, Boyden chamber assays are end-point assays that quantify the number of cells that pass through a porous membrane of 10 μm thickness. Quantification considers the cell-covered area or the number of counted cells on the bottom side of the membrane after migration and cell staining.
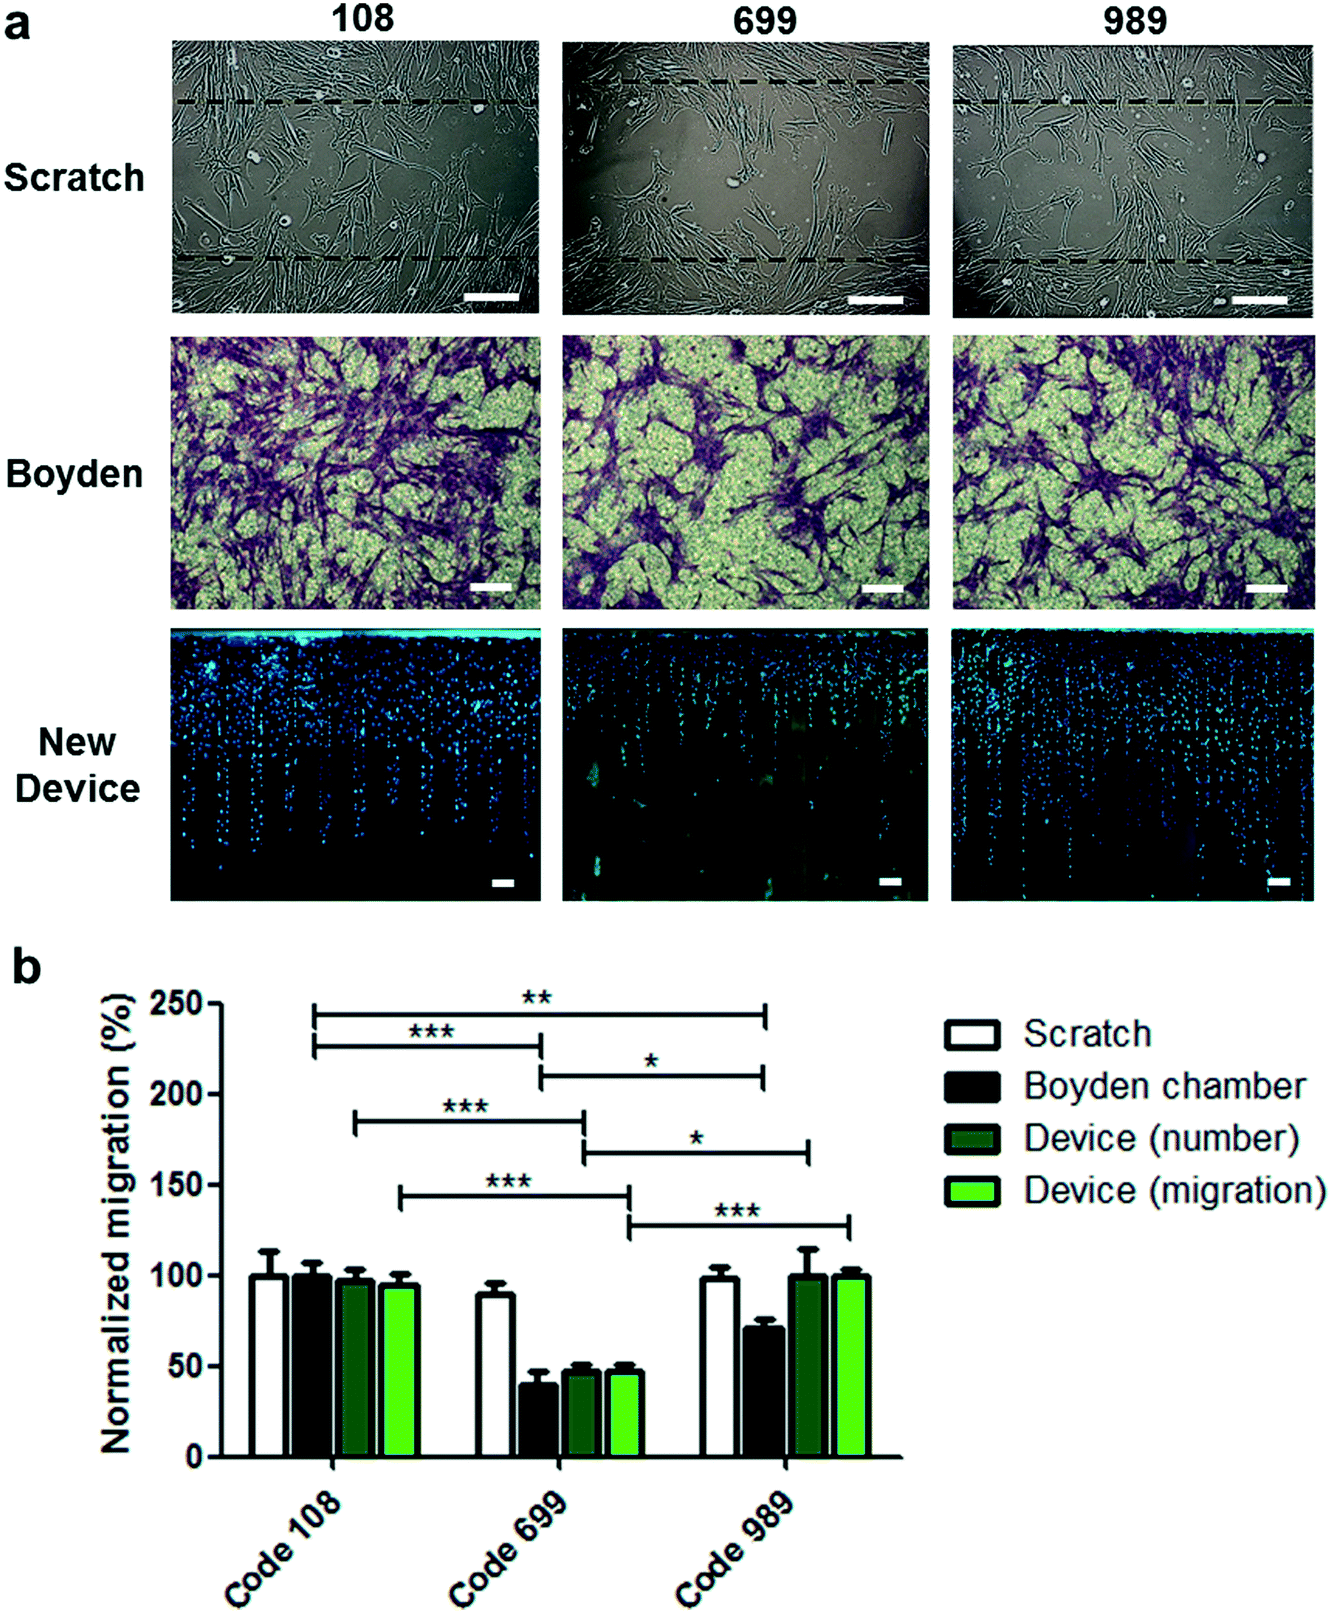 | ||
| Fig. 4 Comparative migration studies using the scratch assay, the Boyden chamber assay and the new migration device. a) Representative images of the different migration assays. b) Assays were carried out using UC-MSC samples of three different donor codes. The scratch assay was conducted in the presence of FBS 3% in the incubation medium and quantification performed using the number of counted cells in the scratch zone after 18 h of cell incubation. The Boyden chamber assay was carried out using an incubation medium supplemented with 0.1% of FBS in the upper chamber and 3% FBS in the bottom chamber. Quantification was performed calculating the percentage of the cell-covered area in the bottom face of the porous membrane after 18 h of incubation. Assays using the new device were performed in the presence of 3% FBS in the incubation medium for 18 h. Quantification was based on the number of migrated cells localized within migration lanes and out from the cell packing zone (number) or based on the average migration distance of migrated cells within migration lanes and out from the cell packing zone (migration). The min–max normalization procedure was applied to allow comparisons between different migration systems. Statistical analysis was conducted using two tailed Mann–Whitney U test, 95% of confidence was used and significance was denoted as *p ≤ 0.05, **p ≤ 0.01 and ***p ≤ 0.005. Results are presented as mean ± SEM. Scale bars: 100 μm. n = 12 independent experiments. | ||
Migration analysis in the new device can be performed either as an end-point assay at different time intervals or using a continuous recording of cells migrating within the migration lanes. As an end-point assay, migration can be easily measured and expressed as a collection of individual migrated cells with individual migration scoring per cell (Fig. 2), and represented either as an average value of migrated distances or as a frequency plot of the number of cells within different ranges of distance (Fig. S10†). Restated, it would be a representation of the migration distribution of the cell sample which provides a level of information that is much broader and capable of revealing the heterogeneous nature of cell samples.
Migration experiments using the new device loaded with 8 × 10⁵ UC-MSCs from three donor codes were performed and compared to the scratch assay and the Boyden chamber assay. Comparing the migration response among the different donor codes (Fig. 4) with the scratch assay, the new device, or the Boyden chamber assay yielded surprising results. While no differences were observed for any donor code in the scratch assay, comparing the new device and the Boyden chamber, migration responses for donor code 108 and donor code 989 showed differences in the Boyden chamber device, while the new device did not show differences when results are presented as the number of migrated cells or average migration distance (Fig. 4b). On analyzing the cell migration distribution in a frequency plot at different migrated distances in the new device, slight but not significant differences were observed for donor code 108 and donor code 989. The new device showed consistently higher frequency of migrated cells in donor code 989 at distances ranging between 1000 and 1500 μm compared to donor code 108 (Fig. S10a and b†). Notably, the opposite tendency on comparing both donor codes is observed when the migration assay was carried out in the Boyden chamber device. Therefore, it is speculated that both devices display different migratory challenges, triggering different mechanisms related to cell mobility. To unveil this possibility, different drugs exerting their effect on different cytoskeleton filaments and proteins were used to treat cells during migration assays using the Boyden chamber or the new device, but applied only in donor code 108 (Fig. S11†). As expected, microtubule dynamic disruption by vinblastine reduced substantially the migration response in the Boyden chamber and the new device. This effect is possibly derived from the microtubule involvement in the front protrusion formation, control in the dynamics of focal adhesions and cell polarization during migration.38 Additionally, migration assays were performed in the presence of blebbistatin, a myosin II inhibitor exhibiting a broader inhibitory effect on migration responses carried out in a Boyden chamber compared with the new device (Fig. S11†). The inhibitory effects in both devices can be attributed to the role of myosin II in the formation of contractile bundles for traction forces at the cell membrane leading to edge and retractile forces at the rear of the cell for body translocation.38,39 Nevertheless, myosin II inhibition has been also associated with reduction of nuclear deformability during migration through narrower passages,40,41 possibly explaining the broader inhibition effect in the Boyden chamber where the cells require nucleus deformation to be transmigrated through the porous membrane. Unlike the Boyden chamber, the new device does not pose the nuclear deformation challenge for cell displacement along the migration lanes; therefore, it showed a less inhibitory effect due to myosin II inhibition.
The actin nucleation activity of Arp2/3 has been identified to play a key role in actin-based nuclear deformation,40,41 in which its inhibition using CK-666 does exert migration reduction for cell displacement through narrow channels (narrower than the nucleus).42 Therefore, it is not surprising that migration assay comparisons using the new device and the Boyden chamber in the presence of CK-666 showed a migration inhibitory effect only in the Boyden device (Fig. S11†), demonstrating that both devices during the assay evoke some different migratory challenges and mechanisms, at least in this specific type of cell. While the new migration device is specialized in quantifying non-confined 3D cell displacement, the Boyden chamber quantifies nucleus confined transmigration, arguing that both devices are complementary in assessing the migration activity of a cell population.
Comparative resolution between the new device and the Boyden chamber
Resolution, defined as the capacity to distinguish between two groups of cells with a close level of migration response, was evaluated for the Boyden chamber and the new device.Under similar migration-inducing conditions (the presence of 3% (v/v) FBS), assays were performed in the different systems using the same cell sample and different concentrations of the migration inhibitor vinblastine. The different migration results evaluated at increasing concentration of vinblastine (0.1–4 nM) showed that the Boyden chamber was only capable of distinguishing a significant reduction compared to the control condition at concentrations higher than 0.75 nM (Fig. S12†). On the other hand, considering the average migration distance, the microfluidic-based device was capable of distinguishing differences starting from 0.5 nM. However, if the distribution of individual distances of migrated cells is taken into account, the new device is potent enough to distinguish significant differences at the starting concentration of 0.2 nM vinblastine (Fig. S12c and d†). Based on the higher level of migration information provided by the detailed description of the migration frequency distribution along the migration lanes, the new device presents a higher resolution capable of distinguishing between cells samples with slightly different migration levels.
Functional correlation study using multiparametric data extracted from cell migration distribution
This data demonstrates the capacity of easily evaluating the migration response of a cell population by single-cell migration measurements utilizing a new device capable of handling heterogeneous cell samples. One important need in the cell therapy field is the standardization and quality control of therapies, cell products and manufacturing of cell products.43,44 Migration has been previously proposed as an important cell function in the mechanism of action of different cell therapy-based treatments,45,46 and it has been proposed as a potency test.47 Since cell migration is a complex cellular function that comprises a myriad of biological functions within the cells and in the interaction with their environment, its evaluation through quick testing could be an excellent approach to control the fitness level and therapeutic quality of cell dose along the different steps of manufacturing and cell delivery to the patient. As a proof of concept, this study proposed to correlate measurable parameters of migration responses of different donated UC-MSCs with important therapeutic functions of MSCs, such as immunosuppression.48 It is our observation that the detailed migration profiling of cell populations should allow for the extraction of a higher number of descriptive parameters yielding a better correlation model to achieve, with a higher level of accuracy, the ability to predict certain cell functionality or therapeutic quality.The Boyden chamber assay is limited to an end-point value of transmigration through a thin porous membrane, represented as the percentage area of the membrane covered by migrated cells. This single data can only produce a one parameter-based linear regression for correlation studies. After exploring the migration activity of different donated UC-MSCs by the Boyden chamber (Fig. 5a), and the suppression activity of those UC-MSCs (Fig. 5d and S13a†), a linear regression model was constructed using the migration response showing no significant correlation with immunosuppression (Fig. 5e and S15a,†P < 0.1, R2 = 0.41). A negative correlation was observed between the migration response and the immunosuppressive activity. This value indicates that the linear regression is relatively poor as a predictive model of immunosuppression activity based on cell migration measurements. As for the new migration device, besides using the number of migrated cells (Fig. 5b) and the average cell migrated distance (Fig. S14a†), the parameters that define the functions of continuous probability distributions of migrated distances (Fig. 5c, S6 and Table S1†), GGD, were used to construct a linear regression model correlation. To do as described, each experimental distribution of migrated distances within the migration lanes was used to generate fitted multi-parametric GGD functions with adjusted coefficients of parameters (s, m and f as defined in the function “dggamma” implemented in the package “rmutil” in the software R). This probability distribution function, GGD, provides additional parameters to construct an accurate linear regression model using various independent migration-derived variables to predict immunosuppressive activity.
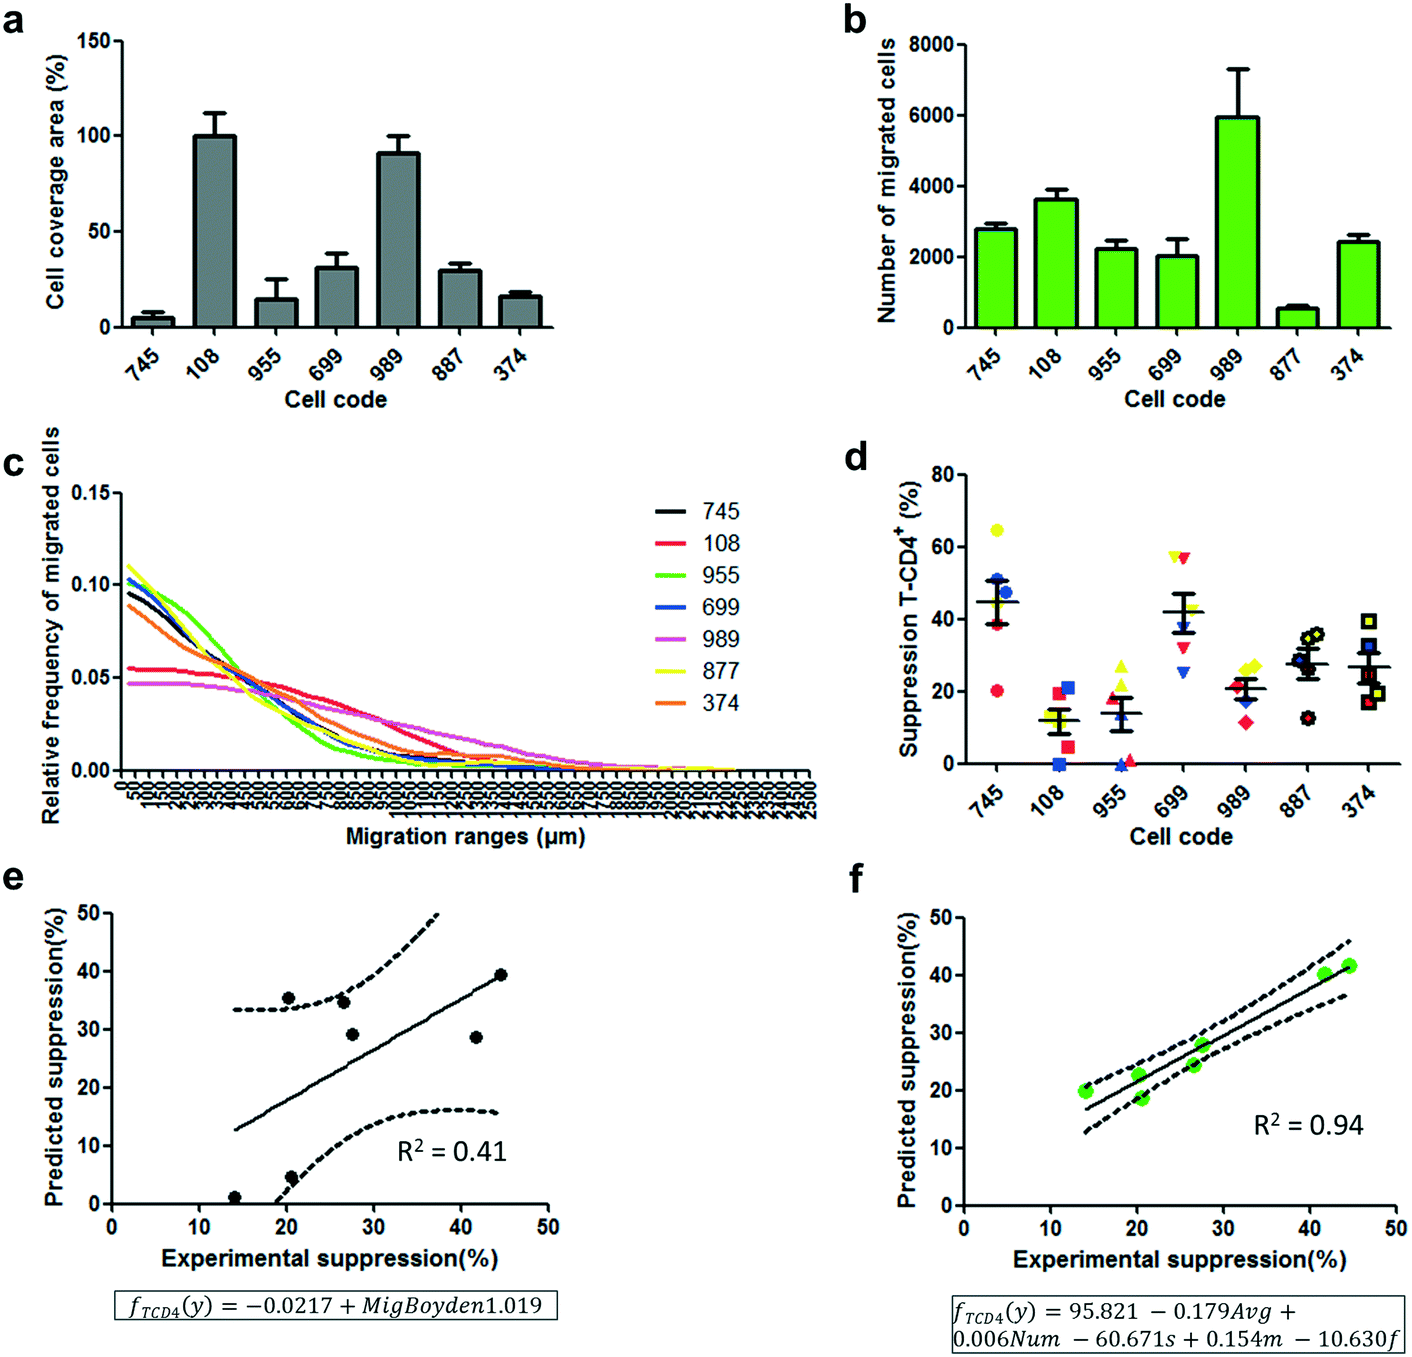 | ||
| Fig. 5 Correlation of predicted immunosuppressive values and experimental immunosuppression values. a) Boyden chamber assay using different donor codes of UC-MSCs. The assay was carried out using an incubation medium supplemented with 0.1% FBS in the upper chamber and 3% FBS in the bottom chamber. Quantification was performed calculating the percentage of the cell-covered area in the bottom face of the porous membrane after 18 h of incubation. b) Migration assay using the new device and different donor codes of UC-MSCs. Quantification was performed by calculating the number of cells that migrated out from the cell packing zone. c) Average relative frequency distribution of migrated cells at different ranges of migration in the new migration device. Every point of frequency calculation corresponds to the relative number of cells within the 50 μm range along the migration lane. d) Immunosuppression of T-CD4+ in 3 different peripheral blood mononuclear cell samples (red, blue and yellow) treated with PHA for proliferation activation in the presence of UC-MSCs from different donor codes. The UC-MSC:PBMC ratio during proliferation incubation was 1:50. e and f) Correlation of predicted immunosuppressive values and experimental immunosuppression values. e) Predicted immunosuppression values were extracted based on a linear regression (framed model) constructed using migration responses in the Boyden chamber system and experimental immunosuppressive values of different UC-MSC code donors. f) Predicted immunosuppression values were extracted based on a multiparametric elastic-net regression (framed model) constructed using 5 different parameters from the migration responses in the new migration device and experimental immunosuppressive values of different UC-MSC code donors. Immunosuppression was calculated based on the proliferative suppression of CD4+ cells. The same correlation graphs were fabricated using immunosuppressive values on the CD8+ cell population (Fig. S15†). Results are presented as mean ± SEM and n = 6 independent experiments, except for results in (d), in which results are presented as mean ± SEM. n = 3 biological replicates (PBMCs) with 2 experimental replicates. | ||
Fitted GGDs were especially efficient in describing the migration behaviour of the different UC-MSC samples in the new device, in which fitted GGDs resemble appropriately the frequency distribution curves (Fig. S6†). The number of migrated cells, the average migrated distance and the three parameters obtained from the GGD, s, m and f (Table S1†), were first tested for multi-collinearity using the R software to check for appropriateness as independent variables for regression models. Afterward, and using the same software, an elastic-net regularization method49 was conducted to select the adequate independent variables and to obtain a multiple linear regression model that correlates significantly with the immunosuppression activity of UC-MSC donor codes (Fig. 5f and S15b,†P < 0.005, R2 = 0.94). The multi-variable regression model was more accurate than the model obtained with the information given by the Boyden chamber system. A certain subset of cells with a particular migration response in the heterogeneous population, which are possibly more relevant in the immunosuppressive activity of the sample, can be reflected in the distribution of migrated cells throughout the device. Therefore, their effect in the distribution will be numerically revealed by the coefficient values of parameters incorporated in the multiparametric GGD function (Table S1†). This information would have been masked if only the total number of migrated cells, as provided by the Boyden chamber, or the average migration distance was used as input information. In other words, the highly descriptive migration response of cell populations in the new device makes the extraction of more information and better correlation with other cell functions or therapeutic quality possible.
Conclusions
As cell migration is considered essential in many physiological phenomena and plays an important role in many different diseases or in the strategy of treatment, a growing need for robust, easy-to-use and versatile migration assays exists. The device is designed with the objective of generating an affordable and scalable system with many potential uses for studying cell migration.The fabrication of the device is based on a gelatin hydrogel, considered a natural ECM, allowing the encapsulation of soluble factors capable of inducing directed migration more efficiently in comparison with soluble factors.27 Fabrication of microdevices and microfluidics systems using gelatin or other ECM-based polymers is highly desirable in the field, since the cell microenvironment can be resembled with higher fidelity for lab-on-chip or organ-on-a-chip applications.50 However, these developments have been significantly limited by the swelling characteristic of the hydrogel. In this work, important strategies for fabrication of ECM-based microdevices are presented.
Multiplicity of assays and easy assessment of migrated cells can be achieved following a brief centrifugation, facilitating the cell alignment within the migration lanes. Therefore, simple distance quantification is required at the end of the assay or at different intervals for migration data acquisition, which is quickly performed by the ImageJ plugin that was customized for this application. This enhances the migration assay potential by bringing the analysis to a single-cell level, a tool highly coveted for the study of heterogeneous cell populations.
This study presents a device for migration assays with superior precision and resolution outmatching the scratch assay and the Boyden chamber assay. This operator-friendly device potentially facilitates the study of cell migration due to its versatility, higher resolution and accelerated directed cell migration without the need for profound expertise in microfluidics. The main characteristics are obtained after the adaptation of different elements in the design, including the series of open parallel migration lanes, fabricated with a non-swelling gelatin-based hydrogel and with the option of encapsulating migration factors. Additionally, the presence of a cell-loading wall facilitates greatly the cell seeding process and the alignment of cells at the starting lanes by a simple centrifugation step. These features all together contribute to an easier and more rapid migration assessment through measuring the distance between the initial and the migration endpoint, avoiding the need for continuous recording using specialized software for cell tracking. Our design configures a system capable of reassembling many of the physicochemical cues part of the physiological migration process, conferring more detailed and accurate information with respect to the migration profile. The proof-of-concept data generated from the migration of UC-MSCs, and the correlation with respect to the fundamental therapeutic activities of UC-MSCs are valuable according to the guidance provided by regulatory agencies for clinical-scale expansion in cell-based therapy settings.51 Indeed, these guidelines emphasize the need to develop assays that could provide a direct way of measuring complex cell activity, unlike a surrogate assay based on single molecule detection or miRNA fingerprint. It is also of important scientific interest to decipher the mechanism correlating the migration with the immunosuppressive properties, offering a robust predictive tool for clinical outcome in the frame of a cell-based therapy.
Materials and methods
GelMA synthesis and preparation of a GelMA solution for micro-injection
The photo-crosslinkable methacryloyl bovine gelatin (GelMA) was synthetized as previously described.8,52 Briefly, bovine gelatin (Bloom 220, Sigma, Netherlands) was dissolved to a final concentration of 10% (w/v) in PBS 1× (pH 7.4) at 60 °C under continuous stirring. After complete dissolution, methacrylic anhydride (276685, Sigma, USA) was added dropwise until reaching a final concentration of 8% (v/v) and maintained under constant stirring at 60 °C for 3 h. After the functionalization reaction with methacrylic anhydride, dilution with 3 volumes of PBS 1× and dialysis in dH2O for 7 days (molecular weight cut-off of 12 kDa and dH2O change twice a day) were performed. Afterward, the dialyzed solution was freeze-dried and kept at −20 °C for later use.To obtain the pre-polymerized solution that will generate the hydrogel walls, a 10% (w/v) solution of the previously freeze-dried GelMA was prepared in PBS 1× (pH 7.4) after continuous stirring at 60 °C until complete dissolution. Afterward, the GelMA solution, while still warm, was passed through a 5 μm syringe filter and a 0.45 μm syringe for filtration. The filtered solution was concentrated by ultracentrifugation using a 30 kDa cutoff membrane (Amicon® Ultra-15 Centrifugal Filter Unit, UFC9030, Millipore, USA) until the GelMA solution reached a concentration of 20–25% (w/v), determined by dry weighting. Using the concentrated solution, previously enriched in functionalized gelatin polymers larger than 30 kDA, a 10% (w/v) GelMA solution, supplemented with 0.5% (w/v) of the photo-initiator, 2-hydroxy-4′-(2-hydroxyethoxy)-2-methylpropiophenone (410896, Sigma, USA), was prepared in PBS 1× (pH 7.4). This GelMA solution was used later for device fabrication.
Device fabrication
Device fabrication was conducted utilizing a PDMS-based microfluidic system featuring parallel straight channels of 1 mm in length connected by individual input channels (Fig. S1c†). The PDMS mould harbouring the connected parallel channels was fabricated using soft photolithography.53 Briefly, a 50 μm thick negative SU-8 based mould of the connected channels was patterned on a 4-inch silicon wafer using photolithography. Afterward, uncured PDMS polymer (SYLGARD™ 184 Silicone Elastomer kit, #1673998, Dow, US) was obtained after mixing the prepolymer solution and the curing agent (10:1, respectively) and poured over the patterned silicon wafer. Subsequently, the silicon wafer with 5 mm thick uncured PDMS was degassed in a vacuum chamber and backed for 3 h at 80 °C. After detaching the cured PDMS mould from the silicon wafer, the individual inlet channel was accessed through a cut perpendicular to the inlet channel using a razor blade, and all channel outlets were generated through a single cut of the PDMS at the end of the channels and perpendicular to the parallel channels. For GelMA-based microfabrication of the migration device, the PDMS mould was bound to the bottom surface of a 35 mm cell culture dish (#353001, Falcon®, Corning Life Sciences, US) after a short-time (3 s) plasma treatment of the dish and PDMS surface using a plasma cleaner (PDC-002, Harrick Plasma, USA). Immediately after PDMS bounding, the channels were filled with the GelMA solution (see the previous subsection) through the inlet channels using capillary-based inflow. After completion of channel filling, avoiding the outflow of the GelMA solution through the outlets, the channels were irradiated for 2 min with UV light at 365 nm (1.21 W cm−2) using a lamp (OmniCure® S2000, Excelitas Technologies, USA) with the light guide at a 2 cm distance from the culture dish at the PDMS bounded side. Subsequently, an excess of FotoTec® SLA (#7100, Dreve, Germany) was poured outside and around the end of the PDMS mould in contact with the channel outlet. FotoTec® SLA was then irradiated for 5 s with UV light using similar previous conditions. Afterward, the PDMS mould was detached carefully leaving a pattern of GelMA-based hydrogels bounded to the bottom surface of the cell culture dish. A thick wall of FotoTec® SLA was also formed, and in continuous contact with the end of the long parallel hydrogel walls. The surface of migration lanes was physically defined by two parallel long hydrogels and the polystyrene bottom of the cell culture dish (Fig. S1d†). Finally, the migration device was incubated with 2 mL of dH2O at room temperature for 1 h as a washing step. Optionally, the new migration device can be treated with two washing steps with 2 mL of absolute ethanol (#107017, Merck, Germany), one for 15 min and the second overnight, followed by a 1 h washing step with 2 mL of dH2O, all inside the biosafety cabinet at room temperature. For short-term storage (1 week), the devices were maintained in storage buffer (PBS 1× pH 7.4 supplemented with 100 U ml−1 penicillin and 100 μg ml−1 streptomycin (#15140148, ThermoFisher Scientific, USA)) at 4 °C until use. For long-term storage (6 months), the devices were dehydrated overnight inside the biosafety cabinet at room temperature, sealed under vacuum and stored at 4 °C. Before use, the devices were rehydrated with PBS 1× pH 7.4 at room temperature for 30 min.
Cell culturing and characterization
HUV-EC-C [HUVEC] (ATCC® CRL1730™) cells and umbilical cord-derived mesenchymal stem cells (UC-MSCs) were cultured in high glucose Dulbecco's modified eagle medium (DMEM) (#10313, Gibco, USA) supplemented with 2 mM glutamine (#25030-081, Gibco, USA), 10% fetal bovine serum (FBS) (#16000-044, Gibco, USA) and 1% penicillin–streptomycin (#15140-122, Gibco, USA) using standard T-flasks (Falcon®, Becton Dickinson, United States). Cell culturing was conducted in a cell incubator at 37 °C, 5% CO2, and 96% humidity. Medium change was performed every 2 days. The cells before experiments and storage were regularly subjected to mycoplasma testing (MycoAlertTM Mycoplasma Detection kit, Lonza) following the provider's instructions. UC-MSCs were obtained from donated umbilical cords as described before54 with written informed consent and protocols were approved by the Ethics Committee of the University of the Andes, Chile, and participant health centres (Clínica Santa María, Clínica Dávila and Clínica Universidad de los Andes), both following the international Helsinki Declaration, Nuremberg code and national law No. 20.120. Donated UC-MSCs, donor codes 108, 374, and 745, were previously characterized54,55 in our laboratory according to the International Society for Cellular Therapy Guidelines (ISSCT).56 UC-MSC donor codes 955, 699, 989 and 887 were also characterized immunophenotypically according to the guidelines of the ISSCT (data not shown).Protocol of use of the new migration device
After carefully removing the storage buffer or rehydrating with PBS 1×, 8000 cells resuspended in 40 μL of culture medium (see the previous subsection) were carefully deposited across the beginning of the migration lanes near the cell loading wall (FotoTec® SLA-based wall). The migration device was later placed in a centrifuge adaptor that allows the application of centrifugal force at an angle of 45° with respect to the bottom surface of the culture dish. Centrifugation was conducted using a swing-bucket rotor at 350×g for 5 min, resulting in an accumulation and location of seeded cells at the beginning of the migration lanes and packing against the cell loading wall (Fig. 2b). Afterward, the centrifuge adaptor with the loaded migration device was carefully removed from the centrifuge and placed in the cell incubator for 1–3 h to allow cell attachment. Before the small amount of seeding culture medium dries out, 2 ml of migration medium (e.g. DMEM supplemented with 2 mM glutamine, 3% fetal bovine serum and 1% penicillin–streptomycin) was added carefully avoiding cell resuspension. At this point, successive overlapping phase-contrast microscopy images at 10× of magnification were taken to produce a full picture of the migration device with the cells at the starting location before the migration assay. The migration device was afterward incubated for 18 h in the cell incubator to conduct the migration assay and achieve cell mobilization along the migration lanes. After the migration assay, cells were subjected to nuclear staining using a pre-wash of 15 min in PBS 1× pH 7.4, followed by incubation for 1 h in Hoechst reagent (Hoechst 33342, #H3570, Invitrogen, USA) diluted in PBS 1× (pH 7.4) (1:1000). After the staining incubation, successive overlapping fluorescence microscopy images at 10× of magnification were taken to reproduce a full picture of the migration device with the cells localized at the new migrated position. Pictures were automatically processed by an in-house developed plugin running in the “Fiji” version of ImageJ.19 Briefly, this plugin stitches the individual fluorescence microscopy pictures to generate the complete device, in which individual cells are localized by blue fluorescence. Afterward, the program measures the distance of each individual cell from the cell packaging zone or beginning of migration lanes. The results are given in the form of a data matrix containing a cell identifier, migrated distance (μm), migration lane identifier and area value of the stained nucleus. If the identified stained nucleus has an area larger than twice the average area of an individual nucleus in the cell sample, the number of cells assigned to that nucleus area is the integer of the ratio nucleus area/average area.
Scratch assay
Cells from different US-MSC codes were seeded (2 × 10⁴ cells per well) in a 24-well tissue culture plate and cultured in DMEM (supplemented with 10% FBS as above mentioned) for 24 h or until reaching a 70–80% monolayer confluency. The surface was then scratched horizontally with a 200 μL pipette tip across the centre of the well, keeping the tip perpendicular to the bottom. The scratched cells were removed by two consecutives washes in 2 mL of PBS 1×, and the assay performed in culture medium (DMEM) supplemented with 3% FBS instead of 10%. Afterward, phase-contrast microscopy images at 10× of magnification were taken across the wound in the culture plate and labelled as time 0 (T0). After this, the cells were incubated at 37 °C for 18 h, the medium was discarded and then the cells were washed 2 times with PBS 1×. Subsequently, microscopy images at 10× were taken and labelled as T18. Comparative area analysis between T0 and T18 was made using “ImageJ”, where the scratch area was defined by images on T0, whereas the number of migrated cells or scratch area covered by cells was quantified using the images on T18.Boyden chamber assay
Using a 24 multi-well Boyden chamber system (Transwell®, Corning, USA), 100 μl of a 1% (w/v) porcine gelatin solution (#G2500, Sigma-Aldrich) was added onto the porous membrane surface of the culture insert (8 μm pore size) and incubated for 3 h at 37 °C. The inserts were subsequently subjected to two washing steps of PBS 1× for 15 min at 37 °C. Afterward, the inserts (or upper chamber) were inoculated with 2 × 10⁴ UC-MCSs in 100 μl of high glucose Dulbecco's modified eagle medium (DMEM) supplemented with 2 mM glutamine and 1% penicillin–streptomycin, and the bottom chamber with 600 μl of DMEM supplemented with 2 mM glutamine, 3% fetal bovine serum (#16000-044, Gibco, USA) and 1% penicillin–streptomycin. Cultures were maintained in an incubator at 37 °C and 96% humidity with a 5% CO2 enriched air atmosphere for 18 h before analysis. To quantify cell migration, non-migrating cells in the upper side of the porous membrane were carefully removed by scrapping with a cotton swap. Migrated cells at the bottom side of the membrane were visualized and counted using Crystal Violette staining57 and inversed microscopy (BX53, Olympus, Japan).Immune suppression assay
To test the immunosuppressive potential of UC-MSCs, peripheral blood mononuclear cells (PBMCs) were isolated from fresh blood samples donated by healthy donors, with Ficoll-Paque Plus density gradient (GE Healthcare, USA). Isolated PBMCs were stained with CellTrace Violet (CTV) (Life-Technology, Thermo Fisher, USA) and cultured in mixed lymphocyte reaction (MLR) medium for 4 days, containing 10% fetal bovine serum, 1% pen/strep, 1% sodium pyruvate, 1% non-essential amino acids, 1% glutamine and 25 μM β-mercaptoethanol (Gibco, Thermo Fisher, USA), in Iscove's modified Dulbecco's medium (IMDM) (Gibco, Thermo Fisher, USA). Lymphocytes were stimulated with 5 μg ml−1 phytohaemagglutinin-L (PHA; Sigma-Aldrich, Merck, Germany) and cocultured with or without UC-MSCs at a ratio of 1 to 50. After 4 days of incubation, PBMCs were stained by incubating for 20 min at 4 °C with anti-human antibodies against CD4 and CD8. Proliferation of CD4+ and CD8+ was quantified by measuring the corresponding decrease in CTV fluorescence of the double labelled PBMCs (CD4+-CTV or CD8+-CTV). Data acquisition was performed on a FACSCanto IITM using the FACS Diva software (Becton Dickinson, CA, USA) and data analysis using FlowJo software (Tree Star, Canton, OH). All the procedures presented were approved by the Ethics Committee of Universidad de los Andes, and human blood samples were collected after written informed consent following institutional guidelines and approved by the same committee following the international Helsinki Declaration, Nuremberg code and national law No. 20.120.Generalized gamma distribution and elastic-net regression
Using the R software, a multi-parametric generalized gamma distribution (“dggamma” gamma function in R software) as a density function (GGD) was obtained after performing maximum-likelihood GGD parameter fitting (“fitdistr” in R software) to the experimental cell density distribution at different distances within migration lanes in the new device (Fig. S6†). GGD parameters were obtained for each individual experimental quadruplicate and average values of each parameter determined (Table S1†).To construct a multi-parametric regression model capable of predicting immunosuppressive response based on cell population migration behaviour, the three parameters obtained from GGD (s, m and f), the number of migrated cells and the average migrated distance were considered as independent variables, whereas average immunosuppressive results as response variables. Using the R software, multicollinearity amongst independent variables was tested, making sure Pearson correlations were lower than 0.7 and variable inflation factors (“vif” function) were lower than 10. With these criteria, the 5 parameters were selected and used to fabricate the linear model. In order to treat any possible negative impact of possible multicollinearities of selected variables on the predictability of the linear model (e.g. overfitting), the elastic net regularization technique was conducted (“glmnet” method in R software) to select variables and construct the multiple linear regression model.
Resultant multi-parametric models included all proposed parameters, except for parameter “f” of the GGD distribution in the case of prediction of immunosuppression of the cell population CD8+, and all parameters for prediction of immunosuppression of cell population CD4+. Multiple linear regression models showed a p value lower than 0.05.
Conflicts of interest
Maroun Khoury is the CSO of Cells for Cells and Regenero and Enrique Ros, Matías Encina, Fabián González and Juan Pablo Acevedo received stipends from Cells for Cells. The other authors declare no competing interests.Acknowledgements
We want to thank all the researchers in the Cells for Cells and Regenero for insightful discussions and suggestions. Additionally, the authors thank Diego Castro for assisting in and discussing migration data analysis. We acknowledge financial support from CORFO for the grant 13IDL2-18745 and the Ministry of Education of Chile for the PMI program grant UAN1301.References
- C.-C. Liang, A. Y. Park and J.-L. Guan, In vitro scratch assay: a convenient and inexpensive method for analysis of cell migration in vitro, Nat. Protoc., 2007, 2(2), 329–333, DOI:10.1038/nprot.2007.30 , [Accessed: 8th October 2016].
- S. Boyden, The chemotactic effect of mixtures of antibody and antigen on polymorphonuclear leucocytes, J. Exp. Med., 1962, 115, 453–466 CrossRef CAS PubMed , Available from: http://www.ncbi.nlm.nih.gov/pubmed/13872176 [Accessed: 8th October 2016].
- A. Albini and R. Benelli, The chemoinvasion assay: a method to assess tumor and endothelial cell invasion and its modulation, Nat. Protoc., 2007, 2(3), 504–511, DOI:10.1038/nprot.2006.466 , [Accessed: 8th October 2016].
- C. Zhang, S. Jang, O. C. Amadi, K. Shimizu, R. T. Lee and R. N. Mitchell, et al., A sensitive chemotaxis assay using a novel microfluidic device, BioMed Res. Int., 2013, 2013, 373569, DOI:10.1155/2013/373569 , [Accessed: 8th October 2016].
- A. Malki, J. Fiedler, K. Fricke, I. Ballweg, M. W. Pfaffl and D. Krautwurst, Class I odorant receptors, TAS1R and TAS2R taste receptors, are markers for subpopulations of circulating leukocytes, J. Leukocyte Biol., 2015, 97(3), 533–545, DOI:10.1189/jlb.2A0714-331RR , [Accessed: 8th October 2016].
- P. Lee, C. S. Y. Chen, T. Gaige and P. J. Hung, Automated live cell imaging of cell migration across a microfluidic-controlled chemoattractant gradient, Nat. Methods, 2015, 12(11), vii–viii, DOI:10.1038/nmeth.f.387.
- J. Comley, Cell Migration: probing cell movement with smarter tools, HTStec Limited, Available from: https://www.ddw-online.com/enabling-technologies/p205976-cell-migration:probing-cell-movement-with-smarter-tools-winter-12.html [Accessed: 22nd November 2017] Search PubMed.
- J. W. Nichol, S. T. Koshy, H. Bae, C. M. Hwang, S. Yamanlar and A. Khademhosseini, Cell-laden microengineered gelatin methacrylate hydrogels, Biomaterials, 2010, 31(21), 5536–5544, DOI:10.1016/j.biomaterials.2010.03.064 , [Accessed: 21st February 2015].
- A. D. Doyle, F. W. Wang, K. Matsumoto and K. M. Yamada, One-dimensional topography underlies three-dimensional fibrillar cell migration, J. Cell Biol., 2009, 184(4), 481–490, DOI:10.1083/jcb.200810041 , [Accessed: 8th October 2016].
- Z. Tong, E. M. Balzer, M. R. Dallas, W.-C. Hung, K. J. Stebe and K. Konstantopoulos, Chemotaxis of Cell Populations through Confined Spaces at Single-Cell Resolution, PLoS One, 2012, 7(1), e29211, DOI:10.1371/journal.pone.0029211 , [Accessed: 8th October 2016].
- D. Irimia and M. Toner, Spontaneous migration of cancer cells under conditions of mechanical confinement, Integr. Biol., 2009, 1(8–9), 506–512, 10.1039/b908595e , [Accessed: 8th October 2016].
- L. Guo, R. H. Colby, C. P. Lusignan and T. H. Whitesides, Kinetics of Triple Helix Formation in Semidilute Gelatin Solutions, Macromolecules, 2003, 36(26), 9999–10008, DOI:10.1021/MA034264S.
- D. Loessner, C. Meinert, E. Kaemmerer, L. C. Martine, K. Yue and P. A. Levett, et al. Functionalization, preparation and use of cell-laden gelatin methacryloyl–based hydrogels as modular tissue culture platforms, Nat. Protoc., 2016, 11(4), 727–746, DOI:10.1038/nprot.2016.037 , [Accessed: 17th May 2018].
- D. Dendukuri, P. Panda, R. Haghgooie, J. M. Kim, T. A. Hatton and P. S. Doyle, Modeling of Oxygen-Inhibited Free Radical Photopolymerization in a PDMS Microfluidic Device, Macromolecules, 2008, 41(22), 8547–8556, DOI:10.1021/ma801219w , [Accessed: 26th November 2019].
- K. Wolf, I. Mazo, H. Leung, K. Engelke, U. H. von Andrian and E. I. Deryugina, et al. Compensation mechanism in tumor cell migration, J. Cell Biol., 2003, 160(2), 267–277, DOI:10.1083/jcb.200209006 , [Accessed: 27th November 2018].
- S. Matias-Roman, B. G. Gálvez, L. Genís, M. Yáñez-Mó, G. de la Rosa and P. Sánchez-Mateos, et al. Membrane type 1-matrix metalloproteinase is involved in migration of human monocytes and is regulated through their interaction with fibronectin or endothelium, Blood, 2005, 105(10), 3956–3964, DOI:10.1182/blood-2004-06-2382 , [Accessed: 27th November 2018].
- C. Lu, X.-Y. Li, Y. Hu, R. G. Rowe and S. J. Weiss, MT1-MMP controls human mesenchymal stem cell trafficking and differentiation, Blood, 2010, 115(2), 221–229, DOI:10.1182/blood-2009-06-228494 , [Accessed: 27th November 2018].
- E.-M. Schnaeker, R. Ossig, T. Ludwig, R. Dreier, H. Oberleithner and M. Wilhelmi, et al. Microtubule-Dependent Matrix Metalloproteinase-2/Matrix Metalloproteinase-9 Exocytosis, Cancer Res., 2004, 64(24), 8924–8931, DOI:10.1158/0008-5472.CAN-04-0324 , [Accessed: 28th November 2018].
- J. Schindelin, I. Arganda-Carreras, E. Frise, V. Kaynig, M. Longair and T. Pietzsch, et al. Fiji: an open-source platform for biological-image analysis, Nat. Methods, 2012, 9(7), 676–682, DOI:10.1038/nmeth.2019 , [Accessed: 29th March 2019].
- E. Donà, J. D. Barry, G. Valentin, C. Quirin, A. Khmelinskii and A. Kunze, et al. Directional tissue migration through a self-generated chemokine gradient, Nature, 2013, 503(7475), 285–289, DOI:10.1038/nature12635 , [Accessed: 27th March 2019].
- J. C. Stendahl, D. B. Kaufman and S. I. Stupp, Extracellular matrix in pancreatic islets: relevance to scaffold design and transplantation, Cell Transplant., 2009, 18(1), 1–12 Search PubMed , Available from: http://www.ncbi.nlm.nih.gov/pubmed/19476204 [Accessed: 2nd April 2019].
- Z. Wang, Z. Wang, W. W. Lu, W. Zhen, D. Yang and S. Peng, Novel biomaterial strategies for controlled growth factor delivery for biomedical applications, NPG Asia Mater., 2017, 9(10), e435, DOI:10.1038/am.2017.171 , [Accessed: 2nd April 2019].
- H. Okuyama, B. Krishnamachary, Y. F. Zhou, H. Nagasawa, M. Bosch-Marce and G. L. Semenza, Expression of vascular endothelial growth factor receptor 1 in bone marrow-derived mesenchymal cells is dependent on hypoxia-inducible factor 1, J. Biol. Chem., 2006, 281(22), 15554–15563, DOI:10.1074/jbc.M602003200 , [Accessed: 5th April 2019].
- E. Theveneau and R. Mayor, Can mesenchymal cells undergo collective cell migration? The case of the neural crest, Cell Adhes. Migr., 2011, 5(6), 490–498, DOI:10.4161/cam.5.6.18623 , [Accessed: 27th November 2019].
- P. V. Afonso, C. P. McCann, S. M. Kapnick and C. A. Parent, Discoidin domain receptor 2 regulates neutrophil chemotaxis in 3D collagen matrices, Blood, 2013, 121(9), 1644–1650, DOI:10.1182/blood-2012-08-451575 , [Accessed: 27th November 2019].
- A. A. Qutub and A. S. Popel, Elongation, proliferation & migration differentiate endothelial cell phenotypes and determine capillary sprouting, BMC Syst. Biol., 2009, 3(1), 13, DOI:10.1186/1752-0509-3-13 , [Accessed: 27th November 2019].
- E. Donà, J. D. Barry, G. Valentin, C. Quirin, A. Khmelinskii and A. Kunze, et al. Directional tissue migration through a self-generated chemokine gradient, Nature, 2013, 503(7475), 285, DOI:10.1038/nature12635 , [Accessed: 12th October 2016].
- G. Venkiteswaran, S. W. Lewellis, J. Wang, E. Reynolds, C. Nicholson and H. Knaut, Generation and Dynamics of an Endogenous, Self-Generated Signaling Gradient across a Migrating Tissue, Cell, 2013, 155(3), 674–687, DOI:10.1016/j.cell.2013.09.046 , [Accessed: 27th November 2018].
- A. J. Muinonen-Martin, O. Susanto, Q. Zhang, E. Smethurst, W. J. Faller and D. M. Veltman, et al. Melanoma Cells Break Down LPA to Establish Local Gradients That Drive Chemotactic Dispersal, PLoS Biol., 2014, 12(10), e1001966, DOI:10.1371/journal.pbio.1001966 , [Accessed: 12th October 2016].
- T. Simón-Yarza, F. R. Formiga, E. Tamayo, B. Pelacho, F. Prosper and M. J. Blanco-Prieto, Vascular endothelial growth factor-delivery systems for cardiac repair: an overview, Theranostics, 2012, 2(6), 541–552, DOI:10.7150/thno.3682 , [Accessed: 27th November 2019].
- I. Y. Wong, S. Javaid, E. A. Wong, S. Perk, D. A. Haber and M. Toner, et al. Collective and individual migration following the epithelial–mesenchymal transition, Nat. Mater., 2014, 13(11), 1063–1071, DOI:10.1038/nmat4062 , [Accessed: 29th November 2018].
- W. Jin, E. T. Shah, C. J. Penington, S. W. McCue, L. K. Chopin and M. J. Simpson, Reproducibility of scratch assays is affected by the initial degree of confluence: Experiments, modelling and model selection, J. Theor. Biol., 2016, 390, 136–145, DOI:10.1016/j.jtbi.2015.10.040 , [Accessed: 29th November 2018].
- P. Rosen and D. S. Misfeldt, Cell density determines epithelial migration in culture, Proc. Natl. Acad. Sci. U. S. A., 1980, 77(8), 4760–4763 CrossRef CAS PubMed , Available from: http://www.ncbi.nlm.nih.gov/pubmed/6933523 [Accessed: 29th November 2018].
- R. Mayor and S. Etienne-Manneville, The front and rear of collective cell migration, Nat. Rev. Mol. Cell Biol., 2016, 17(2), 97–109, DOI:10.1038/nrm.2015.14 , [Accessed: 12th October 2016].
- E. Scarpa and R. Mayor, Collective cell migration in development, J. Cell Biol., 2016, 212(2), 143–155, DOI:10.1083/jcb.201508047 , [Accessed: 29th November 2018].
- R. C. Prickett, L. A. Marquez-Curtis, J. A. W. Elliott and L. E. McGann, Effect of supercooling and cell volume on intracellular ice formation, Cryobiology, 2015, 70(2), 156–163, DOI:10.1016/J.CRYOBIOL.2015.02.002 , [Accessed: 18th November 2019].
- G. Chen, T. Yang, M. Qiao, H. Liu and W. Depei, Comparative Study of the Biological Characteristics of Serum-Free and Fetal Bovine Serum-Contained Medium Cultured Umbilical Cord-Derived Mesenchymal Stem Cells, Blood, 2012, 120(21), 4737, DOI:10.1182/blood.V120.21.4737.4737 , [Accessed: 18th November 2019].
- D. D. Tang and B. D. Gerlach, The roles and regulation of the actin cytoskeleton, intermediate filaments and microtubules in smooth muscle cell migration, Respir. Res., 2017, 18(1), 54, DOI:10.1186/s12931-017-0544-7 , [Accessed: 8th April 2019].
- W. Lee, S. Lim and Y. Kim, The role of myosin II in glioma invasion: A mathematical model, PLoS One, 2017, 12(2), e0171312, DOI:10.1371/journal.pone.0171312 , [Accessed: 8th April 2019].
- E. M. Hatch and M. W. Hetzer, Nuclear envelope rupture is induced by actin-based nucleus confinement, J. Cell Biol., 2016, 215(1), 27–36, DOI:10.1083/jcb.201603053 , [Accessed: 8th April 2019].
- E. Makhija, D. S. Jokhun and G. V. Shivashankar, Nuclear deformability and telomere dynamics are regulated by cell geometric constraints, Proc. Natl. Acad. Sci. U. S. A., 2016, 113(1), E32–E40, DOI:10.1073/pnas.1513189113 , [Accessed: 8th April 2019].
- H.-R. Thiam, P. Vargas, N. Carpi, C. L. Crespo, M. Raab and E. Terriac, et al. Perinuclear Arp2/3-driven actin polymerization enables nuclear deformation to facilitate cell migration through complex environments, Nat. Commun., 2016, 7(1), 10997, DOI:10.1038/ncomms10997 , [Accessed: 8th April 2019].
- M. W. Klinker, R. A. Marklein, J. L. Lo Surdo, C.-H. Wei and S. R. Bauer, Morphological features of IFN-γ–stimulated mesenchymal stromal cells predict overall immunosuppressive capacity, Proc. Natl. Acad. Sci. U. S. A., 2017, 114(13), E2598–E2607, DOI:10.1073/pnas.1617933114 , [Accessed: 8th April 2019].
- J. E. Eyles, S. Vessillier, A. Jones, G. Stacey, C. K. Schneider and J. Price, Cell therapy products: focus on issues with manufacturing and quality control of chimeric antigen receptor T-cell therapies, J. Chem. Technol. Biotechnol., 2019, 94(4), 1008–1016, DOI:10.1002/jctb.5829 , [Accessed: 8th April 2019].
- J. Gong, H.-B. Meng, J. Hua, Z.-S. Song, Z.-G. He and B. Zhou, et al. The SDF-1/CXCR4 axis regulates migration of transplanted bone marrow mesenchymal stem cells towards the pancreas in rats with acute pancreatitis, Mol. Med. Rep., 2014, 9(5), 1575–1582, DOI:10.3892/mmr.2014.2053 , [Accessed: 8th April 2019].
- K. Wang, X. Zhao, C. Kuang, D. Qian, H. Wang and H. Jiang, et al. Overexpression of SDF-1α enhanced migration and engraftment of cardiac stem cells and reduced infarcted size via CXCR4/PI3K pathway, PLoS One, 2012, 7(9), e43922, DOI:10.1371/journal.pone.0043922 , [Accessed: 8th April 2019].
- C. A. Bravery, J. Carmen, T. Fong, W. Oprea, K. H. Hoogendoorn and J. Woda, et al. Potency assay development for cellular therapy products: an ISCT review of the requirements and experiences in the industry, Cytotherapy, 2013, 15(1), 9–19, DOI:10.1016/j.jcyt.2012.10.008 , [Accessed: 29th July 2015].
- M. P. De Miguel, S. Fuentes-Julián, A. Blázquez-Martínez, C. Y. Pascual, M. A. Aller and J. Arias, et al. Immunosuppressive properties of mesenchymal stem cells: advances and applications, Curr. Mol. Med., 2012, 12(5), 574–591 CrossRef CAS PubMed , Available from: http://www.ncbi.nlm.nih.gov/pubmed/22515979 [Accessed: 8th April 2019].
- J. Friedman, T. Hastie and R. Tibshirani, Regularization paths for generalized linear models via coordinate descent, J. Stat. Softw., 2010, 33(1), 1–22, DOI:10.18637/jss.v033.i01.
- B. Zhang, A. Korolj, B. F. L. Lai and M. Radisic, Advances in organ-on-a-chip engineering, Nat. Rev. Mater., 2018, 3(8), 257–278, DOI:10.1038/s41578-018-0034-7 , [Accessed: 10th April 2019].
- FDA, Research C for BE and. Guidance for Industry Potency Tests for Cellular and Gene Therapy Products. [Accessed: 1st October 2019]. Available from: https://www.fda.gov/media/79856/download [Accessed: 1st October 2019].
- A. I. Van Den Bulcke, B. Bogdanov, N. De Rooze, E. H. Schacht, M. Cornelissen and H. Berghmans, Structural and rheological properties of methacrylamide modified gelatin hydrogels, Biomacromolecules, 2000, 1(1), 31–38 CrossRef CAS PubMed , Available from: http://www.ncbi.nlm.nih.gov/pubmed/11709840 [Accessed: 23rd August 2015].
- Y. Xia and G. M. Whitesides, Soft lithography, Annu. Rev. Mater. Sci., 1998, 28(1), 153–184, DOI:10.1146/annurev.matsci.28.1.153 , [Accessed: 7th May 2019].
- J. Bartolucci, F. J. Verdugo, P. L. González, R. E. Larrea, E. Abarzua and C. Goset, et al. Safety and Efficacy of the Intravenous Infusion of Umbilical Cord Mesenchymal Stem Cells in Patients With Heart Failure, Circ. Res., 2017, 121(10), 1192–1204, DOI:10.1161/CIRCRESAHA.117.310712 , [Accessed: 9th May 2019].
- J. Cuenca, A. Le-Gatt, V. Castillo, J. Belletti, M. Díaz and G. M. Kurte, et al. The Reparative Abilities of Menstrual Stem Cells Modulate the Wound Matrix Signals and Improve Cutaneous Regeneration, Front. Physiol., 2018, 9, 464, DOI:10.3389/fphys.2018.00464 , [Accessed: 9th May 2019].
- M. Dominici, K. Le Blanc, I. Mueller, I. Slaper-Cortenbach, F. Marini and D. S. Krause, et al. Minimal criteria for defining multipotent mesenchymal stromal cells. The International Society for Cellular Therapy position statement, Cytotherapy, 2006, 8(4), 315–317, DOI:10.1080/14653240600855905 , [Accessed: 9th May 2019].
- C. R. Justus, N. Leffler, M. Ruiz-Echevarria and L. V. Yang, In vitro cell migration and invasion assays, J. Visualized Exp., 2014,(88), e51046, DOI:10.3791/51046 , [Accessed: 5th June 2018].
Footnote |
| † Electronic supplementary information (ESI) available. See DOI: 10.1039/c9lc00988d |
| This journal is © The Royal Society of Chemistry 2020 |