DOI:
10.1039/C9LC00775J
(Critical Review)
Lab Chip, 2020,
20, 1318-1357
Mathematical modeling and computational analysis of centrifugal microfluidic platforms: a review
Received
6th August 2019
, Accepted 17th January 2020
First published on 3rd April 2020
Abstract
Centrifugal microfluidic platforms or lab-on-discs (LODs) have evolved into a popular technology for automating chemical and biological assays. LODs today enable scientists to implement and integrate different operational units, including fluid mixing, droplet generation, cell-sorting, gene amplification, analyte detection, and so forth. For an efficient design and cost-effective implementation of any microfluidic device, including LODs, theoretical analysis and considerations should play a more important role than they currently do. The theoretical analysis we will show is especially essential to the investigation of detailed phenomena at the small length scales and high-speed typical for LODs where a wide range of forces may be involved. Previous LOD review papers presented mostly experimental results with theory as an afterthought. Hence, a review paper focused on the theoretical aspects, and associated computational studies of LOD devices is an urgent need. In the present review paper, all previous computational studies on LOD devices are categorized as single-phase flows, two-phase flows, network simulation, and solids. For each of these categories, the governing equations and important formulas are presented and explained. Moreover, a handy scaling analysis is introduced to aid scientists when comparing different competing forces in LOD devices. We hope that by surveying and contrasting various theoretical LOD studies, we shed some light on existing controversies and reveal where additional theoretical work is needed.
 Masoud Madadelahi | Dr. Masoud Madadelahi received his Ph.D. from Sharif University of technology (SUT) in December 2018. His research involves design, fabrication, and testing of lab-on-a-chip and lab-on-a-disk devices for different purposes like cell separation, cell encapsulation, DNA amplification, and the integration of different unit operations. During his Ph.D., as a research visitor, he went to the Technical University of Delft (TUD) in the Netherlands and worked on Micro and Nanofluidic systems focused on hollow Atomic Force Microscopy (AFM) cantilevers. He is currently a Postdoc researcher at Tecnologico de Monterrey since February 2019. |
 Sergio O. Martinez-Chapa | Dr. Sergio O. Martinez-Chapa received his PhD from Grenoble INP in 2002, with a thesis in the field of MEMS. Currently, he is professor of the School of Engineering and Sciences, leader of the NANO – Sensors and Devices Group, and chair of the Nanotechnology Graduate Program of Tecnologico de Monterrey. He is member of the Mexican Academy of Sciences and the Mexican Researchers National System. His research is focused on Electrokinetically-Driven Microfluidics, Centrifugal Microfluidics and Carbon-Based Sensors. |
 Marc J. Madou | Dr. Marc J. Madou is Chancellor's Professor in Mechanical and Aerospace Engineering, University of California in Irvine. He is author of more than 250 peer-reviewed papers and more than 30 patents. He is author of several books in Micro and Nanofabrication, MEMS and NEMS, and Carbon Sensors and Devices. His third edition of Fundamentals of Microfabrication and Nanotechnology has become known as the “bible” of Micromachining. He is a pioneer in the field of CD-Microfluidics, a field that is now vigorously pursued globally, and has resulted in at least five companies. |
1. Introduction
Microfluidics enables scientists to miniaturize, automate and integrate different biochemical processes, including mixing,1–3 cell separation,4,5 valving,6,7 metering,7 gene amplification,8–10etc. Besides conventional syringe pumps, there are many other methods available to drive fluids through the microchannels of a microfluidic device. These methods include capillary driven microfluidics,11,12 digital microfluidics,13–15 surface acoustic wave driven microfluidics,16 electrokinetic-based microfluidics3,17 and centrifugal microfluidics. Platforms using centrifugal microfluidics are called lab-on-discs (LODs) or lab-on-CDs (LOCDs).18 In a few studies, centrifugal and non-centrifugal microfluidic devices were compared.19 The many advantages of LODs that became evident from those comparative studies have encouraged more and more scientists to focus on LOD devices. In LODs the fluid flow rates can span a range from 10 nL s−1 to 100 μL s−1 depending on the type of fluid, the dimensions of the disc, and the rotational speed. This wide range of flow rates makes this technique more amenable to a wider range of applications in comparison with other methods like electrokinetic-driven systems.20 Moreover, LOD devices are capable of handling a wider variety of samples (e.g., from milk to blood), because they are less prone to be influenced by such things as pH, ionic strength, surface adsorption, etc. In LODs, it is also easy to integrate different operational units from the sample preparation to the detection step and even to process and detect multiple analytes in a single disc i.e., to multiplex.7
In microfluidics, a good design is a cornerstone of the reduction in the number of required experimental investigations and a faster route to the desired outcomes. Theoretical analysis can ensure whether a design is feasible or not and how efficient each design is. This way, one can achieve the most efficient microfluidic device with a minimum number of experimental trials and errors. Analytical solutions for different theoretical models often require too many oversimplifications such as reduction of the problem to one dimension, assuming many properties to be constant, and oversimplified and limited boundary conditions. As a case in point, electroosmotic flow on rotational platforms has mostly been studied from simple theoretical analyses.21–23 Because of oversimplifications, these models are not able to predict accurately the real situations in practical devices.
Computational analysis, mostly referred to as numerical simulation is a powerful tool that can yield accurate solutions for many LOD devices before their actual fabrication. In early studies, computational modeling in microfluidics was limited to single operational microfluidic units, but in more recent studies, theoretical investigations are focused on microfluidic systems integrating many operational units.24 They allow for the study of transient (e.g., secondary flows in microscale droplets while they pass through curvilinear microchannels8) and fast phenomena, being particularly relevant to assess phenomena that require otherwise complicated and expensive measurements. Through the optimization of microfluidic design, and with some a priori studies, one can ensure that the concepts are valid before going to fabrication and testing. This approach reduces fabrication and material expenses. Moreover, in comparison with analytical techniques, researchers are not limited to oversimplified problem statements or applying too many simplifying assumptions for the physical problem at hand.25 These computational methods mostly rely on the finite difference method, the finite element method, and the finite volume method. The finite difference method is the oldest numerical method and is restricted to predominantly rectangular shapes and simple variations. However, the ability of finite element and finite volume methods for handling complicated geometries with relative ease have made them popular among researchers for different theoretical analyses.26,27 In Fig. 1, we organize all types of simulations that have been performed on LOD devices in distinct groups. This figure also depicts the logical steps to be taken when going from initial design to the fabrication and testing of a new LOD device. In this process, scientists make an initial design of the LOD device. Next, they use computational analysis of the whole device or each operational unit separately to make sure the device works efficiently. This initial design may be revised several times before going on to fabrication and experimental analysis. This process not only reduces the number of trials and errors needed to get to the desired result but also helps scientists to study the fluidic phenomena quantitatively. Some of these phenomena, such as secondary flows in serpentine microchannels, are very difficult to capture and study experimentally.
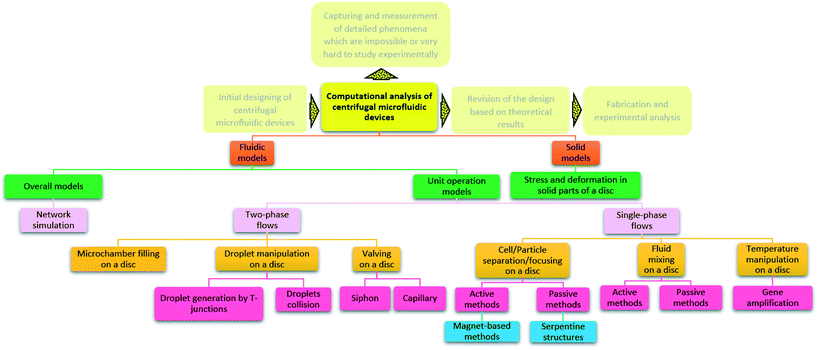 |
| | Fig. 1 Previous computational studies on centrifugal microfluidic platforms. | |
Current reviews on LODs are mostly focused on specific applications and are describing experiments rather than modeling and design. Due to the high number of contradictory reports in both simulation and experimental studies (e.g., burst frequencies20,28), we believe that a review paper surveying and contrasting these various studies would shed some light on existing controversies and reveal where additional theoretical work is needed. In Table 1, we list important computational studies on LOD devices. More details about these studies can be found in the next sections of this review paper.
Table 1 Important computational studies in centrifugal microfluidics
|
|
Main fluidic function |
Governing equations |
Computational method |
Applications and mechanisms at hand |
Ref. |
| Single-phase flows |
Fluid mixing |
Conservation of momentum (eqn (9)), conservation of mass (eqn (10)) and convection–diffusion equation (eqn (11)) |
Finite volume method |
• Batch-mode mixing on a disc was theoretically investigated |
29
|
| • Three different types of vortices were detected while accelerating and de-accelerating the disc |
| • It was shown that the smaller vortices enhance mixing and reduce the time needed to achieve a 90% mixing efficiency |
| • The simulations showed that said vortices invert the flow direction as the acceleration change from positive to negative values and that, in turn, cause an increased mixing |
| Finite element method |
• Serpentine macromixing was investigated both computationally and experimentally |
30
|
| • Both centrifugal and non-centrifugal platforms were studied |
| Finite element method |
• Serpentine macromixing was investigated computationally to find the optimum design |
31
|
| • The effect of many parameters on mixing, such as cross-sectional geometry and rotational speed was investigated |
| Finite volume method |
• Batch-mode mixing in LOD devices was investigated both computationally and experimentally |
32
|
| • The simulations showed the generation of three different vortices |
| • The best mixing chamber between four different geometric configurations was chosen |
| Finite element method |
• The use of round turning channels instead of rectilinear configurations was computationally studied. |
33
|
| • The effects of rotational speed and position of micromixer on the disc were investigated |
| • A 90% mixing was achieved in less than half the distance of the channel in comparison with the conventional geometries |
| Finite element method |
• 3D computational simulation of reacting flows in pressure-driven and centrifugal microfluidic devices was investigated |
19
|
| • Different serpentine structures were studied, and their performance for Newtonian and non-Newtonian fluids in centrifugal and non-centrifugal devices was compared |
| Temperature manipulation |
Conservation of momentum (eqn (9)), conservation of mass (eqn (10)) and conservation of energy (eqn (13)) |
Finite element method |
• An LOD device for nested-polymerase chain reaction (PCR) was designed |
34
|
| • The combination of convective and radiative heat transfer mechanisms was studied |
| • A fan within the set up was considered for increasing the airflow |
| Cell/particle separation |
Conservation of momentum (eqn (9)), conservation of mass (eqn (10)) and particle tracing (eqn (14)) |
Finite volume method |
• Magnetized beads were used for the separation of neutrophils from red blood cells |
35
|
| • The neutrophils were previously attached to the beads and then transferred to the LOD |
| • Forces considered were magnetic force, added mass force, drag force, and lift force |
| • Two different devices were designed with destination chambers for neutrophils, red blood cells, and excess magnetic beads |
| Iterative method (not mentioned specifically) |
• Particle tracing of magnetized beads was done in a batch mode mixer on an LOD |
36
|
| • Magnetic force, centrifugal force, and drag force were used in the calculations |
| Finite element method |
• A new label-free particle separation based on negative magnetophoresis was studied |
37
|
| • A micromixer for mixing of diluted blood and ferrofluid before particle separation was also simulated |
| • Particle tracing included drag force, centrifugal force, lift force, and magnetic force |
| • Three different particle sizes of 6 μm, 12 μm, and 22 μm, regarded as red blood cells, white blood cells, and circulating tumor cells were considered |
| • Healthy cells were separated from abnormal cells with satisfactory results |
| Cell/particle focusing |
Conservation of momentum (eqn (9)), conservation of mass (eqn (10)) and particle tracing (eqn (14)) |
Finite element method |
• Serpentine microchannels on LOD devices were simulated for particle focusing without any other external forces |
38
|
| • The device allowed for focusing of particles regardless of their size, ensuring that after enough turns all the particles of a kind were focused at the channel's central region |
| • This mechanism was working at low shear stresses, below the reported threshold value for cell damage |
| Two-phase flows |
Valving |
Two-phase models (section 4) |
Finite element method |
• Capillary and siphon valves on an LOD device were simulated for a nested-PCR |
34
|
| Finite volume method |
• A computational model was used to investigate the behavior of liquids in a specific capillary valve |
39
|
| • Two small microchannels were added to a conventional capillary valve as a “guided routing” valve |
| • The fluid direction was changed without needing a reversal of the spinning direction. |
| Finite volume method |
• A computational model was used to study the detailed behavior of liquid and air in a centrifugo-pneumatic valve in a metering unit |
40
|
| Microchamber filling |
Finite volume method |
• Fluid behavior in a specific chamber was studied in detail |
41
|
| • By using deceleration, fluid could pass a narrow throat in the proposed geometry |
| • Velocity and pressure distribution during this process were provided computationally |
| Finite volume method |
• Fluid meniscus movement while filling a microchannel was captured and compared with experiments |
42
|
| Droplet generation |
Finite volume method |
• A viable mechanism for forming droplets was studied |
43
|
| • The droplets could also be used for the encapsulation of cells |
| • The device demonstrates a way to effectively select droplets based on their size |
| Finite element method |
• The interaction and advection of droplets in a 2D space were computationally studied |
44
|
| • The phase-field model was used to simulate a slug-like motion of droplets |
| Network simulation |
Pneumatic pumping |
Network simulation formulas (section 5) |
Numerical methods for solving PDEs and calculating integrals |
• The first network simulation was done in LOD devices for pumping liquids from a radial outward position to a radial inward position |
45
|
| • The comparison of simulations with experiments was made for water, ethanol, whole blood, and lysis buffer |
| • The pumping efficiency of 75% was achieved for inward pumping over a radial distance of 40 mm in 11 s |
| Automated serial dilution |
• The model included a shake-mode mixer, two siphon valves, pneumatic chambers, and actuated valving |
46
|
| Timed valving and pumping |
• Network simulation was used to characterize the timing concept in LOD devices |
47
|
| • Network simulation was also employed to study a siphon valve, including a timing system, to show that the flow rate and filling level of fluidic elements are in a good agreement with experiments |
| Precise and compact inertia-based pumping |
• Network simulation was utilized to investigate inertia pumping of liquids in a compact and controlled way |
48
|
| • The first law of thermodynamics was used together with a pressure loss equation to derive a non-linear PDE equation |
| • Regarding the simplifications such as constant contact angle and fully filled reservoirs, the simulations were mostly underestimating the results |
| Optimization of centrifuge-pneumatic blood plasma separation |
• Network simulation was used for designing a pneumatic chamber to separate plasma from whole blood |
49
|
| • This model also included non-Newtonian behavior of whole blood |
| Pneumatic siphon valving and switching |
• Pneumatic chambers were connected to siphon valves |
50
|
| • In this way one of the siphon-valve limitations was eliminated; they could be triggered at any rotational frequency |
| • Computational simulations were presented for different connections of pneumatic chambers and siphons |
| Solids |
Stress and deformation in solids |
Eqn (61)
|
Finite element method |
• A solution was proposed to achieve both storage and dispensing of liquids on the LOD without the need for separate components or manual intervention |
51
|
| • The deformation and pressure of a stretched elastic ring on an LOD device were calculated computationally |
2. Physics of centrifugal microfluidic devices
Unlike the majority of lab-on-a-chip (LOC) devices, that require external laboratory gears (e.g., a syringe-pump or a high DC power supply) for the generation of driving forces for moving fluids, LOD devices constitute a pump simply by rotating. The rotational force is typically generated by commercially available and often cost-effective electric motors.52 Like other fluidic systems, to characterize the fluid flow regime in LODs, the Reynolds number – the dimensionless parameter given by the ratio of inertia force to viscous force – is used:| |  | (1) |
where ρf is the fluid density, Vavg is the mean velocity, Dh is the channel's hydraulic diameter, and μf is the dynamic viscosity. The Re number in all centrifugal microfluidic devices is typically low, e.g., for a channel width of 100 μm, a liquid flow velocity of 1 mm s−1, a fluid density of 1 g cm−3 and a viscosity of 0.001 Ns m−2, the Re number is 0.1. With such low Re, almost all LOD devices operate in the laminar flow regime in the microchannels. However, at the same time, the flow regime of air surrounding the LOD is turbulent due to the high speed of rotation of the disc.
In any centrifugal microfluidic platform, three different forces play a role; the centrifugal force per unit volume (eqn (2)), the Coriolis force per unit volume (eqn (3)), and the Euler force per unit volume (eqn (4)). The centrifugal force is always radially outward, the Coriolis force is always perpendicular to both the linear velocity and the angular velocity vectors, and the Euler force is dependent on the direction of the angular acceleration. In Fig. 2, the directions of these forces are shown for two different fluid plugs; one moving in the radial and one moving in the iso-radial directions.
| |  | (2) |
| |  | (3) |
| |  | (4) |
where
![[V with combining right harpoon above (vector)]](https://www.rsc.org/images/entities/i_char_0056_20d1.gif) f
f is the velocity vector of any fluidic element,

is the rotational velocity vector, and
![[r with combining right harpoon above (vector)]](https://www.rsc.org/images/entities/i_char_0072_20d1.gif)
is the radial position vector. An over-dot in
eqn (4) denotes a time derivative

. Noteworthy, in
eqn (4),
![[F with combining right harpoon above (vector)]](https://www.rsc.org/images/entities/i_char_0046_20d1.gif) Euler
Euler is zero for LOD devices rotating at constant angular velocities as this parameter is defined according to the angular acceleration. In LOD devices,
![[F with combining right harpoon above (vector)]](https://www.rsc.org/images/entities/i_char_0046_20d1.gif) centrifugal
centrifugal plays a crucial role as the driving force.
18
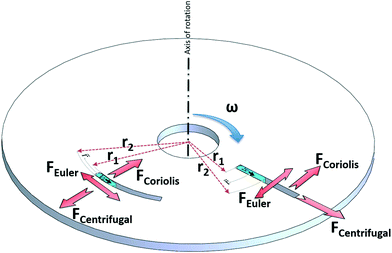 |
| | Fig. 2 Schematic view of an LOD device and the three main forces involved due to the rotation. | |
For rough calculations and basic designs, it is rather more convenient to work with the scalar pressure differences instead of the vector forces mentioned above. In all LOD devices, the pressure difference (Δp) between two ends of a radial channel filled with fluid can be calculated using eqn (5).7,53
| |  | (5) |
where
r1 and
r2 are the radially inward and outward ends of the fluid column (
Fig. 2), Δ
r = |
r2 −
r1| is the length of the fluid column, and

is the average of
r1 and
r2.
In addition to the forces mentioned above, other forces such as capillary force (especially applicable for capillary valves), viscous force and inertial force can also play important roles on LOD platforms. The pressure differences, as a result of these three forces, are presented in eqn (6) to (8).7,18
where
q is the fluid volumetric flow rate,
Rhyd is the hydrodynamic resistance,
σ is the surface tension,
κ is the curvature of the meniscus,
l is the length of a fluidic channel filled with liquid, and
a is the liquid acceleration.
3. Single-phase flows in centrifugal microfluidic devices
The majority of the computational simulations of LOD devices in the literature are focused on single-phase flows. In this review paper, “single-phase flow” refers to a flow that continuously occupies space within the microfluidic channels.
In order to monitor the movement of such fluids on a centrifugal platform, the conservation of momentum (Navier–Stokes momentum equation) (eqn (9)) along with the continuity equation (eqn (10)) should be simultaneously solved.
| |  | (9) |
| |  | (10) |
where
![[f with combining right harpoon above (vector)]](https://www.rsc.org/images/entities/i_char_0066_20d1.gif) b
b is the volumetric force vector, which is the sum of the centrifugal (
eqn (2)), Coriolis (
eqn (3)) and Euler (
eqn (4)) forces generated by the rotation. It is important to note that the transient terms on the left side of
eqn (9) and
(10) are null for steady-state problems. Moreover, when the gravity effect is considered to be negligible, the third term on the right side of
eqn (9) can be neglected.
The above-mentioned equations couple with other equations when we want to simulate different phenomena such as fluid mixing, gene amplification, and particle tracing on centrifugal microfluidic devices. The equations and formulas for these applications are elaborated in the following sections.
3.1. Mixing in single-phase flows
Mixing is a very common process step that is needed in most of the LOD devices. In conventional microfluidics, since Re is low, viscous forces are dominant over inertial forces; thus, fluid mixing in small LOD channels and chambers poses a challenge. Many studies thus involve different approaches to reduce the mixing length in microchannels to help fluids mix fast and effectively.2,54 In order to simulate mixing on LOD devices, the convection–diffusion equation (eqn (11)) should be used together with the previously mentioned equations for single-phase flows (eqn (9) and (10)).27,55| |  | (11) |
where Di is the molecular diffusion coefficient, Ci is the concentration of species i (the index of each species in the fluid) and Ri is the reaction rate; positive for the production and negative for the consumption of species. Ri is eliminated from the equation if no chemical reaction takes place in the system. In the case of steady-state, the first term on the left side of eqn (11) is null. In order to quantify the mixing level, it is usually necessary to define a specific variable η called “mixing efficiency” or “mixing index”.31| |  | (12) |
where, CoV is the coefficient of variation, and n is the number of data points on which concentration Ci is calculated.
While several experimental and theoretical studies in this regard are reported,56–58 few have concentrated on computational studies. Here we single out those works that did carry out computational studies for mixing on LODs.
Ren et al. (2013) presented a simulation of batch-mode mixing on a disc.29 These authors solved the governing equations using the finite volume method to demonstrate that the proposed micromixer, performs faster than molecular diffusion mixing. They solved the continuity, the momentum, and the convection–diffusion equations to measure the mixing quality. As shown in Fig. 3(A), their findings suggest that the rotation of the device employing accelerating and de-accelerating cycles does create three vortices: these include a large vortex in the ϕ–r plane and two smaller toroidal vortices that run in opposite directions in the z–r plane. The smaller vortices in the z–r plane enhance the mixing while reducing the time needed to achieve 90% mixing efficiency. Furthermore, the simulations show that said vortices invert the flow direction as the acceleration changed from a positive to a negative value and that, in turn, caused a further increase in mixing. In Fig. 3(B), we show the sequential images of the movement of two colored aqueous media within a mixing chamber. The rotational velocity is initially zero and reaches 720 rpm within 3 s. Once the device starts rotating in the depicted direction, the red medium moves towards the opposite direction due to the Euler acceleration. However, the blue medium behaves differently and moves along the direction of the rotation. Mortazavi et al. (2017) also investigated the mixing by acceleration and deceleration of a rotational unit, and explored this both computationally and experimentally.32 They used the finite volume method to solve the Navier–Stokes, the continuity, and the convection–diffusion equations. The simulations showed, as expected, the generation of a principal vortex in the horizontal transverse section of the chamber, and two Dean vortices through a vertical cross-section. The standard deviation of the concentration at different points of the chamber was used to quantify the quality of mixing, and the simulations and experiments were run until the standard deviation was less than 0.1. The proposed simulations and experimental data matched very well. It was concluded that between the four different proposed geometries for obstacles in the chamber (Fig. 3(C)), the design with three obstacles yielded the optimal mixing time. The proposed design showed an increase of 70–80% of the mixing rate. In Fig. 3(D), we show the change of the standard deviation of species concentration for the best design over time.
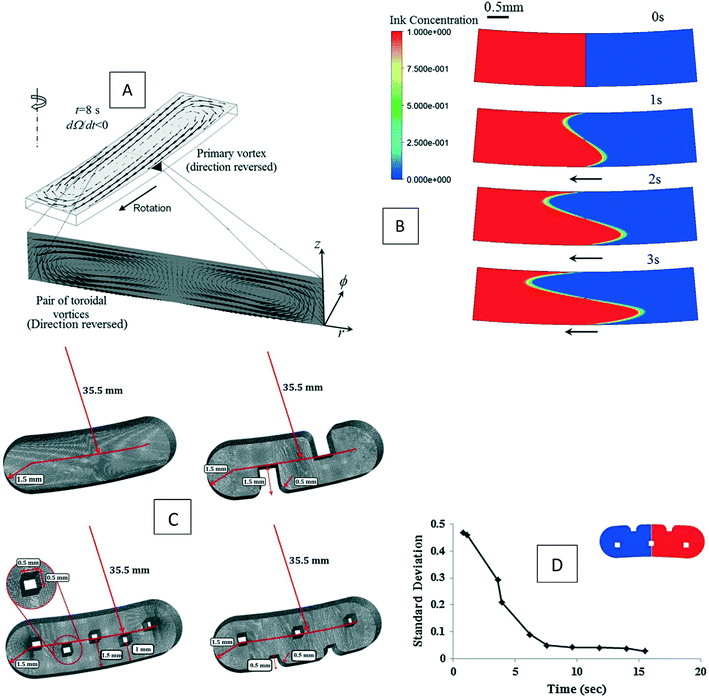 |
| | Fig. 3 Batch-mode mixing on LOD devices. (A) Visual representation of the primary vortex and the two toroidal vortices generated in the chamber by Ren et al.29 Reprinted with permission from Elsevier. (B) The behavior of two liquids under acceleration. Black arrows show the rotation direction of the chamber.29 Reprinted with permission from Elsevier. (C) The geometry of four different designs considered for batch-mode mixing by Mortazavi et al.32 Reprinted by permission from Springer Nature. (D) The standard deviation of species concentration over time for the most desirable design.32 Reprinted by permission from Springer Nature. | |
Besides batch-mode mixing, serpentine mixing structures have also been investigated computationally to find their optimum design for implementation on LOD devices. As depicted in Fig. 4(A), in these micromixers, two different fluids enter from two inlets and then mix in the serpentine structure while the disc rotates. La et al. (2013) carried out the first investigations about these micromixers, both computationally and experimentally.30 They used the finite element method and solved the Navier–Stokes, the continuity, and the convection–diffusion equations. They were able to capture secondary flows in the turns of a microchannel structure. Later, Shamloo et al. (2016) did further simulations to find the optimum parameters for these micromixers.33 They considered different geometrical and operational parameters, including the angle between the two inlet flows, the cross-sectional geometry of the microchannels, the rotational speed of the disc, as well as the number and configuration of the turns in the serpentine structure. In Fig. 4(B), the concentration distribution and secondary flows at different positions in the serpentine micromixer are shown. The same team also worked on the curved structures and explored the mixing efficiency as a function of the distance of the micromixers from the center of the disc.33 They found that mixing enhances by increasing this distance. However, this improvement is not very significant and is not recommended for small sized centrifugal platforms. Moreover, they found that in comparison with conventional serpentine structures, curved geometries provide better mixing yet. Kuo et al. (2016) also used the same method to mix blood plasma and DI water in serpentine microchannels on LOD devices.59 Their finite element computational studies for a rectangular serpentine channel showed a mixing efficiency of 97%, which was in agreement with their experiments.
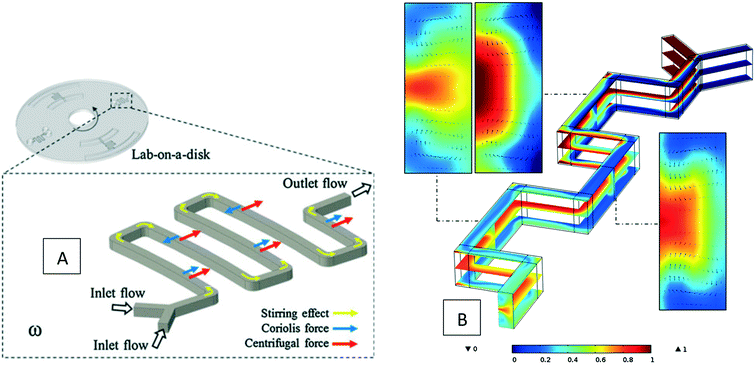 |
| | Fig. 4 Serpentine micromixers in LOD devices (A) the device geometry considered by La et al.30 Reprinted by permission from Springer Nature. (B) The concentration distribution and secondary vortices in a serpentine micromixer of rectangular cross-sectional geometry.31 Reprinted with permission from Elsevier. | |
Recently, Madadelahi and Shamloo (2018) presented a 3D computational simulation of reacting flows in pressure-driven and centrifugal microfluidic devices. The authors considered three different serpentine structures [Fig. 5(A) to (C)] and compared the mixing efficiency for Newtonian and non-Newtonian fluids in centrifugal and non-centrifugal devices.19 They used the finite element method to solve the relevant equations. They also studied the effects of rotational and non-rotational serpentine microchannels and compared them in great detail. They investigated different parameters including mass flow rate of reacting species in both LOC and LOD, aspect ratio of the cross-sections of the channels [Fig. 5(D) to (F)], position of the channels in LOD devices with respect to the center of rotation, angle of fabrication [Fig. 5(G)] and geometry of the serpentine microchannel in both LOC and LOD. It was concluded that in both LOC and LOD, as the flow-rate (Newtonian and non-Newtonian) increases, the chemical reaction yield decreases as the reactants have less time to react and generate the intended products. It was also shown that between the three different channel designs, i.e., rectangular, sinusoidal and triangular, the rectangular channel produced the maximum chemical yield [Fig. 5(H) and (I)] while preserving a minimum magnitude of secondary flows. These secondary flows are important parameters in fluid movement, mixing, and inertial particle separation applications. In LOD devices, a larger radial distance of the serpentine channel away from the disc center resulted in a lower chemical yield, and a 45° inclination angle of the serpentine channel with the disc radius gave the best chemical product yield. These findings hold for both Newtonian and non-Newtonian fluids. It was also shown that for a rectangular structure, the maximum production rate comes with aspect ratios of equal or greater than unity.
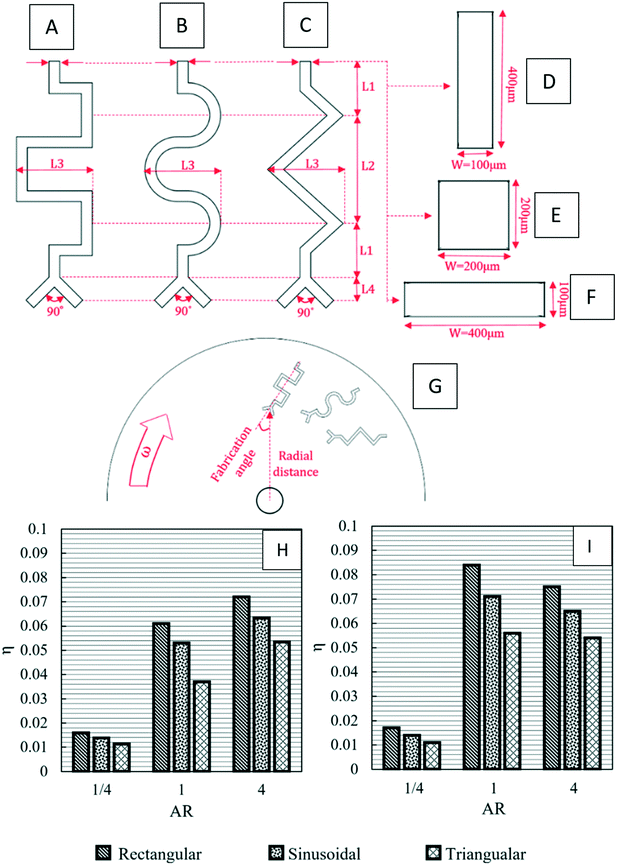 |
| | Fig. 5 Schematic geometry of different LOD and LOC serpentine microfluidics devices: (A) rectangular, (B) sinusoidal, (C) triangular (D) vertical rectangular cross-section (aspect ratio: 4–1), (E) square cross-section (aspect ratio: 1–1), (F) horizontal rectangular cross-section (aspect ratio: 1–4), (G) fabrication angle and normal distance of the channels on a disc, (H) production factor versus aspect ratio in microchannels with a rectangular cross-section and Re = 10 for a Newtonian LOC, and (I) production factor versus aspect ratio in microchannels with a rectangular cross-section and Re = 10 for a Newtonian LOD.19 Reprinted with permission from Elsevier. | |
3.2. Temperature evaluation
One of the many promising applications of LOD devices is DNA amplification, a process that requires precise temperature control of a reaction chamber.8,10 Since LOD platforms are rotating, for monitoring the temperature distribution, we need specific facilities like wireless connections. Doing simulations can give scientists an overview of temperature distribution together with the effect of different parameters like chambers size, electrical power needed for heaters, etc. without any sophisticated experimental efforts. To facilitate such control in LOD platforms, the conservation of energy equation (eqn (13)) should be considered as the governing eqn.60| |  | (13) |
where k is the thermal conductivity, Cp is the heat capacity at constant pressure, and T is the temperature. Although a great number of experimental works demonstrate this application,61–65 few incorporate a computational analysis. Naghdloo et al. worked on the simulation of an LOD device proposed for nested-polymerase chain reaction (PCR) using a combination of convective and radiative heat transfer mechanisms.34 In Fig. 6(A), we show different sections of their system. Fig. 6(B) depicts the different subunits on the disc, including mixers, siphon valves, capillary valves, and reaction chambers. The authors solved the continuity equation, the Navier–Stokes equation, and the convective–diffusive equation. For the simulation of the heat transfer mechanisms, the energy equation was used to calculate the temperature distribution between the heater and the device. They also considered the turbulent k–ε model for the simulation of air surrounding the rotating disc. All the equations were solved using the finite element method. The stationary heat transfer and the stationary mixing model computations were solved using the Petrov–Galerkin method, while the axisymmetric transient heat transfer models were resolved using the Runge–Kutta method. To validate the accuracy of the mathematical model, the simulation was run emulating a real LOD, and the data were compared. The recorded velocity profiles closely resembled experimental results from the literature. Moreover, to optimize serpentine mixing channels on an LOD, a mechanism that involves the addition of a fan set-up was considered for more active control of the required temperature profile changes. The presence of the fan allows for an increased airflow between the heater and the surface of the disc, providing more efficient active cooling. Fig. 6(C) shows the temperature distribution during the cooling and heating steps. The authors proposed that the device could outperform other platforms for PCR automation with 50% less processing time compared to that of previous studies.34
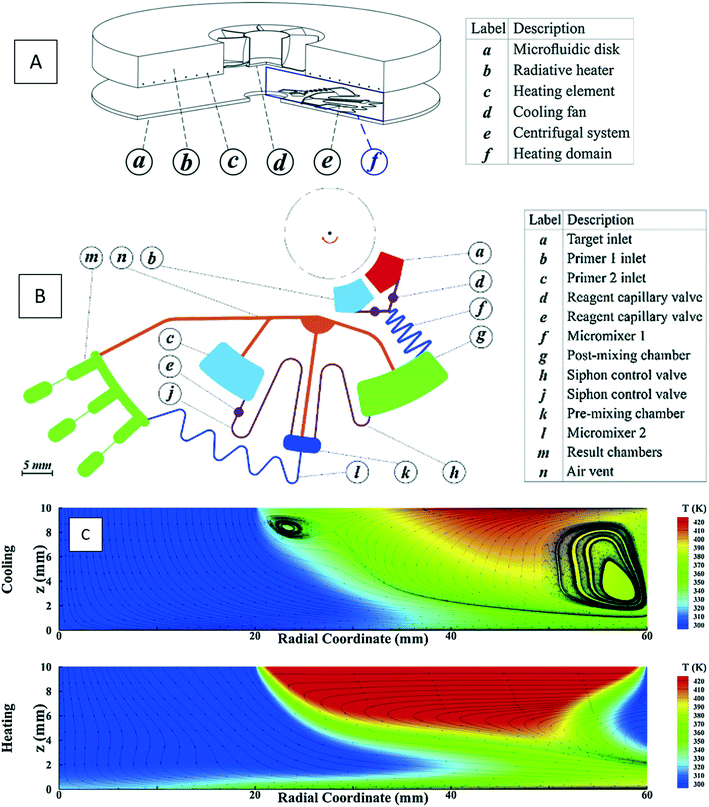 |
| | Fig. 6 Simulation of a PCR device: (A) the overall view of the device including microfluidic disc, radiative heater, heating element, cooling fan, centrifugal microfluidic system and the computational domain for heat transfer, (B) different sections of the microfluidic device, and (C) temperature distribution and streamlines for heating and cooling processes.34 Reprinted with permission from Elsevier. | |
3.3. Particle tracing
Particle tracing in microfluidic devices has been used for several different purposes. These applications include cell/particle separation,66 cell/particle focusing,67,68 evaluation of mixing units,29 and flow velocity.69,70 The main advantage of using LOD devices for particle/cell separation include low-cost setup, the possibility of integration of multiple unit operations, and the automation of the process. On the other hand, the main disadvantage of using LOD devices for particle/cell studies is the limited available space on the disc for the reservoirs and channels. This may cause serious issues if we need to separate rare cells/particles, and a high volume of sample is needed for detection.64
Using a simulation for particle tracing is fast and straightforward and can anticipate the particle/cell behavior. Researchers should take into account that for the simulation of particle tracing, different formulas are needed for different forces. For some of these formulas, simplifying assumptions and too ideal conditions are assumed. Moreover, particle–particle interactions have not been considered in previous simulations. This may cause another limitation, especially for the anticipation of clogging in LOD devices and for the methods relying on filtration.71 Nevertheless, due to the small size of particles/cells and the rotating platform of LOD devices, simulations can help scientists to find the detailed behavior of particles and cells under desired conditions. Simulation studies, which are shown in the following section, have presented an acceptable agreement with experiments. Specifically, for methods that need costly reagents like antibodies, they can play a crucial role by helping scientists reduce the trial and error in their experiments.
From the theoretical point of view, the equation that governs particle tracing, and that has been reported in the literature, is given as follows:
| |  | (14) |
where
mp is the particle mass,

is the particle position vector, and
![[F with combining right harpoon above (vector)]](https://www.rsc.org/images/entities/i_char_0046_20d1.gif)
is the force vector affecting the particles.
In Table 2, we show different forces that may apply to particles in an LOD device. In addition to those forces listed here, Brownian motion may also affect particles. An important dimensionless parameter known as the Peclet number, Pe (eqn (15)), provides a measure for whether the Brownian motion –when compared to convection– is significant or not. The Pe number applies to both gases and liquids and can be calculated based on:72
| |  | (15) |
where
L is the characteristic length,
V is the characteristic velocity of the fluid, and
D is the diffusivity coefficient. In most of the microfluidic theoretical studies, Brownian motion can be considered negligible.
73
Table 2 List of different forces applicable in particle separation and particle focusing on centrifugal platforms
| Force type |
Force formula |
Principles and applications |
Computational LOD studies based on the corresponding formulas |
| Centrifugal force |
Eqn (16)–(18)
|
Centrifugal force here refers to centrifugal, Coriolis, and Euler. Centrifugal and Coriolis forces exist in all LOD devices, but the Euler force is zero at constant angular velocity |
35–38
|
| Virtual mass (added or apparent mass) force |
Eqn (19)
|
This force is related to the interaction of a moving object and the fluid surrounding that object |
35, 38
|
| Drag force |
Is described in Table 3 |
Drag force is a counter-acting force which exists on the surface of all moving objects in viscous (viscosity ≠ 0) fluid flows |
35, 38
|
| Magnus lift force |
Eqn (22)
|
This force acts on the particle due to its rotation and is zero for creeping flows |
No previous works have used this force in simulations |
| Saffman lift force |
Eqn (24)
|
This is a lateral force that exists in all non-uniform fluid flows in which shear flow is present and is at least one order of magnitude larger than the Magnus lift force |
35, 37
|
| Shear gradient lift force |
Eqn (26)
|
This force is due to the parabolic velocity profile of fluids in LOD microchannels |
No previous works have used this force in simulations |
| Wall-induced lift force |
Eqn (27) and (28) |
This force is due to the interaction of solid walls of LOD microchannels with suspended particles/cells moving across the walls |
No previous works have used this force in simulations |
| Total lift force |
Eqn (29)
|
This force is the summation of wall-induced lift force and shear-induced lift force |
38
|
| Magnetic force |
Eqn (31)
|
This force only acts on particles with magnetic properties (e.g., magnetic beads can be attached to targeted cells via specific binding to antibodies) |
35–38
|
| Gravity force |
Eqn (32)
|
While applying on all particles, this force can be considered negligible based on the design of microfluidic device and the relative order of magnitude |
No previous works have used this force in simulations |
| DEP force |
Eqn (33)
|
This force acts on particles and cells suspended in a non-uniform electric field |
No previous works have used this force in simulations |
| Acoustic force |
Eqn (34)
|
This force acts on particles and cells suspended in an acoustic field |
No previous works have used this force in simulations |
Some of the forces listed in Table 2 are common to all LOD devices due to the particle/cell-fluid interaction. These forces include centrifugal, added mass, drag, and lift. Although the gravity force applies to every mass, in most of the LOD devices, it can be considered negligible based on the device design and its scale. Magnetic, electric, and acoustic forces are not that common yet, and specific designs are needed for the utilization of these elements within LODs. In the following sections, such forces and their related studies are presented and discussed.
3.3.1. Centrifugal forces.
The centrifugal force is one of the leading forces acting on particles/cells in all LOD devices. As previously mentioned, there are three major forces due to the rotation of a platform: the centrifugal force, the Coriolis force, and the Euler force. Considering a particle with a concentrated mass of mp moving with a velocity of ![[V with combining right harpoon above (vector)]](https://www.rsc.org/images/entities/i_char_0056_20d1.gif) p at a distance r from the rotational center, these three forces can be defined as follows:
p at a distance r from the rotational center, these three forces can be defined as follows:| |  | (16) |
| |  | (17) |
| |  | (18) |
Since in LOD applications, particles are usually submerged in a liquid, we need to take buoyancy into account; for this, we only need to substitute ρp by (ρp − ρf) in eqn (16) to (18).
3.3.2. Added mass force.
When a body moves inside a fluid, an additional fluid-inertia-based loading appears on the body. This is known as the “added mass”, “virtual mass”, or “apparent mass.” This phenomenon occurs as a result of the fluid, which rushes to open the way for the moving body while filling the gap behind it. For a sphere, the apparent mass is a scalar because of the symmetric geometry. eqn (19) is used to calculate the added mass force on a spherical body moving with an acceleration of  :
:| |  | (19) |
Therefore, if external forces acting on a sphere are expressed as ∑![[F with combining right harpoon above (vector)]](https://www.rsc.org/images/entities/i_char_0046_20d1.gif) , the combination of eqn (14) and (19) results in:
, the combination of eqn (14) and (19) results in:| |  | (20) |
Eqn (20) reveals that any submerged sphere (particles or cells) in LOD devices behaves as though its inertia is increased by one-half of the mass of the fluid it moves along the way.74
3.3.3. Drag force.
All moving objects in a fluid flow, experience a deterrent force parallel to the flow direction. This force, known as the drag force, acts on the objects' surface as a result of the pressure and the shear forces.75 Generally, in fluid mechanics, drag force for a moving body can be calculated by eqn (21).76| |  | (21) |
where CD is a dimensionless parameter called the “drag coefficient” and A is the projected area of the moving body (the area on a surface projected to the flow). In many computational simulations in microfluidics, the particles and cells are considered as spheres  . Based on the particle's Reynolds number
  , different values are suggested for the drag coefficient. In Table 3, we list the values of these drag coefficients and the corresponding drag forces.77 These formulas were initially calculated for particles without any rotation. However, Zend et al. used computational simulations to investigate the effects of particle rotation on drag force and concluded that this effect is rather small.78 Thus, the equations in Table 3 can be used for all rotational and non-rotational spherical particles in LOD simulations.
Table 3 Formulas for the calculation of drag force on a particle
3.3.4. Lift force.
There are different kinds of lift forces that can impact a particle's movement in an LOD device. They are typically theoretically calculated for a solid sphere in a fluid flow. In the following sections, four different kinds of lift forces are introduced along with the applicable equations. In the force scaling section (section 3.3.9) their relative importance is discussed in greater detail.
3.3.4.1. Magnus lift force.
When a particle rotates inside a fluid with a uniform flow field and simultaneously rotates with a particular angular velocity, the streamlines around it will change in a way that pressure will increase on one side and decrease on the other side of the particle. This asymmetric pressure distribution due to the particle rotation applies a lateral force on the particle, called the “Magnus lift force.” For a solid sphere rotating in a low Reynolds uniform flow, eqn (22) applies:80,81| |  | (22) |
where ![[V with combining right harpoon above (vector)]](https://www.rsc.org/images/entities/i_char_0056_20d1.gif) f is the fluid velocity,
f is the fluid velocity, ![[V with combining right harpoon above (vector)]](https://www.rsc.org/images/entities/i_char_0056_20d1.gif) p is the particle velocity, dp is the diameter of the particle and
p is the particle velocity, dp is the diameter of the particle and  is the angular velocity of the particle. As depicted in Fig. 7(A), this force is always perpendicular to the relative velocity of the particle and its rotational velocity. In the case of a rotational flow field in which a particle rotates with an absolute rotational velocity of
  in eqn (22) is calculated as:
| |  | (23) |
Although the above equations were derived for low Reynolds flows, Magnus forces do also exist in high inertia flows.80
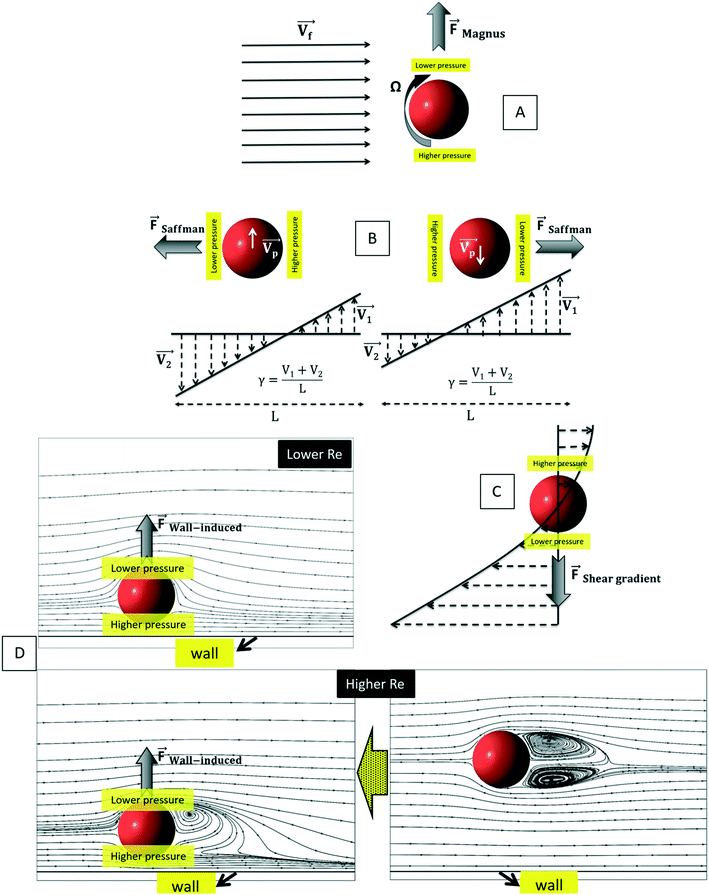 |
| | Fig. 7 The schematic representation of particle undertaking different forces: (A) Magnus lift force, (B) Saffman lift force, (C) shear gradient lift force, and (D) wall-induced lift force (flow patterns copied from90). | |
The Magnus force does not appear in creeping flows (Re ≪ 1) but does appear in all rotating viscous and inviscid fluid flows with a finite relative velocity. The reason for this is that Magnus force appears due to the development of a disturbance in the particle velocity due to the particle's rotation and the fact that inertia is essential for a disturbance to develop in a fluid flow.73,81
3.3.4.2. Saffman lift force.
The calculations for lateral forces on a solid moving sphere in a uniform flow was extended by Saffman and co-workers.82 They used the matched asymptotic expansion method in a simple unbounded shear flow (constant shear rate and zero shear gradient) and found that the shear can apply a lateral force on particles. The difference in velocity and hence, the difference in pressure on the two sides of particles leads to the so-called “Saffman lift force.” Unlike the Magnus force, this force is present even if the particle does not rotate and can be estimated from:83,84| |  | (24) |
where γ is the shear rate, and k is a constant. The correct magnitude of this constant is (k ∼ 1.615),80,81,84 which is reported incorrectly in some references.73,83 In Fig. 7(B), we show the direction of this force, which is always towards the point where the fluid velocity is the largest. For the case of a rotational particle, the following equation applies:81| |  | (25) |
It is worth mentioning that the above equations are valid for very low particle linear and angular velocities under two conditions: either at very low shear or in highly viscous fluids. Furthermore, although shear can cause particles to rotate and hence exhibit a Magnus force, just an algebraic summation of the Saffman and Magnus forces without any empirical corrections can lead to enormous errors.81 As we will learn in section 3.3.9, in these situations, scaling analysis is most revealing. The simple condition of  shows that the Saffman force is at least one order of magnitude larger than the Magnus force.80
3.3.4.3. Shear gradient lift force.
Similarly to what we explained in the previous section, when a particle or a cell moves in a fluid with a parabolic velocity distribution (i.e., variable shear rate), the velocity on the two sides of the particle differs. Consequently, the pressure on the two sides of the particle or cell also varies; thus, as depicted in Fig. 7(C), a force named “shear gradient force” directs the particle towards the higher relative velocity side of that particle. This force is expressed as:85
shows that the Saffman force is at least one order of magnitude larger than the Magnus force.80
3.3.4.3. Shear gradient lift force.
Similarly to what we explained in the previous section, when a particle or a cell moves in a fluid with a parabolic velocity distribution (i.e., variable shear rate), the velocity on the two sides of the particle differs. Consequently, the pressure on the two sides of the particle or cell also varies; thus, as depicted in Fig. 7(C), a force named “shear gradient force” directs the particle towards the higher relative velocity side of that particle. This force is expressed as:85| |  | (26) |
where Vmax is the maximum value of velocity profile in a channel, Dh is the hydrodynamic diameter of channel and CSG is a dimensionless factor that depends on the Reynold number, the particle dimension and the position of the particle.86
3.3.4.4. Wall-induced lift force.
Another kind of lift force is due to the existence of the channel walls in which a small spherical particle moves. In such a case, some different considerations are in order. Firstly, the existence of the solid walls creates a velocity gradient of fluid around the solid particles, which based on the previous explanations about shear gradient lift force, can lead to lifting forces. Moreover, the symmetric flow distribution around the particle can dramatically change due to the nearby walls. This asymmetric pressure distribution can cause a force pushing the particle away from the walls (Fig. 7(D)). One must also consider that in the region between the solid sphere and the wall, fluid flow accelerates, and the pressure changes create a force toward the wall. Takemura et al. demonstrated that the former force is dominant over the latter.87 This dominant force is known as wall-induced lift force, which lets particles to achieve a stable position in a microchannel.
Cox et al., for the first time, analyzed the migration velocity of a spherical particle in a flow field near a single vertical plane wall.88 Subsequently, Vasseur and Cox used a singular perturbation technique to investigate the migration velocity of a spherical particle at low Reynolds numbers nearby a vertical wall.89 They focused on the particles' Reynolds numbers in the range of 0.03 to 0.136. In all cases, a repellent force from the walls on the particles was reported. They suggested eqn (27) for the calculation of the lift force on a particle in a uniform fluid flow of V.90
| |  | (27) |
where

is the scaled distance of the particle from nearby walls, and
CL is the lift coefficient. Zeng
et al. performed a direct numerical simulation to find the effects of a wall near a spherical particle that is moving parallel to the wall's surface.
90 In their simulation, the authors considered Reynolds number in a range from 0.5 to 300, and the particle-wall distance was taken as between 0.75 and 4 times the sphere diameter. The effect of particle rotation on the calculated lift was also investigated, and it was concluded that like the drag force, the effect of lift rotation on particles is rather small. In
Fig. 8(A), we show the wall-induced lift coefficient
CLversus L*, as found in these mentioned studies.
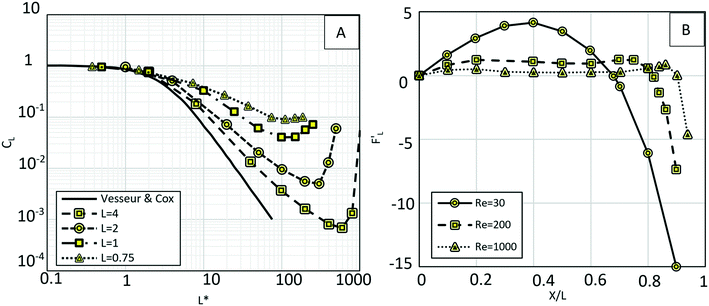 |
| | Fig. 8 (A) Wall-induced lift coefficient CLvs. L*. The thick solid line is related to the analytical results from Vesseur & Cox89 and other lines are related to Zeng et al.'s theoretical analysis90 (B) dimensionless wall-induced lift coefficient.80 | |
Besides eqn (27), the following equation has also been suggested for the calculation of the lift force on particles in near-wall regions.85
| |  | (28) |
where
Vmax is the maximum value of the velocity profile in the channel,
Dh is the hydrodynamic diameter of the channel and
CWI is a dimensionless factor that depends on the Reynold number, the particle dimension, and the position of the particle.
86
For the calculation of the total lift force as the summation of wall-induced and shear-induced lift forces, Asmolov introduced:91
| |  | (29) |
where
γ is the shear rate, and

represents the dimensionless lift coefficient. By substitution of the shear rate as a function of the maximum fluid velocity
Vmax,
eqn (29) transforms to
eqn (30) wherein
Dh is the hydraulic diameter.
| |  | (30) |
In
Fig. 8(B), we show the dimensionless lift coefficient as a function of Re number and dimensionless distance
x from the channel centerline (
L =
Dh/2 in this figure is the half of the channel width).
Shamloo et al. (2018) proposed a mathematical model that generates an accurate simulation for a microfluidic device capable of carrying out particle focusing in LOD devices.38 In Fig. 9(A), we show the geometry of the device made of a serpentine channel on a disc through which flow is generated by centrifugal forces. The authors considered three different serpentine-angles (α in Fig. 9(A) = 75, 85, and 90 degrees) and incorporated three different sizes of polystyrene particles (8, 9.9, and 13 μm). The researchers in this study tried to use a 3D direct numerical solution (DNS) approach by coupling a finite element method solver and a MATLAB code to create a perfect formula for the lift force. The Navier–Stokes and the continuity equations were used to compute the pressure and the velocity fields that surrounded the particles. To ensure that the proposed model was accurate, the mentioned equations were solved using two different approaches of the biconjugate gradient stabilized (BiCGStab) method, and the generalized minimal residual (GMRES) method. The fundamental forces used in the model were the lift force, the drag force (Table 3; Stokes equation), the added mass force, the Coriolis force, and the centrifugal force. They mentioned that using the centrifugal force is a much better option than other methods such as using syringe-pumps, because of the lack of an initial pulse in the liquid propulsion, i.e., replacement of syringe pumps by centrifugal driving force provides a closed fluidic system with a pulse-free inertial liquid propulsion. One shortcoming addressed by the authors, was the effect of secondary flows on particle focusing, i.e., authors in this research considered low-depth microchannels to avoid secondary flows, which can defocus particles. The authors concluded that using α = 75 degrees produces the highest velocity magnitude in the channel. However, the channel with the angle of 90 degrees had the best particle focusing performance compared to channels with 75 and 85 degrees. Fig. 9(B) shows the particles' trajectory under this condition.
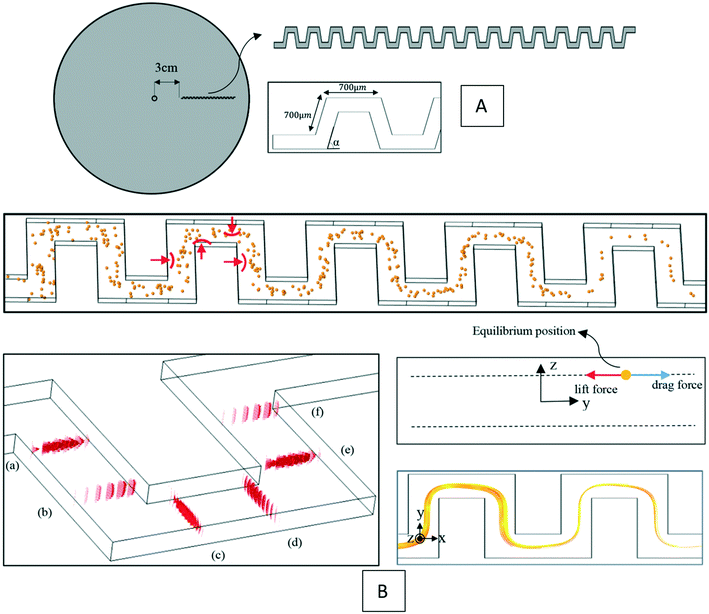 |
| | Fig. 9 (A) The geometry of the LOD device for particle focusing. (B) Secondary flows and particles' trajectory in serpentines channels.38 Reprinted with the permission of AIP Publishing. | |
3.3.5. Magnetic force.
Paramagnetic beads suspended in a fluid can be manipulated by external magnetic fields generated by off-chip permanent magnets. This interaction between the external magnets and suspended beads can be used to control the beads within the fluid flow. Therefore, these particles can be separated or focused on LOD devices. The paramagnetic beads can also be attached to different cells, thus moving them along for cell separation devices.92
Theoretically, the magnetic force can be calculated as:7,93
| |  | (31) |
where
![[B with combining right harpoon above (vector)]](https://www.rsc.org/images/entities/i_char_0042_20d1.gif)
is the magnetic flux density related to the external magnetic field,
xp and
xm are the magnetic volume susceptibility of the particles and the medium, respectively, and
μ0 is the vacuum permeability constant (
μ0 = 1.257 × 10
−6 N A
−2). In
Table 4, we list the magnetic volume susceptibility for some common materials.
Table 4 The list of magnetic volume susceptibility for some common particles and media
| Material |
Blood |
Air |
Water |
Paraffin oil |
Fe3O4 |
Al2O3 |
Silver |
Copper |
Nickel |
Iron |
Graphite |
| Volume susceptibility |
−7.9 × 10⁻⁶ |
3.6 × 10⁻⁷ |
−9.05 × 10⁻⁶ |
−8.8 × 10⁻⁶ |
70 |
−18.1 × 10⁻⁶ |
−2.31 × 10⁻⁵ |
−9.63 × 10⁻⁶ |
600 |
200![[thin space (1/6-em)]](https://www.rsc.org/images/entities/char_2009.gif) 000 000 |
−8.5 × 10⁻⁶ |
| Ref. |
94
|
94
|
94
|
95
|
94
|
94
|
96
|
94
|
94
|
94
|
94
|
Many experimental studies have been carried out on paramagnetic bead manipulation.97,98 However, only a few simulations of such methods exist. Shamloo et al. (2016) presented a computational model of a centrifugal microfluidic device for the separation of neutrophils as the target cells from red blood cells (RBCs) using magnetic beads.35 It is claimed that this method can be used for other cell types as well. The authors used the finite volume method to solve the conservation of mass and momentum together with the particle tracing equation. They considered drag, magnetic, added mass, and Saffman forces in their calculations, and neglected other forces. As seen in Fig. 10(A) and (B), they presented two different kinds of devices, one with two outlet chambers and one with three outlet chambers. A diluted blood sample (RBCs and Neutrophils attached to paramagnetic beads) was the inlet flow for both devices. The device with three outlet chambers could completely separate all target cells with a recovery factor (the ratio of separated target cells to all injected target cells) of 100%. The third chamber in this device is considered to collect all available excess free magnetic beads. In Fig. 10(C), we show the sequential particle tracing and their separation on the LOD.
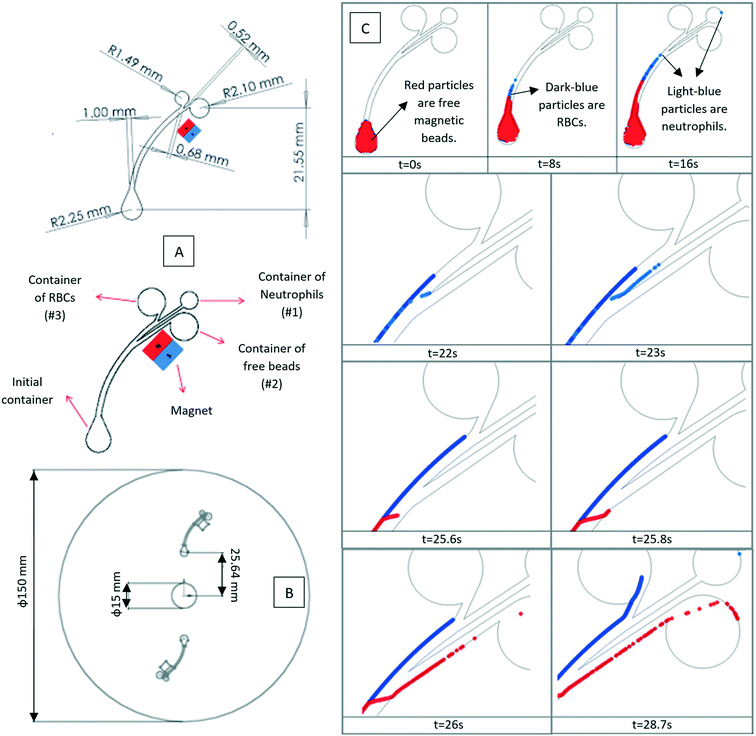 |
| | Fig. 10 (A) The geometry and dimension of the LOD device with two and three outlet chambers, (B) the location of the channels on a disc, and (C) the sequential location of neutrophils (light blue), RBCs (dark blue) and free magnetic beads (red).35 Reprinted with the permission of IOP Publishing. | |
Grumann et al. (2005) used magnetized beads in a circular chamber to enhance batch-mode mixing on an LOD device.36 In Fig. 11(A), we show a schematic view of the system with two inlets, a circular chamber, and an air vent. To identify the best position for the magnets, the authors performed simulations on the magnetic beads' trajectory within the device. In this way, they experimentally investigated the value of (![[B with combining right harpoon above (vector)]](https://www.rsc.org/images/entities/i_char_0042_20d1.gif) ·∇)
·∇)![[B with combining right harpoon above (vector)]](https://www.rsc.org/images/entities/i_char_0042_20d1.gif) for permanent bar-shaped magnets. According to the linear correlation of magnetic force and (
for permanent bar-shaped magnets. According to the linear correlation of magnetic force and (![[B with combining right harpoon above (vector)]](https://www.rsc.org/images/entities/i_char_0042_20d1.gif) ·∇)
·∇)![[B with combining right harpoon above (vector)]](https://www.rsc.org/images/entities/i_char_0042_20d1.gif) , the authors concluded that the magnet ends should be placed near the central region of chambers. In Fig. 11(B), we show the value of
, the authors concluded that the magnet ends should be placed near the central region of chambers. In Fig. 11(B), we show the value of ![[B with combining right harpoon above (vector)]](https://www.rsc.org/images/entities/i_char_0042_20d1.gif) for an arrangement of eight permanent magnets. For the calculation of magnetic beads' trajectory, these authors considered three forces in the particle tracing formula, namely the magnetic force, the centrifugal force and the Stokes drag force. These forces are shown in Fig. 11(A). Moreover, a specific optimal range for the velocity and the rotation frequency was determined for the LOD. The optimal frequency was calculated to be around 6.5 Hz, which closely matches the experimental evidence that suggested an optimum range of 5–7 Hz validating the model's accuracy. At speeds above and below this frequency, either the magnetic or the centrifugal force dominated the other's effect, thus diminishing the impact of the beads on the overall fluid mixing.
for an arrangement of eight permanent magnets. For the calculation of magnetic beads' trajectory, these authors considered three forces in the particle tracing formula, namely the magnetic force, the centrifugal force and the Stokes drag force. These forces are shown in Fig. 11(A). Moreover, a specific optimal range for the velocity and the rotation frequency was determined for the LOD. The optimal frequency was calculated to be around 6.5 Hz, which closely matches the experimental evidence that suggested an optimum range of 5–7 Hz validating the model's accuracy. At speeds above and below this frequency, either the magnetic or the centrifugal force dominated the other's effect, thus diminishing the impact of the beads on the overall fluid mixing.
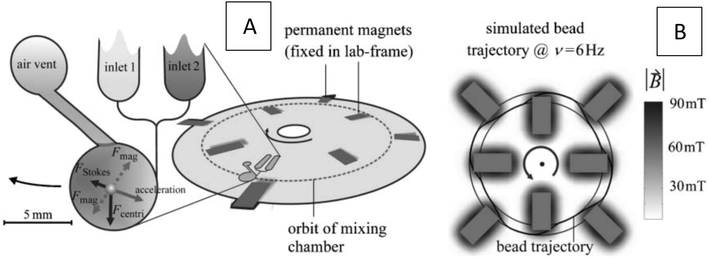 |
| | Fig. 11 The concept of the centrifugal microfluidic platform utilizing permanent magnets. (A) Position of eight permanent magnets on the disc and schematic of forces on a particle. (B) Computed trajectory of magnetic beads while rotating.36 Reproduced with permission from the Royal Society of Chemistry. | |
Recently, Shamloo et al. (2019) used the magnetic force for a negative magnetophoretic cell separation.37 In a finite element model, these authors considered EMG-408 as a ferrofluid to sort blood cells based on their sizes. They also used a micromixer to mix the diluted blood sample by the ferrofluid quickly. Fig. 12(A) shows the entire device and its dimensions. In the particle separation simulations, the drag force, the Saffman lift force, the centrifugal force, and the magnetic force were utilized with three different particle sizes of 6 μm, 12 μm, and 22 μm, equivalent for the red, white, and abnormal blood cells (like CTCs), respectively. As demonstrated in Fig. 12(B), according to the simulations, the normal cells are separated from abnormal cells with an efficiency of ∼100%. Although, in reality, the efficiency may decrease, this computational simulation can sharply reduce the number of trial and error experiments.
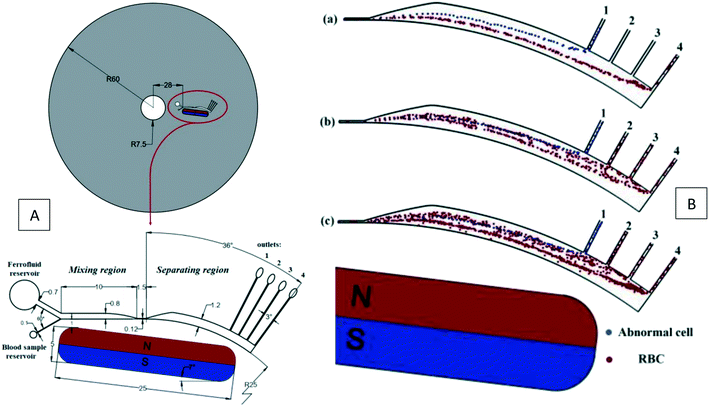 |
| | Fig. 12 (A) Geometry, dimensions (in millimeters), and schematic view of the magnetic aided device for cell separation. (B) Particle tracing in the LOD device.37 Reprinted with the permission of IEEE Publishing. | |
3.3.6. Gravity force.
Another force that can affect particles and cells in LOD devices is the gravity force. For a particle with a concentrated mass of mp, the magnitude of this force is calculated as:| |  | (32) |
where ![[g with combining right harpoon above (vector)]](https://www.rsc.org/images/entities/i_char_0067_20d1.gif) is the constant acceleration of gravity. For typical LOD devices, similar to what we mentioned in section 3.3.1 for centrifugal forces, we should take the buoyancy effect into account and replace ρp by (ρp − ρf) in eqn (32).
is the constant acceleration of gravity. For typical LOD devices, similar to what we mentioned in section 3.3.1 for centrifugal forces, we should take the buoyancy effect into account and replace ρp by (ρp − ρf) in eqn (32).
Based on the device design and the force scaling discussed in section 3.3.9, the gravity force can often be neglected in the analysis of LOD devices. To the best of our knowledge, there is not any computational simulation of LOD devices using gravity force. However, to highlight the potential of this simple force for particle separation in LOD devices, consider Fig. 13, where we show two different experimental studies taking advantage of this force. In Fig. 13(A), we illustrate the study by Galvin et al. (2013), who used channels inclined at θ = 70° to the axis of rotation.99 In these devices, as the lift force exceeds the weight buoyancy force, particles separate from the surface and expose to higher local fluid velocity and convey to the overflow. Researchers in this study used different types of particles, such as coal and silica ultrafine particles, with satisfactory results. In another study, Yeo et al. (2015) used a swinging bucket with a special microchannel structure on a centrifugal disc.100 This way, they could affect the rapid and label-free separation of particles. As shown in Fig. 13(B), they used a microfluidic device with two inlets, two outlets, and a separation channel in which particles are separated based on their size. The difference between the two inlets was just the channel length, and hence different fluid flows due to the different hydrodynamic resistance. The basic separation in this device occurs during the short transition of the bucket from its horizontal to its vertical position (in the first 2 s of rotation). Then after about 10 s rotation, the separated particles go into two different outlets. With this device, this team managed to separate a mixture of 2 and 20 μm particles with an efficiency above 90% and MCF7 cells from a blood sample with an efficiency of 75%.
 |
| | Fig. 13 Some examples of devices using gravity force for particle separation. (A) The schematic view of the centrifugal device with inclined plates.99 Reprinted with permission from Elsevier. (B) The schematic of an LOD device with a swinging bucket structure.100 Reprinted with the permission of AIP Publishing. | |
3.3.7. Dielectrophoresis force (DEP).
Another force that can be utilized for particle separation in LOD devices is the DEP force. DEP is the induced movement of particles/cells due to dielectric differences between fluid and particles in a non-uniform electric field. The DEP force on a spherical non-conducting particle can be calculated as:101| |  | (33) |
Here, εf is the dielectric constant of the fluid,  and
and  are the complex dielectric permittivity of the fluid and particle, respectively defined by
  , where σ is the electrical conductivity and j2 = −1. Depending on the relative polarizability of fluid and particle, particles move differently. In the case that medium is more polarizable than the particles, particles move toward the lowest electric field (negative DEP), and in case the particles are more polarizable than the fluidic medium, they move toward the highest electric field (positive DEP).102,103
The DEP force has mostly been studied in non-centrifugal devices,64,104 and is rarely used in the LOD. To the best of our knowledge, there is not any computational simulation of LOD devices using DEP force for particle separation. However, to show the possibility of this force on LOD devices, in Fig. 14, we show an experimental set-up by Martinez-Duarte et al.105 As depicted in Fig. 14(A), for electrifying the disc, a slip ring is used. Then in a very simple microfluidic geometry [Fig. 14(B)] a DEP filter is put in the middle of a microchannel between the inlet and outlet chambers. Researchers in this study used 3D carbon structures instead of traditional planar metal electrodes to filter the particles of interest. As a case in point, they could separate yeast cells from latex particles with an efficiency of 100%.
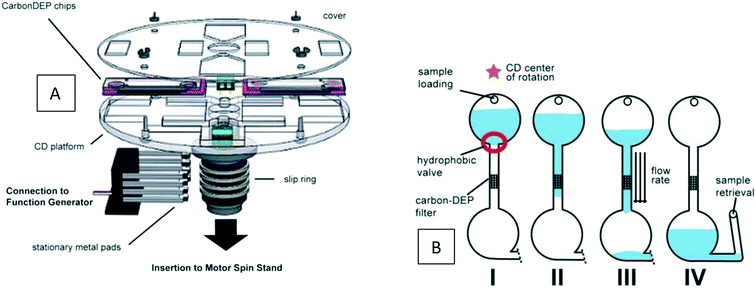 |
| | Fig. 14 Using DEP force for particle separation on a disc. (A) Different parts of the device for doing DEP filtration. (B) The sequence of passing of the sample through the DEP filter.105 Reproduced with permission from the Royal Society of Chemistry. | |
3.3.8. Acoustic force.
The last force we discuss here is the acoustic force. The momentum transferred by acoustic waves applies a radiation force on suspended particles.106 The motion of particles resulting from this force is called acoustophoresis, and it may play a crucial role in on-chip cell/particle separations.107,108 Most of the simulations in which acoustic waves are used for particle separation have focused on surface acoustic waves (SAW) on non-centrifugal platforms.109,110
The theory by which acoustic force is calculated is based on perturbation expansion of pressure, velocity, and density of the fluid in acoustic media. By using the scattering theory, this force on small particles can be calculated by using the acoustic potential energy given by eqn (34) to (37):111
| | ![[F with combining right harpoon above (vector)]](https://www.rsc.org/images/entities/i_char_0046_20d1.gif) Rad = ∇URad Rad = ∇URad | (34) |
| |  | (35) |
| |  | (36) |
| |  | (37) |
where
p is the external pressure of the acoustic field,
Vin is the incident particle velocity,
kp is the compressibility of the particle, and
kf is the compressibility of the fluid (

where
cf is the speed of sound in the fluid). In
eqn (35), the line over expressions are time averages over one period, and
p and
Vin are calculated by solving the following wave equation:
109,111| |  | (38) |
| |  | (39) |
To the best of our knowledge, there is not any experimental study or computational simulation of LOD devices using acoustophoresis. Hence, researchers looking for a virgin territory may want to focus on this intriguing approach.
3.3.9. Scaling of different forces in centrifugal microfluidic devices.
In the previous sections, different forces applicable to particle separation and focusing on LOD devices were explained in detail. In both experimental and theoretical studies, including computational simulations, a key point is always to get a handle on the relative magnitude of different forces at play in a given application. To that end, in Table 5, we list several forces applicable to LOD devices with their force types and their magnitudes.
Table 5 Different forces in LOD devices and their magnitudes
| Force |
Force type |
Magnitude |
| Force |
Force compared to centrifugal force |
|
The total lift force is used here. When it comes to the comparison of different lift forces, we should notice that the Saffman force is at least one order of magnitude larger than the Magnus force, as stated in section 3.3.4.2. Hence in certain situations, the Magnus force can be omitted in comparison to the Saffman force.80
|
| Centrifugal force |
Body force |
F
c ∝ mprω2 |
1 |
| Coriolis force |
Body force |
F ∝ mpVpω |

|
| Euler force |
Body force |

|

|
| Added mass force |
Surface force |

|

|
| Drag force |
Surface force |
F ∝ μfdpVf |

|
| Lift forcea |
Surface force |

|

|
| Magnetic force |
Body force |

|

|
| Gravity force |
Body force |
F ∝ mpg |

|
| DEP force |
Body force |

|

|
| Acoustic force |
Surface force |

|

|
Since the centrifugal force is the most important force in any LOD device and since it plays such a crucial role, all the different forces from Table 5 are compared with this force and are listed in a separate column. In this way, one can quickly ascertain which parameters mighty compete for dominance against the centrifugal force. As a case in point, according to Table 5, the earth's gravity force is not important at high rotational speeds. According to Fig. 15, based on the radial distance for rotation, it could start playing a role at very low rotational speeds (∼30 rad s−1).
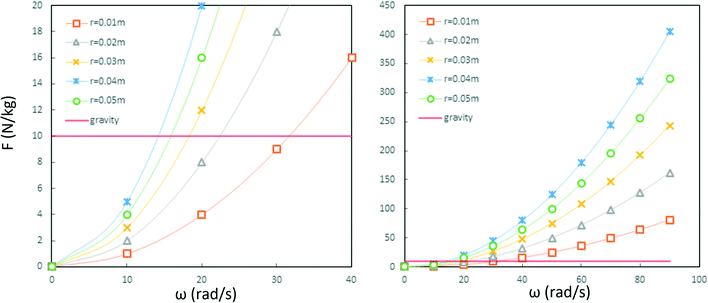 |
| | Fig. 15 The comparison of the centrifugal force and the gravity force per unit mass of particles in LOD devices. The left diagram is the magnification of the right one near the origin. As it is depicted, the intersection of the solid red line and the curves show the angular velocity in which centrifugal force and gravity force have equal magnitudes. | |
4. Two-phase flows in centrifugal microfluidic devices
In multiphase flows, two or more phases flow together, e.g., the flow of water droplets in an oil-filled microchannel. Within these flows, phases are classified as the continuous phase and the dispersed phase. The former refers to the fluid, which continuously occupies connected regions of space, and the latter refers to the liquid, which occupies disconnected regions of space. Among microfluidic devices using two-phase flows, we can find some well-known structures which are usually used to generate droplets. Fig. 16 shows three different conditions of droplet generation in three different common structures; coaxial, flow-focusing, and T-junction microfluidic devices. These conditions are usually referred to as “two-phase flow regimes”.112
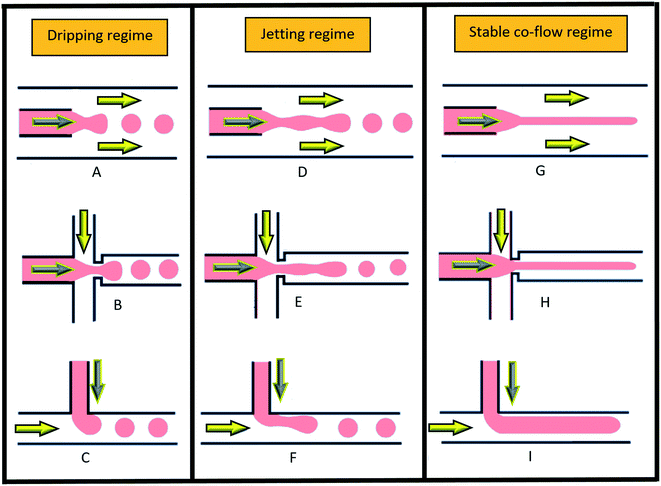 |
| | Fig. 16 Three different regimes of droplet generation (A–C: dripping, D–F: jetting and G–I: stable co-flow) in three different common structures; coaxial, flow-focusing, and T-junction microfluidic devices. Yellow arrows show continuous and grey arrows show dispersed phase flows (schematic figures from ref. 112). Reprinted with the permission of IOP Publishing. | |
To describe such regimes, the capillary number (eqn (40)) of the continuous phase and the Weber number (eqn (41)) of the disperse phase are the two important dimensionless numbers to consider. The former refers to the ratio of the viscous force to the interfacial tension, and the latter refers to the ratio of the inertial force to the interfacial tension.43,113 Droplet generation takes place in the dripping phase in which interfacial tension dominates with both CaCP and WeDP relatively small. When the viscous force or the inertial force overcomes the interfacial force, then the stable regime starts and droplets stop forming.43
| |  | (40) |
| |  | (41) |
where
VCP is the velocity of the continuous phase,
VDP the velocity of the disperse phase,
σ is the interfacial tension between the two phases,
ηCP is the viscosity of the continuous phase,
ρDP is the density of the dispersed phase, and
L denotes the characteristic dimension of the system.
When working on droplet formation on a disc, the comparison of the centrifugal force and the interfacial tension force is most important. According to eqn (42), the Eötvös number (Eo number) or Bond number (Bo number) is defined based on the ratio of these two forces.114
| |  | (42) |
where
ρd is the difference between the dispersing and the continuous phase densities,
r is the radius from the rotation center and
ω is the rotation speed. Droplet movement can be controlled by adjusting the Bond number, which itself is adjustable based on the characteristic length L (
e.g., the nozzle size) and the rotational speed.
44
Besides, the droplets shown in Fig. 16, multiphase flows can exhibit other different morphological configurations, which are called “flow patterns” of the multiphase flow. Knowing these patterns is important for choosing the appropriate simulation model. In Fig. 17, we show these different patterns, and their schematic together with the pertinent computational models for their simulation.115
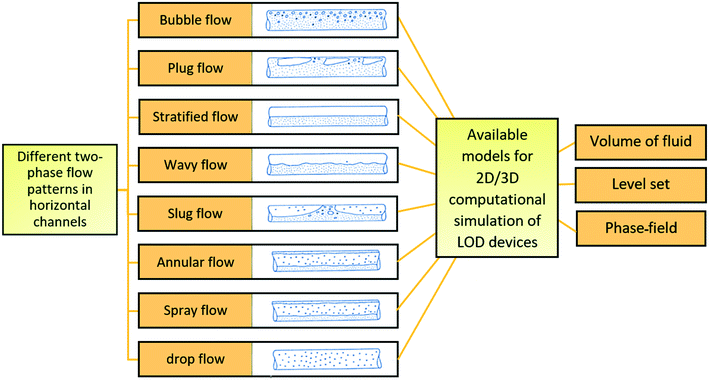 |
| | Fig. 17 Different two-phase flow patterns in horizontal channels (schematic figures from ref. 115) and the methods used in literature to simulate two-phase flows in LOD devices. | |
As we show in Fig. 17, three specific models are potentially applicable in two-phase flows in LOD devices: volume of fluid (VOF), level set, and phase-field. All of these two-phase methods are time-consuming since they need small time-steps to track the behavior of the meniscus.42 Since LOD devices are not stationary platforms, it is not easy to capture all the detailed phenomena, even under powerful microscopes. For this reason, building detailed two-phase simulations is well worth it. Otherwise, if the purpose is only to deduce more general design parameters such as valve sizes, using network simulation (discussed in the next section) might be the way to proceed.
According to previous computational studies in literature, the VOF model is the most popular two-phase computational model. In this model, one equation for the conservation of mass and one equation for the conservation of momentum are needed.43,116 The following equations from the VOF model are for incompressible two-phase fluids on a rotating reference frame.43
| |  | (43) |
| |  | (44) |
| | | ρf = αCPρCP + (1 − αCP)ρDP | (45) |
| | | μf = αCPμCP + (1 − αCP)μDP | (46) |
where
![[V with combining right harpoon above (vector)]](https://www.rsc.org/images/entities/i_char_0056_20d1.gif) f
f is the flow velocity,
αCP and
ρCP are the volume fraction and density of the continuous phase, respectively, μ
DP is the dynamic viscosity of the dispersed phase, and
![[r with combining right harpoon above (vector)]](https://www.rsc.org/images/entities/i_char_0072_20d1.gif)
denotes the radial vector from the center of rotation. The source term due to the rotation is composed of three contributions: centrifugal, Coriolis, and the Euler terms, respectively, as shown in
eqn (44). The last term on the right-hand-side of
eqn (43) is the term related to the surface tension force, which is not considered in some of the previous computational studies in the literature.
41,42 The phase interface interface in this model can be tracked by solving the continuity
eqn (47) for volume fraction.
| |  | (47) |
For two-phase flows, it is not needed to solve this equation for all phases since it can be calculated from the fact that the summation of all volume fractions is always equal to unity.
Eqn (48) is used to calculate the volume fraction of the dispersed phase
αDP for two-phase flows.
| |  | (48) |
The level-set method is another method for the simulation of two-phase flows, which can avoid smearing of the fluids interface and can monitor the interface between the phases more precisely than the VOF model. In this method, the interface is detected as the zero value of a level set scalar parameter known as
ϕ. This parameter can be defined as
eqn (49).
115| |  | (49) |
For the evaluation of this level-set parameter, an advection equation must be solved;
115| |  | (50) |
For the condition in which some slug fluids are to be mixed, other models are more appropriate, including the coupling of Navier–Stokes equations with the phase-field equations. In comparison with the level-set model, this model involves more computational and time costs. The coupled equations in the phase-field model are presented as
eqn (51) to (55). Besides those equations, the conservation of mass (
eqn (10)) must also be considered.
44,117| |  | (51) |
| |  | (52) |
| |  | (53) |
| |  | (54) |
| |  | (55) |
where
β is the phase-field variable (
β = 0 at the phase interface and
β = ±1 at each of the two phases),
ε is the capillary width (based on the element size),
ψ is the chemical potential,
ψ∇
ϕ is the capillary force and
M is the mobility coefficient.
λ in
eqn (53) represents the mixing energy density, which can be calculated based on the surface tension using
eqn (56).
44,118,119| |  | (56) |
As mentioned before, VOF is the most popular computational method in two-phase LOD devices. Silva
et al. used this model for capillary valves.
119 Later, Mark
et al. (2011) used the control volume method to simulate the fluid behavior of centrifugo-pneumatic valves.
39 These valves were located at the end of a normal metering unit. Using this model, they investigated the detailed behavior of the fluid burst frequencies as well as the air pressure–time variation in the outlet chamber. Volume fraction contours, together with the air pressure variation, are shown in
Fig. 18(A). Later, Kazemzadeh
et al. (2015) used this model to study a mechanism of guided routing capillary valves.
40 As shown in
Fig. 18(B), two extended microchannels are attached here to a conventional capillary valve,
i.e., an auxiliary inlet and an auxiliary outlet. If the rotational speed is less than the burst frequency, then the fluid does not enter the chamber. However, if the rotational frequency exceeds the second burst frequency (burst frequency of the capillary of the auxiliary outlet) and is below the first frequency (burst frequency of the capillary before the auxiliary inlet), the fluid goes through the auxiliary outlet on the left. If the rotational frequency exceeds the first burst frequency, then the fluid goes directly to the chamber on the right (towards the Coriolis force). As represented in
Fig. 18(C), the control volume-based VOF model captured the details of meniscus behavior as a function of time. Later on, as discussed previously, Naghdloo
et al. (2017) simulated conventional capillary and siphon valves on a rotational platform.
34 The simulation was carried out using the finite element method with a level set approach. Although this model is less accurate than the phase-field model, the lesser computational cost somewhat compensates for this shortcoming.
34
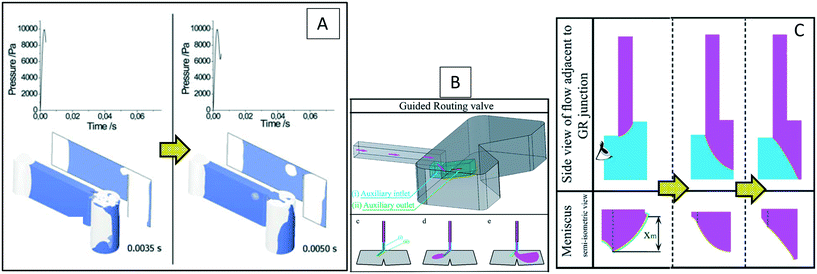 |
| | Fig. 18 (A) Volume fraction contours together with air pressure variation in a centrifugo-pneumatic valve on an LOD device.39 Reprinted by permission from Springer Nature. (B) Guided routing capillary valve mechanism presented by Kazemzadeh et al. depending on the magnitude of rotational speed, fluid can be stuck, flow left or flow right.40 Reproduced with permission from the Royal Society of Chemistry. (C) The contours show the sequential meniscus movement in the side and front views.40 Reproduced with permission from the Royal Society of Chemistry. | |
Fig. 19(A) and (B) show two different experimental studies in which VOF models are used to capture the detailed behavior of the meniscus of liquids. Fig. 19(A) is related to the investigation of the uniform filling of a microchamber. Uniform bubble-free chamber filling is essential in some applications like gene amplification and detection.42 As the purple volume fraction contours indicate, the computational simulations predict the fluid behavior with an acceptable error. Recently, Fakhri et al. (2019) used the VOF model to extract more details of liquid behavior in a particular type of microchamber.41 As shown in Fig. 19(B), they reported that by deceleration, the fluid passes through the small throat between the two connected chambers. Their model, based on the control volume method, showed good agreement with the experiments. Their model also provided velocity and pressure distributions of fluid inside the chamber, which were not easy to capture experimentally.
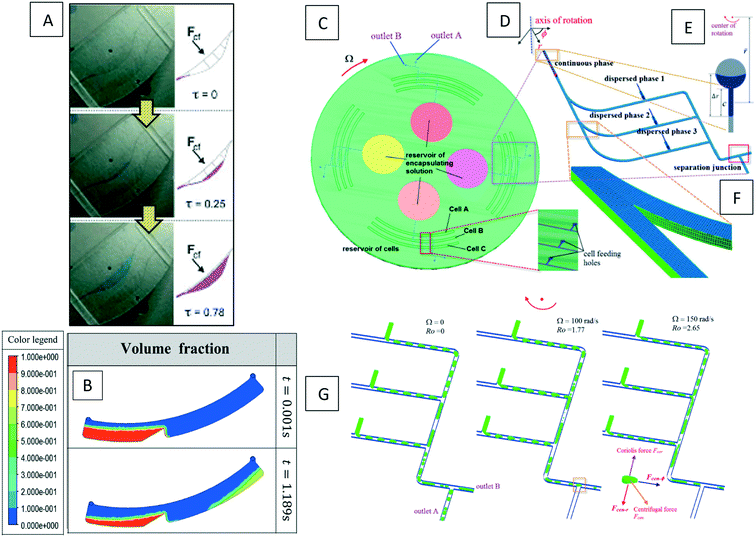 |
| | Fig. 19 (A) Sequential comparison of the experimental (left column) and computational (right column) results for filling a microchamber.42 Reproduced with permission from the Royal Society of Chemistry. (B) Contours of volume fraction in two different times during deceleration in specifically connected chambers.41 Reprinted by permission from Springer Nature. (C) Schematic of the multiphase system presented by Ren et al.43 (D) Schematic of the computational domain.43 (E) Close-up view of the thread of continuous phase as indicated in blue progressing along the microchannel after being pumped from the reservoir.43 (F) Close-up view of general mesh grids of the junction.43 (G) The sedimentation of cell-encapsulated droplets at the separation junction.43 Reprinted from MDPI. | |
Besides the above studies, there are also a few pure computational investigations on LODs using the VOF model. Ren et al. (2016) presented a 3D model of a centrifugal device for the emulsification and separation of different cells.43 According to Fig. 19(C) to (F), the system comprises a two-layer structure. The top layer has truncated chambers containing different cell types and culture medium as the dispersed phase. The bottom layer features circular chambers for an encapsulating solution as the continuous phase. For simplicity, the authors neglected the effect of gravity on the process of droplet formation and sedimentation. They utilized the VOF method, and the overall governing equations were discretized to algebraic expressions through the finite volume method. Furthermore, the droplet behavior was accounted for by using the pressure-implicit with the splitting of operators (PISO) algorithm, and a piecewise linear interface construction (PLIC) strategy was used for the interfacial tension calculations. The model was corroborated by comparing it to experiments. The average velocity was calculated by taking into consideration the rotational speed, the radial location of the fluid reservoirs, and the channel geometry. The solution captured merged droplets with an error of 3% in surface area compared with the experimental data. As the last step, shown in Fig. 19(G), the authors used the ratio of centrifugal force to Coriolis force for droplet separation near the outlet of the device.
The phase-field method has been used only in a few studies. Lin et al. (2010), for example, used the phase-field method to study bifurcation in LOD devices.120 This geometry, which is shown in Fig. 20(A), is of particular use in CD-based enzyme-linked immunosorbent assays (CD-ELISA). The authors defined the different parameters shown in this figure and then used analysis to capture their effects. The effect of the geometry parameter S on the flow ratio A/B (shown in the schematic figure) was also depicted for three different partition plates. They also carried out experiments, which confirmed their simulations. Later, Liu et al. (2019) used the same method to better optimize the mixing process in droplet microfluidic devices.44 They focused on investigating the effect of the Re and Bo numbers. These authors designed a mathematical model for the interaction and advection of droplets in 2D space. They focused on the impact of Bo and Re numbers on the mixing quality while all other parameters remained constant. In this particular model, both Coriolis and Euler forces were taken into consideration; the model was run using the finite element method. To simulate the distribution of two bubbles once they have collided, the particle tracking method was utilized within the droplets. The phase-field method was used to simulate the slug-like motion of a droplet A moving from a channel to a chamber and a droplet B that remains in a fixed position. The reported results show a high degree of advection as the Reynolds number ascends to the hundreds, and so does the chaotic behavior of droplet A. In Fig. 20(B), we show a schematic view of the geometry and the initial position of droplet A (entering the chamber from the lower channel) and droplet B in the chamber. The process of collision of droplets is also illustrated in Fig. 20(C).
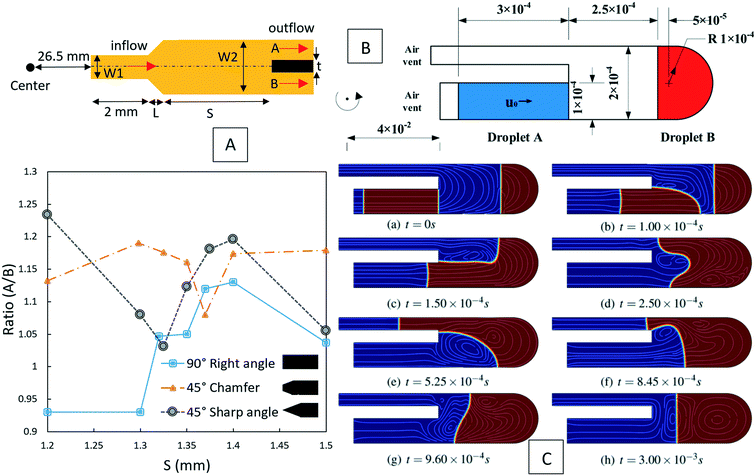 |
| | Fig. 20 (A) Schematic view of bifurcation studied by Lin et al. with corresponding parameters. They used this simulation to do many parametric studies. One of these geometric parameters, as the ratio of two flows versus S is shown for three different partition plate angles.120 (B) The geometry and initial condition of droplets A and B considered by Liu et al.44 Reprinted with the permission of AIP Publishing. (C) Collision process of the droplets in an LOD device.44 Reprinted with the permission of AIP Publishing. | |
Alongside the comprehensive computational studies for droplet-based LOD devices reviewed above, some other researchers have used simple mathematical models to predict droplet behavior in LOD experimental analysis. Wang et al. (2013) considered an LOD device, including a big channel (Fig. 21(A)).121 An immiscible water-based droplet was suspended in an oil medium in a way that the water density was higher than the oil density. They used the simple centrifugal force formula (eqn (2)) and replaced ρf (fluid density) with Δρ = ρcontinuous phase − ρdispersed phase. In this way, the force can adapt different directions according to the sign of Δρ; it is outward for a water droplet (Δρ < 0) in oil and inward for air bubbles (Δρ > 0) in oil. They described how the physical dynamics of this concept could be modeled in the same way as the normal case of a droplet in the air but by replacing the droplet density ρ with ρwater − ρoil and the surface tension σ with the interfacial tension σwater–oil. Then by balancing the centrifugal force and the drag force, they calculated the terminal velocity V of the droplet as:
| |  | (57) |
where
d is the droplet diameter and
Cd is the drag coefficient. As depicted in
Fig. 21(A); this technique was used to eliminate air bubbles from a PCR process. For thermal cycling in this study, researchers used two heaters, at 60 °C and 95 °C together with a mechanical structure, including a permanent magnet with a spring to move the droplets between these two heaters (
Fig. 21(B)). They did not provide any mathematical model for this part of the LOD but mentioned that at high speeds (1000 rpm), the centrifugal force on a small metal attached to heater A, could overcome the magnetic and spring forces. In this way, by changing the rotational speed, the configuration of the device changes, and the droplet moves between the two heaters for thermal cycling. Five years later, Wang
et al. proposed another mechanical structure to affect the movement between the two temperature zones.
122 They used the Euler force for droplet generation, metering, and droplet manipulations. The system is shown in
Fig. 21(C). As seen here, the whole LOD device is able to rotate around a center O, but the rectangular chip (grey in this figure) is also able to rotate around point O′. Two stop nuts restrict the chip swinging beyond angles
α0 and –
α0. They calculated the potential energy of the swinging structure based on a simple dynamic analysis. As shown in
Fig. 21(C), this is an even function of the swinging angle. Since the Euler force is in the
r′ direction, the swinging is induced by the momentum balance of centrifugal and Euler forces around point o′. As depicted in the corresponding diagrams for these two forces, at a speed of 300 rpm and an acceleration of 3000 rpm s
−1, swinging kicks in. The relation between acceleration and speed is given as:
| |  | (58) |
where S is the whole chip area, and the other parameters are shown in
Fig. 21(C). The researchers also used this method for two specific applications of DNA purification and Bradford assay.
122
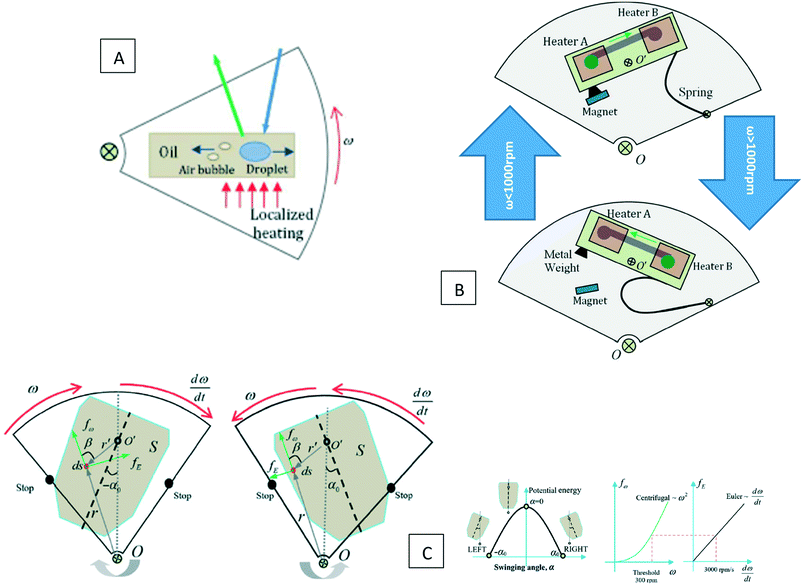 |
| | Fig. 21 (A) Schematic view of a big oil chamber, including air bubbles and water droplets. The forces acting on the air bubbles and water droplets are different.121 Reproduced with permission from the Royal Society of Chemistry. (B) Two configurations of the device at high speeds (>1000 RPM), the centrifugal force acting on the metal weight overcomes the magnet and spring forces.121 Reproduced with permission from the Royal Society of Chemistry. (C) Binary state on an LOD device that is able to swing around axis O′. the diagram of potential energy shows an even functionality of the swinging angle. This device works based on the balance of centrifugal and Euler forces, which, according to the theoretical diagrams, happened at 300 rpm and 3000 rpm s−1 in this work.122 Reproduced with permission from the Royal Society of Chemistry. | |
The detailed computational analyses explained in the previous sections are not necessarily straightforward. Although they can provide in-depth information about the phenomena in all the different unit operations, they need highly trained users with a background in programming and enough run time. This run time is normally dependent on the physics and computational domain and differs case by case; normally, single-phase simulations are much quicker than multiphase simulations, and the larger the computational domain, the more time-consuming the simulations are.
5. Network simulation in LOD devices
Oh et al. (2012) introduced network analysis to pressure-driven microfluidic devices.123 Fluid network simulation is analogous to electronic circuit simulation, and each fluidic element has an analog in an electrical network. In Table 6, we summarize the analogy between fluidic and electric components.123,124
Table 6 A quick review of the analogy between microfluidic devices and electric circuits for important parameters123,124
| Microfluidic devices |
Electronic circuits |
| Volumetric flow rate Q [m3 s−1] |
Electric current I [A] |
| Pressure drop Δp [Pa] |
Voltage drop ΔV [V] |
| Hydraulic resistance RH [Pa s3 m−1] (values are listed in Table 7 for common channel shapes) |
Electric resistance RE [Ω] |
| Hagen–Poiseuille's law: Δp = pin − pout = Q·RH |
Ohm's law: V = I·RE |
| Microchannel segment (fluidic resistor) |
Conductive wire (electric resistor) |
| Source-inlet and drain-outlet ports |
Input and output terminals |
| Equivalent series-connected fluidic resistors: RH,eq = RH1 + RH2 |
Equivalent series-connected resistors: RE,eq = RE1 + RE2 |
| Equivalent parallel-connected fluidic resistors: RH,eq = (RH1 × RH2)/(RH1 + RH2) |
Equivalent parallel-connected resistors: RE,eq = (RE1 × RE2)/(RE1 + RE2) |
| Independent, constant fluid flow source |
Independent, constant current source |
| Independent, constant pressure source |
Independent, constant voltage source |
| Atmospheric pressure patm |
Earth or floating ground (GND) |
| Law of mass conservation: ∑Qn = 0 at a node |
Kirchhoff's current law (KCL): ∑In = 0 at a node |
| Law of energy conservation: ∑pn = 0 in a closed path |
Kirchhoff's voltage law (KVL): ∑Vn = 0 in a closed path |
| Hydraulic capacitance CH [m3 Pa−1]: ΔQ(t) = CH dp/dt (ΔQ: stored volumetric flow rate change) |
Electric capacitance C [F]: I(t) = CE dV/dt |
Table 7 Different formulas for pressure terms in LOD microchannels and chambers together with important points for each formula. L is the liquid-filled length inside a channel and its projection on radial and iso-radial directions are lr and li, respectively. r is the distance of the center of rotation to the farthest point of radial or iso-radial channel. w and d are the width and depth of the rectangular channels, respectively. θ is the contact angle, q is the flow rate, R is the universal gas constant, n is the amount of air trapped in a closed chamber, and T is the temperature
|
|
Model component |
Formula |
Required parameters/constants |
Ref. |
| Microchannel models |
Centrifugal pressure |

|
This pressure should be considered only for radial channels. For iso-radial channels due to channel walls, it is negligible |
45, 47, 125
|
| Euler pressure |

|
This pressure should be considered only for iso-radial channels. For radial channels due to channel walls, it is negligible |
45, 47, 125
|
| Inertial pressure |

|
This pressure should be considered for both radial and iso-radial channels |
45, 47, 125
|
| Viscous dissipation |
p
visc = Rhydq |
This pressure should be considered for both radial and iso-radial channels |
45, 48, 47, 106
|
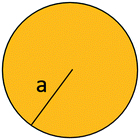
|

|
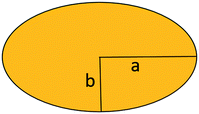
|

|

|

|

|

|

|

|
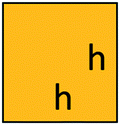
|

|

|

|
| Capillary pressure |

|
For completely filled or empty channels this pressure does not play a role. In partially filled channels, this pressure could be positive or negative based on the direction of filling |
45, 47, 48, 125
|
| Chamber models |
Centrifugal pressure |

|
— |
125
|
| Euler pressure |


|
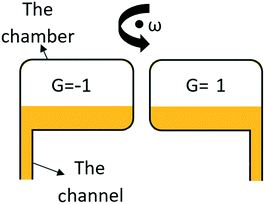
|
125
|
| Pneumatic pressure of air/pneumatic pressure of vapor |


|
C
1 = 610.78 PaC2 = 17.08085C3 = 234.175 K |
125
|
| Volume change due to material compliance |
V
chamber = B0 + B1Δp + B1Δp2 |
— |
125
|
| Fluid volume stored in a certain time |

|
— |
47
|
For cases where a highly detailed analysis of all phenomena is not the target, network simulation represents an alternative method for an overall, quick analysis. Although it is quick and straightforward, only design parameters like fluid flow rate, geometric dimensions, pressure, and valving events can be established. In other words, it is not an applicable method for some unit operations like cell/particle separators. Another shortcoming of this method is its one-dimensionality, i.e., until now, network simulations of LOD devices in 2D and 3D computational domains have not been undertaken.
An important application of network simulation is in the design of micromixers. In case a buffer (flow rate QB and concentration CB) is mixed with a sample (flow rate QS and concentration CS), the volumetric concentration value after full mixing (C) can be calculated as:
| |  | (59) |
If convection is negligible, for a complete mixing in a liquid with diffusion coefficient D, time  is required (w = channel width), which is corresponding to mixing length
  with a uniform flow velocity U. This length could be used as a handy criterion of mixing channels in microfluidic devices design. In Fig. 22, we show an example of designing a serial dilution microfluidic network to have four different target concentrations and flow rates on the outputs.123 As depicted in Fig. 22(A), we initially make an overview of all the microfluidic junctions and channels, writing down the important parameters like the number of nodes (N), the length of the channels (L), the volumetric flow rates (Q) and concentrations (C). Then, using Table 6, we construct the equivalent circuit of the device and write down the conservation equations, including mass conservation, energy conservation, the ideal gas law, non-Newtonian correlations, or other additional equations that are problem-specific (Fig. 22(B)). To establish a balanced number of equations and unknowns, we may have to accept logical values for some of the none-critical unknowns in the device and then solve the system of equations. In many of these kinds of simulations reported in the literature, commercial software packages like MATLAB Simulink have been used.46,48 In the final step, based on the calculated parameters like channel dimensions, we can make an appropriate design of the device (Fig. 22(C)). To achieve a successful design, we should take the following essential points into account:
 |
| | Fig. 22 An example of designing a serial dilution microfluidic network to have four different target concentrations and flow rates on outputs. (A) A general overview of microfluidic junctions and channel path, (B) Equivalent circuit of the device, and (C) the appropriate design on the device based on the calculated parameters.123 | |
1. It is always preferred to use smooth structures in a design unless non-linear or disturbances in fluid flow are intentionally needed for a specific purpose like mixing.
2. Special attention is required to determine the length and cross-sectional dimensions of microfluidic channels, especially in LOD devices. Since, in microchannels, the pressure drop is inversely proportional to the fourth power of the cross-sectional dimension, the operational range of possible pressure made by rotational speed should be considered.
3. Unlike many other microfluidic devices, since in LOD devices, a limited space is available, researchers may arbitrarily adjust the cross-sectional dimensions, length, shape, or even position of unit operations to optimize the functionality, managing the space available on disc or even appearance of the device.
4. The final design can be made by a powerful available computer-aided design (CAD) software like AutoCAD, Solidworks, CATIA, etc.
Here, before the fabrication, detailed computational simulations may help researchers to validate the network simulation and the functionality of the design.123
Schwarz et al. (2016) adapted the network simulation method for many LOD unit operations.125 Two points are very important in network simulation of LOD devices. First, LOD devices exhibit not only viscous dissipation pressure losses like other LOC devices but also other pressure changes due to the rotation of the platform. These pressure changes are calculated based on the appropriate formulas that depend on the geometry, fluid viscosity, fluid density, contact angle, surface tension, position, etc. In Table 7, we list different formulas for pressure terms in microchannel and chambers on an LOD, together with some remarks for each. Second, in many cases in LOD unit operations, all the microchannels and chambers may not be filled entirely, and the filling level plays a crucial role in the pressure magnitude and for capturing the status of valves. The technique to use for including this filling level in network simulation is based on the wetting state signals between adjacent unit operations. These signals reflect whether the respective connections are wet (1) or dry (0). Hence, if the signal coming to a unit operation changes or the volume of adjacent unit operation gets filled or emptied, the wetting status changes. Examples and more details of this technique are available in.125
According to Table 7, the following points should always be taken into account:
1. The Coriolis force is not listed in the table for both microchannel and chamber sections since its effect on secondary flows can be negligible. However, if required, it is possible to consider fluidic resistance by using fit functions derived from 3D computational simulations.125
2. Time-dependent variables like variable rotational speed or temperature could be applied via corresponding time-dependent signals.
3. In this method, we mostly demonstrate all channels with either iso-radial or radial components. Although channels in radial and iso-radial directions are more straight forward, straight channels with arbitrary directions or curved channels can also be processed in this method.125
4. The pressure at a vent is always equal to the ambient pressure P0. In chambers without vent (pneumatic chambers), this value could be varied during the simulation. In case that the pneumatic chamber is not in contact with liquid and the temperature is low, the liquid vapor pressure could be ignored, and the air pressure could be estimated by the ideal gas law. In case that the vapor pressure value is not negligible, one can use eqn (60).
| |  | (60) |
where
n is the number of moles,
V is the volume, and
R is the universal gas constant.
5. We always assume that in LOD devices, the interface of liquid in partially filled chambers has an iso-radial shape.
6. Regarding the space limitation on LOD devices, we may have to consider complex geometries for chambers. If it happens, we can easily use simple algebraic calculations based on the CAD geometry and extract h(Vliquid) function. This is the liquid column size in the chamber and is needed to calculate the centrifugal pressure due to the liquid inside the chamber.
7. For the Euler force acting on a chamber, both acceleration direction and connected channel position are important (as mentioned in the table). For counterclockwise rotational acceleration, pEuler has a maximum on the left chamber wall then linearly vanishes on the right wall and vice versa.
8. Inertia, capillary, and viscous forces are usually negligible in chambers in comparison with the pressure values in microchannels. However, we can check it with detailed computational simulations and then, if needed, use the same formula as the microchannels.
As an example of its utility, Fig. 23 shows the network simulation of an LOD device by Zehnle et al. (2012).45 Their work represents the first network simulation for LOD devices. Fig. 23(A) illustrates the pumping of liquids from a radially outward position to a radially inward position. At high speeds, the flow goes to the compression chamber and compresses the trapped air. The hydrodynamic resistance of channels plays a crucial role here; with an outlet channel that is larger (a lower hydrodynamic resistance) than the inlet channel, at lower rotational speeds, gas pressure will overcome the centrifugal pressure and drive the liquid back to the collection chamber. They defined a pump efficiency  , and used network simulation for determining the optimum spin frequency and geometrical dimensions. In Fig. 23(B), we show the proposed design, and Fig. 23(C) illustrates the corresponding network simulation. As depicted here, each fluidic element in the simulation corresponds to a specific channel or chamber. In this network simulation, the black connection lines between fluidic elements are related to the hydrodynamic ports for transferring flow rate and pressure information, the blue lines are related to the phase information (wet/dry) transfer to adjacent elements, and green lines are for stimuli from a signal generator (which depends on the rotational frequency). This team considered viscous dissipation, centrifugal, Euler, capillary, and inertial pressures in their calculations, using the appropriate formulas listed in Table 7 for a square cross-sectional geometry and assumed four equal contact angles on the channel walls. They carried out their simulation and experiments for water, ethanol, whole blood, and lysis buffer and could achieve a pumping efficiency of 75% for inward pumping over a radial distance of 40 mm in 11 s. In 2015, this team broadened the concept for pneumatic siphon valves50 and connected pneumatic chambers to siphon valves to enable siphon triggering without rotational frequency reduction. They used a similar methodology for their network simulation models and to solve the equations. The simulations were in good agreement with the experiments.
 |
| | Fig. 23 (A) The schematic view of the inward pumping mechanism. (B) The design of the LOD device. (C) The network simulation used in this study.45 Reproduced with permission from the Royal Society of Chemistry. | |
Schwemmer et al. (2015) used an adaption of the network simulation presented above for timed valving and pumping units on LOD devices.47 The timing was based on the temporary storage of a liquid in a pneumatic chamber. According to Fig. 24(A), a loading pressure is applied to fill the first pneumatic chamber. After the first chamber overfilled, a second chamber started filling. Then the padding pressure was stopped. Subsequently, the pneumatic pressure pushed out the liquid slowly since the flow rate through the timing channel was limited by the viscous dissipation pressure loss along the timing channel (Fig. 24(B)). In the end, when the timing channel emptied from the viscous liquid, the timer released by the sudden release of pneumatic energy. This is because the viscosity of air is much less than that of liquid (Fig. 24(C)). In the next step, they connected this valving system to a siphon valve. They used viscous, inertia, and capillary pressure formulas for all fluidic elements (As discussed in Table 7). Moreover, they considered centrifugal pressure for radial elements and Euler pressure for iso-radial elements. They also used the ideal gas equation for the pneumatic chambers and used the volume integration for calculation of filling level of fluidic elements. Finally, they solved the final equation using the computational method and could calculate the fluid flow and filling level of fluidic elements in a good agreement with experiments. Later, Zehnle et al. (2017) used the network simulation to design and optimize a centrifugo-pneumatic blood plasma separation unit.49 As depicted in Fig. 24(D), a pneumatic chamber was pressurized by centrifugal force. Then RBCs were separated in a collection chamber in the outer radial region. In the end, centrifugal pressure was reduced in a way that pressurized air in the pneumatic chamber guided the plasma to the plasma-collection chamber. This device showed a successful separation of 14 μl plasma from 40 μl of whole plasma (with hematocrit range 20–60%) in 43 s. For the network simulation, they not only used regular pressure formulas from Table 7 for the centrifugal, Euler, inertial, capillary, and pneumatic pressures but also used a power-law model due to the shear-thinning behavior of the whole blood. Although they considered constant contact angles for capillary pressure formula, their computational simulation showed an acceptable agreement with experiments. Fig. 24(D) also shows the comparison of computational and experimental results for the filling level of the siphon (l1) and the pneumatic chamber (l2) versus time. A similar step-by-step example of using network simulation in the design of pneumatic-based unit operations is available in ref. 126.
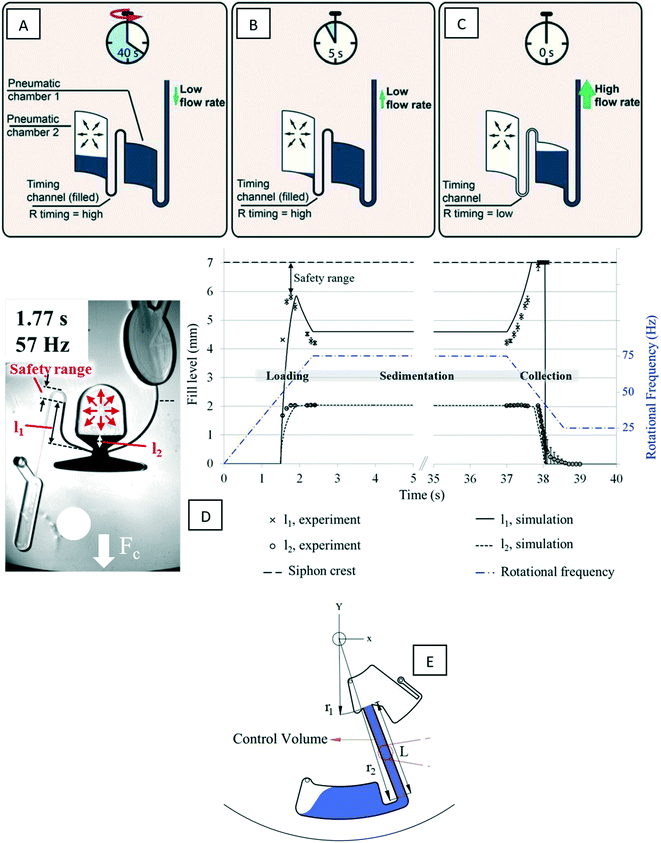 |
| | Fig. 24 (A–C) Three steps of a timer designed by Schwemmer et al.47 Reproduced with permission from the Royal Society of Chemistry. (D) A plasma separation device designed based on a network simulation. The diagram shows the comparison of simulation and experimental results for the filling level of the siphon valve (l1) and pneumatic chamber (l2) together with rotational frequency over time.49 Reprinted with the permission of AIP Publishing. (E) Schematic figure of the LOD inertia pumping simulated by Asiaei et al.48 Reprinted with the permission of IOP Publishing. | |
Aseiaei et al. (2019) used network simulation to study controlled and compact inertial pumping on LOD devices.48 As depicted in Fig. 24(E), they utilize the abrupt deceleration of the centrifugal velocity to push the fluid radially inward. In their network simulation, they considered the Euler pressure for the chamber and capillary pressure plus viscous pressure for the radial channel. For simplicity, they assumed a constant contact angle of 73.7° for water-PMMA. Moreover, to find a suitable equation for the calculation of the fluid velocity due to abrupt deceleration, they used the first thermodynamic law. With these simplifications, the final non-linear differential equation was solved using a Simulink code in MATLAB software. They compared their results with experimental data and found that the computational model mostly underestimated some of the parameters such as the rotational velocity required for transferring specific amounts of fluid.
Recently, Juelg et al. (2019) used the network simulation for serial dilution in an LOD device.46 As demonstrated in Fig. 25(A), the functionality of this device is based on centrifugo-pneumatic chambers, as explained above. In the first stage, the buffer (B) and sample (S) are loaded into a set of chambers. Then by a sudden increase of the rotational frequency, the buffer aliquots into five sub-volumes (B1–B5), and the extra liquid goes to a waste chamber (w). In the next step, sample and buffer go into a shake mode mixing chamber (M1), and subsequentially flow into the next mixers for further dilution steps. Fig. 25(B) shows the network simulation they proposed including a mixer with two connected siphon valves, this network also includes radial channels (RC), iso-radial channels (IC), pneumatic chamber (PC), vented chamber (VC), the bottom part of mixing chamber (TP), T-junction (TC) and venting elements (VE). The authors solved the equations using Simulink MATLAB and then, based on the final dimensions, designed their device with Solidworks software.
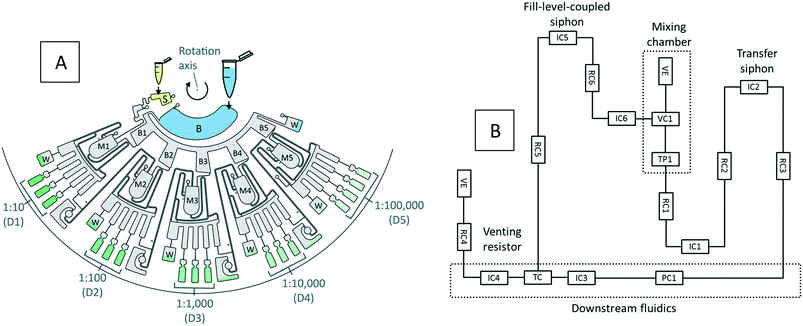 |
| | Fig. 25 (A) The LOD device for automated serial dilution. (B) The corresponding network simulation of the LOD device.46 Reproduced with permission from the Royal Society of Chemistry. | |
In general, network simulation may be used for a quick and overall analysis of LOD devices in advance of the device fabrication itself. However, this method could lead to misconceptions for the analysis of an LOD device123 since this approach is not able to provide detailed data such as the spatial distribution of the fluid velocity. Hence, computational simulations (as explained in the previous sections) are suggested for more details, especially in 2D and 3D systems.
6. Solids computational analysis
Solid analysis as a part of LOD studies is another significant aspect in which simulations can be utilized. These theoretical studies mostly focus on fluid–solid interaction.
The general governing equation for a solid domain is eqn (61), which is related to the conservation of momentum.127
| | ∇σs = ρs![[d with combining umlaut]](https://www.rsc.org/images/entities/i_char_0064_0308.gif) s s | (61) |
where
σs is the solid stress tensor,
ds is the local displacement of the solid, and
ρs is the solid density. Different constitutive relations between
σs and
ds can specify this equation for different problems.
128
Kazemzadeh et al. used elementary computational analysis on an elastic material they used in the LOD device as a proportional valve.51 They identified two main issues limiting the mainstream adoption of microfluidic devices: (1) reliable long term liquid storage, (2) controlled dispensing of liquid at low cost. To tackle this issue, these researchers proposed a device capable of performing these two important tasks at a very low cost (Fig. 26(A)). As shown in Fig. 26(B) to (D), at a given rotational speed, an elastic membrane will stretch on the LOD device and release an amount of fluid controlled by the rpm of the disc. As seen in Fig. 26(E), they used the finite element method to anticipate the deformation and pressure of the elastic membrane-based valve. Moreover, they investigated the long-term storage capability of the system by doing accelerated life tests. By employing available activation energies from the literature,51 they used the Arrhenius equation (eqn (62)) to calculate the equivalent real times.129
| |  | (62) |
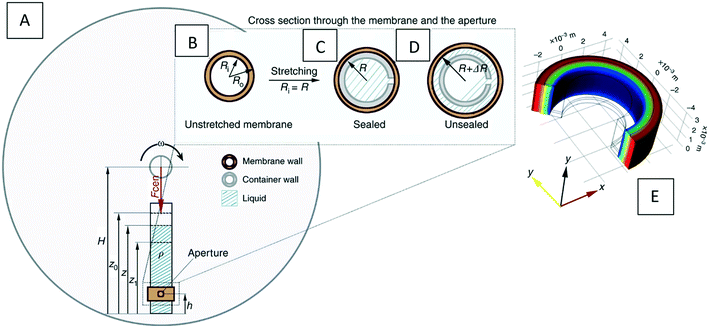 |
| | Fig. 26 The analytical treatment of the micro-dispenser actuated by centrifugation. (A) Schematic of the micro-dispenser inserted in a rotating frame together with its actuation mechanism. The inset shows a section through the membrane and the tube. (B) The membrane un-stretched. (C) A tube (of outer radius R) is sheathed in the stretched membrane, providing a hermetic sealing. (D) At a given speed, the membrane is stretched to inner radius Ri![[thin space (1/6-em)]](https://www.rsc.org/images/entities/char_2009.gif) > >![[thin space (1/6-em)]](https://www.rsc.org/images/entities/char_2009.gif) R, and liquid is released. (E) Example results from simulations, showing deformed membrane and color-coded radial pressure for an opening membrane.51 Reprinted from Springer Nature. R, and liquid is released. (E) Example results from simulations, showing deformed membrane and color-coded radial pressure for an opening membrane.51 Reprinted from Springer Nature. | |
In this equation, k is the rate constant, T is the absolute temperature, A is the pre-exponential constant, and Ea is the activation energy of the reaction. The results showed an acceptable rate of fluid loss, with an average of 0.37% after 14 days at 65 °C (i.e., equivalent to over 3 years at 23 °C) for micro-dispensers filled with DI-water. Moreover, they reported an average weight loss of 0.1% after one year at 27 °C for micro-dispensers filled with a 70% ethanol-solution. This micro dispenser can make LOD devices more affordable and portable and accelerate their commercialization.
Conclusion and outlook
Centrifugal microfluidic platforms or lab-on-discs (LODs) have evolved into a popular technology for automating chemical and biological assays. For their efficient design and cost-effective implementation, theoretical analysis and considerations should play a more important role. In the present review paper, all computational studies on LOD devices were categorized as fluidic and solid models with corresponding subcategories. In each division, the governing equations were introduced and explained. Moreover, network simulation as a useful tool in the design of LOD devices was explained, and a handy scaling analysis was introduced to aid scientists when comparing different competing forces at play in LOD devices. We hope that by surveying and contrasting various theoretical LOD, studies we shed some light on existing controversies and revealed where additional theoretical work is needed. We conclude that although some simulation studies have been carried out on specific categories like mixing and cell/particle separation, many other topics remain untouched. As a case in point, dielectrophoresis phenomena on LOD devices have not been studied by computational simulations. Moreover, acoustic forces are not utilized on LOD devices yet. These forces can be used for different purposes, including cell/particle separation, fluid mixing, and reciprocating flows in LOD devices. Considering these gaps in the literature, our group is working on studying gravity force, electrophoresis, and acoustophoresis on rotational platforms.
Authors contribution
M. M., M. J. M. and S. O. M. proposed the topic and outline of the review paper. M. M wrote all the theoretical and analytical sections. M. M and L. F. assisted in gathering and writing the abstract of previous studies from the literature. M. M., M. J. M., and S. H. edited the entire draft. S. O. M. supervised the whole work and edited the manuscript.
Conflict of interest
There are no conflicts of interest to declare.
Conflicts of interest
There are no conflicts to declare.
Acknowledgements
The authors would like to acknowledge the financial support provided by CONACYT (grant no. PROALMEX 2015-267726), the NANO – Sensors & Devices Research Group at Tecnologico de Monterrey (0020209I06), and the Federico Baur Endowed Chair in Nanotechnology (0020240I03).
References
- R.-J. Yang, H.-H. Hou, Y.-N. Wang and L.-M. Fu, Micro-magnetofluidics in microfluidic systems: A review, Sens. Actuators, B, 2016, 224, 1–15 CrossRef CAS.
- C.-Y. Lee, C.-L. Chang, Y.-N. Wang and L.-M. Fu, Microfluidic mixing: a review, Int. J. Mol. Sci., 2011, 12(5), 3263–3287 CrossRef CAS PubMed.
- A. Shamloo, M. Madadelahi and S. Abdorahimzadeh, Three-dimensional numerical simulation of a novel electroosmotic micromixer, Chem. Eng. Process.: Process Intesif., 2017, 119, 25–33 CrossRef CAS.
- C. W. Shields IV, C. D. Reyes and G. P. López, Microfluidic cell sorting: a review of the advances in the separation of cells from debulking to rare cell isolation, Lab Chip, 2015, 15(5), 1230–1249 RSC.
- Y. Shen, Y. Yalikun and Y. Tanaka, Recent advances in microfluidic cell sorting systems, Sens. Actuators, B, 2018, 268–281 Search PubMed.
- L. Clime, J. Daoud, D. Brassard, L. Malic, M. Geissler and T. Veres, Active pumping and control of flows in centrifugal microfluidics, Microfluid. Nanofluid., 2019, 23(3), 29 CrossRef.
- O. Strohmeier, M. Keller, F. Schwemmer, S. Zehnle, D. Mark, F. von Stetten, R. Zengerle and N. Paust, Centrifugal microfluidic platforms: advanced unit operations and applications, Chem. Soc. Rev., 2015, 44(17), 6187–6229 RSC.
- M. Madadelahi, E. Ghazimirsaeed and A. Shamloo, Design and fabrication of a two-phase diamond nanoparticle aided fast PCR device, Anal. Chim. Acta, 2019, 28–40 CrossRef CAS PubMed.
- Y. Zhang and H.-R. Jiang, A review on continuous-flow microfluidic PCR in droplets: Advances, challenges and future, Anal. Chim. Acta, 2016, 914, 7–16 CrossRef CAS.
-
M. Madadelahi, K. Kalan and A. Shamloo, Designing a Polymerase Chain Reaction Device Working with Radiation and Convection Heat Transfer, in IOP Conference Series: Materials Science and Engineering, IOP Publishing, 2018 Search PubMed.
- S. Haeberle and R. Zengerle, Microfluidic platforms for lab-on-a-chip applications, Lab Chip, 2007, 7(9), 1094–1110 RSC.
-
M. G. Mauk, D. T. Varapula and S. P. Gutta, Capillary-Action Microfluidic Device For Point-of-Care Diagnostics, US20180193834A1, 2018.
- M. J. Jebrail, M. S. Bartsch and K. D. Patel, Digital microfluidics: a versatile tool for applications in chemistry, biology and medicine, Lab Chip, 2012, 12(14), 2452–2463 RSC.
- F. Ahmadi, K. Samlali, P. Q. Vo and S. C. Shih, An integrated droplet-digital microfluidic system for on-demand droplet creation, mixing, incubation, and sorting, Lab Chip, 2019, 19(3), 524–535 RSC.
-
M. G. Pollack, Digital microfluidics cartridge and system for operating a flow cell, US9863913B2, 2018.
-
J. Tan, R. Amgad, H. Ahmed and L. Yeo, Acoustic wave microfluidic devices with increased acoustic wave energy utilisation, US20180141073A1, 2018.
- M. Vazquez-Pinon, B. Pramanick, F. G. Ortega-Gama, V. H. Perez-Gonzalez, L. Kulinsky, M. J. Madou, H. Hwang and S. O. Martinez-Chapa, Hydrodynamic channeling as a controlled flow reversal mechanism for bidirectional AC electroosmotic pumping using glassy carbon microelectrode arrays, J. Micromech. Microeng., 2019, 29(7), 075007 CrossRef CAS.
- M. Tang, G. Wang, S.-K. Kong and H.-P. Ho, A review of biomedical centrifugal microfluidic platforms, Micromachines, 2016, 7(2), 26 CrossRef.
- M. Madadelahi and A. Shamloo, Newtonian and generalized Newtonian reacting flows in serpentine microchannels: Pressure driven and centrifugal microfluidics, J. Non-Newtonian Fluid Mech., 2018, 251, 88–96 CrossRef CAS.
- M. Madou, J. Zoval, G. Jia, H. Kido, J. Kim and N. Kim, Lab on a CD, Annu. Rev. Biomed. Eng., 2006, 8, 601–628 CrossRef CAS PubMed.
- C.-O. Ng and C. Qi, Electro-osmotic flow in a rotating rectangular microchannel, Proc. R. Soc. A, 2015, 471(2179), 20150200 CrossRef PubMed.
- J. Zheng and Y. Jian, Rotating electroosmotic flow of two-layer fluids through a microparallel channel, Int. J. Mech. Sci., 2018, 136, 293–302 CrossRef.
- C.-K. Chung, T. Shih, B. Wu and C. Chang, Design and mixing efficiency of rhombic micromixer with flat angles, Microsyst. Technol., 2010, 16(8–9), 1595–1600 CrossRef CAS.
-
F. E. Tay, Microfluidics and BioMEMS applications, Springer, 2002 Search PubMed.
- V. Cristini and Y.-C. Tan, Theory and numerical simulation of droplet dynamics in complex flows—a review, Lab Chip, 2004, 4(4), 257–264 RSC.
-
J. Tu, G. H. Yeoh and C. Liu, Computational fluid dynamics: a practical approach, Butterworth-Heinemann, 2018 Search PubMed.
- M. Madadelahi, A. Shamloo and S. S. Salehi, Numerical simulation of bio-chemical diffusion in bone scaffolds. World Academy of Science, Engineering and Technology, Int. J. Med. Health Biomed. Bioeng. Pharmaceut. Eng., 2017, 11(5), 211–214 Search PubMed.
- Y.-J. Chang, S.-C. Chen and C.-L. Hsu, Study on microchannel design and burst frequency detection for centrifugal microfluidic system, Adv. Mater. Sci. Eng., 2013, 2013, 137347 Search PubMed.
- Y. Ren and W. W.-F. Leung, Numerical and experimental investigation on flow and mixing in batch-mode centrifugal microfluidics, Int. J. Heat Mass Transfer, 2013, 60, 95–104 CrossRef.
- M. La, S. J. Park, H. W. Kim, J. J. Park, K. T. Ahn, S. M. Ryew and D. S. Kim, A centrifugal force-based serpentine micromixer (CSM) on a plastic lab-on-a-disk for biochemical assays, Microfluid. Nanofluid., 2013, 15(1), 87–98 CrossRef CAS.
- A. Shamloo, M. Madadelahi and A. Akbari, Numerical simulation of centrifugal serpentine micromixers and analyzing mixing quality parameters, Chem. Eng. Process.: Process Intesif., 2016, 104, 243–252 CrossRef CAS.
- S. M. A. Mortazavi, P. Tirandazi, M. Normandie and M. S. Saidi, Efficient batch-mode mixing and flow patterns in a microfluidic centrifugal platform: a numerical and experimental study, Microsyst. Technol., 2017, 23(7), 2767–2779 CrossRef CAS.
- A. Shamloo, P. Vatankhah and A. Akbari, Analyzing mixing quality in a curved centrifugal micromixer through numerical simulation, Chem. Eng. Process.: Process Intesif., 2017, 116, 9–16 CrossRef CAS.
- A. Naghdloo, E. Ghazimirsaeed and A. Shamloo, Numerical simulation of mixing and heat transfer in an integrated centrifugal microfluidic system for nested-PCR amplification and gene detection, Sens. Actuators, B, 2019, 283, 831–841 CrossRef CAS.
- A. Shamloo, A. Selahi and M. Madadelahi, Designing and modeling a centrifugal microfluidic device to separate target blood cells, J. Micromech. Microeng., 2016, 26(3), 035017 CrossRef.
- M. Grumann, A. Geipel, L. Riegger, R. Zengerle and J. Ducrée, Batch-mode mixing on centrifugal microfluidic platforms, Lab Chip, 2005, 5(5), 560–565 RSC.
- A. Shamloo and M. Besanjideh, Investigation of a Novel Microfluidic Device for Label-Free Ferrohydrodynamic Cell Separation on a Rotating Disk, IEEE Trans. Biomed. Eng., 2019, 67(2), 372–378 Search PubMed.
- A. Shamloo and A. Mashhadian, Inertial particle focusing in serpentine channels on a centrifugal platform, Phys. Fluids, 2018, 30(1), 012002 CrossRef.
- D. Mark, P. Weber, S. Lutz, M. Focke, R. Zengerle and F. von Stetten, Aliquoting on the centrifugal microfluidic platform based on centrifugo-pneumatic valves, Microfluid. Nanofluid., 2011, 10(6), 1279–1288 CrossRef CAS.
- A. Kazemzadeh, P. Ganesan, F. Ibrahim, L. Kulinsky and M. J. Madou, Guided routing on spinning microfluidic platforms, RSC Adv., 2015, 5(12), 8669–8679 RSC.
- S. Fakhari, E. Pishbin, M. Navibakhsh, M. Maghazeh and M. Eghbal, Implementing series of dual-chamber units for sequential loading of the liquids in centrifugal microfluidic platforms, Microfluid. Nanofluid., 2019, 23(4), 53 CrossRef.
- J. Siegrist, M. Amasia, N. Singh, D. Banerjee and M. Madou, Numerical modeling and experimental validation of uniform microchamber filling in centrifugal microfluidics, Lab Chip, 2010, 10(7), 876–886 RSC.
- Y. Ren and W. Leung, Numerical investigation of cell encapsulation for multiplexing diagnostic assays using novel centrifugal microfluidic emulsification and separation platform, Micromachines, 2016, 7(2), 17 CrossRef PubMed.
- X. Liu, Y. Ji, Y. Deng and Y. Wu, Advection of droplet collision in centrifugal microfluidics, Phys. Fluids, 2019, 31(3), 032003 CrossRef.
- S. Zehnle, F. Schwemmer, G. Roth, F. von Stetten, R. Zengerle and N. Paust, Centrifugo-dynamic inward pumping of liquids on a centrifugal microfluidic platform, Lab Chip, 2012, 12(24), 5142–5145 RSC.
- P. Juelg, M. Specht, E. Kipf, M. Lehnert, C. Eckert, M. Keller, T. Hutzenlaub, F. von Stetten, R. Zengerle and N. Paust, Automated serial dilutions for high-dynamic-range assays enabled by fill-level-coupled valving in centrifugal microfluidics, Lab Chip, 2019, 19, 2205–2219 RSC.
- F. Schwemmer, S. Zehnle, D. Mark, F. von Stetten, R. Zengerle and N. Paust, A microfluidic timer for timed valving and pumping in centrifugal microfluidics, Lab Chip, 2015, 15(6), 1545–1553 RSC.
- S. Asiaei, S. Fakhari, E. Pishbin, F. Ghorbani-Bidkorbeh, M. Eghbal and M. Navidbakhsh, Demonstration of an efficient, compact and precise pumping method by centrifugal inertia for lab on disk platforms, J. Micromech. Microeng., 2019, 29(7), 075001 CrossRef.
- S. Zehnle, M. Rombach, R. Zengerle, F. von Stetten and N. Paust, Network simulation-based optimization of centrifugo-pneumatic blood plasma separation, Biomicrofluidics, 2017, 11(2), 024114 CrossRef CAS PubMed.
- S. Zehnle, F. Schwemmer, R. Bergmann, F. von Stetten, R. Zengerle and N. Paust, Pneumatic siphon valving and switching in centrifugal microfluidics controlled by rotational frequency or rotational acceleration, Microfluid. Nanofluid., 2015, 19(6), 1259–1269 CrossRef CAS.
- A. Kazemzadeh, A. Eriksson, M. Madou and A. Russom, A micro-dispenser for long-term storage and controlled release of liquids, Nat. Commun., 2019, 10(1), 189 CrossRef PubMed.
-
I. Banerjee and A. Russom, Lab-on-DVD: Optical Disk Drive-Based Platforms for Point-of-Care Diagnostics, in Frugal Innovation in Bioengineering for the Detection of Infectious Diseases, 2018, Springer, pp. 23–38 Search PubMed.
- S. Lai, S. Wang, J. Luo, L. J. Lee, S.-T. Yang and M. J. Madou, Design of a compact disk-like microfluidic platform for enzyme-linked immunosorbent assay, Anal. Chem., 2004, 76(7), 1832–1837 CrossRef CAS PubMed.
- G. Cai, L. Xue, H. Zhang and J. Lin, A review on micromixers, Micromachines, 2017, 8(9), 274 CrossRef PubMed.
-
P. K. Kundu and I. M. Cohen, Fluid mechanics, Academic Press, San Diego, CA, 2008 Search PubMed.
- M. C. Kong and E. D. Salin, Micromixing by pneumatic agitation on continually rotating centrifugal microfluidic platforms, Microfluid. Nanofluid., 2012, 13(3), 519–525 CrossRef CAS.
- S. Haeberle, T. Brenner, H. P. Schlosser, R. Zengerle and J. Ducrée, Centrifugal micromixery, Chem. Eng. Technol., 2005, 28(5), 613–616 CrossRef CAS.
- P. B. Howell Jr, D. R. Mott, J. P. Golden and F. S. Ligler, Design and evaluation of a Dean vortex-based micromixer, Lab Chip, 2004, 4(6), 663–669 RSC.
- J.-N. Kuo and X.-F. Chen, Decanting and mixing of supernatant human blood plasma on centrifugal microfluidic platform, Microsyst. Technol., 2016, 22(4), 861–869 CrossRef CAS.
-
R. B. Bird, W. E. Stewart and E. N. Lightfoot, Transport Phenomena, 2001, John Wiley and Sons, New York, 2002 Search PubMed.
- O. Strohmeier, S. Laßmann, B. Riedel, D. Mark, G. Roth, M. Werner, R. Zengerle and F. von Stetten, Multiplex genotyping of KRAS point mutations in tumor cell DNA by allele-specific real-time PCR on a centrifugal microfluidic disk segment, Microchim. Acta, 2014, 181(13–14), 1681–1688 CrossRef CAS.
- G. Czilwik, T. Messinger, O. Strohmeier, S. Wadle, F. Von Stetten, N. Paust, G. Roth, R. Zengerle, P. Saarinen and J. Niittymäki, Rapid and fully automated bacterial pathogen detection on a centrifugal-microfluidic LabDisk using highly sensitive nested PCR with integrated sample preparation, Lab Chip, 2015, 15(18), 3749–3759 RSC.
- M. Amasia, M. Cozzens and M. J. Madou, Centrifugal microfluidic platform for rapid PCR amplification using integrated thermoelectric heating and ice-valving, Sens. Actuators, B, 2012, 161(1), 1191–1197 CrossRef CAS.
- W. Al-Faqheri, T. H. G. Thio, M. A. Qasaimeh, A. Dietzel and M. Madou, Particle/cell separation on microfluidic platforms based on centrifugation effect: A review, Microfluid. Nanofluid., 2017, 21(6), 102 CrossRef.
- F. Schuler, M. Trotter, M. Geltman, F. Schwemmer, S. Wadle, E. Domínguez-Garrido, M. López, C. Cervera-Acedo, P. Santibáñez and F. von Stetten, Digital droplet PCR on disk, Lab Chip, 2016, 16(1), 208–216 RSC.
- H. Lim, S. M. Back, J. Nam and H. Choi, Determination of red blood cell deformability using centrifugal force in a three-dimensional-printed mini-disk (3D-PMD), PLoS One, 2018, 13(5), e0197619 CrossRef PubMed.
- C. Wang, S. Sun, Y. Chen, Z. Cheng, Y. Li, L. Jia, P. Lin, Z. Yang and R. Shu, Inertial particle focusing and spacing control in microfluidic devices, Microfluid. Nanofluid., 2018, 22(3), 25 CrossRef.
- S. Deshpande and P. Tallapragada, Particle slip velocity influences inertial focusing of particles in curved microchannels, Sci. Rep., 2018, 8(1), 11852 CrossRef PubMed.
-
H. Sasikumar and M. M. Varma, Tracking-free Determination of Microparticle Motion from Image Variance, 2019, arXiv preprint arXiv:1904.04594.
- S. H. Kim, T. Wang, L. Zhang, Y. Jiang and Z. Li, Micro-particle image velocimetry visualization study of thermal Buoyant-Marangoni flow in microtubes, Int. J. Heat Mass Transfer, 2019, 137, 765–774 CrossRef.
- A. Lee, J. Park, M. Lim, V. Sunkara, S. Y. Kim, G. H. Kim, M.-H. Kim and Y.-K. Cho, All-in-one centrifugal microfluidic device for size-selective circulating tumor cell isolation with high purity, Anal. Chem., 2014, 86(22), 11349–11356 CrossRef CAS PubMed.
-
E. L. Cussler, Diffusion: mass transfer in fluid systems, Cambridge university press, 2009 Search PubMed.
- J. Zhang, S. Yan, D. Yuan, G. Alici, N.-T. Nguyen, M. E. Warkiani and W. Li, Fundamentals and applications of inertial microfluidics: A review, Lab Chip, 2016, 16(1), 10–34 RSC.
-
P. Kundu and I. Cohen, Fluid Mechanics, Elsevier, Oxford, 4th edn, 2008 Search PubMed.
-
P. M. Gerhart, A. L. Gerhart and J. I. Hochstein, Munson, Young, and Okiishi's Fundamentals of Fluid Mechanics, 2016, Wiley Search PubMed.
-
F. M. White, Fluid Mechanics, McGraw and Hill, Singapore, 4th edn, International Edition, 1994 Search PubMed.
-
J. F. Richardson, J. H. Harker and J. R. Backhurst, Coulson and Richardson's Chemical Engineering Volume 2 - Particle Technology and Separation Processes, Elsevier, 5th edn, 2002 Search PubMed.
- C. Zhang, J. Xu, W. Ma and W. Zheng, PCR microfluidic devices for DNA amplification, Biotechnol. Adv., 2006, 24(3), 243–284 CrossRef CAS PubMed.
- G. Kelbaliyev, Drag coefficients of variously shaped solid particles, drops, and bubbles, Theor. Found. Chem. Eng., 2011, 45(3), 248–266 CrossRef CAS.
- J. Matas, J. Morris and E. Guazzelli, Lateral forces on a sphere, Oil Gas Sci. Technol., 2004, 59(1), 59–70 CrossRef.
-
E. Michaelides, Particles, bubbles & drops: their motion, heat and mass transfer, World Scientific, 2006 Search PubMed.
- P. Saffman and P. G. Saffman, J. Fluid Mech., 1965, 22, 385 CrossRef.
- P. Saffman, The lift on a small sphere in a slow shear flow, J. Fluid Mech., 1965, 22(2), 385–400 CrossRef.
- P. Saffman, The Lift on a Small Sphere in a Slow Shear Flow-Corrigendum, J. Fluid Mech., 1968, 31(3), 624 CrossRef.
- J. M. Martel and M. Toner, Inertial focusing in microfluidics, Annu. Rev. Biomed. Eng., 2014, 16, 371–396 CrossRef CAS PubMed.
- D. Di Carlo, J. F. Edd, K. J. Humphry, H. A. Stone and M. Toner, Particle segregation and dynamics in confined flows, Phys. Rev. Lett., 2009, 102(9), 094503 CrossRef PubMed.
- F. Takemura and J. Magnaudet, The transverse force on clean and contaminated bubbles rising near a vertical wall at moderate Reynolds number, J. Fluid Mech., 2003, 495, 235–253 CrossRef.
- R. Cox and S. Hsu, The lateral migration of solid particles in a laminar flow near a plane, Int. J. Multiphase Flow, 1977, 3(3), 201–222 CrossRef CAS.
- P. Vasseur and R. Cox, The lateral migration of spherical particles sedimenting in a stagnant bounded fluid, J. Fluid Mech., 1977, 80(3), 561–591 CrossRef.
- L. Zeng, S. Balachandar and P. Fischer, Wall-induced forces on a rigid sphere at finite Reynolds number, J. Fluid Mech., 2005, 536, 1–25 CrossRef.
-
M. Tokeshi, Applications of Microfluidic Systems in Biology and Medicine, Springer, 2019 Search PubMed.
- C.-L. Chen, K.-C. Chen, Y.-C. Pan, T.-P. Lee, L.-C. Hsiung, C.-M. Lin, C.-Y. Chen, C.-H. Lin, B.-L. Chiang and A. M. Wo, Separation and detection of rare cells in a microfluidic disk via negative selection, Lab Chip, 2011, 11(3), 474–483 RSC.
- K. E. McCloskey, J. J. Chalmers and M. Zborowski, Magnetic cell separation: characterization of magnetophoretic mobility, Anal. Chem., 2003, 75(24), 6868–6874 CrossRef CAS PubMed.
- J. F. Schenck, The role of magnetic susceptibility in magnetic resonance imaging: MRI magnetic compatibility of the first and second kinds, Med. Phys., 1996, 23(6), 815–850 CrossRef CAS PubMed.
- M. C. Wapler, J. Leupold, I. Dragonu, D. von Elverfeld, M. Zaitsev and U. Wallrabe, Magnetic properties of materials for MR engineering, micro-MR and beyond, J. Magn. Reson., 2014, 242, 233–242 CrossRef CAS PubMed.
- R. Dupree and C. Ford, Magnetic susceptibility of the noble metals around their melting points, Phys. Rev. B: Solid State, 1973, 8(4), 1780 CrossRef CAS.
- D. Kirby, J. Siegrist, G. Kijanka, L. Zavattoni, O. Sheils, J. O'Leary, R. Burger and J. Ducrée, Centrifugo-magnetophoretic particle separation, Microfluid. Nanofluid., 2012, 13(6), 899–908 CrossRef CAS.
- J. Ducrée, S. Haeberle, S. Lutz, S. Pausch, F. Von Stetten and R. Zengerle, The centrifugal microfluidic Bio-Disk platform, J. Micromech. Microeng., 2007, 17(7), S103 CrossRef.
- K. Galvin and J. Dickinson, Particle transport and separation in inclined channels subject to centrifugal forces, Chem. Eng. Sci., 2013, 87, 294–305 CrossRef CAS.
- J. C. Yeo, Z. Wang and C. T. Lim, Microfluidic size separation of cells and particles using a swinging bucket centrifuge, Biomicrofluidics, 2015, 9(5), 054114 CrossRef PubMed.
-
D. Li, Encyclopedia of microfluidics and nanofluidics, Springer Science & Business Media, 2008 Search PubMed.
- S. Ozuna-Chacón, B. H. Lapizco-Encinas, M. Rito-Palomares, S. O. Martínez-Chapa and C. Reyes-Betanzo, Performance characterization of an insulator-based dielectrophoretic microdevice, Electrophoresis, 2008, 29(15), 3115–3122 CrossRef PubMed.
- V. H. Perez-Gonzalez, V. Ho, L. Kulinsky, M. Madou and S. O. Martinez-Chapa, PPyDEP: a new approach to microparticle manipulation employing polymer-based electrodes, Lab Chip, 2013, 13(23), 4642–4652 RSC.
- D. Yin, X. Zhang, X. Han, J. Yang and N. Hu, Multi-Stage Particle Separation based on Microstructure Filtration and Dielectrophoresis, Micromachines, 2019, 10(2), 103 CrossRef PubMed.
- R. Martinez-Duarte, R. A. Gorkin III, K. Abi-Samra and M. J. Madou, The integration of 3D carbon-electrode dielectrophoresis on a CD-like centrifugal microfluidic platform, Lab Chip, 2010, 10(8), 1030–1043 RSC.
-
H. Bruus, Theoretical microfluidics, Oxford university press, Oxford, 2008, vol. 18 Search PubMed.
- A. H. Meng, N.-T. Nguyen and R. M. White, Focused flow micropump using ultrasonic flexural plate waves, Biomed. Microdevices, 2000, 2(3), 169–174 CrossRef.
-
J. M. Meacham, M. Binkley, A. G. Fedorov, F. L. Degertekin and C. Swadley, High throughput acoustic particle separation methods and devices, US20190076769A1, 2019.
- A. Shamloo and M. Boodaghi, Design and simulation of a microfluidic device for acoustic cell separation, Ultrasonics, 2018, 84, 234–243 CrossRef CAS PubMed.
- A. Shamloo and F. Y. Parast, Simulation of Blood Particle Separation in a Trapezoidal Microfluidic Device by Acoustic Force, IEEE Trans. Electron Devices, 2019, 66(3), 1495–1503 CAS.
- H. Bruus, Acoustofluidics 7: The acoustic radiation force on small particles, Lab Chip, 2012, 12(6), 1014–1021 RSC.
- J. Nunes, S. Tsai, J. Wan and H. A. Stone, Dripping and jetting in microfluidic multiphase flows applied to particle and fibre synthesis, J. Phys. D: Appl. Phys., 2013, 46(11), 114002 CrossRef PubMed.
- A. S. Utada, A. Fernandez-Nieves, H. A. Stone and D. A. Weitz, Dripping to jetting transitions in coflowing liquid streams, Phys. Rev. Lett., 2007, 99(9), 094502 CrossRef PubMed.
- S. Haeberle, R. Zengerle and J. Ducrée, Centrifugal generation and manipulation of droplet emulsions, Microfluid. Nanofluid., 2007, 3(1), 65–75 CrossRef.
-
M. Wörner, A compact introduction to the numerical modeling of multiphase flows, Forschungszentrum Karlsruhe, 2003 Search PubMed.
- M. Madadelahi and A. Shamloo, Droplet-based flows in serpentine microchannels: Chemical reactions and secondary flows, Int. J. Multiphase Flow, 2017, 97, 186–196 CrossRef CAS.
- P. Yue, J. J. Feng, C. Liu and J. Shen, A diffuse-interface method for simulating two-phase flows of complex fluids, J. Fluid Mech., 2004, 515, 293–317 CrossRef CAS.
- P. Yue, C. Zhou, J. J. Feng, C. F. Ollivier-Gooch and H. H. Hu, Phase-field simulations of interfacial dynamics in viscoelastic fluids using finite elements with adaptive meshing, J. Comput. Phys., 2006, 219(1), 47–67 CrossRef CAS.
- G. Silva, N. Leal and V. Semiao, Critical pressure for capillary valves in a Lab-on-a-Disk: CFD and flow visualization, Comput. Struct., 2010, 88(23–24), 1300–1309 CrossRef.
- S. I.-E. Lin, Novel bifurcation design for centrifugal microfluidic platform with wide range rotational speed, J. Nanotechnol. Eng. Med., 2011, 2(1), 011001 CrossRef.
- G. Wang, H.-P. Ho, Q. Chen, A. K.-L. Yang, H.-C. Kwok, S.-Y. Wu, S.-K. Kong, Y.-W. Kwan and X. Zhang, A lab-in-a-droplet bioassay strategy for centrifugal microfluidics with density difference pumping, power to disc and bidirectional flow control, Lab Chip, 2013, 13(18), 3698–3706 RSC.
- G. Wang, J. Tan, M. Tang, C. Zhang, D. Zhang, W. Ji, J. Chen, H.-P. Ho and X. Zhang, Binary centrifugal microfluidics enabling novel, digital addressable functions for valving and routing, Lab Chip, 2018, 18(8), 1197–1206 RSC.
- K. W. Oh, K. Lee, B. Ahn and E. P. Furlani, Design of pressure-driven microfluidic networks using electric circuit analogy, Lab Chip, 2012, 12(3), 515–545 RSC.
- M. Schindler and A. Ajdari, Droplet traffic in microfluidic networks: A simple model for understanding and designing, Phys. Rev. Lett., 2008, 100(4), 044501 CrossRef PubMed.
- I. Schwarz, S. Zehnle, T. Hutzenlaub, R. Zengerle and N. Paust, System-level network simulation for robust centrifugal-microfluidic lab-on-a-chip systems, Lab Chip, 2016, 16(10), 1873–1885 RSC.
- J. Hess, S. Zehnle, P. Juelg, T. Hutzenlaub, R. Zengerle and N. Paust, Review on pneumatic operations in centrifugal microfluidics, Lab Chip, 2019, 19(22), 3745–3770 RSC.
- A. Valencia and F. Baeza, Numerical simulation of fluid–structure interaction in stenotic arteries considering two layer nonlinear anisotropic structural model, Int. Commun. Heat Mass Transfer, 2009, 36(2), 137–142 CrossRef.
-
P. Howell, G. Kozyreff and J. Ockendon, Applied solid mechanics, Cambridge University Press, 2009, vol. 43 Search PubMed.
-
K. J. Laidler and J. Keith, Chemical kinetics, McGraw-Hill, New York, 1965, vol. 15 Search PubMed.
|
| This journal is © The Royal Society of Chemistry 2020 |
Click here to see how this site uses Cookies. View our privacy policy here.  Open Access Article
 a,
Luis F.
Acosta-Soto
a,
Samira
Hosseini
ab,
Sergio O.
Martinez-Chapa
a,
Luis F.
Acosta-Soto
a,
Samira
Hosseini
ab,
Sergio O.
Martinez-Chapa
 *a and
Marc J.
Madou
*c


![[V with combining right harpoon above (vector)]](https://www.rsc.org/images/entities/i_char_0056_20d1.gif) f is the velocity vector of any fluidic element,
f is the velocity vector of any fluidic element,  is the rotational velocity vector, and
 ![[r with combining right harpoon above (vector)]](https://www.rsc.org/images/entities/i_char_0072_20d1.gif) is the radial position vector. An over-dot in eqn (4) denotes a time derivative
is the radial position vector. An over-dot in eqn (4) denotes a time derivative  . Noteworthy, in eqn (4),
 ![[F with combining right harpoon above (vector)]](https://www.rsc.org/images/entities/i_char_0046_20d1.gif) Euler is zero for LOD devices rotating at constant angular velocities as this parameter is defined according to the angular acceleration. In LOD devices,
Euler is zero for LOD devices rotating at constant angular velocities as this parameter is defined according to the angular acceleration. In LOD devices, ![[F with combining right harpoon above (vector)]](https://www.rsc.org/images/entities/i_char_0046_20d1.gif) centrifugal plays a crucial role as the driving force.18
centrifugal plays a crucial role as the driving force.18

 is the average of r1 and r2.


![[f with combining right harpoon above (vector)]](https://www.rsc.org/images/entities/i_char_0066_20d1.gif) b is the volumetric force vector, which is the sum of the centrifugal (eqn (2)), Coriolis (eqn (3)) and Euler (eqn (4)) forces generated by the rotation. It is important to note that the transient terms on the left side of eqn (9) and (10) are null for steady-state problems. Moreover, when the gravity effect is considered to be negligible, the third term on the right side of eqn (9) can be neglected.
b is the volumetric force vector, which is the sum of the centrifugal (eqn (2)), Coriolis (eqn (3)) and Euler (eqn (4)) forces generated by the rotation. It is important to note that the transient terms on the left side of eqn (9) and (10) are null for steady-state problems. Moreover, when the gravity effect is considered to be negligible, the third term on the right side of eqn (9) can be neglected.


 is the particle position vector, and
 ![[F with combining right harpoon above (vector)]](https://www.rsc.org/images/entities/i_char_0046_20d1.gif) is the force vector affecting the particles.
is the force vector affecting the particles.

![[V with combining right harpoon above (vector)]](https://www.rsc.org/images/entities/i_char_0056_20d1.gif) p at a distance r from the rotational center, these three forces can be defined as follows:
p at a distance r from the rotational center, these three forces can be defined as follows:


 :
:
![[F with combining right harpoon above (vector)]](https://www.rsc.org/images/entities/i_char_0046_20d1.gif) , the combination of eqn (14) and (19) results in:
, the combination of eqn (14) and (19) results in:

 . Based on the particle's Reynolds number
  , different values are suggested for the drag coefficient. In Table 3, we list the values of these drag coefficients and the corresponding drag forces.77 These formulas were initially calculated for particles without any rotation. However, Zend et al. used computational simulations to investigate the effects of particle rotation on drag force and concluded that this effect is rather small.78 Thus, the equations in Table 3 can be used for all rotational and non-rotational spherical particles in LOD simulations.

 (1 + 0.15 Re′0.687)
![[V with combining right harpoon above (vector)]](https://www.rsc.org/images/entities/i_char_0056_20d1.gif) f is the fluid velocity,
f is the fluid velocity, ![[V with combining right harpoon above (vector)]](https://www.rsc.org/images/entities/i_char_0056_20d1.gif) p is the particle velocity, dp is the diameter of the particle and
p is the particle velocity, dp is the diameter of the particle and  is the angular velocity of the particle. As depicted in Fig. 7(A), this force is always perpendicular to the relative velocity of the particle and its rotational velocity. In the case of a rotational flow field in which a particle rotates with an absolute rotational velocity of
  in eqn (22) is calculated as:


 shows that the Saffman force is at least one order of magnitude larger than the Magnus force.80


 is the scaled distance of the particle from nearby walls, and CL is the lift coefficient. Zeng et al. performed a direct numerical simulation to find the effects of a wall near a spherical particle that is moving parallel to the wall's surface.90 In their simulation, the authors considered Reynolds number in a range from 0.5 to 300, and the particle-wall distance was taken as between 0.75 and 4 times the sphere diameter. The effect of particle rotation on the calculated lift was also investigated, and it was concluded that like the drag force, the effect of lift rotation on particles is rather small. In Fig. 8(A), we show the wall-induced lift coefficient CLversus L*, as found in these mentioned studies.


 represents the dimensionless lift coefficient. By substitution of the shear rate as a function of the maximum fluid velocity Vmax, eqn (29) transforms to eqn (30) wherein Dh is the hydraulic diameter.


![[B with combining right harpoon above (vector)]](https://www.rsc.org/images/entities/i_char_0042_20d1.gif) is the magnetic flux density related to the external magnetic field, xp and xm are the magnetic volume susceptibility of the particles and the medium, respectively, and μ0 is the vacuum permeability constant (μ0 = 1.257 × 10⁻⁶ N A−2). In Table 4, we list the magnetic volume susceptibility for some common materials.
is the magnetic flux density related to the external magnetic field, xp and xm are the magnetic volume susceptibility of the particles and the medium, respectively, and μ0 is the vacuum permeability constant (μ0 = 1.257 × 10⁻⁶ N A−2). In Table 4, we list the magnetic volume susceptibility for some common materials.

![[B with combining right harpoon above (vector)]](https://www.rsc.org/images/entities/i_char_0042_20d1.gif) ·∇)
·∇)![[B with combining right harpoon above (vector)]](https://www.rsc.org/images/entities/i_char_0042_20d1.gif) for permanent bar-shaped magnets. According to the linear correlation of magnetic force and (
for permanent bar-shaped magnets. According to the linear correlation of magnetic force and (![[B with combining right harpoon above (vector)]](https://www.rsc.org/images/entities/i_char_0042_20d1.gif) ·∇)
·∇)![[B with combining right harpoon above (vector)]](https://www.rsc.org/images/entities/i_char_0042_20d1.gif) , the authors concluded that the magnet ends should be placed near the central region of chambers. In Fig. 11(B), we show the value of
, the authors concluded that the magnet ends should be placed near the central region of chambers. In Fig. 11(B), we show the value of ![[B with combining right harpoon above (vector)]](https://www.rsc.org/images/entities/i_char_0042_20d1.gif) for an arrangement of eight permanent magnets. For the calculation of magnetic beads' trajectory, these authors considered three forces in the particle tracing formula, namely the magnetic force, the centrifugal force and the Stokes drag force. These forces are shown in Fig. 11(A). Moreover, a specific optimal range for the velocity and the rotation frequency was determined for the LOD. The optimal frequency was calculated to be around 6.5 Hz, which closely matches the experimental evidence that suggested an optimum range of 5–7 Hz validating the model's accuracy. At speeds above and below this frequency, either the magnetic or the centrifugal force dominated the other's effect, thus diminishing the impact of the beads on the overall fluid mixing.
for an arrangement of eight permanent magnets. For the calculation of magnetic beads' trajectory, these authors considered three forces in the particle tracing formula, namely the magnetic force, the centrifugal force and the Stokes drag force. These forces are shown in Fig. 11(A). Moreover, a specific optimal range for the velocity and the rotation frequency was determined for the LOD. The optimal frequency was calculated to be around 6.5 Hz, which closely matches the experimental evidence that suggested an optimum range of 5–7 Hz validating the model's accuracy. At speeds above and below this frequency, either the magnetic or the centrifugal force dominated the other's effect, thus diminishing the impact of the beads on the overall fluid mixing.


![[g with combining right harpoon above (vector)]](https://www.rsc.org/images/entities/i_char_0067_20d1.gif) is the constant acceleration of gravity. For typical LOD devices, similar to what we mentioned in section 3.3.1 for centrifugal forces, we should take the buoyancy effect into account and replace ρp by (ρp − ρf) in eqn (32).
is the constant acceleration of gravity. For typical LOD devices, similar to what we mentioned in section 3.3.1 for centrifugal forces, we should take the buoyancy effect into account and replace ρp by (ρp − ρf) in eqn (32).


 and
and  are the complex dielectric permittivity of the fluid and particle, respectively defined by
  , where σ is the electrical conductivity and j2 = −1. Depending on the relative polarizability of fluid and particle, particles move differently. In the case that medium is more polarizable than the particles, particles move toward the lowest electric field (negative DEP), and in case the particles are more polarizable than the fluidic medium, they move toward the highest electric field (positive DEP).102,103

![[F with combining right harpoon above (vector)]](https://www.rsc.org/images/entities/i_char_0046_20d1.gif) Rad = ∇URad
Rad = ∇URad


 where cf is the speed of sound in the fluid). In eqn (35), the line over expressions are time averages over one period, and p and Vin are calculated by solving the following wave equation:109,111


![[V with combining right harpoon above (vector)]](https://www.rsc.org/images/entities/i_char_0056_20d1.gif) f is the flow velocity, αCP and ρCP are the volume fraction and density of the continuous phase, respectively, μDP is the dynamic viscosity of the dispersed phase, and
f is the flow velocity, αCP and ρCP are the volume fraction and density of the continuous phase, respectively, μDP is the dynamic viscosity of the dispersed phase, and ![[r with combining right harpoon above (vector)]](https://www.rsc.org/images/entities/i_char_0072_20d1.gif) denotes the radial vector from the center of rotation. The source term due to the rotation is composed of three contributions: centrifugal, Coriolis, and the Euler terms, respectively, as shown in eqn (44). The last term on the right-hand-side of eqn (43) is the term related to the surface tension force, which is not considered in some of the previous computational studies in the literature.41,42 The phase interface interface in this model can be tracked by solving the continuity eqn (47) for volume fraction.
denotes the radial vector from the center of rotation. The source term due to the rotation is composed of three contributions: centrifugal, Coriolis, and the Euler terms, respectively, as shown in eqn (44). The last term on the right-hand-side of eqn (43) is the term related to the surface tension force, which is not considered in some of the previous computational studies in the literature.41,42 The phase interface interface in this model can be tracked by solving the continuity eqn (47) for volume fraction.


 is required (w = channel width), which is corresponding to mixing length
  with a uniform flow velocity U. This length could be used as a handy criterion of mixing channels in microfluidic devices design. In Fig. 22, we show an example of designing a serial dilution microfluidic network to have four different target concentrations and flow rates on the outputs.123 As depicted in Fig. 22(A), we initially make an overview of all the microfluidic junctions and channels, writing down the important parameters like the number of nodes (N), the length of the channels (L), the volumetric flow rates (Q) and concentrations (C). Then, using Table 6, we construct the equivalent circuit of the device and write down the conservation equations, including mass conservation, energy conservation, the ideal gas law, non-Newtonian correlations, or other additional equations that are problem-specific (Fig. 22(B)). To establish a balanced number of equations and unknowns, we may have to accept logical values for some of the none-critical unknowns in the device and then solve the system of equations. In many of these kinds of simulations reported in the literature, commercial software packages like MATLAB Simulink have been used.46,48 In the final step, based on the calculated parameters like channel dimensions, we can make an appropriate design of the device (Fig. 22(C)). To achieve a successful design, we should take the following essential points into account:

 , and used network simulation for determining the optimum spin frequency and geometrical dimensions. In Fig. 23(B), we show the proposed design, and Fig. 23(C) illustrates the corresponding network simulation. As depicted here, each fluidic element in the simulation corresponds to a specific channel or chamber. In this network simulation, the black connection lines between fluidic elements are related to the hydrodynamic ports for transferring flow rate and pressure information, the blue lines are related to the phase information (wet/dry) transfer to adjacent elements, and green lines are for stimuli from a signal generator (which depends on the rotational frequency). This team considered viscous dissipation, centrifugal, Euler, capillary, and inertial pressures in their calculations, using the appropriate formulas listed in Table 7 for a square cross-sectional geometry and assumed four equal contact angles on the channel walls. They carried out their simulation and experiments for water, ethanol, whole blood, and lysis buffer and could achieve a pumping efficiency of 75% for inward pumping over a radial distance of 40 mm in 11 s. In 2015, this team broadened the concept for pneumatic siphon valves50 and connected pneumatic chambers to siphon valves to enable siphon triggering without rotational frequency reduction. They used a similar methodology for their network simulation models and to solve the equations. The simulations were in good agreement with the experiments.


![[d with combining umlaut]](https://www.rsc.org/images/entities/i_char_0064_0308.gif) s
s

![[thin space (1/6-em)]](https://www.rsc.org/images/entities/char_2009.gif) >
>![[thin space (1/6-em)]](https://www.rsc.org/images/entities/char_2009.gif) R, and liquid is released. (E) Example results from simulations, showing deformed membrane and color-coded radial pressure for an opening membrane.51 Reprinted from Springer Nature.
R, and liquid is released. (E) Example results from simulations, showing deformed membrane and color-coded radial pressure for an opening membrane.51 Reprinted from Springer Nature.


