
 Open Access Article
 This Open Access Article is licensed under a
 Creative Commons Attribution 3.0 Unported Licence
Recent progress in the performance of HAPG based laboratory EXAFS and XANES spectrometers
Christopher
Schlesiger
 *,
Sebastian
Praetz
,
Richard
Gnewkow
,
Wolfgang
Malzer
and
Birgit
Kanngießer
*,
Sebastian
Praetz
,
Richard
Gnewkow
,
Wolfgang
Malzer
and
Birgit
Kanngießer
Technische Universität Berlin, Institute of Optics and Atomic Physics, Sekr. EW3-1, Hardenbergstr. 36A, 10623 Berlin, Germany. E-mail: christopher.schlesiger@tu-berlin.de
First published on 15th July 2020
Abstract
New developments in the description and modeling of Highly Annealed Pyrolytic Graphite (HAPG) mosaic crystals have led to the possibility of designing optimized optical solutions for X-ray absorption fine structure (XAFS) spectroscopy. XAFS is a very versatile method that is usually divided into two sub methods: extended X-ray absorption fine structure (EXAFS) and X-ray absorption near edge structure (XANES) spectroscopies, which need different experimental conditions concerning spectral resolving power, energetic bandwidth and number of detected photons. For facilitating XANES and EXAFS spectroscopies with laboratory- and von Hamos-based spectrometers, tailored optics were designed as well as optimized spectrometer components, i.e. an adequate microfocus X-ray source and a pixelated detector, were chosen. This is shown with a demonstration experiment on pure copper foil. In the XANES case a spectral resolving power of E/ΔE ≈ 4000 and an energy bandpass of around 300 eV were achieved with a measurement time of t = 7 min. For EXAFS, the tailored optic has an increased solid angle at moderate spectral resolving power in combination with a large energy bandpass of over 1 keV and a measurement time of t = 250 s for the given copper foil. These optimized solutions pave the way to perform XANES and EXAFS in the laboratory even for diluted samples with analyte concentrations of only a few weight percent or even less in a reasonable time frame of minutes to hours. Spectrometers, that already had an impact on research, especially catalysis research, therefore, made a huge leap in efficiency that prepares them to meet new challenges, not only as a standalone method, but also in combination with high-end synchrotron radiation facility-based XAFS experiments.
1. Introduction
X-ray absorption fine structure (XAFS) spectroscopy is a highly adaptable method. It can give information not only on the electronic structure of a given sample, but also determine bond distances to neighboring atoms, the coordination and in general the chemical species. Due to its flexibility, it is a widely used method in fields like geology, biology, catalysis research, and environmental and material sciences,1 but is almost exclusively performed at synchrotron radiation facilities. For this reason, XAFS will only become a standard method for sample characterization e.g. like IR- and Raman spectroscopy or X-ray diffraction (XRD), if laboratory spectrometers are available. Additionally, laboratory-based XAFS spectrometers could render beamtimes at synchrotron radiation facilities much more efficient, as personnel could be trained in the method beforehand and/or appropriate sample preparation or selection could be tested in advance. In the previous decade, considerable progress in the development of laboratory-scale XAS spectrometers attracted attention. Recent progress in instrumentation is of particular interest for research in chemistry as a great leap in efficiency was achieved.Novel instruments, which were developed during this period, combine sufficient spectral resolution with high efficiency and already demonstrated their capability to analyze specimens, which are of interest in current research within reasonable acquisition times.
One approach for novel XAS instrumentation employs spherically bent crystals in Rowland geometry.2–6 These scanning type spectrometers offer spectral resolutions down to around 1 eV. Applications were, for example, reported in catalysis research,7 environmental research8 and in the investigation of actinides.9
Non-scanning types of spectrometers, which use von Hamos geometry were developed by Németh et al.,10 Hoszowska et al.11 and Błachucki et al.12 using ideal crystals and by our group employing Highly Annealed Pyrolytic Graphite (HAPG) as a dispersive element.13 Németh et al. demonstrated that laboratory spectrometers are a unique option for long time experiments. Our HAPG based spectrometer was successfully used in catalysis research for the determination of formal oxidation states.14–17
One of the advantageous properties of HAPG is its flexibility. It can be bent with virtually arbitrary radii without noteworthy degradation of its diffractive properties. HAPG optics can be optimized within a wide range of geometries. Our in-house software allows for the prediction of the performance of such HAPG-optics with good accuracy and thus for the optimization of their design.18
In this paper, new optics tailored for EXAFS and XANES experiments are presented, respectively. The XANES optic is optimized for maximum spectral resolving power. The EXAFS optic, in contrast, is optimized for a large spectral bandwidth and a high photon flux with moderate spectral resolving power. Both are optimized for the energetic region from 4–10 keV mainly covering the K-edges of 3d transition metals.
The CCD detector of the original setup13 was replaced by a hybrid pixel detector. Its large detection area enables the large spectral bandwidth of the EXAFS variant.
Finally, the microfocus X-ray tube was also replaced. A prototype, optimized for low voltage operation, provides much higher flux of bremsstrahlung within the energy interval of interest without including photon energies of higher reflection orders of the crystal.
The combination of these optimized components results in a performance leap. In particular, EXAFS spectra now can be acquired within unprecedented short acquisition times of less than five minutes.
In the following sections, we successively describe these components and present measurements, which demonstrate the progress of the spectrometer performance.
2. Setup
The setup, see Fig. 1, was already thoroughly introduced.13 It depicts a wavelength-dispersive spectrometer in the adapted von Hamos geometry. The bremsstrahlung of a microfocus X-ray tube is dispersed and sagittally refocused by a cylindrically shaped HAPG optic in the first order of reflection, i.e. 002, onto a two-dimensional, position-sensitive detector. The absorption is acquired by measuring once with and once without the sample. The main changes to the previously reported setup will be highlighted as they are responsible for the better performance. These are the X-ray tube, the pixelated detector and the optimized parameters of the corresponding optics. The latter will be described in the following sections. The newly chosen configuration is fixed by means of spectral resolving power and flux. A change in these parameters can however be carried out by designing optics tailored to one's needs. This especially includes the thickness of the HAPG sheet and the bending radius of the optic. While increasing the bending radius and decreasing the sheet's thickness usually increases the spectral resolving power at a cost of solid angle and therefore flux, the first parameter also changes the requirements for the detection system as the lateral needed dimension increases due to increasing the components' distances.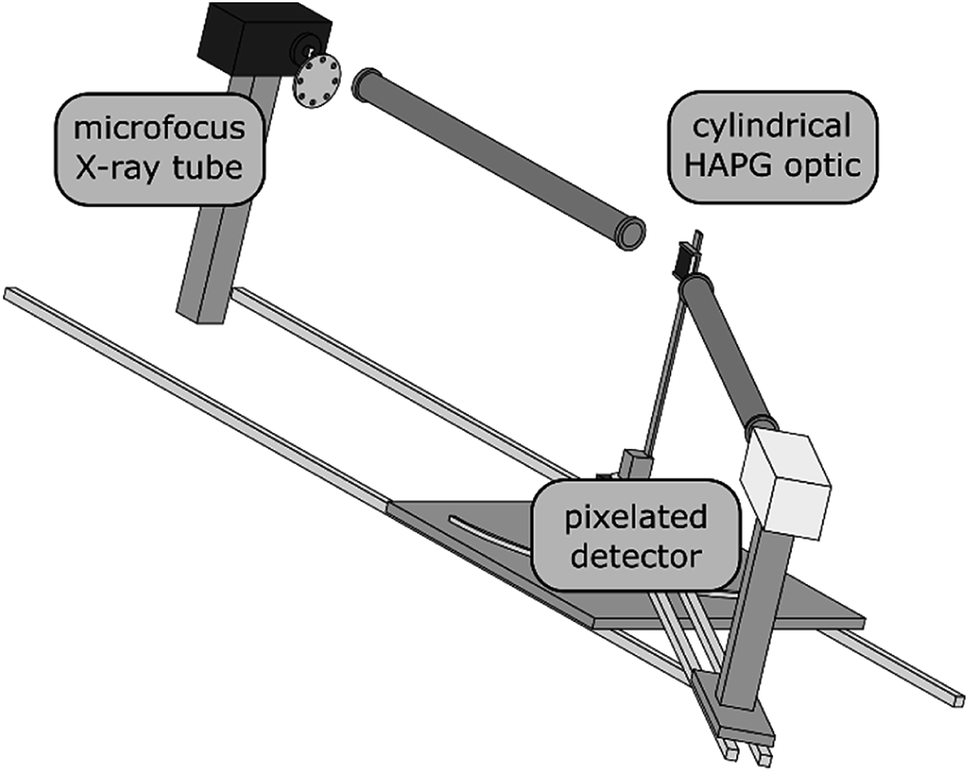 | ||
| Fig. 1 Schematic view of the laboratory setup with the main components: an rtw microfocus X-ray tube optimized to 15 kV, cylindrical HAPG optic, either XANES- or EXAFS-optimized, and a pixelated Dectris EIGER2 R 500K detector. | ||
For further evaluation of the acquired absorption spectra, i.e. normalization, the extraction of EXAFS oscillations and their Fourier transformation, the Demeter software package was used.19
2.1. Microfocus X-ray tube
In wavelength dispersive spectrometers, there is always an overlap of various reflection orders. One approach to prevent this would be a detector, which is capable of completely discriminating different energies. However, that is really challenging with current position-sensitive detectors, and even a small percentage of remaining photons from different photon energies can have a significant impact on the spectrum, i.e. usually a damping of the relative oscillation height and of the total determined absorption. Therefore, the X-ray tube has to be operated at maximum at a voltage that corresponds to twice the energy of the investigated absorption edge and, hence, not producing photons with energies of higher reflection orders.Usually, microfocus X-ray tubes that are used for X-ray fluorescence spectroscopy are optimized for voltages of around U = 30 kV or even higher. Therefore, the power is not optimal at the desired lower voltages, i.e. around U = 10 kV up to U = 20 kV, in order to cover the desired energy range from E = 4 keV up to E = 10 keV. A new optimized X-ray tube was developed by rtw RÖNTGEN-TECHNIK DR. WARRIKHOFF GmbH & Co. KG for our purposes. This X-ray tube with a molybdenum anode and tungsten cathode is optimized to be operated at P = 30 W at a high voltage of around U = 15 kV. Compared to the X-ray tube used formerly, the photon flux in the desired energy range is increased by a factor of eight. Hence, the needed acquisition time is reduced by the same factor. The spot size is around 80 μm × 50 μm and therefore does not influence the achievable spectral resolving power in the current configuration. Experiences with standard X-ray tubes from the same supplier did not show problems with increasing L emission of tungsten that adheres onto the anode over time periods of at least a year. Between the two measurements, even existing emission lines were no problems, as the ratio of intensity to the bremsstrahlung was still small and the setup stable enough to not show an influence on the resulting spectra. Long time observations with the new X-ray source still have to be performed.
2.2. Pixelated X-ray detector
The Dectris Eiger2 R 500K is a hybrid-CMOS detector that has a sensor layer of T = 450 μm Si bonded on top of the electronic layer. It is the second generation of the Eiger detector, developed at the Paul Scherrer Institut.20 Charge carriers generated by photons in the sensor layer are accelerated towards the electronic layer with an electric field to be processed and counted. Due to the layered structure, the effective area for photon detection is not constrained by adjacent readout electronic as it is usually the case for most CMOS detectors. The Dectris Eiger2 R 500K has a photon counting capability with a flux limit of around Φmax ≈ 2 × 10⁶ photons per (s px), a quantum efficiency of around 99% at a photon energy of E = 9 keV and the possibility of setting two energetic thresholds. Because charge sharing between adjacent pixels is not corrected, the latter however is not sufficient for XAFS because, as described before, a small percentage of higher order contributions can already have a big influence on the absorption spectrum.The detector has many advantages that make it ideal to be used in the current spectrometer. Here, especially, its size of 77.3 mm × 38.6 mm at a pixel size of 75 μm × 75 μm shall be mentioned. It is of utmost importance to cover the whole spectral range of the EXAFS spectrum, especially at the lower end of the spectrometer's photon energy range for the increasing dispersion. Fast readout and the capability to count photons are the reason why the measurement time equals the acquisition time and the signal-to-noise ratio is purely given by the photon statistics. Both provide a huge improvement compared to the formerly used indirect detecting CCD camera. Finally, it strongly increases the throughput of samples.
3. Optimization for XANES measurements
As the influence of mosaic effects, which lower the spectral resolving power, usually decreases with increasing components' distances, large bending radii in the von Hamos geometry have shown to be suitable for high spectral resolving power. The limit is defined by the intrinsic reflection broadening. In an existing spectrometer for X-ray emission spectroscopy, a bending radius of R = 300 mm provided the highest spectral resolving power so far of about E/ΔE = 4000, almost constant over the whole energy range of the spectrometer.21 As calculations have shown that there is no significant increase in spectral resolving power for further increased bending radius, this bending radius was also chosen for high spectral resolution in the XAFS spectrometer. The optic has dimensions of 50 mm × 50 mm, the mosaic crystal layer is T = 20 μm thick and the optic's mosaic spread is γ ≈ 0.064°.As a measure of the performance, a copper foil with a thickness of T = 10 μm was chosen to be measured. For comparison, a measurement performed at the beamline 13-ID-E22 at the Advanced Photon Source (APS) synchrotron radiation facility was taken from the XAFS database (SR-XAFS). The beamline, at which the measurement took place, is equipped with a Si (111) monochromator, roughly delivering a spectral resolving power of E/ΔE = 8000.
In Fig. 2, the normalized absorption spectra of the SR-XAFS measurement and the ones acquired in the laboratory-based spectrometer (Lab-XAFS) are shown. The total measurement time for the latter was t = 8 min with t0 = 2 min for the measurement without the sample and ts = 6 min for the one with the sample. The tube was operated at U = 17 kV and I = 1.76 mA.
 | ||
| Fig. 2 Normalized Cu XANES spectra measured at a synchrotron radiation facility (black) and with the XANES-optimized optic in the laboratory-based spectrometer (red). | ||
As expected, the spectral resolving power is lower for the Lab-XAFS. This can mainly be seen around the edge itself as the oscillations seem to be damped. Nevertheless, all features can be reproduced, and the total overlap of both spectra is extraordinarily good. The increasing noise below E = 8950 eV and above E = 9350 eV indicates the borders of the reflectivity curve of the optic due to its meridional length as can be seen in Fig. 3. As the detector is a photon counting detector, the effective photon flux can be given and is depicted in red. This includes the source's emission characteristic at the given X-ray tube parameters, the energy-dependent integrated reflectivity of the optic and the efficiency of the evaluation algorithm. In the maximum, a photon flux without a sample of approximately Φ0 ≈ 8.5 × 10² photons per (s eV) is reached. The bandwidth by means of the full width at half maximum is around 300 eV, and therefore covers even more than what is usually declared as the XANES region. In summary that leads to a total photon flux of around 240![[thin space (1/6-em)]](https://www.rsc.org/images/entities/char_2009.gif) 000 photons per s summed up for all energies above the absorption edge.
000 photons per s summed up for all energies above the absorption edge.
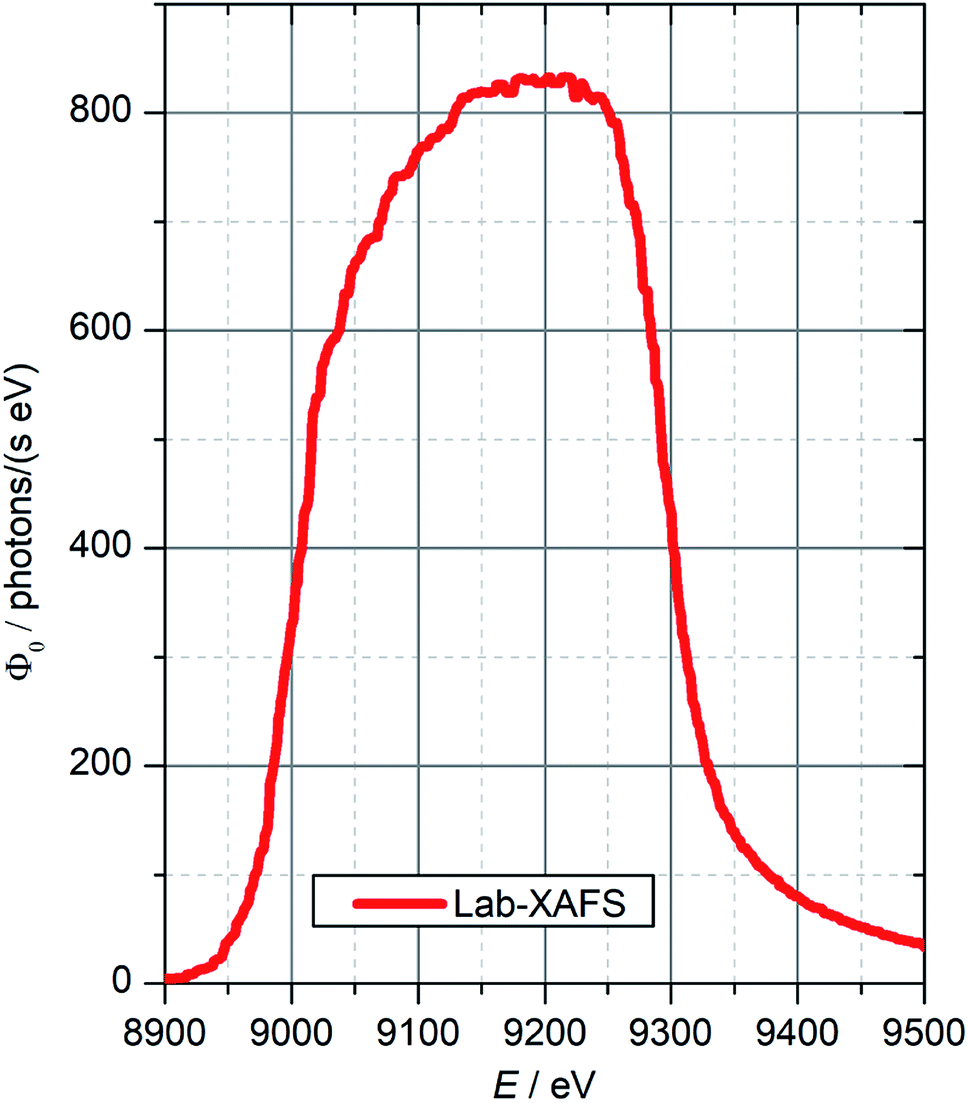 | ||
| Fig. 3 Measured photon flux for the XANES-optimized optic at the Cu K absorption edge energy. The curve is mainly given by the emission characteristics of the X-ray tube, the energy-dependent integrated reflectivity of the optic and the efficiency of the evaluation algorithm that is used to get from the 2D image to the displayed spectrum. Therefore, this curve represents the actual performance of the spectrometer in terms of photon flux and spectral bandwidth. | ||
In Table 1, the photon flux is depicted for various absorption edges that cover the energetic range of the spectrometer.
| Edge | Energy/eV26 | Φ 0/photons per (s eV) | |
|---|---|---|---|
| XANES | EXAFS | ||
| Ti K | 4964.58 | 2300 | 34000 |
| Fe K | 7110.75 | 2250 | 25900 |
| Cu K | 8980.48 | 850 | 15000 |
| Zn K | 9660.76 | 600 | 13200 |
| Au L3 | 11919.69 |
— | 3500 |
4. Optimization for EXAFS measurements
In contrast to XANES measurements, EXAFS mainly requires a high photon flux to detect low amplitude oscillations on top of the absorption edge. Additionally, a large wavevector of the photoelectron is desirable, i.e. k = 16 Å−1 which translates to an energetic bandwidth of the photons of around ΔE = 1 keV above the absorption edge. To fulfill these requirements at optimized costs (small area of the optic), an optic with a smaller bending radius, i.e. R = 100 mm was chosen. This reduces the spectral resolving power, which is in the range of E/ΔE ≈ 1800 close to the absorption edge. The thickness of the crystal is T = 40 μm and the optics dimensions are 160 mm × 76.7 mm. The large meridional length enables an energy bandwidth of ΔE = 2 keV. It is also essential to have a rather homogeneous optic like the presented one, which can be sometimes challenging for graphite mosaic crystals, especially with these large dimensions.As before, the same copper foil was measured, and the same reference spectrum was taken to compare the performance. For EXAFS, usually the extracted oscillations χ(k) depending on the photoelectron wave vector k are shown, as the Fourier transformation of this signal gives information on the bonding distances and number of neighboring atoms. The resulting oscillations and the corresponding Fourier transformations are shown in Fig. 4(a) and (b), respectively. Here, the measurement time was t = 250 s in total with ts = 178 s for the measurement with the sample and t0 = 71 s for the one without the sample. The predetermined signal to noise ratio for this measurement is SNR = 1500 at a photon energy of ΔE = 1000 eV above the absorption edge with decreasing values towards lower and higher photon energies. This was estimated with the number of detected photons per energy channel, the total absorption of the spectrum and relative oscillation height given by χ(k). The first point includes the later introduced variation of the energy channel width in the image evaluation.
 | ||
| Fig. 4 EXAFS oscillations and corresponding Fourier transformation for SR-XAFS (black) and Lab-XAFS (red). (a) EXAFS oscillations χ(k). (b) Fourier transformation of χ(k). | ||
We ascribe the visible damping of the oscillations to the relatively low spectral resolving power of around E/ΔE ≈ 1800 at the absorption edge. Due to the damping in the EXAFS-oscillations the Fourier transform is also damped. Nevertheless, the general shape is the same in both cases as well as the position of the peaks. Also, a thorough study and comparison of measurements performed at a synchrotron radiation facility with a laboratory-based spectrometer was conducted by Kampers et al.23 already in 1985. Following their calculations, a spectral resolution of 20 eV is usually sufficient to retrieve structural information. Only when having low Z scatterers at high coordination distances, will the requirements for the spectral resolution increase.
We assume that with a reference sample with a known structure, e.g. pure elemental foil, this damping can be determined and used to evaluate spectra of unknown samples. Then, not only the peak position and hence the bonding distances, but also the peak height, a measure for the coordination number, could be extracted. However, this as well as an optimal spectrum handling to see how reliable extracted coordination numbers will be are yet to be shown.
Again, the photon flux is depicted, see Fig. 5. As before, the form is given by the emission characteristic, the optic's energy dependent integrated reflectivity and the efficiency of the evaluation algorithm. The drop in intensity at around E = 8800 eV is due to the decreasing evaluation area between the two limiting lines, see Fig. 6. The total photon counts above the Cu K edge are around 20000000 photons per s.
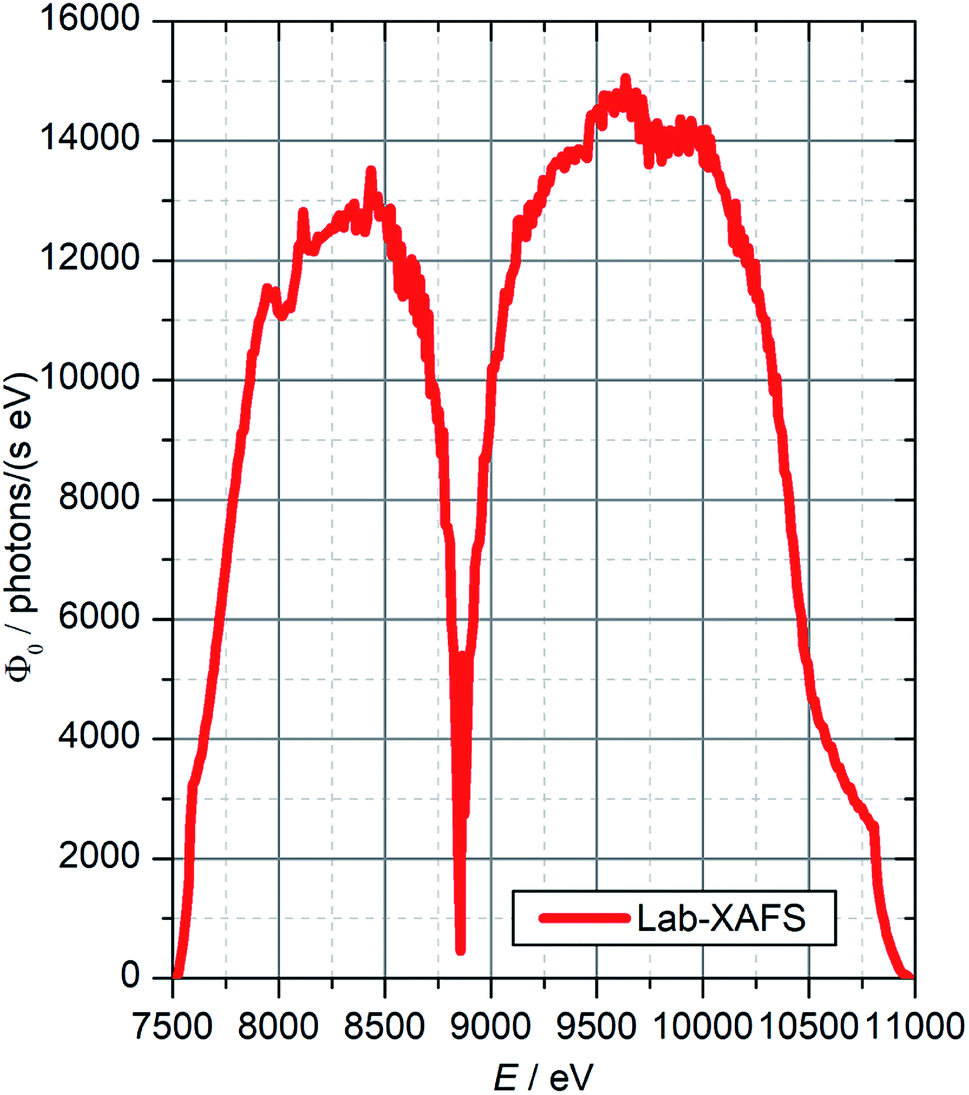 | ||
| Fig. 5 Measured photon flux for the EXAFS-optimized optic at the Cu K absorption edge energy. The drop in flux at the focus energy is introduced by the evaluation algorithm, see Fig. 6. The combination of large spectral bandwidth and high flux is well suited for EXAFS measurements. | ||
 | ||
| Fig. 6 Photon flux per second and pixel for the EXAFS-optimized configuration. The limiting lines of the image evaluation algorithm are shown. With these, the drop in intensity at the focus position shown in Fig. 5 can be explained due to the decreasing evaluation area. Also, the direction of the energy axis for the used configuration is highlighted. | ||
As before, Table 1 shows the photon flux for various energies within the spectral range of the spectrometer. The optimization of the spectrometer for the energy range of E = 4 keV to E = 10 keV can be seen, as the flux strongly decreases towards higher energies. The values are always given for an optimized high voltage of the X-ray tube. For both, XANES and EXAFS optics, the needed acquisition time for a given sample can be estimated when, first, the absolute value α and step height in absorption Δα, e.g. by performing a quick measurement, and, second, the relative height of the oscillations δrel that one wants resolved, are known. The second parameter depends on the analyte, while the first one is influenced by the analyte's concentration and the matrix and overall thickness of the sample. The needed acquisition time t to achieve a signal-to-noise ratio such as to have the signal noise lower than the oscillations one wants to observe by a factor m (usually 0.1) can then be described by

Let's assume a sample with 1 wt% of copper in a SiO2 matrix. For an optimal thickness of around 90 mg cm−2, one would get an absolute absorption of around α ≈ 2.55 and a step height of Δα ≈ 0.22 (calculated with the NIST database24,25). For EXAFS measurements, one can at first assume relative oscillation amplitudes of 0.01 which finally leads to a total acquisition time of t ≈ 7.8 h. This estimation can be performed for various sample types, concentrations and matrices.
Additionally, to increase the signal-to-noise ratio especially for high k in the EXAFS case, an image evaluation with non-equidistant energy steps was chosen in such way, that the step width in k-space is constant Δk = 0.05 Å−1. For that, first an equidistant energy step width was chosen to find the energy of the absorption edge E0 by using ATHENA. Afterwards the detector image was again evaluated but this time with energy intervals starting from E0 that correspond to the mentioned constant step width in k-space. This leads to larger energy intervals at high energies above the edge (almost 6 eV at 1 keV above the edge) and therefore to a better statistic at these energies further away from the absorption edge. This is necessary, as for high k the amplitude of the oscillations strongly decreases and therefore, the signal-to-noise ratio needs to be higher to resolve these oscillations.
5. Conclusions & outlook
In this work, an existing spectrometer for laboratory-based XAFS experiments that was already successfully used in various scientific fields was significantly improved in various ways. This includes optimized spectrometer components, i.e. a microfocus X-ray tube for high powers at low high voltages, a large pixelated detector with photon counting capabilities required for a large bandwidth and finally, optimized HAPG-based optics for XANES and EXAFS experiments, respectively. This drastically improves the spectrometer's efficiency with respect to sample throughput as well as the spectroscopic performance.The spectrometer is based on the adapted von Hamos geometry and HAPG mosaic crystals, both equally contributing to the high efficiency. The new optics are the key component to enable XANES and EXAFS. The spectral resolving power in the XANES case achieved is E/ΔE = 4000 with an energetic bandwidth of around 300 eV, while for the EXAFS-optimized configuration a spectral resolving power E/ΔE = 1800 close to the absorption edge and a spectral bandwidth of 1 keV is achieved. Measurement times were t = 8 min and t = 250 s in the XANES and EXAFS cases, respectively. Both show a highly improved performance compared to the previously reported setup for the respective cases, i.e. spectral resolving power that was increased by a factor of two from E/ΔE = 2000 to E/ΔE = 4000 (XANES), bandwidth that was increased from a few hundred electronvolts to more than 1 keV (EXAFS) and finally photon flux, that went up from Φ0 ≈ 2 × 10³ photons per (s eV) to Φ0 ≈ 1.5 × 10⁴ photons per (s eV) by one order of magnitude for the copper K-absorption edge (EXAFS).
In conclusion, this development strongly increases the possibility of performing XANES and EXAFS in the laboratory not only on ideal, highly concentrated samples, but also on samples that are diluted with concentrations of the analyte down to a few weight percent or even less. In particular, for EXAFS experiments these results are very promising as the high flux combined with the large, simultaneously acquired spectral bandwidth opens a new way for EXAFS experiments in the laboratory.
Hence, this development will pave the way towards routine XAFS (XANES and EXAFS) spectroscopy in the laboratory which significantly will broaden its use in a wide range of application fields, either as a standalone addition to various analytical characterization methods or as a support and/or addition for more complex investigations that again need the flexibility and performance of synchrotron radiation facility-based XAFS. Of course, this development will be followed by the need to change the view on how to use XAFS. Applications that will be performed in the laboratory and at synchrotron radiation facilities will not only have different needs but also limitations.
Ongoing developments mainly aim for dealing with the damping of oscillations to maintain high quality of EXAFS data even with this experimentally induced effect and in general to evaluate the new possibilities but also restrictions that follow the evolution in data handling.
Appendixes
There are no appendixes.Conflicts of interest
There are no conflicts to declare.Acknowledgements
We are especially grateful for the long-term cooperation and many fruitful discussions with Inna Grigorieva and Alexander Antonov from Optigraph GmbH, the supplier of HAPG optics. Additionally, we thank Alexander Warrikhoff and rtw RÖNTGEN-TECHNIK DR. WARRIKHOFF GmbH & Co. KG for the development of an X-ray tube optimized to our needs.References
- J. E. Penner-Hahn, X-ray absorption spectroscopy in coordination chemistry, Coord. Chem. Rev., 1999, 190–192, 1101–1123 CrossRef.
- G. T. Seidler, D. R. Mortensen, A. J. Remesnik, J. I. Pacold, N. A. Ball, N. Barry, M. Styczinski and O. R. Hoidn, A laboratory-based hard X-ray monochromator for high-resolution X-ray emission spectroscopy and X-ray absorption near edge structure measurements, Rev. Sci. Instrum., 2014, 85, 113906 CrossRef PubMed.
- E. P. Jahrman, W. M. Holden, A. S. Ditter, D. R. Mortensen, G. T. Seidler, T. T. Fister, S. A. Kozimor, L. F. J. Piper, J. Rana, N. C. Hyatt and M. C. Stennett, An improved laboratory-based X-ray absorption fine structure and X-ray emission spectrometer for analytical applications in materials chemistry research, Rev. Sci. Instrum., 2019, 90, 024106 CrossRef PubMed.
- R. Bès, T. Ahopelto, A.-P. Honkanen, S. Huotari, G. Leinders, J. Pakarinen and K. Kvashnina, Laboratory-scale X-ray absorption spectroscopy approach for actinide research: experiment at the uranium L3-edge, J. Nucl. Mater., 2018, 507, 50–53 CrossRef.
- A.-P. Honkanen, S. Ollikkala, T. Ahopelto, A.-J. Kallio, M. Blomberg and S. Huotari, Johann-type laboratory-scale X-ray absorption spectrometer with versatile detection modes, Rev. Sci. Instrum., 2019, 90, 033107 CrossRef PubMed.
- F. Wei, Z. W. Chen and W. M. Gibson, Measurement of oxidation states for transition elements with a small spot tabletop XANES instrument, X-Ray Spectrom., 2009, 38, 382–385 CrossRef.
- J. G. Moya-Cancino, A.-P. Honkanen, A. M. J. van der Eerden, H. Schaink, L. Folkertsma, M. Ghiasi, A. Longo, F. M. F. de Groot, F. Meirer, S. Huotari and B. M. Weckhuysen, Elucidating the K-Edge X-Ray Absorption Near-Edge Structure of Cobalt Carbide, ChemCatChem, 2019, 11, 3042 CrossRef CAS.
- M. Lusa, H. Help, A.-P. Honkanen, J. Knuutinen, J. Parkkonen, D. Kalasová and M. Bomberg, The reduction of selenium(IV) by boreal Pseudomonas sp. strain T5-6-I – effects on selenium(IV) uptake in Brassica oleracea, Environ. Res., 2019, 177, 108642 CrossRef CAS.
- L. M. Mottram, M. C. D. Wilkins, L. R. Blackburn, T. Oulton, M. C. Stennett, S. K. Sun, C. L. Corkhill and N. C. Hyatt, A Feasibility Investigation of Laboratory Based X-ray Absorption Spectroscopy in Support of Nuclear Waste Management, MRS Adv., 2020, 5(1–2), 27–35 CrossRef CAS.
- Z. Németh, J. Szlachetko, E. G. Bajnóczi and G. Vankó, Laboratory von Hámos X-ray spectroscopy for routine sample characterization, Rev. Sci. Instrum., 2016, 87, 103105 CrossRef PubMed.
- J. Hoszowska, J.-C. Dousse, J. Kern and C. Rhême, High-resolution von Hamos crystal X-ray spectrometer, Nucl. Instrum. Methods Phys. Res., Sect. A, 1996, 376, 129–138 CrossRef CAS.
- W. Błachucki, J. Czapla-Masztafiak, J. Sá and J. Szlachetko, A laboratory-based double X-ray spectrometer for simultaneous X-ray emission and X-ray absorption studies, J. Anal. At. Spectrom., 2019, 34, 1409–1415 RSC.
- C. Schlesiger, L. Anklamm, H. Stiel, W. Malzer and B. Kanngießer, XAFS spectroscopy by an X-ray tube based spectrometer using a novel type of HOPG mosaic crystal and optimized image processing, J. Anal. At. Spectrom., 2015, 30, 1080–1085 RSC.
- X. Zhao, P. Pachfule, S. Li, T. Langenhahn, M. Ye, C. Schlesiger, S. Praetz, J. Schmidt and A. Thomas, Macro/Microporous Covalent Organic Frameworks for Efficient Electrocatalysis, J. Am. Chem. Soc., 2019, 141(16), 6623–6630 CrossRef CAS PubMed.
- H. V. Le, S. Parishan, A. Sagaltchik, C. Goebel, C. Schlesiger, W. Malzer, A. Trunschke, R. Schomäcker and A. Thomas, Solid-State Ion-Exchanged Cu/Mordenite Catalysts for the Direct Conversion of Methane to Methanol, ACS Catal., 2017, 7, 1403–1412 CrossRef CAS.
- M. Dimitrakopoulou, X. Huang, J. Kröhnert, D. Teschner, S. Praetz, C. Schlesiger, W. Malzer, C. Janke, E. Schwab, F. Rosowski, H. Kaiser, S. Schunk, R. Schlögl and A. Trunschke, Insights into structure and dynamics of (Mn,Fe)Ox-promoted Rh nanoparticles, Faraday Discuss., 2018, 208, 207–225 RSC.
- P. W. Menezes, C. Walter, J. N. Hausmann, R. Beltrán-Suito, C. Schlesiger, S. Praetz, V. Yu. Verchenko, A. V. Shevelkov and M. Driess, Boosting Water Oxidation through In Situ Electroconversion of Manganese Gallide: An Intermetallic Precursor Approach, Angew. Chem., Int. Ed., 2019, 58, 16569 CrossRef CAS PubMed.
- C. Schlesiger, L. Anklamm, W. Malzer, R. Gnewkow and B. Kanngießer, A new model for the description of X-ray diffraction from mosaic crystals for ray-tracing calculations, J. Appl. Crystallogr., 2017, 50, 1490–1497 CrossRef CAS.
- B. Ravel and M. Newville, ATHENA, ARTEMIS, HEPHAESTUS: data analysis for X-ray absorption spectroscopy using IFEFFIT, J. Synchrotron Radiat., 2005, 12, 537–541 CrossRef CAS PubMed.
- I. Johnson, A. Bergamaschi, H. Billich, S. Cartier, R. Dinapoli, D. Greiffenberg, M. Guizar-Sicairos, B. Henrich, J. Jungmann, D. Mezza, A. Mozzanica, B. Schmitt, X. Shi and G. Tinti, Eiger: a single-photon counting X-ray detector, J. Instrum., 2014, 9, C05032 CrossRef.
- W. Malzer, D. Grötzsch, R. Gnewkow, C. Schlesiger, F. Kowalewski, B. Van Kuiken, S. DeBeer and B. Kanngießer, A laboratory spectrometer for high throughput X-ray emission spectroscopy in catalysis research, Rev. Sci. Instrum., 2018, 89, 113111 CrossRef PubMed.
- A. Lanzirotti, M. Newville, L. Manoukian and K. Lange, High-speed, coupled micro-beam XRD/XRF/XAFS mapping at GSECARS: APS beamline 13-ID-E, The Clay Minerals Society Workshop Lectures Series, 2016, ch. 5, vol. 21, pp. 53–64 Search PubMed.
- F. W. H. Kampers, F. B. M. Duivenvoorden, J. B. A. D. van Zon, P. Brinkgreve, M. P. A. Viegers and D. C. Koningsberger, Laboratory EXAFS Spectrometer, Principles and Applications, Solid State Ionics, 1985, 16, 55–64 CrossRef CAS.
- C. T. Chantler, Detailed Tabulation of Atomic Form Factors, Photoelectric Absorption and Scattering Cross Section, and Mass Attenuation Coefficients in the Vicinity of Absorption Edges in the Soft X-Ray (Z = 30–36, Z = 60–89, E = 0.1 keV–10 keV), Addressing Convergence Issues of Earlier Work, J. Phys. Chem. Ref. Data, 2000, 29(4), 597–1048 CrossRef CAS.
- C. T. Chantler, Theoretical Form Factor, Attenuation and Scattering Tabulation for Z = 1–92 from E = 1–10 eV to E = 0.4–1.0 MeV, J. Phys. Chem. Ref. Data, 1995, 24, 71 CrossRef CAS.
- S. Kraft, J. Stümpel, P. Becker and U. Kuetgens, High resolution X-ray absorption spectroscopy with absolute energy calibration for the determination of absorption edge energies, Rev. Sci. Instrum., 1996, 67, 681–687 CrossRef CAS.
| This journal is © The Royal Society of Chemistry 2020 |