 Open Access Article
A prospective microwave plasma source for in situ spaceflight applications†
B. J.
Farcy
 *a,
R. D.
Arevalo
Jr
 a,
M.
Taghioskoui
 b,
W. F.
McDonough
 ac,
M.
Benna
 d and
W. B.
Brinckerhoff
 d
d
aDepartment of Geology, University of Maryland, College Park, MD 20742, USA. E-mail: bfarcy@terpmail.umd.edu
bTrace Matters Scientific, Somerville, MA 02143, USA
cDepartment of Earth Sciences, Research Center for Neutrino Science, Tohoku University, Sendai, 980-8578, Japan
dNASA Goddard Space Flight Center, Greenbelt, MD 20771, USA
First published on 7th October 2020
Abstract
Noble gas plasmas are commonly used as ion and excitation sources in inductively coupled plasma (ICP) optical emission and mass spectrometry for organic and inorganic chemical analysis. However, the high power (∼kW) and voluminous gas flow rate (∼15 L min−1) of commercial plasmas limit their potential deployment in remote terrestrial and planetary environments. Here, using argon and helium gas supplies, we investigate the fundamental characteristics of low power and reduced-pressure microwave plasmas for organic and elemental analysis. These plasmas require a fraction of the power (<25 W) and gas (<0.2 L min−1) compared to conventional ICP systems. Langmuir probe measurements were used to determine electron temperatures and electron densities for both helium and argon plasmas under a range of forward of powers and gas flow rates. Ionization efficiencies for select organic compounds and elemental species were estimated from these results using the Saha equation. Our findings show that at 23 W of forward power and 0.2 L min−1 gas flow rate, an argon plasma can fully ionize (>99%) organic molecules or elements with high ionization potentials (e.g. glycine, 8.9 eV, or S, 10.4 eV); in comparison, helium can achieve similar performance metrics with as little as 5 W of forward power.
1 Introduction
Constraints on planetary surface composition are obtained through various analytical techniques, including ground-based telescopes, remote sensing from orbiting spacecraft, and in situ measurements from landed platforms. In situ spectroscopic techniques provide particularly valuable information across a range of spatial scales, such as correlated measurements of mineralogy, elemental composition, and biomarker detection, as demonstrated by the Sample Analysis at Mars (SAM) instrument onboard the Curiosity rover.1–3 Advances in laser desorption/ablation mass spectrometry target the unambiguous identification of potential biosignatures, and contextualize geological relationships that inform on molecular provenance and formation mechanisms.4 However, such techniques are challenged to meet the figures of merit (e.g., accuracy, precision, and detect limits) required to provide quantitative bounds on elemental composition and/or organic inventory, particularly for refractory elements and macromolecular compounds.In the commercial realm, plasmas are routinely applied as robust and reproducible sources for optical emission spectra,5,6 as well as ionized organic compounds and monoatomic ions for mass spectrometry.7–14 Commercial inductively coupled plasmas (ICPs) operate at high power output (>1 kW) and ionize desolvated solutions or ablated geologic material. Recent advances in plasma technology demonstrate that low power plasma sources, operating at ambient or reduced pressure, perform direct desorption and ionization of molecular compounds or geologic materials in their native state, although the potential to atomize large particles remains poorly constrained.14 These sources typically operate at low power (3–30 W) and low gas flow rates (<1 L min−1), opening the potential for them to be used as in situ instruments for spaceflight. Despite this progress, the ionization capabilities of these low power plasma sources for organic or elemental analysis require further characterization.
Here, we document the capability of microwave induced plasmas (MIPs), operating at low power and low pressure with argon and helium, to ionize refractory elements and macromolecular organics. We measured the fundamental parameters of the plasma via Langmuir probe over a range of forward powers and gas flow rates: specifically, electron temperatures, electron densities, and ion currents were recorded under each set of analytical conditions. These data are used in conjunction with the Saha equation to estimate the first ionization capabilities of these plasmas for molecular and elemental analyses and can be applied to any specific analyzer. We define the performance capabilities of the plasma source, highlighting the potential for this subsystem to serve as an effective spaceflight ionization source. Applications of this plasma source extend from the ionization and controlled fragmentation (to derive structural information) of organic compounds on ocean worlds, to the quantitative analysis of trace elements on the surfaces of rocky planetary bodies, to the derivation of radiometric ages via the Rb–Sr and/or U–Th–Pb systems.
2 Methods
2.1 Experimental setup
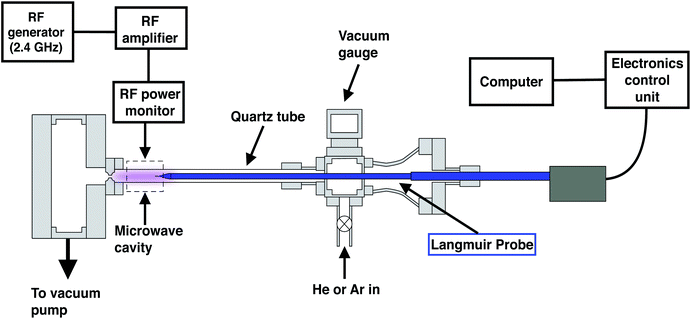
Fig. 1 presents a schematic of our vacuum chamber to generate a low pressure, low power plasma that can operate as an ion source for a prototype spaceflight chemical analyzer. The setup in Fig. 1 is coupled to a Langmuir probe to characterize the fundamental properties of the plasma, enabling quantitative insights into the ionization efficiencies of different analytes.We use a resonance cavity to produce a microwave plasma, which is generated within a quartz tube (12.5 mm outer diameter and 1.25 mm wall thickness) passing through the cavity.15 A signal generator (Hewlett Packard, 8648C) produces a radio frequency (RF) between 2.3–2.45 GHz, enhanced by a RF amplifier (Mini-Circuits, ZHL-30-252-s+) that provides improvements in linear performance and gain. The amplified RF signal is then fed into an Evanson microwave cavity16 (Opthos Instruments) via a bi-directional coupler. Two power meters (ImmersionRC, 8452) are connected to the coupler to monitor the forward and reflected power in real-time.
In contrast to the Evanson microwave cavity employed here, commercial inductively coupled plasma optical emission spectroscopy (ICPOES) or mass spectrometry (ICPMS) instruments typically use a coil wrapped around a quartz tube. In these systems, the frequency of RF frequency is generally 13.56, 27.12 or 40.68 MHz, and a capacitive network matches the impedance of the coil to the impedance of the RF power supply. Lower frequency atmospheric pressure argon plasmas can be advantageous, producing higher signal to noise ratios and analyte excitation temperatures.17 However, high frequency microwave plasmas (>100 MHz) generally produce greater ion beam currents, lower beam energy dispersion, and better frequency coupling to the plasma.17–19 Here, we use a high frequency plasma for its enhanced coupling efficiency at lower power outputs.
In order to maximize the forward power of the microwave, the resonance frequency of the cavity is tuned using the cavity's tuning rod to minimize the reflected power, and then the output frequency was further optimized to match the resonance frequency of the cavity. A second resistive tuning element allowed impedance matching to minimize reflected power. This tuning procedure is performed in all experiments to maintain a reflected power of <5%.
The quartz tube connects two vacuum chambers and argon or helium is introduced via a mass flow controller (Alicat, MC-500SCCM-D) into the first chamber and subsequently pumped downstream through the chamber using an oil-free roughing pump. A 1 mm (±25 μm) laser-drilled conductance limiting orifice (Lenox Laser, SS-CF-2-1000) separates the pumping chamber and the quartz tube in order to restrict gas flow and enable differential pumping between the two chambers. The plasma chamber is evacuated to a pressure of <100 millitorr (10 Pa) and back-filled with a controlled flow of plasma gas, ranging from 200 to 10 standard cubic centimeters per minute (SCCM), and supporting the characterization of plasma across a range of pressures from 1–10 torr (∼100–1000 Pa). The power is adjusted from 5–23 W to maintain a stable plasma across these flow rate and pressure parameters. A commercial Langmuir probe (Impedans Inc.) having a 0.25 mm diameter and a 10 mm long tungsten probe tip was inserted into the quartz tube to measure plasma characteristics. Voltage on the probe was swept over a range of −50 to 50 V and the resulting I–V curves were recorded using the Impedans Langmuir probe software.
2.2 Langmuir probe data processing
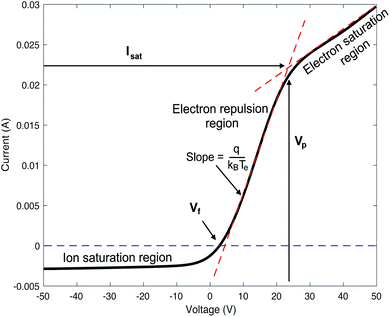
The Langmuir probe is a diagnostic tool used to measure the fundamental characteristics of a plasma. The probe is a conducting wire that is inserted into a plasma. An I–V curve is generated by measuring the current resulting from an applied or bias voltage. The values for plasma potential (Vp), floating potential (Vf), electron temperature (Te), electron density (Ne), and electron energy distribution function (EEDF) are calculated from I–V curve measurements.20–22Vp describes the electric field potential in the space in between the ions or electrons in the plasma, and thus the potential of the plasma relative to ground. Vp is defined by the voltage value at which the I–V curve shows the greatest change in slope , and Vf is defined as the voltage value at which the ion and electron current are equal, resulting in a net zero current.
V p is determined by taking the natural log of the measured current and fitting a line to the region above and below the change in slope, or the “knee” of the curve. The intersection of these two lines identifies Vp (Fig. 2).
The slope of the electron repulsion region can be used to calculate electron temperature (Te) as:
 | (1) |
 | (2) |
The electron energy distribution function (EEDF), for this type of low temperature plasma, approximates a single Maxwellian distribution of electron temperatures that are higher than the bulk plasma temperature. The EEDF was calculated using the second derivative of the I–V curve, with the ion current subtracted, as:
 | (3) |
In addition to Te and Ne measurements, a static potential is applied to the Langmuir probe and the ion current is measured in the center of the plasma. The ion current is proportional to ion density, so it is used to calculate changes in plasma ion/neutral ratio with changing plasma input parameters. The experiments are conducted for both argon and helium gases to compare performance under a range of conditions. While the physical characteristics of the plasma change laterally on either side of the microwave cavity, the three dimensional nature of the plasma was not investigated here. Instead, because the probe is measuring the plasma at its hottest position, the ion current, Te, and Ne values measured represent upper bounds of the plasma state and we assume a drop off in values as the probe position changes.
3 Langmuir probe measurements
3.1 The effects of plasma power on Te and Ne
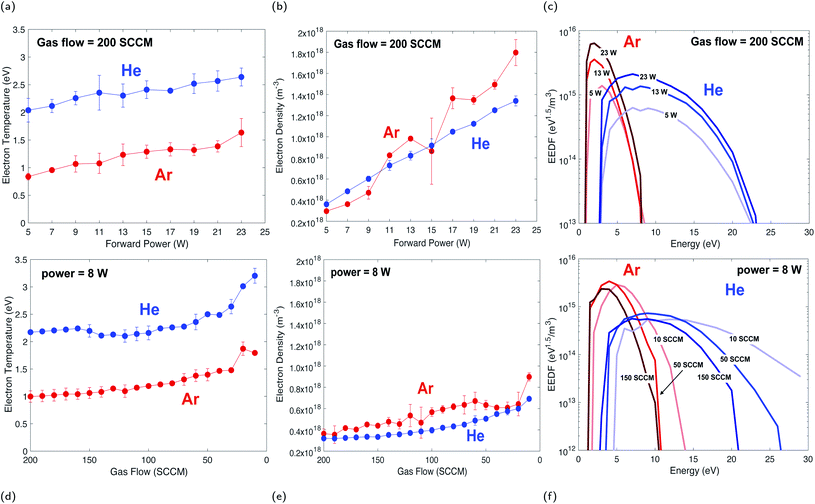
A compilation of measured I–V curves taken over a range of forward plasma powers is shown in Fig. 3. The gas flow rate was maintained at 200 SCCM while power was varied in order to study the effects of plasma power on Te and Ne. Ramping up the plasma power (5–23 W) resulted in an increase in Ne by a factor of 3 for helium and a factor of 5 for argon, as indicated by increasing Isat, and only slight increases (a few percent) in Te (Fig. 4a), due to a minimal change in Vp (Fig. 3a and b).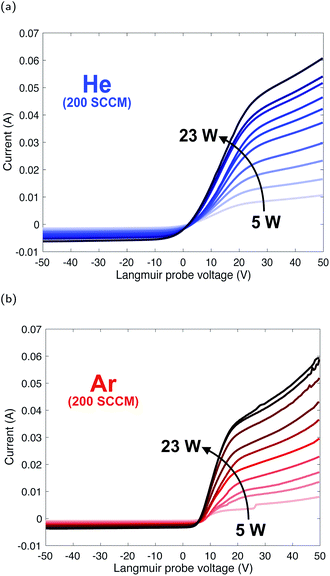 | ||
| Fig. 3 Composite of I–V curves taken over a range of plasma powers for helium (a) and argon (b) plasmas at a constant gas flow rate. | ||
The trend in electron density with changing plasma power (Fig. 4b) is due to a greater number of high-energy inelastic collisions occurring with increasing forward plasma power. Increasing power produces an increase in the amplitude of oscillations, thus more energy per electron per oscillation. Unlike low mass electrons, large atoms/molecules have insufficient time to respond to changes in polarity in the resonance cavity (which control directional changes in the plasma magnetic field) at microwave frequencies. This is corroborated by similar increases in ion current (more below, Fig. 5).
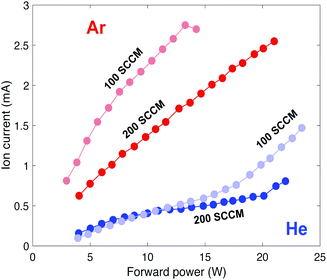 | ||
| Fig. 5 Ion current versus forward power taken with a −20 V static voltage potential applied to the Langmuir probe for 200 and 100 SCCM gas flow rates. | ||
This weak relationship between Te and plasma power is consistent with measurements from other studies of inductively coupled RF plasmas.23–25 The higher Te for helium, as compared to an argon plasma, is likely due to helium having a higher thermal conductivity than argon (0.151 and 0.018 W mK−1 at 25 °C and 0.1 MPa, respectively).26 However, the response difference in Ne follows from the differences in ionization potential of argon versus helium (15.8 eV and 24.6 eV, respectively) and ionization cross section (3 × 10⁻¹⁶ and 0.4 × 10⁻¹⁶ cm2, respectively).27
The plasma gas temperature (Tgas) was measured using a hand held IR thermal imager (Keysight Technologies, U5850 series). The argon gas temperature measured over the range of forward power increased from 340 to 380 K, while the helium gas temperature increased from 380 to 510 K.
3.2 The effects of gas flow rate on Te and Ne
The plasma gas flow rate in the system also affects the physical characteristics and ionization capabilities of the plasma. To assess these responses, the plasma power was kept constant at 8 W while the flow rate of plasma gas was changed from 200 to 10 SCCM. Changes in Te and Ne as a function of gas flow rate is shown in Fig. 4d and e. Both Te and Ne are inversely proportional to gas flow rate, with their highest values being measured at the lowest gas flow rates.For both gases there is about a 40% increase in Te with a factor of 10 decrease in gas flow rate. The relationship between Te and gas flow rate is driven by the electron collision frequency. If electrons are borne with a set kinetic energy, then inelastic collisions decrease that kinetic energy with each collision. A decrease in gas pressure, and thus a decrease in electron collisions, allows electrons to better retain their initial kinetic energy.25,28
The mean free path of an electron in a plasma can be calculated using the Debye length, or the distance a plasma can shield from external charge.29 The Debye length is calculated as:
 | (4) |
 | (5) |
With the electron mean free path calculated as:
| λMFP ∼ λD × ND | (6) |
This results in electron mean free paths of ∼tens of cm in Ar plasma and ∼1 m in He plasma. A root mean square velocity (VRMS) of the electron is calculated to be tens of km s−1, as:
 | (7) |
Thus, decreasing gas pressure decreases mean free path by increasing electron density. The electron–ion collision frequency is calculated as:
 | (8) |
Changes in electron temperature and density are reflected in the calculated EEDF, where Te and Ne both affect the distribution of electron energy in the plasma. Based on their calculated EEDFs, helium has a wider energy distribution and a greater population of high energy electrons than an argon plasma (Fig. 4c and 4f). This “hot tail” of electrons has been previously documented, and is generated from elastic collisions of helium in metastable states.30 The mean energy of each distribution shows little variation with changing plasma power, but shows a systematic increase in energy distribution with decreasing gas flow rate.
3.3 Ion current measurements
The measured ion current reflects the overall population densities, with changes in plasma power or gas flow rate manipulating the plasma's ion and electron populations. Fig. 5 shows plasma ion current versus forward power for two different gas flow rates and gases with a static potential of −20 V applied to the Langmuir probe.The measured ion currents for argon and helium show markedly different behaviors. Regardless of the specific set of conditions, argon plasmas have higher ion currents than helium plasmas; further, argon ionization is more sensitive to changes in gas flow rate. Thus, argon is more easily ionized by a change in both pressure and power, which is again reflective of its lower first ionization potential and greater ionization cross section relative to helium. The different curves of ion current for 200 and 100 SCCM are consistent with Ne measurements, where electron density is inversely proportional to gas flow rate.
The ion density of the plasma is related to the electron density, assuming plasma quasineutrality and negligible contributions from 2+ ions (Ne = Ni, see ESI†). Thus, the previously measured electron density can be used to estimate the ion/neutral ratio of the plasma. We calculate the neutral gas density (Ngas) using the ideal gas law (PV = nRT). The plasma gas pressure was 10 torr (1300 Pa), the chamber volume was 3.3 cm3, and the maximum values for Tgas were 360 K for argon and 510 K for helium. From this, the total gas density within the volume of the quartz tube is 7 × 10¹⁷ atoms. Assuming a measured Ne value of 1017–1018 m−3, this yields an ion/neutral ratio of 10−5–10−6. This is two to three orders of magnitude lower than commercial, high power plasmas with a typical ion/neutral ratio of 10−3.31 A comparison of the characteristics of this plasma to those used in commercial systems is found in Table 1.
| Operating Condition | Commercial | Experimental |
|---|---|---|
| Plasma gas | Ar | Ar, He |
| Forward power | 1000–1300 W | 5–23 W |
| Plasma gas flow rate | 14–16 L min−1 | 0.01–0.2 L min−1 |
| Frequency | 13, 27, or 40 MHz | 2400 MHz |
| Power coupler | Inductor | Microwave cavity |
| Max electron temp. | 10![[thin space (1/6-em)]](https://www.rsc.org/images/entities/char_2009.gif) 000 K 000 K |
35![[thin space (1/6-em)]](https://www.rsc.org/images/entities/char_2009.gif) 000 K (He) 000 K (He) |
| Max gas temp. | 10![[thin space (1/6-em)]](https://www.rsc.org/images/entities/char_2009.gif) 000 K 000 K |
510 K (He) |
| Electron density | 1021 m−3 | 1018 m−3 |
| Ion/neutral ratio | 10−3 | 10−5* |
4 Estimates for analyte ionization
The plasma described here is being developed to ionize injected samples for chemical and isotopic analyses. Therefore, steps must be taken to estimate the ionization efficiency of the plasma on individual organic (molecular) and elemental (atomic) species. The ion/neutral ratio calculated in the previous section is specific to the plasma gas itself, but the parameters measured via Langmuir probe, namely Te and Ne, can inform the ionization efficiencies of other elements using the Saha equation.The Saha equation31–35 is:
 | (9) |
 | (10) |
Using the ionization constant (Kion), the proportion of input sample ions to neutrals (αi) is:
 | (11) |
In order to gain confidence in our use of the Saha equation, we performed an additional experimental check on the Saha ionization of an analyte in a plasma environment. We performed a series of ICP-OES measurements on the ion/neutral ratio of three elemental samples (Mg, La, and Zn), as well as on the Te and Ne values of the plasma itself. The values for Te and Ne were input into the Saha equation, and the Saha-predicted ionization efficiency was compared to the directly measured ion/neutral ratio from line emission intensities. Our results show that the Saha equation produces ionization efficiency estimates within 2–5% of measured ratios, validating our use of the Saha equation for these models (see ESI† for more details).
Although our Langmuir probe measurements of plasma Te range from 10![[thin space (1/6-em)]](https://www.rsc.org/images/entities/char_2009.gif) 000–35
000–35![[thin space (1/6-em)]](https://www.rsc.org/images/entities/char_2009.gif) 000 K (∼1–3 eV), plasma Tgas measurements are much lower, in the range of 340–510 K based on measurements taken with the handheld IR thermal imager. Because there is a divergence between gas and electron temperatures, the plasma is not at a local thermal equilibrium (LTE). Non-LTE plasmas are common in low pressure systems. Previous estimates for Saha ionization, carried out by Niu & Houk on a commercial plasma at atmospheric pressure,31 assumes a plasma at LTE where T = Ti = Te = Tgas = 7500 K. However, Chen & Han assessed the Saha equation for a non-LTE plasma,37 and found that Te is the appropriate temperature to use as an input for the non-LTE Saha equation, as electron collisions are the dominant mechanism of ionization. Therefore, we use the framework of the Saha equation established by Niu & Houk,31 (eqn (8) and (9)) with values of Te converted to K (1 eV = 11
000 K (∼1–3 eV), plasma Tgas measurements are much lower, in the range of 340–510 K based on measurements taken with the handheld IR thermal imager. Because there is a divergence between gas and electron temperatures, the plasma is not at a local thermal equilibrium (LTE). Non-LTE plasmas are common in low pressure systems. Previous estimates for Saha ionization, carried out by Niu & Houk on a commercial plasma at atmospheric pressure,31 assumes a plasma at LTE where T = Ti = Te = Tgas = 7500 K. However, Chen & Han assessed the Saha equation for a non-LTE plasma,37 and found that Te is the appropriate temperature to use as an input for the non-LTE Saha equation, as electron collisions are the dominant mechanism of ionization. Therefore, we use the framework of the Saha equation established by Niu & Houk,31 (eqn (8) and (9)) with values of Te converted to K (1 eV = 11![[thin space (1/6-em)]](https://www.rsc.org/images/entities/char_2009.gif) 600 K) input as the plasma temperature.
600 K) input as the plasma temperature.
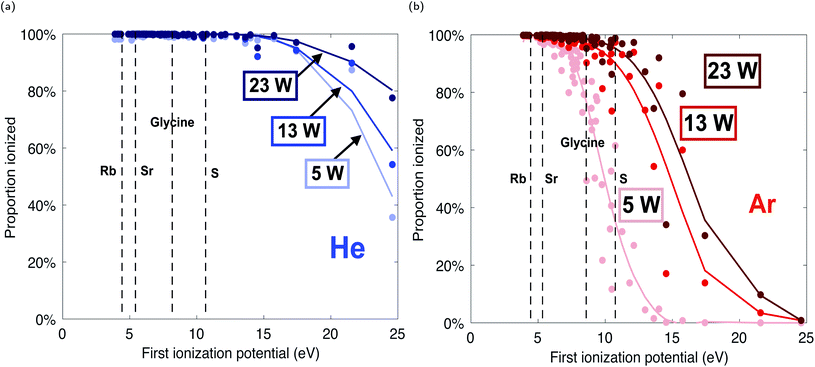
Because Ne and Te have been directly measured in the plasma via Langmuir probe, we apply this data to the Saha equation to calculate the change in analyte ionization. The curves in Fig. 6 model the degree of ionization as a function of first ionization potential for a range of plasma power inputs. These curves predict the ionization efficiency of an analyte as a function of plasma power.
The estimated ionization models for this low power plasma suggest equal, and in some cases better, ionization efficiencies compared to commercial ICPMS plasmas.31 Commercial plasmas at atmospheric pressure typically have Ne values of 1021 m−3, whereas this plasma is measured to have Ne values of 1017–1018 m−3. This three to four order of magnitude lower electron density, coupled with the higher electron temperature, leads to higher energy collisions and fewer electron–ion recombination events, thus leading to greater analyte ionization efficiency. However, the higher gas temperatures and robust gas flow rates in commercial plasmas can support greater mass loads and more efficient atomization of large particle size distributions than lower power/pressure plasma sources.
We have constructed a thermodynamic model to estimate our low power plasma's efficiency of atomizing ablated geologic materials prior to ionization. Given the measured temperature of the plasma gas and the thermal properties of silica (SiO2), the dominant component of most common rocks and minerals, we estimate the maximum mass load a 19 W plasma can support to be on the order of 2 × 10⁻⁶ kg s−1. This flux is similar to that generated by laser ablation with a 40 μm diameter sample spot and a repetition rate of 10 Hz (assuming 50 nm depth removed per shot). The atomization efficiency of the plasma depends on the introduced particle size distribution. We calculate a maximum load capacity of the plasma of 31![[thin space (1/6-em)]](https://www.rsc.org/images/entities/char_2009.gif) 000 particles of a 50 nm diameter, or 1100 particles of a 300 nm diameter (see ESI† for more details).
000 particles of a 50 nm diameter, or 1100 particles of a 300 nm diameter (see ESI† for more details).
The Saha ionization models show that both argon and helium plasma sources can be effective ionizers at low power and gas flow rates. With a gas flow rate of 200 SCCM, organic molecules and atomic species with a range of first ionization potentials, from radioactive Rb (4.2 eV) and radiogenic Sr (5.7 eV) to prebiotic amino acids (e.g. glycine, 8.9 eV) to biologically and abiologically relevant S (10.4 eV), are calculated to achieve up to 99% sample ionization in a 23 W argon plasma, or a 5 W helium plasma (Fig. 6). Therefore, this plasma could serve as an effective ion source adapted for spaceflight, capable of investigating the organic content, trace element chemistry, and isotopic signatures (including the Rb–Sr chronometer) of geological samples for in situ planetary exploration.
5 Conclusion
We have characterized the fundamental parameters of a low power plasma and assessed its performance as an ion source for a mass spectrometer. This plasma is estimated to be an effective ionizer of organic and elemental analytes, with the reduction in power and gas consumption leading to minimal loss in ionization efficiency. Helium is found to be a more efficient ionizing plasma gas than argon, requiring only 5 W of power to ionize fully organic (molecular) and elemental (atomic) species with first ionization potentials ≤10 eV, as opposed to 23 W of power for argon. In either case, both of these plasma gases can be used with applications to spaceflight mass spectrometry. Future work will examine possible designs to implement such plasmas onto a prototype spaceflight optical emission or mass spectrometer.Conflicts of interest
There are no conflicts of interest to declare.Acknowledgements
This research was funded through the NASA ROSES PICASSO Program, specifically Grant 80NSSC18K0932. The groundwork for the miniature plasma characterized here was enabled through the NASA SBIR Program, specifically Award 80NSSC18K0207. M. T. acknowledges additional funding and support provided by the Massachusetts Clean Energy Center (MassCEC) under AmplfiyMass program.Notes and references
- L. Leshin, P. Mahaffy, C. Webster, M. Cabane, P. Coll, P. Conrad, P. Archer, S. Atreya, A. Brunner and A. Buch, et al. , Science, 2013, 341, 1238937 CrossRef CAS.
- C. Freissinet, D. Glavin, P. R. Mahaffy, K. Miller, J. Eigenbrode, R. Summons, A. Brunner, A. Buch, C. Szopa and P. Archer Jr, et al. , J. Geophys. Res.: Planets, 2015, 120, 495–514 CAS.
- J. L. Eigenbrode, R. E. Summons, A. Steele, C. Freissinet, M. Millan, R. Navarro-González, B. Sutter, A. C. McAdam, H. B. Franz and D. P. Glavin, et al. , Science, 2018, 360, 1096–1101 CrossRef CAS.
- R. Arevalo Jr, L. Selliez, C. Briois, N. Carrasco, L. Thirkell, B. Cherville, F. Colin, B. Gaubicher, B. Farcy and X. Li, et al. , Rapid Commun. Mass Spectrom., 2018, 32, 1875–1886 CrossRef.
- J. Uebbing, A. Ciocan and K. Niemax, Spectrochim. Acta, Part B, 1992, 47, 601–610 CrossRef.
- A. R. Hoskinson, J. Hopwood, N. W. Bostrom, J. A. Crank and C. Harrison, J. Anal. At. Spectrom., 2011, 26, 1258–1264 RSC.
- R. B. Cody, J. A. Laramée and H. D. Durst, Anal. Chem., 2005, 77, 2297–2302 CrossRef CAS.
- D. Cleveland, P. Stchur, X. Hou, K. X. Yang, J. Zhou and R. G. Michel, Appl. Spectrosc., 2005, 59, 1427–1444 CrossRef CAS.
- L. V. Ratcliffe, F. J. Rutten, D. A. Barrett, T. Whitmore, D. Seymour, C. Greenwood, Y. Aranda-Gonzalvo, S. Robinson and M. McCoustra, Anal. Chem., 2007, 79, 6094–6101 CrossRef CAS.
- J. D. Harper, N. A. Charipar, C. C. Mulligan, X. Zhang, R. G. Cooks and Z. Ouyang, Anal. Chem., 2008, 80, 9097–9104 CrossRef CAS.
- N. Na, Y. Xia, Z. Zhu, X. Zhang and R. G. Cooks, Angew. Chem., Int. Ed., 2009, 48, 2017–2019 CrossRef CAS.
- A. Albert, J. T. Shelley and C. Engelhard, Anal. Bioanal. Chem., 2014, 406, 6111–6127 CrossRef CAS.
- M. Taghioskoui and M. Zaghloul, Analyst, 2016, 141, 2270–2277 RSC.
- S. Martinez-Jarquin and R. Winkler, TrAC, Trends Anal. Chem., 2017, 89, 133–145 CrossRef CAS.
- K. N. Leung, S. Walther and H. W. Owren, IEEE Trans. Nucl. Sci., 1985, 32, 1803–1805 Search PubMed.
- F. C. Fehsenfeld, K. M. Evenson and H. P. Broida, Rev. Sci. Instrum., 1964, 36, 294–298 CrossRef.
- A. Montaser, Inductively coupled plasma mass spectrometry, John Wiley & Sons, 1998 Search PubMed.
- I. G. Brown, Plasma Phys., 1976, 18, 205–209 CrossRef.
- K. Tokiguchi, N. Sakudo and H. Koike, J. Vac. Sci. Technol., 1984, 2, 29–34 CrossRef CAS.
- F. F. Chen and J. P. Chang, Principles of Plasma Processing, Plenum/Kluwer Publishers, 2002 Search PubMed.
- I. H. Hutchinson, Plasma Phys. Controlled Fusion, 2002, 44, 2603 CrossRef.
- R. L. Merlino, Am. J. Phys., 2007, 75, 1078–1085 CrossRef.
- C. Chung, Phys. Plasmas, 2005, 12, 1–3 Search PubMed.
- J. Camparo and G. Fathi, J. Appl. Phys., 2009, 105, 103302 CrossRef.
- M. Y. Naz, A. Ghaffar, N. U. Rehman, S. Naseer and M. Zakaullah, Prog. Electromagn. Res., 2011, 114, 113–128 CrossRef.
- B. Le Neindre, Y. Garrabos and R. Tufeu, Phys. A, 1989, 156, 512–521 CrossRef CAS.
- R. Rejoub, B. Lindsay and R. Stebbings, Phys. Rev. A: At., Mol., Opt. Phys., 2002, 65, 042713 CrossRef.
- Y.-i. Sung, H. B. Lim and R. S. Houk, J. Anal. At. Spectrom., 2002, 17, 565–569 RSC.
- G. Livadiotis, AIP Adv., 2019, 9, 105307 CrossRef.
- C. Gorse, S. De Benedictis, G. Dilecce and M. Capitelli, Spectrochim. Acta, Part B, 1990, 45, 521–525 CrossRef.
- H. Niu and R. S. Houk, Spectrochim. Acta, Part B, 1996, 51, 779–815 CrossRef.
- P. W. J. M. Boumans, Theory of Spectrochemical Excitation, Hilger & Watts, London, 1966 Search PubMed.
- P. W. J. M. Boumans, Inductively Coupled Plasma Emission Spectroscopy Part II: applications and fundamentals, John Wiley & Sons, Inc., 1987, vol. 2 Search PubMed.
- A. Horne, U. Litzén and S. Johansson, Spectrophysics: principles and applications, Springer Science & Business Media, 1999 Search PubMed.
- M. Grotti, C. Lagomarsino and J. M. Mermet, J. Anal. At. Spectrom., 2006, 21, 963–969 RSC.
- A. Kramida, Y. Ralchenko and J. Reader, NIST Atomic Spectra Database (version 5.6.1), 2018 Search PubMed.
- X. Chen and P. Han, J. Phys. D: Appl. Phys., 1999, 32, 1711 CrossRef.
Footnote |
| † Electronic supplementary information (ESI) available. See DOI: 10.1039/d0ja00198h |
| This journal is © The Royal Society of Chemistry 2020 |

