 Open Access Article
Creative Commons Attribution 3.0 Unported Licence
Quantifying nitrogen in GeSbTe:N alloys†
C.
Jeynes
 *a,
E.
Nolot
 b,
C.
Costa
 a,
C.
Sabbione
b,
W.
Pessoa
b,
F.
Pierre
b,
A.
Roule
b,
G.
Navarro
b and
M.
Mantler
c
aUniversity of Surrey Ion Beam Centre, Guildford, England. E-mail: c.jeynes@surrey.ac.uk
bUniversité Grenoble Alpes, CEA, LETI, MINATEC Campus, Grenoble, France
cInstitut für Festkörperphysik, Technische Universität Wien, Austria
First published on 24th January 2020
Abstract
We have calibrated on-site WD-XRF (wavelength-dispersive X-ray fluorescence) measurements of GeSbTe:N (GST-N) stoichiometry with off-site accurate ion beam analysis (IBA). N is determined by elastic backscattering spectrometry (EBS) using the resonance at 3.7 MeV in the 14N(α,α)14N reaction. Ge and Sb + Te are determined by Rutherford backscattering spectrometry (RBS) separately but self-consistently with the resonant EBS: the Sb/Te ratio can be determined by RBS but not with useful precision. The XRF instrumental function is determined using pure metal standards and the spectra are quantified using fundamental parameters code. We find that, as expected, for both Ge and (Sb + Te) the heavy elements are determined accurately by XRF (within the uncertainties), but for N the standardless XRF has non-linear errors around 10%. Using the absolute N content determined by IBA a calibration curve is obtained allowing N determination by WD-XRF at a precision of about 1% and an absolute accuracy (traceable through IBA) of about 4% for GST films with N content between 4–20 at%. The IBA measurement precision of the N content of the GST-N XRF calibration samples is 0.4 at% (that is, a relative precision ranging from 10% to 2% for N contents between 4–20 at%).
1. Introduction
GeSbTe (GST) is an interesting material that is already being used in non-volatile memory devices:1,2nitrogen “doping” is used to increase both device reliability3 and performance,4 enabling significant applications in the automotive sector5,6 with an enhanced stability up to 240 °C.7 We report here on metrology issues impacting the robustness of the process, including both technology transfer between multiple fabrication sites and the establishment of reliable calibration protocols.WD-XRF‡ (wavelength-dispersive X-ray fluorescence) can be used to obtain precise on-site indications of the sample stoichiometry of this quaternary material (GeSbTe:N, GST-N), including both heavy elements and the nitrogen. On-site WD-XRF is therefore a powerful method for non-destructive process control. Standard calibration methods yield good reproducibility between measurement sites for the indicated content of the heavy elements, also the absolute values obtained by XRF for the heavy elements have some independent verification; however, although the sensitivity for and the repeatability of the indicated N content is good, the reproducibility is not good enough.
XRF is complex for low-Z elements, not only because it is low probability (with low net intensities) compared to non-radiative (Auger) transitions, but also because of the complex XRF background in the soft X-ray region and the greatly enhanced (and relatively uncharacterised) higher order fluorescence effects.8 The external standards required for quantitative analysis are not easily available for N nor are they straightforward to characterise. The Fundamental Parameters (FP) method used to reduce the on-site XRF data does not yet usually have direct metrological traceability, although reference-free (off-site) measurements are now increasingly feasible,9 and significant progress is being made in establishing robust uncertainty budgets for this sort of metrology.10
Therefore, independent Ion Beam Analysis (IBA) methods have been used to certify nitrogen standards for these GST films. IBA is a toolbox of off-site complementary methods including elastic backscattering (EBS: Rutherford backscattering, RBS, is a special case of EBS), nuclear reaction analysis (NRA) and particle-induced X-ray emission (PIXE, another IBA technique entirely comparable to XRF except for the atomic excitation mechanism): IBA is commensurate with, but independent of, XRF; in particular, IBA is naturally a depth profiling technique11 whereas XRF has little or no direct depth sensitivity except in grazing incidence (GIXRF), especially with X-ray reflectometry (XRR) methods.12 We should comment that few analytical methods are capable of traceable accuracy in this sort of application where depth sensitivity is essential: the Tutorial Review cited (ref. 11) directly compares IBA with various other methods, and a recent Critical Review13 compares LIBS (laser-induced breakdown spectroscopy) with XRF. But LIBS, like LA-ICP-MS (laser ablation inductively-coupled plasma mass spectrometry, discussed in ref. 11) is not naturally a depth profiling method.
When multiple IBA techniques are used together synergistically the name used is Total-IBA,14 and the accuracy of the synergistic analysis will in principle inherit that of the most accurate technique used. In practise, such an inheritance has only recently been explicitly demonstrated in a specific case15 and properly constructed general uncertainty budgets have not yet been presented for any IBA technique other than for RBS.
RBS is an analytical method16 with full metrological traceability17 capable of very high absolute accuracy: other IBA data – EBS, NRA, PIXE – are commonly also collected, either simultaneously or sequentially with appropriate analytical conditions. RBS is always an approximation, assuming that the scattering cross-section can be idealised by considering the (analytically simple) potential scattering of point charges in a Coulomb field.
But EBS uses measured18,19 scattering cross-sections which can be calculated only by using a nuclear model that considers both the (quantum mechanical) potential scattering and also scattering due to resonances with the nuclear structure. This latter is directly comparable to the characteristic lines of atomic spectroscopy, although the nucleus is much more tightly bound than the atom and the calculations are correspondingly more difficult. With an appropriate nuclear model, sets of different cross-section (and other) measurements can be “evaluated”,20 that is, critically cross-compared and harmonised, allowing nuclear model parameters to be chosen that fit all datasets within their uncertainties. The resulting nuclear model estimates the scattering cross-section function more reliably than any one measurement, and also provides a theoretical basis for extrapolating where measured data are sparse (or missing). For example, recent work21 has evaluated EBS cross-sections for up to 10 MeV alphas scattering off nuclei from Ni to Zr, with (sparse) data shown for only half these nuclei.
Real scattering cross-sections may be different by orders of magnitude from what the RBS idealisation would lead one to expect: for the present GST-N samples we choose a resonance at 3.7 MeV that enhances 4He elastic scattering from 14N by almost an order of magnitude relative to Rutherford (where evaluated cross-sections are available: Gurbich et al. 2011![[thin space (1/6-em)]](https://www.rsc.org/images/entities/char_2009.gif) 22). The enhancement gives a sensitivity to N not available from RBS, and the evaluation gives a traceable accuracy.
22). The enhancement gives a sensitivity to N not available from RBS, and the evaluation gives a traceable accuracy.
We should note that IBA and XRF are metrologically commensurate since charged particle energy loss in material and also X-ray excitation and absorption cross-sections are both measured per atom in units of areal atomic density referred to here as “thin film units” (TFU with units of atoms/cm2) simply because thin film thicknesses are easily measured without ambiguity by determining the weight of a given film area. Linear units (nm) are natural to pathlength-sensitive methods (ellipsometry and other optical methods based on interference such as X-ray reflectometry, XRR). TFU and linear units of thickness are metrologically incommensurate, but are of course correlated through the material density (which is prima facie strictly unknown since thin film densities may differ significantly from bulk material densities).
Fig. 1 shows historic IBA results on a set of GST samples. The large dispersion of these results precludes a simple transfer of any GST-N process and the related compositional metrology from one industrial site to another, and prevents any guarantee that both processes are identical. Our aim therefore is to use off-site accurate IBA to certify reference materials for this GST-N system, resulting in a calibration curve enabling the accurate on-site XRF analysis of the N content of these materials.
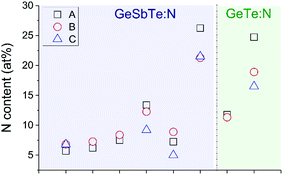 | ||
| Fig. 1 IBA of N content of 6 GST-N and 2 GT-N samples. Three IBA laboratories (A, B and C) determine N content. All samples are 100 nm thick duplicates on silicon. | ||
2. The metrological problem
GeSbTe (GST) and GeSbTe:N (GST-N) wafers may be transferred between R&D and industrial partners. As a consequence, accurate metrology is needed not only to support process development, but also to facilitate information sharing between partners.The problem is, how much N is there in particular samples? Of course, no pure material standards are available to determine instrumental sensitivity factors for N, so it is necessary to devise an ad hoc calibration curve to obtain nominal values. This allows repeatability for each site, but reproducibility between sites is not obtained because different sites use different calibration strategies which can be harmonised only with accurate reference materials for the N content of GST-N samples. However, it is precisely the lack of accurate reference materials that precludes well-found scientific and technological conclusions about the process itself: this is a fundamental block on understanding.
XRF cannot absolutely quantify the N content of GST-N samples since it is not possible to transfer instrumental functions obtained from well-characterised N-containing samples (silicon nitride for example) to these GST samples. There are at least three main aspects of this difficulty.
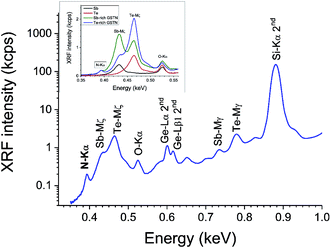
Firstly, Fig. 2 shows the instrumental problem for extracting the N signal out of a WD-XRF spectrum from a GST sample: it has a strongly nonlinear background due both to the instrument setup and the analyzer crystal, and also to the overlap of the Sb and Te Mζ lines. Not only are FP data absent for these lines, they will generate secondary excitation of N-Kα with poorly defined cross sections.
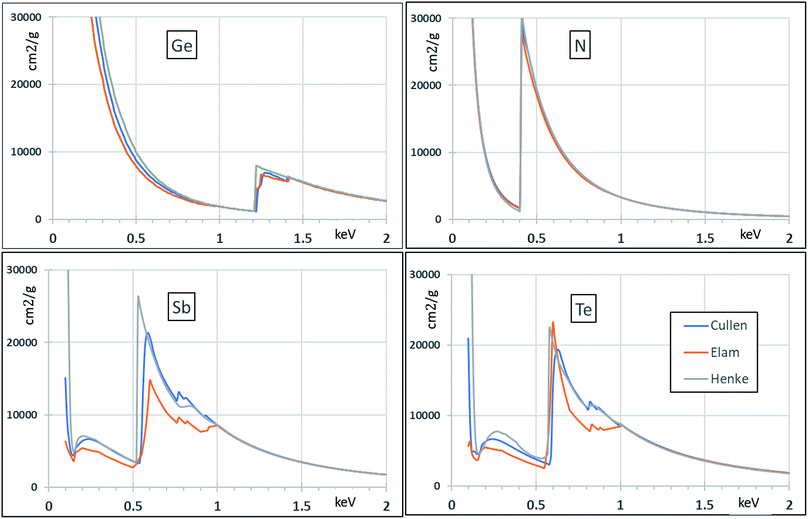
Secondly, Fig. 3 gives historical attenuation data for the elements for which we expect the FP (Fundamental Parameter) calculation to be valid (Te, Sb, Ge). The existing data for N are included for completeness. For higher energies (>1 keV) there is detailed agreement, but this is clearly not the case for lower energies. Some of the datasets are known to be less reliable so that most of the variation shown in the figure represents historical improvements in accuracy and not present uncertainty about best values. Even so, FP calculations at low energies will clearly build in a significant systematic uncertainty.
Fig. 3 shows data from a number of databases including Henke23 (who was a real pioneer in the field of low energy X-rays although the newer datasets supercede his), Cullen,24 and Elam25 (practically the same as xraylib26 in this case). Ebel27,28 and McMaster29 do not give relevant data below 1 keV.
Thirdly, and perhaps most importantly, there are significant systematic uncertainties in the calculation of secondary, tertiary and higher fluorescence yields. Even if secondary fluorescence can be critical for “relatively thin” layers in certain conditions, the probability of tertiary fluorescence for 100 nm thick layers should be close to strictly zero. However, the issues remaining are: the secondary fluorescence due to unknown (Mζ) lines; and the contribution from the (unknown) high energy photo-electrons (and Auger-electrons). These issues have been recognised for a long time30 and have so far proved intractable (see for example Taborda et al., 2016 31).
The FP calculation to quantify the N signal is equivocal in principle since the soft X-rays are fluoresced by primary, secondary, and various sorts of higher excitations.32 The FP codes are reasonably reliable for both the fluorescence from the primary beam, and also the secondary self-fluorescence (generated from the primary K & L target fluorescence). However, the FP codes ignore not only tertiary and other fluorescence channels; but also fluorescence by both primary and secondary (photo- and Auger-) electrons, which are both numerous and of relatively high energy.33
These various possible interactions may individually be low probability, but there are a large number of possibilities and their total probability is significant. Therefore, inferring the N content accurately through an XRF analysis cannot at present rely on FP interpolations from a sample-independent calibration but must instead rest on comparison with sample-matched standards.
The information depth (origin of 50% photons) of the soft X-rays (N K line) in GST material is estimated at ∼100–150 nm, where that of the harder X-rays (∼5 keV) is estimated as several microns. Thus the self-absorption correction is much more important for the soft X-rays. However, for the tender X-rays from the Sb and Te L lines, and even for the quite soft Ge L X-rays, we will show that the sample-independent calibration yields high accuracy results. In particular, as Unterumsberger et al. [ref. 10] have also found, we find here that the FP approach rests on old data whose uncertainty has mostly not (yet) been directly verified at modern standards but yet is remarkably accurate.
Sample-independent FP calibration is aimed at largely correcting any database errors affecting the production yield calculation (ionization and primary fluorescence yield probabilities, together with the tube spectrum correction). It is inaccuracy in the attenuation database (together with secondary issues like inhomogeneity or topography effects) that will most strongly influence remaining inconsistencies highlighted by sample-matched reference measurements.
However, it is clear from Fig. 3 that sample-independent FP calibration has difficulty below 1 keV, even for the heavy elements Ge, Sb, Te. The difference for Sb and Te between the Cullen and the Elam databases is surprising (in this case the Elam and xraylib databases are identical). And for light elements, not only are the databases even more uncertain, but FP methods themselves are not yet sufficiently developed for the accurate analysis of GST-N materials. In this case it is clear that present analysis must be relative to Reference Materials (RMs). The purpose of the present work is developing a new protocol, based on reference standards certified by IBA, applicable in particular to the analysis of GST-N.
The analyst houses (A, B and C: see Fig. 1) are calibration laboratories who certify RMs for use by industry and Research & Technology organizations needing to calibrate characterization tools such as WD-XRF. They all use various IBA techniques (RBS, EBS, NRA, PIXE), but metrological traceability has only been demonstrated in a specific case for RBS.34 One would think that NRA methods would work well for N content, but it turns out that they perform significantly worse than expected. In a comparable case where O was measured in a formal multi-laboratory intercomparison (Seah et al. 2002 (ref. 35)) the NRA measurements had a 9% systematic error for unknown reasons. PIXE is not used to measure N.
Here we directly address this disappointing performance of IBA methods: their supposed high absolute accuracy is belied by Fig. 1. Metrological traceability has proved intricate to establish even for RBS [ref. 16] for which Colaux & Jeynes [ref. 34] point out how easily large systematic errors (>3% in a nominally 1% analysis) can creep in. Jeynes et al. [ref. 15] have shown in a very detailed discussion that even evaluated EBS scattering cross-sections can have uncertainties 10% and more.
In this work we establish a calibration for the XRF determination of the N content of GST-N samples using reference standards certified by IBA. The EBS analysis is calibrated by RBS using a transfer standard which is a self-supporting silicon nitride window nominally 200 nm thick. The uncertainty budget is constructed for these reference standards.
3. Experimental
GST (including GST225, that is the Ge2Sb2Te5 which is the reference material for many studies) and GST-N films (including GST225-N, that is, nitrogen-doped GST225) are deposited in Grenoble on 300 mm or 200 mm silicon (001) wafers using magnetron sputtering (Applied Materials Endura300 and Evatec CLN200 multi-target PVD chambers).- A calibration sample set was deposited on 200 mm wafers on the Evatec tool. These were 100 nm thick GeTeN and Ge-rich GST and GST225-N films with various N contents. The films were capped in situ with a 5 nm Ta layer to prevent ageing. An exact duplicate of this sample set was grown in the same run in order to routinely calibrate and monitor WD-XRF GST-N samples.
- An evaluation set was deposited on 300 mm wafers using the Applied Materials tool. These were 100 nm uncapped GST225-N films with significant variation in the N content. The WD-XRF analysis of this film was performed just after deposition, and the IBA analysis about 1 month after.
GST and GST-N films are systematically measured after deposition for thickness, electronic density, and roughness using XRR (X-ray reflection, with the Bruker D8 Fabline XRR tool operating a filtered Cu-Kα anode); and using XRF (for deposited mass and composition) with the Rigaku AZX400 wavelength-dispersive instrument (Rh anode with 4 kW maximum power on the anode).
Most of the soft X-rays measured (N-K, Ge-L) are excited by the Rh-Lα lines (2.7 keV), with the tender X-rays (Te-L, Sb-L) by the Rh-K lines (20 keV). The XRF instrumental function is determined in this case using pure metal standards (Ge, Sb, Te, Ta) and the Rigaku FP code. A silicon wafer was added as a standard for the management of the Ge-L background. In most cases sufficient counts are collected to reduce the expanded precision (that is, the uncertainty due largely to counting statistics) to ∼1% (coverage factor k = 3).
The quantitative analysis is based on acquisition of the XRF intensity at a single angle for each element of interest, with possible addition of background points. In our case, for Ge, Sb and Te, the net intensities were obtained by subtraction of the substrate signal (Si), giving more robust results especially for the non linear background of Ge-L.
A thin (5 nm) Tantalum layer is deposited on 100 nm GST-N films to limit ageing and oxidation effects with duplicates distributed to all collaborators. Capped samples have been demonstrated stable for years. XRF calibrations are based on these Ta-capped reference films, but inline monitoring is done on fresh GST-N materials, either uncapped or capped in situ with SiN or C (not Ta).
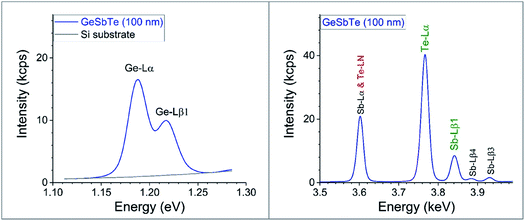
Fig. 4 shows survey XRF spectra. Ge is measured using the Lα instead of the Kα line (see Fig. 4): Ge-Kα does not give reliable results for thin layers since the XRF intensity is affected by the contributions of both the Rh satellite peak and also diffraction (with a slight remaining contribution even when filtering the primary beam). Te is also measured from the Lα line, although the angular range must be sufficient to determine the non-zero background. However, the Sb-Lα line is excluded due to its overlap with the Te-LN line, so Sb is measured using the Lβ1 line. Filtering the XRF signal to exclude the substrate signal does not improve the signal:noise ratio.
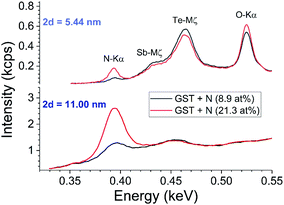
Fig. 5 shows survey spectra using two different synthetic crystals. The crystal with the lower 2d value gives sensitivity to Sb-M and Te-M (and O-K) lines, at the price of less photon counts and less sensitivity to small process changes. The crystal with higher 2d is more suitable for inline automated operation where the background is managed analytically using a very limited number of points.
The measurement of N is complicated by the overlap with the M line tail of Sb and Te. Fig. 2 shows that for a low resolution WDX survey spectrum this background is non-linear, but it appears that a linear approximation is sufficient in high resolution WDX (see Fig. 5).
The IBA data were measured using a calibration for 1.5 MeV He-RBS certified under the previous Surrey accreditation to ISO 17025 (see ref. 17 and details in ESI†). 3.7 MeV He-EBS was used to obtain the N content of the GST-N samples through the 14N(α,α)14N reaction which is resonant at about 3.7 MeV. Fig. 6 shows the evaluated scattering cross-sections for this reaction at two different scattering angles (see Gurbich et al. 2011 [ref. 22] for more detail). 1.5 MeV RBS contributed little information since it was entirely insensitive to the N and the ratios of the heavy elements (Ge/{Sb + Te}) is readily obtained at the higher beam energy. IBA data were reduced using the code DataFurnace (NDF v.9).37
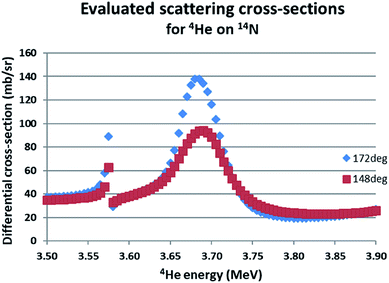 | ||
| Fig. 6 Evaluated differential cross-sections for 14N(α,α0)14N. The evaluated functions for two different scattering angles are given using SigmaCalc v.2.0.36 For 172° the cross-section at the 3.7 MeV resonance is 8.6 × Rutherford. | ||
4. Results: scattering cross-section for He on N at 3.7 MeV
Table 1 shows results from a set of 1.5 MeV He-RBS measurements on a free-standing 200 nm SiNx window, to determine the absolute thickness of this material together with x, the N/Si ratio. We find x = 1.07(3) where the combined standard uncertainty (given as a last-figure error) includes an extra (average) 2% attributable to the apparent systematic detector bias in the Si signal visible in the first column. The SiNx film thickness is 1671(50) TFU, or 57.7 μg/cm2 (168 nm assuming the bulk Si3N4 density of 3.44 g/cm3). Again, we infer a standard uncertainty of 3%.| Sample | Det1/Det2 | Si | N | N/Si | |
|---|---|---|---|---|---|
| Si | N | TFU | TFU | ||
| a Note: “TFU” ≡ “thin film units” ≡ 1015 atoms/cm2. The Det1/Det2 ratios for the Si and N film thickness (in TFU) should be unity. The standard deviations are for the 3 repeated measurements. These are consistent with the counting statistics uncertainties per measurement per detector, which are about 1% for the Si signal and 2% for the N signal. There may be an extra 2% systematic uncertainty (see the deviation from unity of the Det1/Det2 ratio for the Si signal). | |||||
| SiN1 | 0.965 | 0.984 | 800.6 | 868.2 | 1.08 |
| SiN2 | 0.954 | 0.982 | 808.0 | 860.7 | 1.07 |
| SiN3 | 0.942 | 1.018 | 812.8 | 861.3 | 1.06 |
| Average | 0.954 | 0.995 | 807.2 | 863.4 | 1.070 |
| Standard deviation | 0.011 | 0.020 | 6.1 | 4.1 | 0.013 |
| Standard deviation (%) | 1.2% | 2.0% | 0.8% | 0.5% | 1.2% |
Table 2 is to directly validate the evaluated EBS cross-sections for N through a calibration sample (the SiNx window) characterised with RBS. The beam energy is varied through the EBS resonance (see Fig. 6) to calibrate the accelerator energy using the evaluated cross-section function maximum energy. It shows the comparison of the 3.7 MeV He-EBS data for the SiNx window with their simulation measured using the window thickness and composition determined by RBS (Table 1) together with the experimental scattering angles and the evaluated scattering cross-sections (ref. 22). Counting statistics uncertainties are also given in the table.
| Spectrum# | TV, kV | Energy, keV | Real/simulated counts | Real/sim uncertainties![[thin space (1/6-em)]](https://www.rsc.org/images/entities/char_2009.gif) |
||||||
|---|---|---|---|---|---|---|---|---|---|---|
| Det1 | Det2 | Det1 | Det2 | |||||||
| Si | N | Si | N | Si | N | Si | N | |||
| a Ratio of real/simulated counts for SiNx sample, with uncertainties from counting statistics. Two detectors (##1, 2) are used at scattering angles respectively 172° and 148°. The maximum N EBS cross-sections at the 3.7 MeV resonance are respectively 8.6 and 5 times Rutherford for these angles, hence the larger N uncertainty for Det2. | ||||||||||
| 1 | 1840 | 3722.0 | 1.012 | 1.061 | 0.976 | 1.141 | 5.3% | 4.0% | 6.7% | 6.9% |
| 2 | 1835 | 3711.9 | 0.931 | 1.088 | 1.111 | 1.109 | 8.7% | 6.5% | 10.3% | 11.2% |
| 3 | 1830 | 3701.9 | 1.035 | 1.094 | 1.043 | 1.148 | 8.9% | 7.2% | 10.7% | 11.9% |
| 4 | 1845 | 3732.0 | 1.085 | 1.103 | 0.983 | 1.146 | 9.5% | 7.4% | 11.5% | 12.0% |
| 5 | 1850 | 3742.1 | 0.999 | 1.176 | 0.979 | 1.214 | 8.1% | 6.6% | 10.2% | 11.0% |
| 6 | 1840 | 3722.0 | 1.005 | 1.131 | 0.905 | 1.263 | 8.2% | 6.1% | 9.9% | 9.8% |
| 7 | 1838 | 3717.9 | 1.276 | 1.061 | 1.072 | 1.189 | 9.6% | 7.0% | 11.1% | 10.9% |
| Weighted average | 1.042 | 1.099 | 1.006 | 1.173 | ||||||
| Weighted standard deviation | 0.095 | 0.038 | 0.063 | 0.049 | ||||||
Fig. 7 shows the measurement of the SiNx window thickness at 3.7 MeV. This indicates that the various measurements all give the same thickness, within the uncertainties, even though the scattering cross-section for N varies quite strongly near the resonance; this demonstrates that the beam energy is correctly calibrated against the resonance energy.
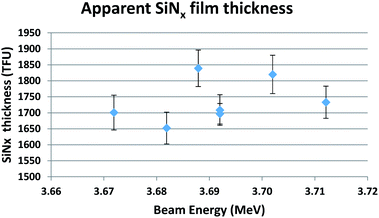 | ||
| Fig. 7 Apparent SiNx film thickness at 3.7 MeV, assuming x = 1.07. Standard uncertainties are shown. | ||
Note that the mean thickness of the 7 measurements in Fig. 7 is 1736 ± 63 TFU, where we specify the upper limit of the expanded uncertainty on the mean with coverage factor k = 2 (SE95, see eqn (4) of Colaux & Jeynes, 2015 [ref. 34]). This is consistent with the RBS measurement of film thickness of 1671(50) TFU considering a standard uncertainty of 3%. We conclude that there is no compelling evidence for modifying the evaluated scattering cross-sections for the 14N(α,α)14N reaction near the 3.7 MeV resonance. We estimate an absolute uncertainty of about 4% on the N areal density obtained by EBS at this resonance.
5. Results: GST-N composition measurements by XRF and IBA
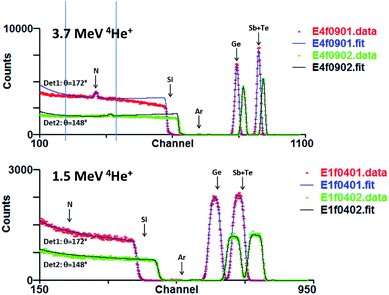
Fig. 8 shows IBA data for a N-rich GST-N sample using 1.5 & 3.7 MeV 4He beams. In fact the low energy data is not informative since crucially there is no sensitivity to N. In these spectra all the signals are Rutherford except the 3.7 MeV data for N. Even the Si cross-section is 99% Rutherford at 3.7 MeV38 but in this analysis this substrate signal is anyway only a background signal fitted ad hoc.39 The Coulomb barrier to nuclear reactions increases with Z so that scattering from the higher Z elements is certainly indistinguishable from Rutherford at this beam energy.40 Evaluation of the scattering cross-section for Ge shows that it will become distinguishable from Rutherford only for alpha energies above 7 MeV [ref. 21].For 3.7 MeV RBS there is some mass discrimination between Sb and Te, but for films of this thickness the uncertainty of the Sb/Te ratio is >30%. We therefore do not attempt to derive this ratio from the IBA data since it is determined by the WD-XRF data with great precision (and also, as we will show, great accuracy).
6. Results: process implications
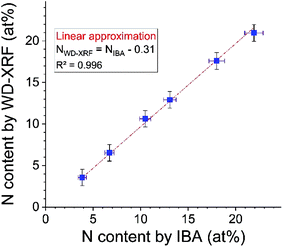
Fig. 9 shows the result of first calibrating the WD-XRF for N using the three RMs (Ta-capped GST-N) certified by IBA, and then using the calibrated WD-XRF to measure the six uncapped GST-N samples. XRF is plotted against the (independent) IBA results. A perfect result would have a zero offset and unity slope, and the unconstrained result shows that both are consistent with the data within the uncertainties. However, if the slope is constrained to be unity, the offset is 0.2 at% (recall that the IBA precision is 0.4 at%). This offset is completely explained by incomplete background suppression for both XRF and IBA.Fig. 10 shows the result of the loading with N of GST very close to the standard composition (Ge2Sb2Te5). The GST stoichiometry is not disturbed by the presence of N. This sort of conclusion is important to understanding the process, and cannot be obtained without a correct calibration of the XRF.
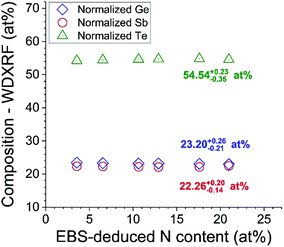 | ||
| Fig. 10 Ge2Sb2Te5 matrix unmodified by N content. “Normalised” {Ge, Sb, Te} is ratio X/(Ge + Sb + Te), that is, ignoring N content. | ||
7. Discussion
Analysis overview
The questions this analysis addresses can be listed, together with their answers:1. Can the sample-independent XRF calibration be validated for Ge, Sb, Te? Yes they can. We show explicitly that the backscattering signals from these elements are Rutherford for 3.7 MeV alphas, and that therefore the Ge and Sb + Te contents of the films can be determined absolutely by RBS using standard methods. FP methods give the same numbers (within uncertainties) from the XRF data.
2. Could sample-independent XRF calibration be validated for N? No it could not. The IBA shows that a non-linear calibration curve is required to interpret XRF data for N, and consideration of the physics shows that the FP calculation is seriously incomplete for these soft X-rays.
3. Can the Sb/Te ratio determined by XRF be validated by RBS? No it cannot. Although RBS has some sensitivity to this ratio, the XRF has high sensitivity (and accuracy, see #1) for both Sb and Te separately. Compared to the XRF the RBS has no useful extra information.
4. Can EBS cross-sections for N be validated by RBS? Yes they can. The issue here is that there is as yet no agreement on how to express uncertainty in analyses using resonant EBS. Therefore we use a procedure of directly validating by RBS the EBS results obtained for the transfer standard (the 200 nm SiNx self-supporting film).
5. Can we demonstrate that the resonant EBS energy for N (3.7 MeV) is used even though it is not known precisely what this is? Yes we can. Fig. 7 shows that the silicon nitride transfer standard can be measured at multiple energies which would result in varying nominal film thickness were the beam energy not calibrated on the resonance maximum. The evaluation of the EBS cross-section for N at this energy harmonises multiple inconsistent cross-section measurements together with other nuclear (gamma) spectroscopy data to determine the resonance energy.
6. Can we demonstrate that the uncertainty of the N cross-section used at the 3.7 MeV resonance maximum is known? Yes we can. This is despite the fact that the absolute value of the evaluated cross-section has a priori an unknown uncertainty. The reason is that the analysis of the transfer standard sample (§5 above) directly compares data from a known sample with data simulated using the evaluated cross-section, given that we know that the data are collected at the resonance energy (whatever that is, see Q5 above). The same transfer standard film thickness is estimated both for RBS at 1.5 MeV and EBS at 3.7 MeV, indicating that the (evaluated) resonant cross-sections used at the higher energy are correct within the uncertainties, which are estimated at about 4%.
7. What advantage does PIXE have over WD-XRF for GST material? None. The K-shell PIXE cross-sections are relatively low compared to L-shell XRF cross-sections, and L-shell PIXE-EDX cannot discriminate Sb from Te.
8. What advantage does NRA have over EBS for accurate analysis of N? There is probably a bias for EBS similar to the limit of detection coming from the background on the N signal. In which case the NRA has an advantage in that its accuracy (dominated by the statistical precision) is unbiassed. The reaction cross-section for the 14N(d,α1)12C reaction at a deuteron energy of 1.2 MeV is around 2 mb sr−1 (ref. 36) whereas that for the 14N(α,α)14N reaction at an alpha energy of 3.7 MeV is up to 140 mb sr−1. Of course, there is no background for the NRA, but even so the time needed for reasonable statistics is longer for NRA because of the low cross-section. For absolute accuracy both the EBS and the NRA depend on a certified standard: in both cases this can be provided by RBS. But the EBS reaction does have a published nuclear model where although there is a nuclear model for the NRA (see ref. 40) it is not explicitly published. The EBS has been benchmarked by this work: the NRA has not been benchmarked.
9. How accurate is the composition measurement by XRF? This is given by the calibration accuracy, given in turn by the certification accuracy of the CRMs. Which is 4% for the CRMs for N. For the heavy elements (Ge, Sb, Te) the accuracy is higher.
10. How accurate is the thickness measurement by XRF? This is given in principle by the N CRMs which have a N-content and thickness (in TFUs) determined by EBS. The GST (heavy element) composition is given accurately by XRF. As used here XRF always gives thickness in TFU.
EBS uncertainty
We here make use of a strong resonance at 3.7 MeV in the 14N(α,α)14N reaction. This has been measured multiple times, but such measurements are difficult and hard to interpret. It is therefore certainly necessary to evaluate measured differential cross-section data: in this case the cross-section at 3.7 MeV is a very strong function of both energy and scattering angle (see Fig. 5 and 4 of Gurbich et al., 2011, ref. 22). Evaluation in this case means treating all the collected data equivalently within a common theoretical nuclear model which correctly takes into account both a proper quantum mechanical treatment of the potential scattering, and also the effect of the specific nuclear structure of the nucleons involved in the scattering event. This latter can usually be calculated taking into account the energy levels of the compound nucleus (in this case 18F which is unstable with a half life of 110 minutes) using the “R-matrix” method (ref. 40). A wide range of experimental data must be used to determine the parameters of the nuclear model of the scattering event under consideration. These include results of gamma spectroscopy and differential scattering cross-sections as a function of scattering angle, apart from the directly relevant differential scattering cross-sections as a function of energy.Without the nuclear model it is impossible to compare data collected at different scattering angles, and also it is not possible to see whether there are sufficient data points in a given energy window (since sharp resonances cannot be excluded, see examples in Gurbich 2010 [ref. 20]). But with the nuclear model the whole dataset can be critically compared, enabling poor datasets to be unequivocally identified, and systematic errors in other datasets to be recognised and corrected. Thus, evaluated cross-sections are far more reliable than any isolated dataset could ever be.
However, the question of EBS uncertainty is an outstanding problem in principle. It was addressed directly by Mayer41 with regard to the 12C(α,α)12C reaction: he considered first the observed experimental variation where the data were normalised for scattering angle using the appropriate nuclear model (SigmaCalc [ref. 20]); and then used the result to consider directly the uncertainty of the nuclear model itself. One important observation in this work (repeating similar observations from the IEAE CRP, ref. 19) is that measurement of resonance energies is not notably accurate. This means that unless special precautions are taken (see the discussion in Colaux et al., 2015 (ref. 42)) the energy of any resonance used for analysis should be taken as a calibration point (as it is here).
Mayer's conclusion, after a complicated argument, can be grossly simplified to the statement that (in this case) the nuclear model (SigmaCalc) is probably mostly correct at about 4%. Gai & Gurbich43 subsequently made serious criticisms of Mayer's approach, and instead attack the same problem with an entirely different methodology where the covariance behaviour of the nuclear model itself is explored. This is an intricate problem since although the nuclear model is understood theoretically very well, putting it into a form suitable for routine calculation introduces many approximations, including assuming the absence of interferences between resonances. The procedure of Gai & Gurbich looks sound in detail, and they claim that the calculation of uncertainty is “straightforward” in principle. The trouble is that (a) the results are not entirely persuasive, (b) the uncertainty of the nuclear model calculation is in principle different at every point of the function, (c) in any case a correct calculation of the uncertainty is highly intricate (and is sensitive to the details of the experimental data being fitted), and moreover (d) even with a good estimate of the uncertainty function it is not clear how to use this function to correctly obtain the uncertainty of an estimate of the parameter of interest in any particular case.
One conclusion of interest to us, suggested by Gai & Gurbich's systematic approach, is that the value of the maximum cross-section at resonances may be very uncertain. It is not clear to us whether (and how much) for Gai & Gurbich this might be an artefact of the mathematical model or whether it is simply the effect of the variation of the experimental datasets in the case considered. In any case the community seems agreed that the way forward is pragmatic, through “benchmarking”. This is explicit in the IAEA TECDOC (ref. 19), and in both Mayer's (ref. 41) and Gurbich's (ref. 36) with Paneta et al. (ref. 45) showing a formal protocol for benchmarking. We should comment here that “benchmarking” is implicitly used in the present work (indirectly in the treatment of the SiNx transfer standard), but has never previously been used to formally determine a contribution to an uncertainty budget.
The GUM44 draws a distinction between Type A and Type B uncertainties: Type A are the uncertainties that can be explicitly quantified by a quantitative statistical treatment, Type B are everything else. So both Mayer and Gai & Gurbich were attempting to determine Type A uncertainties for the evaluated cross-section function; a formal benchmarking measurement would do the same for the relevant part of the function. In our case Type A uncertainties are unavailable, and certainly cannot be obtained by a simple inspection of the comparison beween the experimental data and the nuclear model. We have suggested an estimate of 4% for the uncertainty of the evaluated cross-section for this resonance. We have provided a Type A argument, but recognise that this is probably still incomplete: the tacit components mean that we have instead a Type B uncertainty.
Calibration curve for XRF N signal
The question of whether a calibration curve for the XRF determination of N content can be constructed using the samples certified by EBS as sample-matched standards for XRF is a more difficult one. In principle a sample-matched standard should be matched to the sample to be measured. But how different can it be without making the comparison invalid? This is the same question as asking how many samples are needed (and what must they be?) to construct the calibration curve.For XRF data interpreted correctly by an FP code, the interaction between the line intensities as the thickness and composition changes is calculated (correctly) by the code. This is despite the fact that the sample-independent calibration uses pure materials and so the excitation process and self-absorption in compound materials relies heavily on the numerical correctness of the related fundamental parameters. But here the FP code may not work accurately because of complex secondary and tertiary fluorescence due to the additional excitation of N by photo- and Auger-electrons, where reliable fundamental parameters are rare. The alternative is to determine the mutual influence of sample elements on their emitted fluorescent radiation empirically by using reference materials. In this case the calibration curve is essentially three-dimensional, with N content on one axis(certified by EBS), the Ge/(Sb + Te) ratio on another, and the resultant correction (from the comparison of EBS with indicated N content from XRF) on the third. Sb and Te probably do not have to be treated separately since their K, L and M lines (and Auger electrons) are sufficiently close together in energy to fluoresce the N very similarly.
Summary
We can summarise:-1. In fab monitoring of N content in GST-N by WD-XRF requires external calibration with certified reference materials of matched thickness. Reference materials (RM) are available, they are Ta-capped GST-N samples: verified duplicates are produced, characterised and stored at LETI. It is also verified that these RM do not age over years.
2. Suppliers of characterisation services did not adequately assess either their uncertainties or their protocols. This led to an unacceptable dispersion of results.
3. A protocol for the adequate characterisation of these RMs by IBA was established in this work.
4. These certified RM (CRM) are used to calibrate WD-XRF.
5. The internal consistency of the certification of the CRMs is demonstrated by comparing the calibrated WD-XRF with IBA on a wide range of test GST-N samples, from 3 to 21 at% N.
6. Different RMs are required for different GST-N film thicknesses, since the XRF indication for the N-doping is a strong function of the film thickness, uncorrectable by FP procedures.
Conclusions
This is the first time that resonant EBS has been used critically for metrology. We have validated the evaluated scattering cross-section for alphas on 14N at the 3.7 MeV resonance directly, demonstrating a limit of detection for N in GST under these conditions of about 1 at% (from a measurement precision for N of 0.4 at%).The scattering cross-section function for the EBS reaction 14N(α,α0)14N has been evaluated by Gurbich et al. (2011) [ref. 22] who do not estimate uncertainties. Also, no benchmark measurements are reported so far for this function. Therefore the 4% accuracy of this evaluated cross-section function at the 3.7 MeV resonance, estimated from the present measurements, is a noteworthy conclusion that advances the field. IBA measurements of N in GST-N samples previously had demonstrable errors ∼50% for quantification of N in GST-N by EBS (see Fig. 1).
We have shown explicitly by comparison with RBS that a sample-independent XRF calibration is accurate for determining both composition and thickness of GST films.
Conflicts of interest
There are no conflicts of interest to declare.Supplementary materials
IBA data (details in ReadMe.pdf) includes data from a run in October 2016 (excluding proprietary data) in particular the calibration certified under an ISO 17025:2005 accreditation; and includes data from a run in September 2017 which had an equivalent (uncertified) calibration. See DOI: 10.1039/c9ja00382gAcknowledgements
The UK Engineering and Physical Sciences Research Council is acknowledged for support under EPSRC contract NS/A000059/1.References
- R. E. Simpson, P. Fons, A. V. Kolobov, T. Fukaya, M. Krbal, T. Yagi and J. Tominaga, Interfacial phase-change memory, Nat. Nanotechnol., 2011, 6, 501–505, DOI:10.1038/nnano.2011.96.
- B. Chen, G. H. ten Brink, P. George and B. J. Kooi, Size-dependent and tunable crystallization of GeSbTe phasechange nanoparticles, Sci. Rep., 2016, 6, 39546, DOI:10.1038/srep39546.
- G. Navarro, M. Coué, A. Kiouseloglou, P. Noé, F. Fillot, V. Delaye, A. Persico, A. Roule, M. Bernard, C. Sabbione, D. Blachier, V. Sousa, L. Perniola, S. Maitrejean, A. Cabrini, G. Torelli, P. Zuliani, R. Annunziata, E. Palumbo, M. Borghi, G. Reimbold and B. De Salvo, Trade-off Between SET and Data Retention Performance, IEEE Int. Electron Devices Meet., 2013, 571–573, DOI:10.1109/IEDM.2013.6724678.
- A. Kiouseloglou, G. Navarro, V. Sousa, A. Persico, A. Roule, A. Cabrini, T. Guido, S. Maitrejean, G. Reimbold, B. De Salvo, F. Clermidy and L. Perniola, A Novel Programming Technique to Boost Low-Resistance State Performance in Ge-Rich GST Phase Change Memory, IEEE Trans. Electron Devices, 2014, 61, 1246–1254, DOI:10.1109/TED.2014.2310497.
- A. Fantini, V. Sousa, L. Perniola, E. Gourvest, J. C. Bastien, S. Maitrejean, S. Braga, N. Pashkov, A. Bastard, B. Hyot, A. Roule, A. Persico, H. Feldis, C. Jahan, J. F. Nodin, D. Blachier, A. Toffoli, G. Reimbold, F. Fillot, F. Pierre, R. Annunziata, D. Benshael, P. Mazoyer, C. Vallée, T. Billon, J. Hazart, B. De Salvo and F. Boulanger, N-doped GeTe as Performance Booster for Embedded Phase-Change Memories, IEEE Int. Electron Devices Meet., 2010 DOI:10.1109/IEDM.2010.5703441.
- H. Y. Cheng, J. Y. Wu, R. Cheek, S. Raoux, M. BrightSky, D. Garbin, S. Kim, T. H. Hsu, Y. Zhu, E. K. Lai, E. Joseph, A. Schrott, S. C. Lai, A. Ray, H. L. Lung and C. Lam, A Thermally Robust Phase Change Memory by Engineering the Ge/N Concentration in (Ge, N)xSbyTez Phase Change Material, IEEE Int. Electron Devices Meet., 2012 DOI:10.1109/IEDM.2012.6479141.
- G. Navarro, V. Sousa, P. Noé, N. Castellani, M. Coué, J. Kluge, A. Kiouseloglou, C. Sabbione, A. Persico, A. Roule, O. Cueto, S. Blonkowski, F. Fillot, N. Bernier, R. Annunziata, M. Borghi, E. Palumbo, P. Zuliani and L. Perniola, N-doping Impact in Optimized Ge-rich Materials Based Phase-Change Memory, IEEE 8th International Memory Workshop, 2016, DOI:10.1109/IMW.2016.7495284.
- R. Unterumsberger, B. Pollakowski, M. Müller and B. Beckhoff, Complementary Characterization of Buried Nanolayers by Quantitative X-ray Fluorescence Spectrometry under Conventional and Grazing Incidence Conditions, Anal. Chem., 2011, 83, 8623–8628 CrossRef CAS PubMed.
- B. Beckhoff, Reference-free X-ray spectrometry based on metrology using synchrotron radiation, J. Anal. At. Spectrom., 2008, 23, 845–853 RSC.
- R. Unterumsberger, P. Hönicke, J. L. Colaux, C. Jeynes, M. Wansleben, M. Müller and B. Beckhoff, Accurate experimental determination of Gallium K- and L3-shell XRF fundamental parameters, J. Anal. At. Spectrom., 2018, 33, 1003–1013 RSC.
- C. Jeynes and J. L. Colaux, Thin film depth profiling by Ion Beam Analysis, Analyst, 2016, 141, 5944–5985, 10.1039/c6an01167e.
- D. Ingerle, M. Schiebl, C. Streli and P. Wobrauschek, Combination of grazing incidence x-ray fluorescence with x-ray reflectivity in one table-top spectrometer for improved characterization of thin layer and implants on/in silicon wafers, Rev. Sci. Instrum., 2014, 85, 083110, DOI:10.1063/1.4893383.
- G. G. Arantes de Carvalho, M. B. Bueno Guerra, A. Adame, C. S. Nomura, P. V. Oliveira, H. W. Pereira de Carvalho, D. Santos Jr, L. C. Nunes and F. J. Krug, Recent advances in LIBS and XRF for the analysis of plants, J. Anal. At. Spectrom., 2018, 33, 919–944 RSC.
- C. Jeynes, M. J. Bailey, N. J. Bright, M. E. Christopher, G. W. Grime, B. N. Jones, V. V. Palitsin and R. P. Webb, Total-IBA – where are we?, Nucl. Instrum. Methods Phys. Res., Sect. B, 2012, 271, 107–118, DOI:10.1016/j.nimb.2011.09.020.
- C. Jeynes, V. V. Palitsin, M. Kokkoris, A. Hamilton, G. W. Grime, On the Accuracy of Total-IBA, Nucl. Instrum. Methods Phys. Res., Sect. B 2019, DOI:10.1016/j.nimb.2019.12.019.
- C. Jeynes, N. P. Barradas and E. Szilágyi, Accurate Determination of Quantity of Material in Thin Films by Rutherford Backscattering Spectrometry, Anal. Chem., 2012, 84, 6061–6069 CrossRef CAS PubMed.
- C. Jeynes, RBS as a new primary direct reference method for measuring quantity of material, Nucl. Instrum. Methods Phys. Res., Sect. B, 2017, 406, 30–31, DOI:10.1016/j.nimb.2016.11.041.
- D. Abriola, N. P. Barradas, I. Bogdanović-Radović, M. Chiari, A. F. Gurbich, C. Jeynes, M. Kokkoris, M. Mayer, A. R. Ramos, L. Shi and I. Vickridge, Development of a reference database for Ion Beam Analysis and future perspectives, Nucl. Instrum. Methods Phys. Res., Sect. B , 2011, 269, 2972–2978 CrossRef CAS.
- D. Abriola, N. P. Barradas, I. Bogdanović-Radović, M. Chiari, A. F. Gurbich, C. Jeynes, M. Kokkoris, M. Mayer, A. R. Ramos, L. Shi and I. Vickridge, Report of a Coordinated Research Project on Reference Database for Ion Beam Analysis, International Atomic Energy Agency, Vienna, 2015, IAEA-TECDOC-1780, http://https://www-nds.iaea.org/publications/tecdocs/iaea-tecdoc-1780/ Search PubMed.
- A. F. Gurbich, Evaluated differential cross-sections for IBA, Nucl. Instrum. Methods Phys. Res., Sect. B, 2010, 268, 1703–1710 CrossRef CAS.
- A. F. Gurbich and M. V. Bokhovko, Non-Rutherford cross-sections for alpha elastic scattering off Z = 28–38 elements in the energy range up to 10 MeV, Nucl. Instrum. Methods Phys. Res., Sect. B, 2018, 420, 1–5 CrossRef CAS.
- A. F. Gurbich, I. Bogdanović Radović, Z. Siketić and M. Jaksić, Measurements and evaluation of the crosssection for helium elastic scattering from nitrogen, Nucl. Instrum. Methods Phys. Res., Sect. B, 2011, 269, 40–44 CrossRef CAS.
- B. L. Henke, E. M. Gullikson and J. C. Davis, X-ray interactions: photoabsorption, scattering, transmission, and reflection at E = 50-30000 eV, Z = 1-92, At. Data Nucl. Data Tables, 1993, 54, 181–342 CrossRef CAS ; http://xdb.lbl.gov/.
- D. E. Cullen, J. H. Hubbell, L. Kissel, University of California Lawrence Livermore National Laboratory, https://www-nds.iaea.org/epdl97/.
- W. T. Elam, B. D. Ravel and J. R. Sieber, Radiat. Phys. Chem., 2002, 63, 121–128 CrossRef CAS ; http://https://www.nist.gov/mml/csd/inorganic-measurement-science/resources/xrf-downloads.
- T. Schoonjans, A. Brunetti, B. Golosio, M. Sanchez del Rio, V. A. Solé, C. Ferrero and L. Vincze, The xraylib library for X-ray-matter interactions. Recent developments, Spectrochim. Acta, Part B, 2011, 66, 776–784 CrossRef CAS ; http://lvserver.ugent.be/xraylib/(version%209/2017).
- H. Ebel, R. Svagera, M. F. Ebel, A. Shaltout and J. H. Hubbell, Numerical description of photoelectric absorption coefficients for fundamental parameter programs, X-Ray Spectrom., 2003, 32, 442–451 CrossRef CAS.
- A. Shaltout, H. Ebel and R. Svagera, Update of photoelectric absorption coefficients in the tables of McMaster, X-Ray Spectrom., 2006, 35, 52–56 CrossRef CAS.
- W. H. McMaster, N. Kerr Del Grande, J. H. Mallett and J. H. Hubbell, Lawrence Livermore National Laboratory Report UCRL-50174 (1969) Section II Revision I, http://csrri.iit.edu/mucal-src/ Search PubMed.
- M. Mantler, Quantitative XRFA of light elements by the Fundamental Parameter method, Adv. X-Ray Anal., 1993, 36, 27–33 CrossRef CAS.
- A. Taborda, A. Desbrée, A. Carvalho, P. C. Chaves and M. A. Reis, Energetic electron processes fluorescence effects for structured nanoparticles X-ray analysis and nuclear medicine applications, Nucl. Instrum. Methods Phys. Res., Sect. B, 2016, 381, 122–131 CrossRef CAS.
- N. Kawahara, T. Shoji, T. Yamada, Y. Kataoka, B. Beckhoff, G. Ulm and M. Mantler, Fundamental Parameter Method for the Low Energy Region Including Cascade Effect and Photoelectron Excitation, Adv. X-Ray Anal., 2002, 45, 511–516 CAS ; http://www.icdd.com/resources/axa/vol45/V45_79.pdf.
- M. Mantler and N. Kawahara, How accurate are modern fundamental parameters methods?, Rigaku J., 2004, 21(2), 17–25 CAS.
- J. L. Colaux and C. Jeynes, Accurate electronics calibration for particle backscattering spectrometry, Anal. Methods, 2015, 7, 3096–3104, 10.1039/c4ay02988g.
- M. P. Seah, S. J. Spencer, F. Bensebaa, I. Vickridge, H. Danzebrink, M. Krumrey, T. Gross, W. Oesterle, E. Wendler, B. Rheinländer, Y. Azuma, I. Kojima, N. Suzuki, M. Suzuki, S. Tanuma, D. W. Moon, H. J. Lee, H. M. Cho, H. Y. Chen, A. T. S. Wee, T. Osipowicz, J. S. Pan, W. A. Jordaan, R. Hauert, U. Klotz, C. van der Marel, M. Verheijen, Y. Tarnminga, C. Jeynes, P. Bailey, S. Biswas, U. Falke, N. V. Nguyen, D. Chandler-Horowitz, J. R. Ehrstein, D. Muller and J. A. Dura, Critical review of the current status of thickness measurements for ultrathin SiO2 on Si Part V. Results of a CCQM pilot study, Surf. Interface Anal., 2004, 36, 1269–1303 CrossRef CAS.
- A. F. Gurbich, SigmaCalc recent development and present status of the evaluated cross-sections for IBA, Nucl. Instrum. Methods Phys. Res., Sect. B , 2016, 371, 27–32 CrossRef CAS.
- N. P. Barradas and C. Jeynes, Advanced physics and algorithms in the IBA DataFurnace, Nucl. Instrum. Methods Phys. Res., Sect. B, 2008, 266, 1875–1879 CrossRef CAS.
- A. F. Gurbich and C. Jeynes, Evaluation of non-Rutherford Alpha Elastic Scattering Cross-sections for Silicon, Nucl. Data Sheets, 2014, 119, 270–272, DOI:10.1016/j.nds.2014.08.074.
- N. P. Barradas, C. Jeynes and S. M. Jackson, RBS/simulated annealing analysis of buried SiCOx layers formed by ion implantation of O into cubic silicon carbide, Nucl. Instrum. Methods Phys. Res., Sect. B , 1998, 136–138, 1168–1171 CrossRef CAS.
- A. F. Gurbich, Physics of the interaction of charged particles with nuclei, in Handbook of Modern Ion Beam Analysis,ed. Y. Q. Wang and M. Nastasi, Materials Research Society, Pittsburgh, 2nd edn, 2010, ch. 3 Search PubMed.
- M. Mayer, Statistical analysis of cross-section data for 12C(4He, 4He)12C backscattering, Nucl. Instrum. Methods Phys. Res., Sect. B, 2012, 285, 116–124, DOI:10.1016/j.nimb.2012.05.011.
- J. L. Colaux, G. Terwagne and C. Jeynes, On the traceably accurate voltage calibration of electrostatic accelerators, Nucl. Instrum. Methods Phys. Res., Sect. B, 2015, 349, 173–183 CrossRef CAS.
- E. V. Gai and A. F. Gurbich, Evaluated 12C(4He,4He)12C cross-section and its uncertainty, Nucl. Instrum. Methods Phys. Res., Sect. B, 2013, 296, 87–91, DOI:10.1016/j.nimb.2012.12.006.
- Guide to the Expression of Uncertainty in Measurement, International Organization for Standardization, Geneva, Switzerland, 1995 Search PubMed.
- V. Paneta, J. L. Colaux, A. F. Gurbich, C. Jeynes and M. Kokkoris, Benchmarking experiments for the proton backscattering on 23Na, 31P and natS up to 3.5 MeV, Nucl. Instrum. Methods Phys. Res., Sect. B, 2014, 328, 1–7 CrossRef CAS.
Footnotes |
| † Electronic supplementary information (ESI) available. See DOI: 10.1039/c9ja00382g |
| ‡ Glossary: GST – GeSbTe; GST-N – GeSbTe:N; WD-XRF – wavelength-dispersive X-ray fluorescence spectrometry; IBA – ion beam analysis (includes RBS, EBS, NRA, PIXE: q.v.); EBS – elastic (non-Rutherford) backscattering spectrometry (or spectroscopy for resonant EBS); RBS – Rutherford backscattering spectrometry; NRA – (inelastic) nuclear reaction analysis; PIXE – particle-induced X-ray emission (XRF induced by an ion beam); XRR – X-ray reflectometry; FP – fundamental parameters (standardless calculation method to interpret XRF spectra using databases of ionisation, fluorescence and absorption); SEM, TEM – scanning and transmission electron microscopy; EDX, WDX – repectively energy or wavelength dispersive X-ray spectroscopy or spectrometry, used with all X-ray fluorescence techniques including XRF, PIXE, and analysis on the electron microscope (SEM, TEM); TFU – thin film unit (of thickness) or 1015 atoms/cm2: Note that density (atoms/cm3) ≡ TFU/t where t is linear thickness (in cm). |
| This journal is © The Royal Society of Chemistry 2020 |

