
 Open Access Article
 This Open Access Article is licensed under a
 Creative Commons Attribution 3.0 Unported Licence
Artificial intelligence: the silver bullet for sustainable materials development†
Rifan
Hardian
 a,
Zhenwen
Liang
b,
Xiangliang
Zhang
b and
Gyorgy
Szekely
*a
a,
Zhenwen
Liang
b,
Xiangliang
Zhang
b and
Gyorgy
Szekely
*a
aAdvanced Membranes and Porous Materials Center, Physical Science and Engineering Division, King Abdullah University of Science and Technology (KAUST), Thuwal 23955-6900, Saudi Arabia. E-mail: gyorgy.szekely@kaust.edu.sa; Web: https://www.szekelygroup.com Web: https://www.twitter.com/SzekelyGroup
bComputer, Electrical and Mathematical Science and Engineering Division, King Abdullah University of Science and Technology (KAUST), Thuwal 23955-6900, Saudi Arabia
First published on 9th October 2020
Abstract
Materials discovery is rapidly revolutionizing all aspects of our lives. However, the design and fabrication of materials are often unsustainable and resource-intensive. Hence, we need a paradigm shift towards designing sustainable materials in silico. Machine learning, a subfield of artificial intelligence (AI), is emerging within the sustainability agenda because it promises to benefit science and engineering through improved quality, performance, and predictive power. Here we present a new methodology to extend the application of AI to develop materials in an environmentally friendly way. We demonstrate successful materials development by combining design of experiments with a new machine learning module that comprises a support vector machine, an evolutionary algorithm, and a desirability function. We use our AI-based method to realize the sustainable electrochemical synthesis of a ZIF-8 metal–organic framework and explore the hyperdimensional relationship between the synthesis parameters, product qualities, and process sustainability. The presented AI-based methodology paves the way for solving the challenge of the materials fabrication-sustainability nexus, and facilitates the paradigm shift from the wet lab to the wired lab.
Introduction
The United Nations’ Sustainable Development Goals outline a blueprint to provide a prosperous and more sustainable future for society. The sustainable design and development of advanced materials and chemicals is a crucial element of this blueprint.1 Both the planned design and serendipitous discovery of advanced materials are revolutionizing many domestic and industrial sectors such as energy, computing, water, medicine, environment, and agriculture, among many others. To reduce the environmental burden, time, labor, and cost of the discovery-to-deployment process of advanced materials, we need a paradigm shift in how we approach the materials fabrication-sustainability nexus. Fundamentally, this paradigm shift requires a widespread cultural change and a shift in emphasis from the conventional wet chemistry lab to wired labs enabled by artificial intelligence (AI).Conventional materials discovery is performed by varying one factor at a time, which has multiple limitations and drawbacks. For instance, experimental datapoints are inherently limited, possible factor interactions are not revealed, and the optimum is rarely achieved, among other limitations. The design of experiments (DoE) is an alternative systematic approach that achieves a good balance between a reduced number of experiments and efficiency. DoE allows the factors to be varied and investigated simultaneously, thus accelerating the process of discovery and optimization, while conserving precious resources, labor, time, and ultimately resulting in a more sustainable approach.2–4 Since DoE utilizes a minimum number of experimental data, there is a need to develop and validate methodologies that can expand the limited experimental results into much larger virtual datasets. We hypothesize that machine learning (ML), a growing area of AI, will not only allow us to generate datasets with higher dimensional interactions but also help to predict the outcome of otherwise unrealized experiments (Fig. 1).
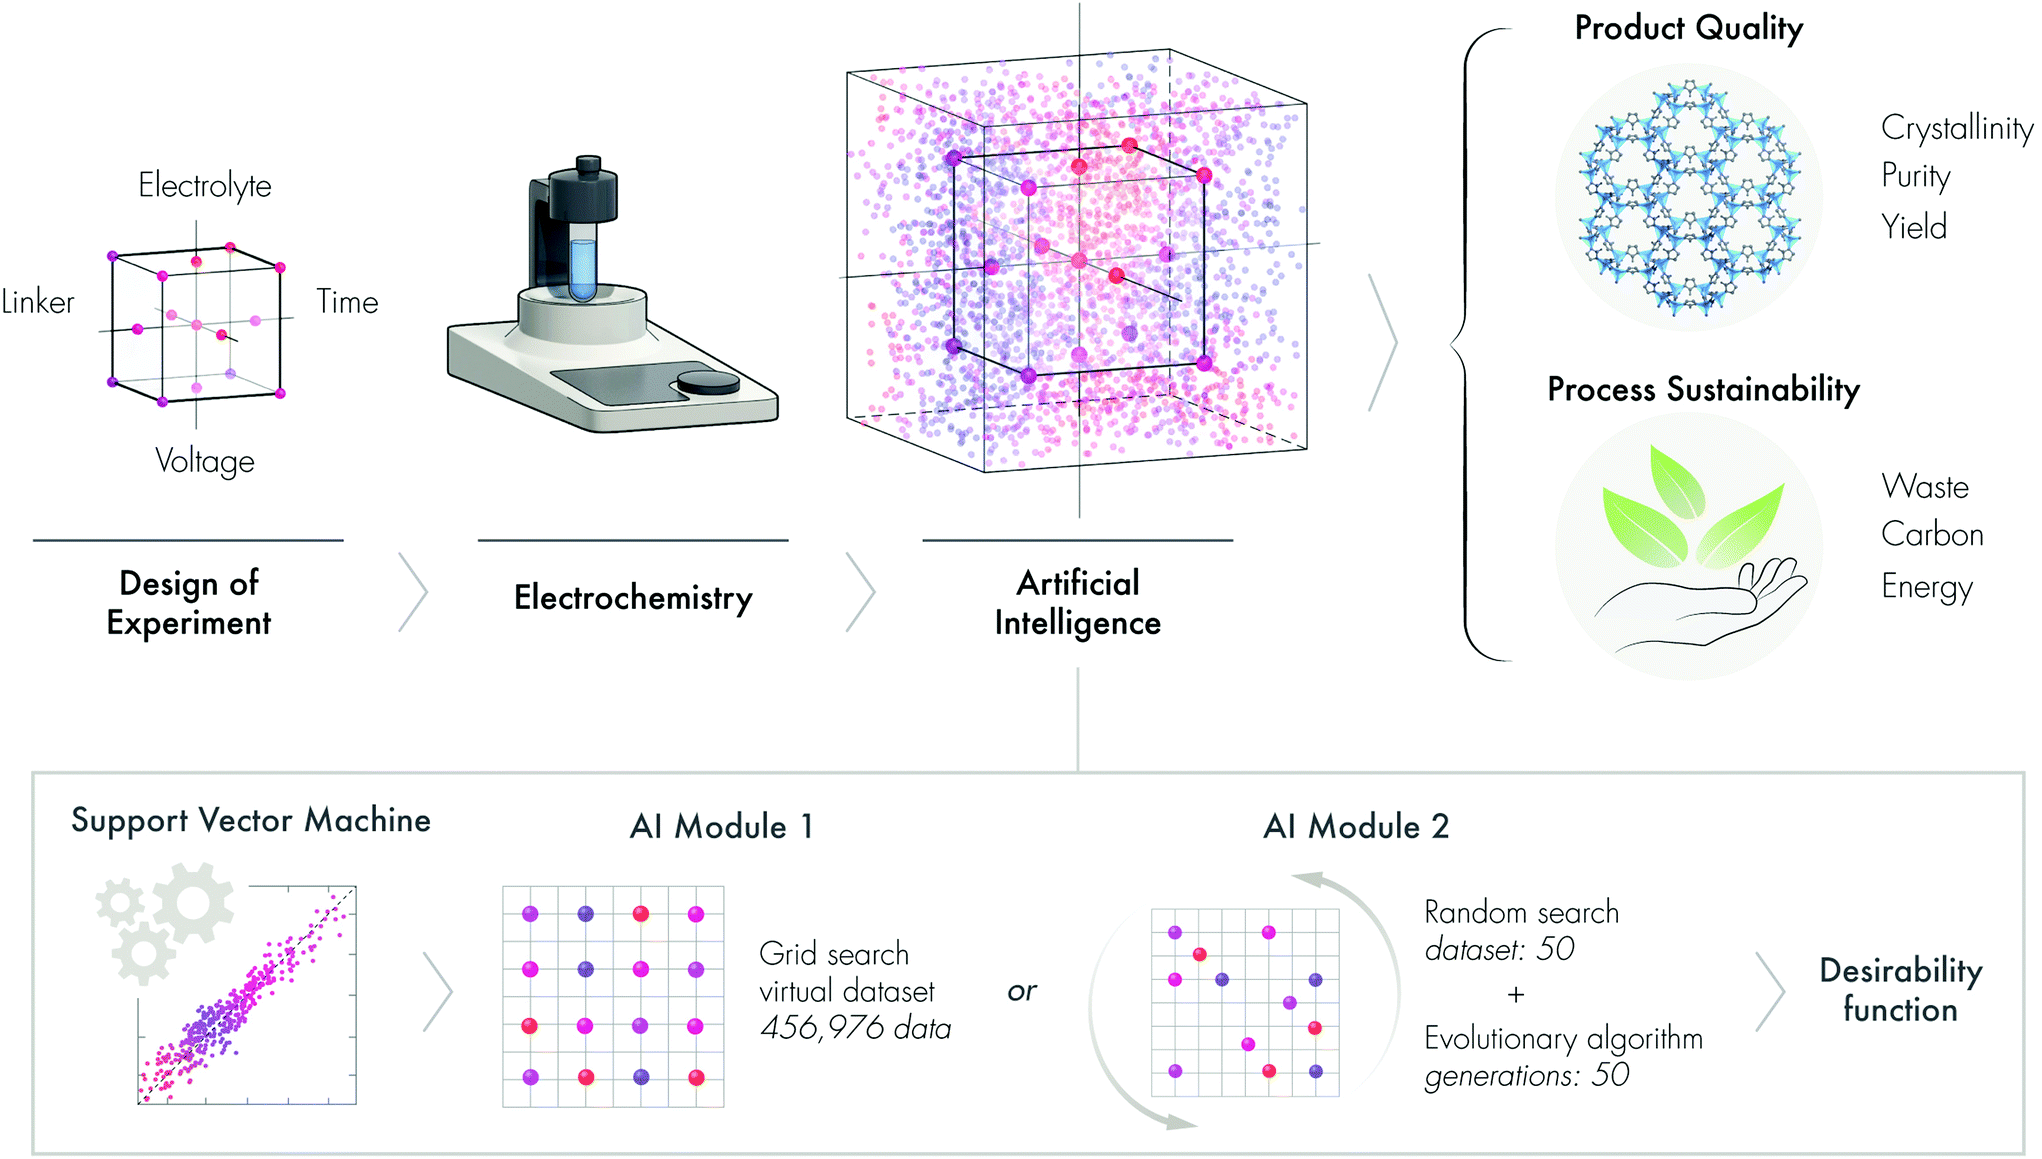 | ||
| Fig. 1 Strategy for AI-based sustainable materials development in a hyperdimensional system. (a) General steps and process parameters to evaluate product quality and process sustainability in electroorganic synthesis of ZIF-8. (b) Simplified flow chart of the applied AI modules and machine learning. | ||
ML utilizes different statistical methods to learn from various data types via a set of algorithms.5 ML methods first learn the patterns and rules that underlie a dataset by evaluating a portion of that data and then build a model to make predictions.6 In fact, ML has already been used to discover and predict the performance of new materials and to optimize processes in the field of molecular and materials science.6,7 The use of ML to address environmental issues is also a rapidly growing area of research.8,9 For instance, Cao et al.2 fabricated photovoltaic devices using consecutive experimental design and ML. Support vector regression and random forest have been used to screen and identify the properties of metal–organic frameworks (MOFs) from structure databases.10 Furthermore, a combination of high-throughput molecular simulations with an artificial neural network algorithm has been implemented to predict the mechanical properties of MOFs.11
In this work, we describe a new ML module that synergistically combines DoE, a support vector machine, an evolutionary algorithm and a desirability function to sustainably obtain MOFs. Unlike multivariate optimization that often results in multiple solutions, this new strategy can propose a single solution, which is useful for effective decision-making. To demonstrate the new AI approach, we develop a sustainable electrochemical synthesis of MOFs.
MOFs are a class of porous materials built from metal cations bridged together by organic linkers to form a framework.12 The broad range of possible organic and inorganic components enables the design of MOFs with almost limitless structures. The interesting properties of MOFs, such as their flexible porous structure, high surface area, or high reactivity, make them of great interest for many potential applications such as gas storage, separation, water harvesting, catalysis, shock absorber, drug delivery, among many others.13,14 As they are considered the next chemistry powerhouse, there is a growing interest in the sustainable fabrication of MOFs.15–18
ZIF-8 is a type of MOFs that has received much attention because it has high thermal and chemical stability, a high surface area, unique properties such as gate opening due to linker twisting, and can undergo phase transformation.19–21 ZIF-8 is constructed from zinc atoms connected with 2-methylimidazole linkers, forming a porous structure with pore aperture and cavity size of 3.4 and 11.6 Å, respectively. In this work, ZIF-8 was selected because it is one of the most studied MOFs with various applications, however the developed AI methodology can be applicable to other MOFs.
Owing to the renewed interest in electroorganic chemistry to perform rapid, environmentally friendly, and cleaner synthesis,22,23 we decided to investigate the potential of electroorganic chemistry to synthesize ZIF-8. A plethora of parameters govern the electrochemical synthesis of MOFs such as voltage, current, and reaction time, as well as concentrations and ratios of the precursors and electrolytes.24,25 Another parameter that can be controlled in the synthesis of MOFs is solvent selection, which can be quantified using the Hansen solubility parameters, polarity, and dielectric constant among others.
Herein, we propose that AI is a silver bullet for sustainable materials development, demonstrated through the electrochemical synthesis of ZIF-8, to produce a high-quality product and a sustainable process (Fig. 1).
Results and discussion
Data generation and factor contribution
We performed face-centered central composite design with 27 runs to obtain the initial experimental dataset. The highest quality product (entry 15, Table S4†) exhibited sharp XRD peaks and was well matched with the calculated XRD pattern (Fig. 2a), as well as having a well-constructed rhombic dodecahedron crystal shape with approx. 500 nm size (Fig. 2b), thus suggesting good crystallinity. Refer to section 2.1 in the ESI† for a detailed description of the DoE.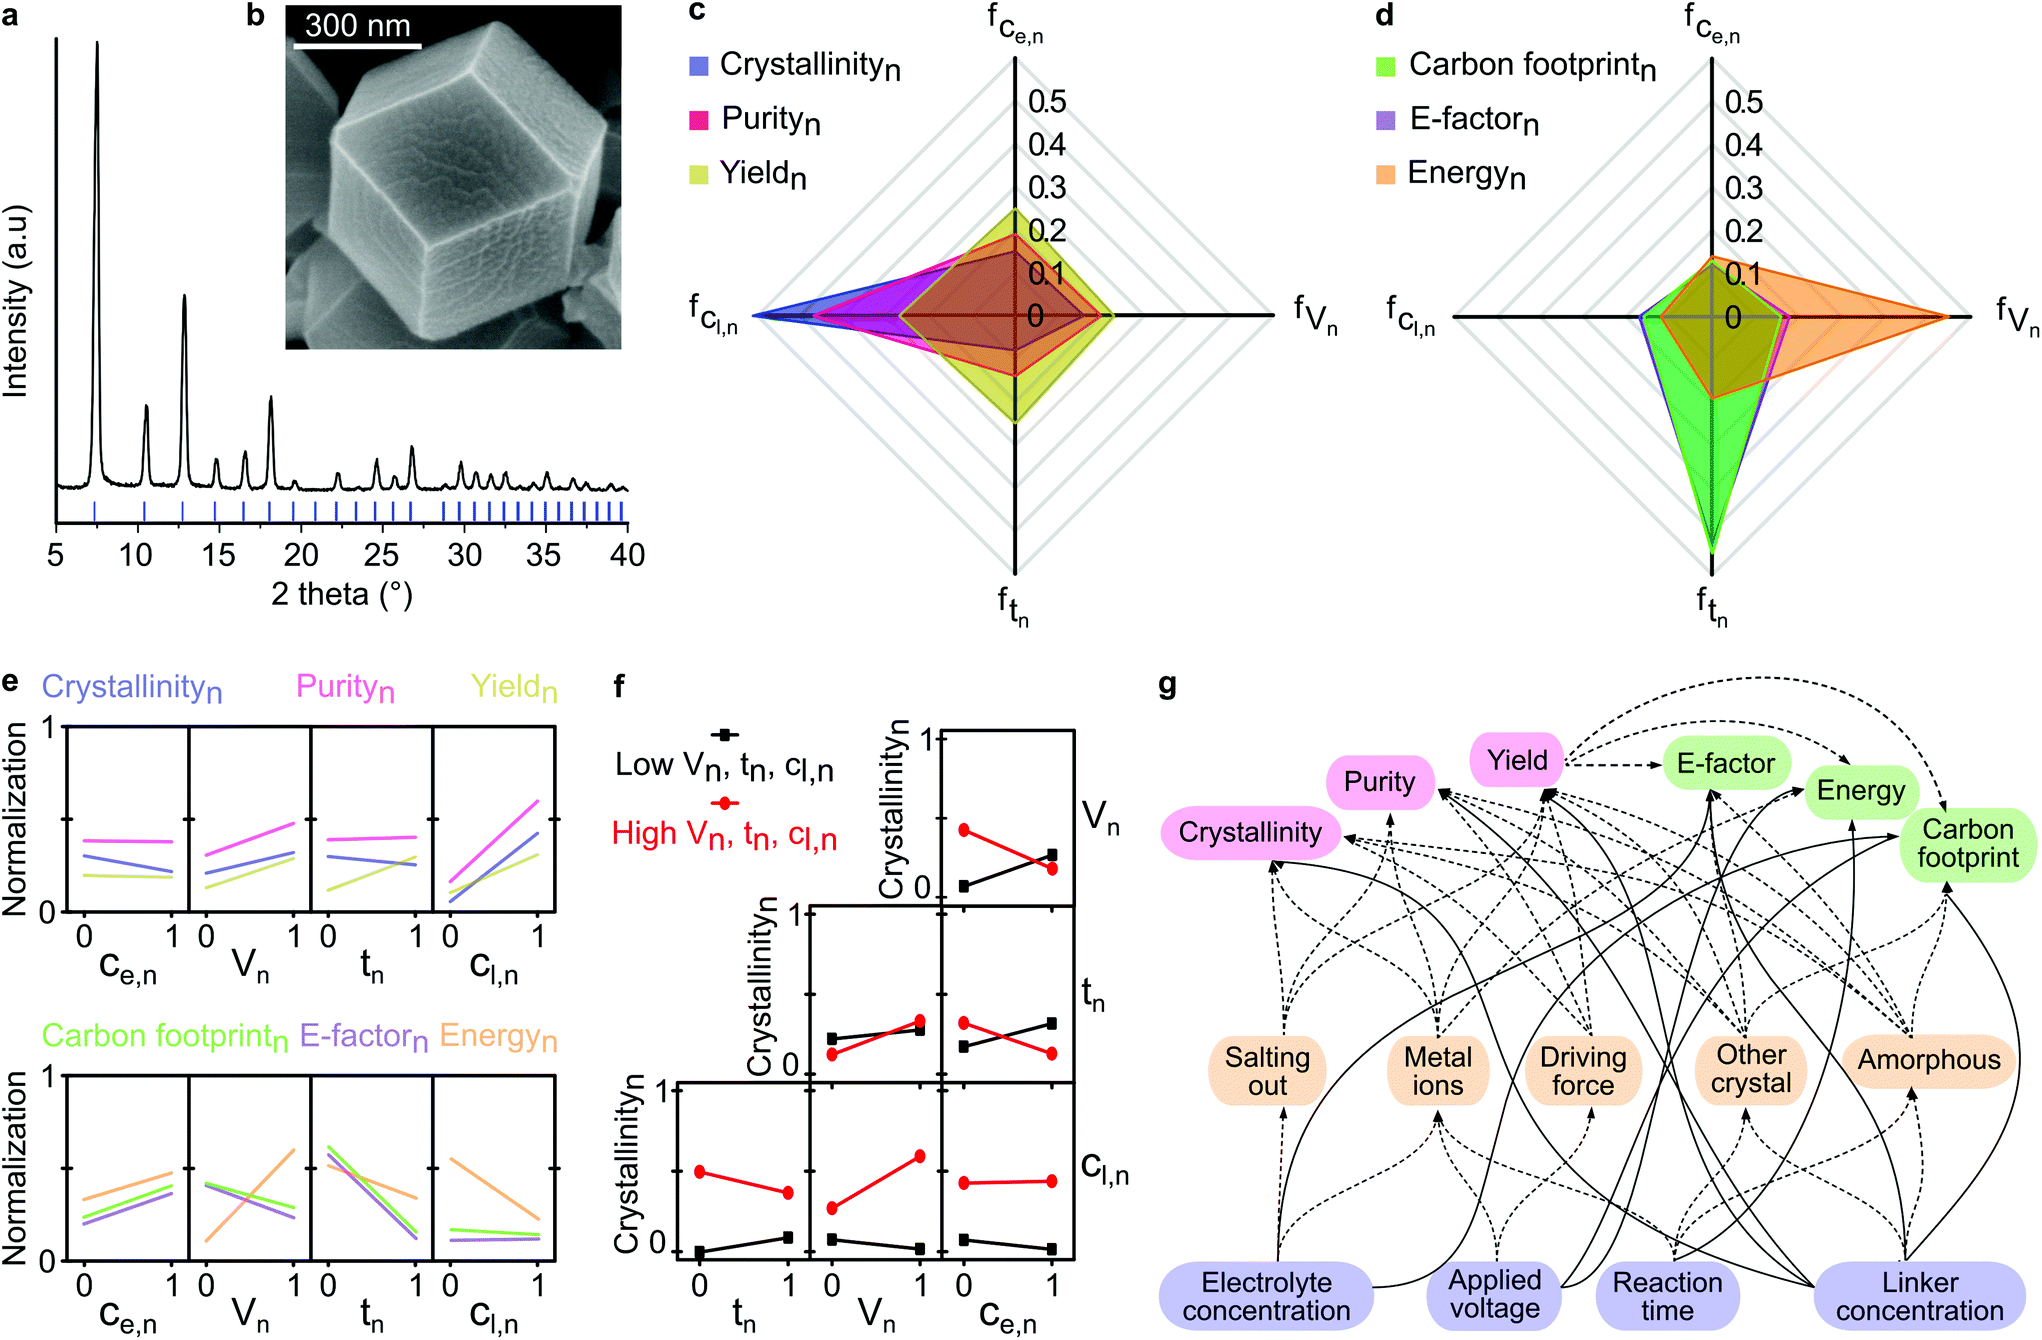 | ||
| Fig. 2 Factor contribution and interactions. (a) XRD pattern, and (b) SEM image of ZIF-8 synthesized from entry 15 (Table S2†) in the experimental design. Factor contributions of each parameter to each response under the category of (c) product quality, and (d) process sustainability. Each axis and color represent a different factor contribution and response, respectively. Subscript n indicates normalized value. Ce is electrolyte concentration, V is applied voltage, t is reaction time, Cl is linker concentration. (e) Individual parameter-response interactions on product quality and process sustainability. (f) Two-parameters-response interaction on crystallinity. (g) Complexity of the multivariable interaction in the studied system, where the solid and dashed lines indicate direct and indirect (through intermediate) parameter-response interactions, respectively. | ||
The higher a parameter contribution to the observed responses, the higher the variance in the output responses. The linker concentration had the most significant effect, governing both the crystallinity and purity (Fig. 2c). The low linker concentration led to the formation of amorphous materials (Table S4†). On the contrary, all parameters were almost equally significant in controlling the yield of the synthesized product. The factor contributions to the process sustainability are illustrated in Fig. 2d. The applied voltage contributed the most to the total energy consumption during the electrochemical synthesis of ZIF-8, while the reaction time produced the highest variance in the E-factor and carbon footprint responses.
This phenomenon can be explained by the longer reaction time, which allowed enough time for the nucleation and growth of the products, that in turn, resulted in higher yields. Consequently, the reaction time significantly influenced both the E-factor and carbon footprint, which were inversely proportional to the yield. A detailed description of the factor contribution determination is available in section 2.2 in the ESI.†
Interactions of the variables
We assessed the individual correlations by observing the variance of the response at the lowest and the highest value of the parameter (see section 2.3 in the ESI†). The most significant correlation is indicated by the steepest slope between the parameter and the response, as shown in Fig. 2e. For instance, the strongest correlation was found for the electrolyte concentration and crystallinity, whereby an increase in the electrolyte concentration decreased the crystallinity and increased the environmental impact (E-factor, energy consumption, and carbon footprint). The observed decrease in crystallinity was a result of excessive addition of the electrolyte that induced a salting-out process, causing water molecules to be attracted by the salt ions, and subsequently reducing the solubility of both zinc cations and organic linkers, thus inhibiting MOFs formation.26 The observed increase in the environmental impact can be explained by the fact that the increase in electrolyte concentration generated more waste because it was not converted into the product. Applying a higher voltage resulted in more crystalline MOFs with higher purity and yield, albeit with higher energy consumption. However, counterintuitively, the higher energy consumption did not increase the carbon footprint due to the higher product yield. A similar compromise was evident for the increase in reaction time, which mitigated the environmental impact due to the higher product yield. The linker provided a substantial improvement in product quality while reducing energy consumption.Nevertheless, the individual parameter-response interactions did not consider the possible interaction between the parameters themselves. Thus, we evaluated the two-parameters-response interactions (see section 2.4 in ESI†). In contrast to the individual correlation (Fig. 2e), the effect of electrolyte concentration on crystallinity was dependent on other parameters (Fig. 2f). For instance, with a short reaction time and low applied voltage, the increase in electrolyte concentration led to an increase in crystallinity. In contrast, with a longer reaction time and higher applied voltage, an increase in electrolyte concentration resulted in a decrease in crystallinity. This phenomenon was caused by the low amount of metal cations generated from the cathode with a short reaction time and low applied voltage, which could be easily overcome at higher conductivity by increasing the electrolyte concentration, which favors the formation of crystalline material. However, with a longer reaction time and higher applied voltage, an abundance of metal cations were generated from the cathode. In this case, increasing the electrolyte concentration was not effective in facilitating ionic transfer processes due to oversaturation, which resulted in higher concentrations of both the zinc cations and the electrolyte.
Beyond the two-parameters interactions effects, the complexity of using the multivariable system for materials fabrication is illustrated in Fig. 2g. The process parameters influenced different responses either directly or through intermediate processes, such as salting-out, metal ions generation, driving force effect, and the formation of other undesired materials. With the aid of ML algorithms, we generated predictive virtual datasets through the grid-search method, which enabled us to construct the overlaying contour plots to visualize the multidimensional interactions. In the next section, we discuss the implementation of ML to investigate the multidimensional correlation between parameters and observed responses, in terms of product quality and process sustainability.
Machine learning for product quality and sustainability assessments
In this section, we applied ML to enable us to assess the interaction of multi-parameters and also predict the outcomes from virtual datasets. To build the surrogate function, we initially tested two ML algorithms. The validation of the support vector machine (SVM) and random forest (RF) algorithms revealed that SVM was more appropriate than RF, as demonstrated by R2 and MSE values (see section 2.12 in the ESI†). AI Module 1 (Fig. 1b) used the experimental data from the DoE as input for the SVM algorithm, followed by the grid-search method, to generate an extensive virtual dataset with 456,976 data points. The subset of this dataset is presented in the response surface plots for the product qualities (Fig. 3a–c) and process sustainability (Fig. 3d–f). Refer to the ESI† section 3 for the comprehensive 4D plots.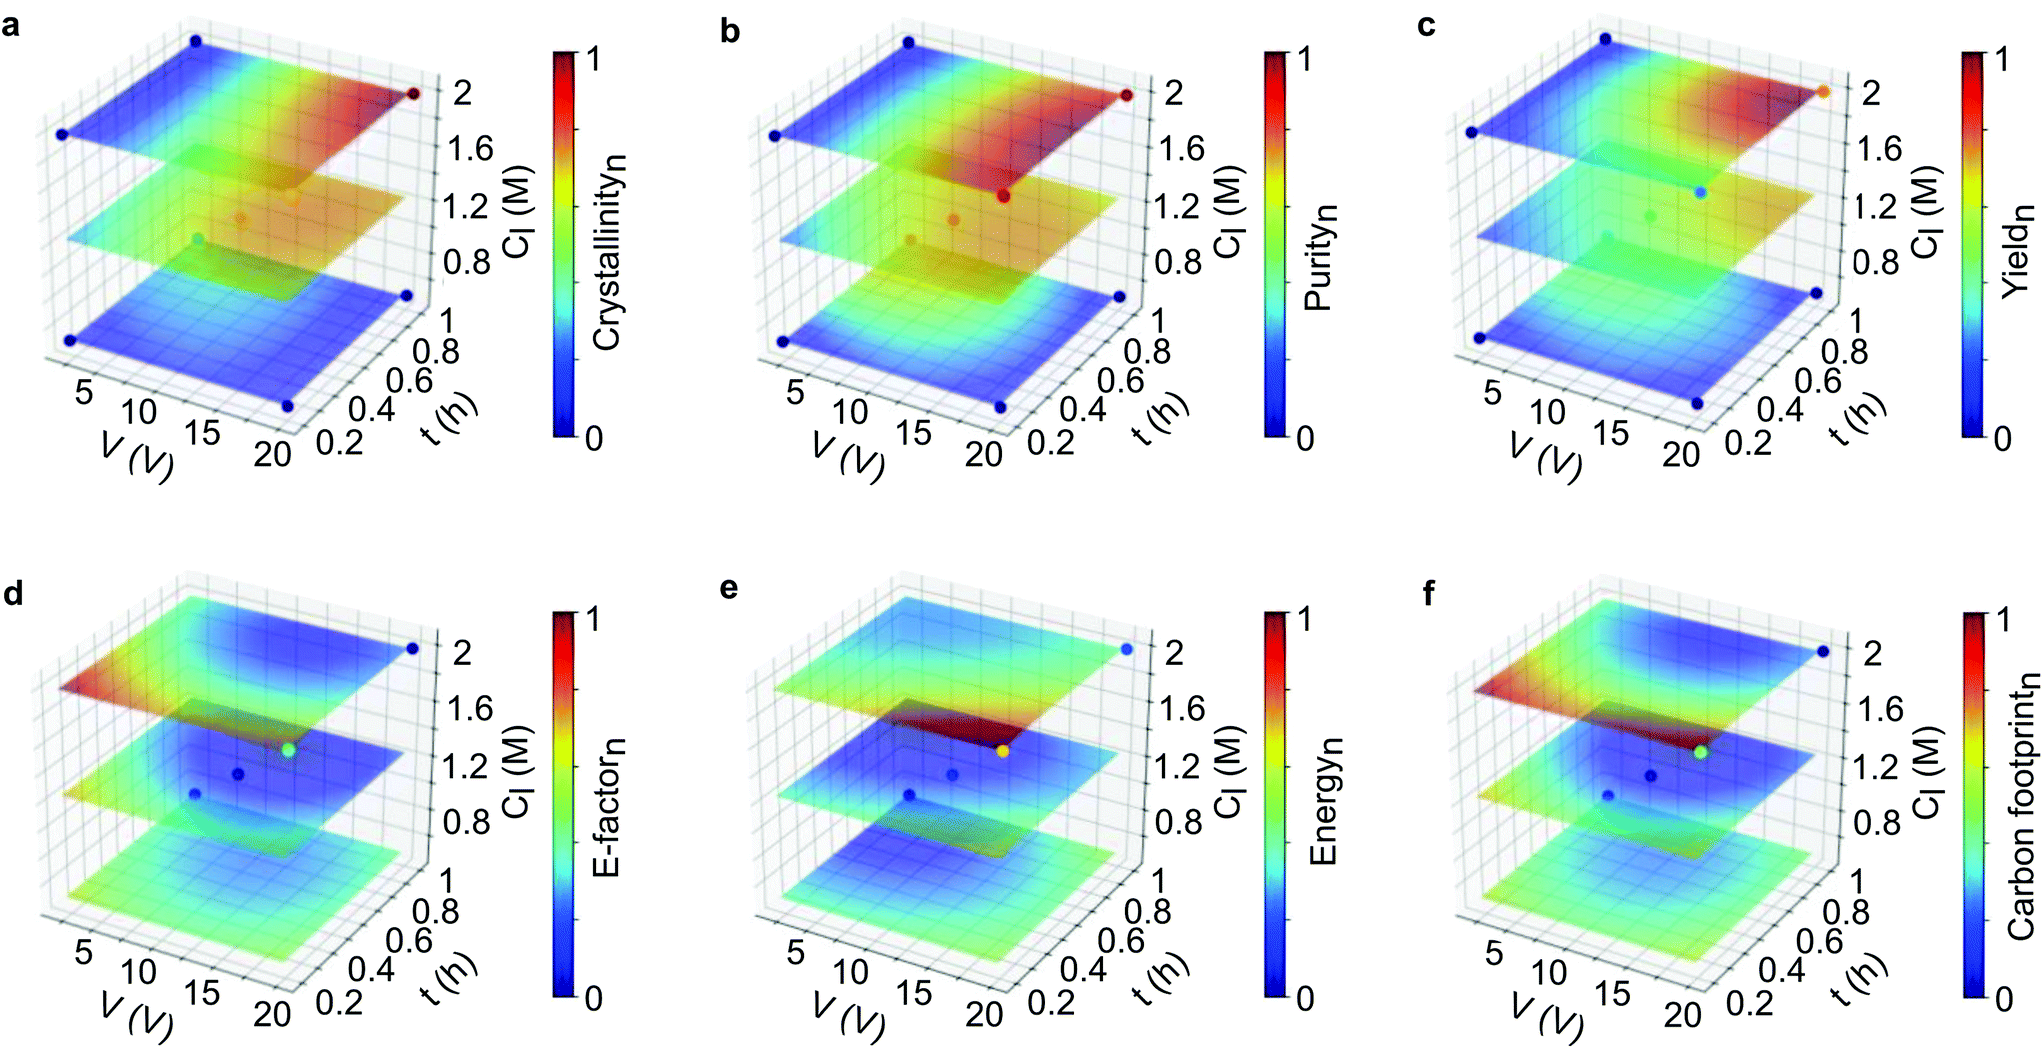 | ||
Fig. 3 Machine learning generated a 4D response surface for product quality and sustainability. Response surface plots from the SVM fits of the parameters on (a–c) product quality and (d–f) product sustainability. The electrolyte concentration was set at 0.01 M, while the applied voltage (V), reaction time (t), and linker concentration (Cl) were varied. The sampling points generated from the DoE are placed as the dots in each surface plot. The virtual dataset consists of 456![[thin space (1/6-em)]](https://www.rsc.org/images/entities/char_2009.gif) 976 data points in total. Refer to the ESI† for the comprehensive 4D plots. 976 data points in total. Refer to the ESI† for the comprehensive 4D plots. | ||
Fig. 3a–c shows that the highest product quality was achieved at high voltage, longer reaction time, low electrolyte concentration, and high linker concentration. This condition also revealed the best process sustainability, which is indicated by the low value for the E-factor, energy consumption and carbon footprint (Fig. 3d–f). Taken together, it can be interpreted that high voltage produces more zinc cations as the source of metal node to form MOFs. The longer reaction time allowed enough time for nucleation and crystal growth to occur. The high linker concentration ensured that there was enough linker to form a framework with the metal cations. Meanwhile, the low electrolyte concentration increased the system conductivity while avoiding salting out.
Thus, the broader view provided by multidimensional analysis is evidently helpful to critically assess the interaction of the variables. Multiparameter interactions can be more easily visualized, and their correlation with each response can be carefully investigated. However, the response surface plots appear to be limited to correlate multiparameter with only one response. As shown in Fig. S28 and S29,† a total of 18 panels of 4D plots with 54 layers were obtained by corelating four parameters with six responses. This combination generated 486 ways to interpret the plots. Hence, using the correlation of ten variables is still not very practical to propose a single optimum condition. In our case, visualizing all the interactions in one figure is not practically possible and not interpretable, as such visualization requires a ten-dimensional image. Below, we discuss an ML-based strategy to evaluate the optimum conditions for a hyperdimensional system that can propose a single solution.
In AI Module 2, we used the experimental data from DoE as the input for the SVM algorithm, followed by 50 random virtual data generations as the initial population for the evolutionary algorithm (Fig. 1b). This process was then followed by the implementation of the desirability function for the last optimization step (see Fig. S1† for the detailed flow-chart). The evolutionary algorithm was based on the evolution of the initial data population through cross-over and mutation, which was inspired by genetic evolution.27 In particular, in this study, we implemented a nondominated sorting genetic algorithm (NSGA-II).28
From a practical perspective, we considered two optimization objectives for decision-making (Fig. 4a). The first objective aimed to maximize the product quality only, while the second objective targeted both product quality and process sustainability. During the implementation of the evolutionary algorithm, the different objectives were met for the different generations, which was measured by the inverted generational distance (IGD) values (Fig. 4c and d). The solution converged at the larger generation as the number of optimized variables increased.
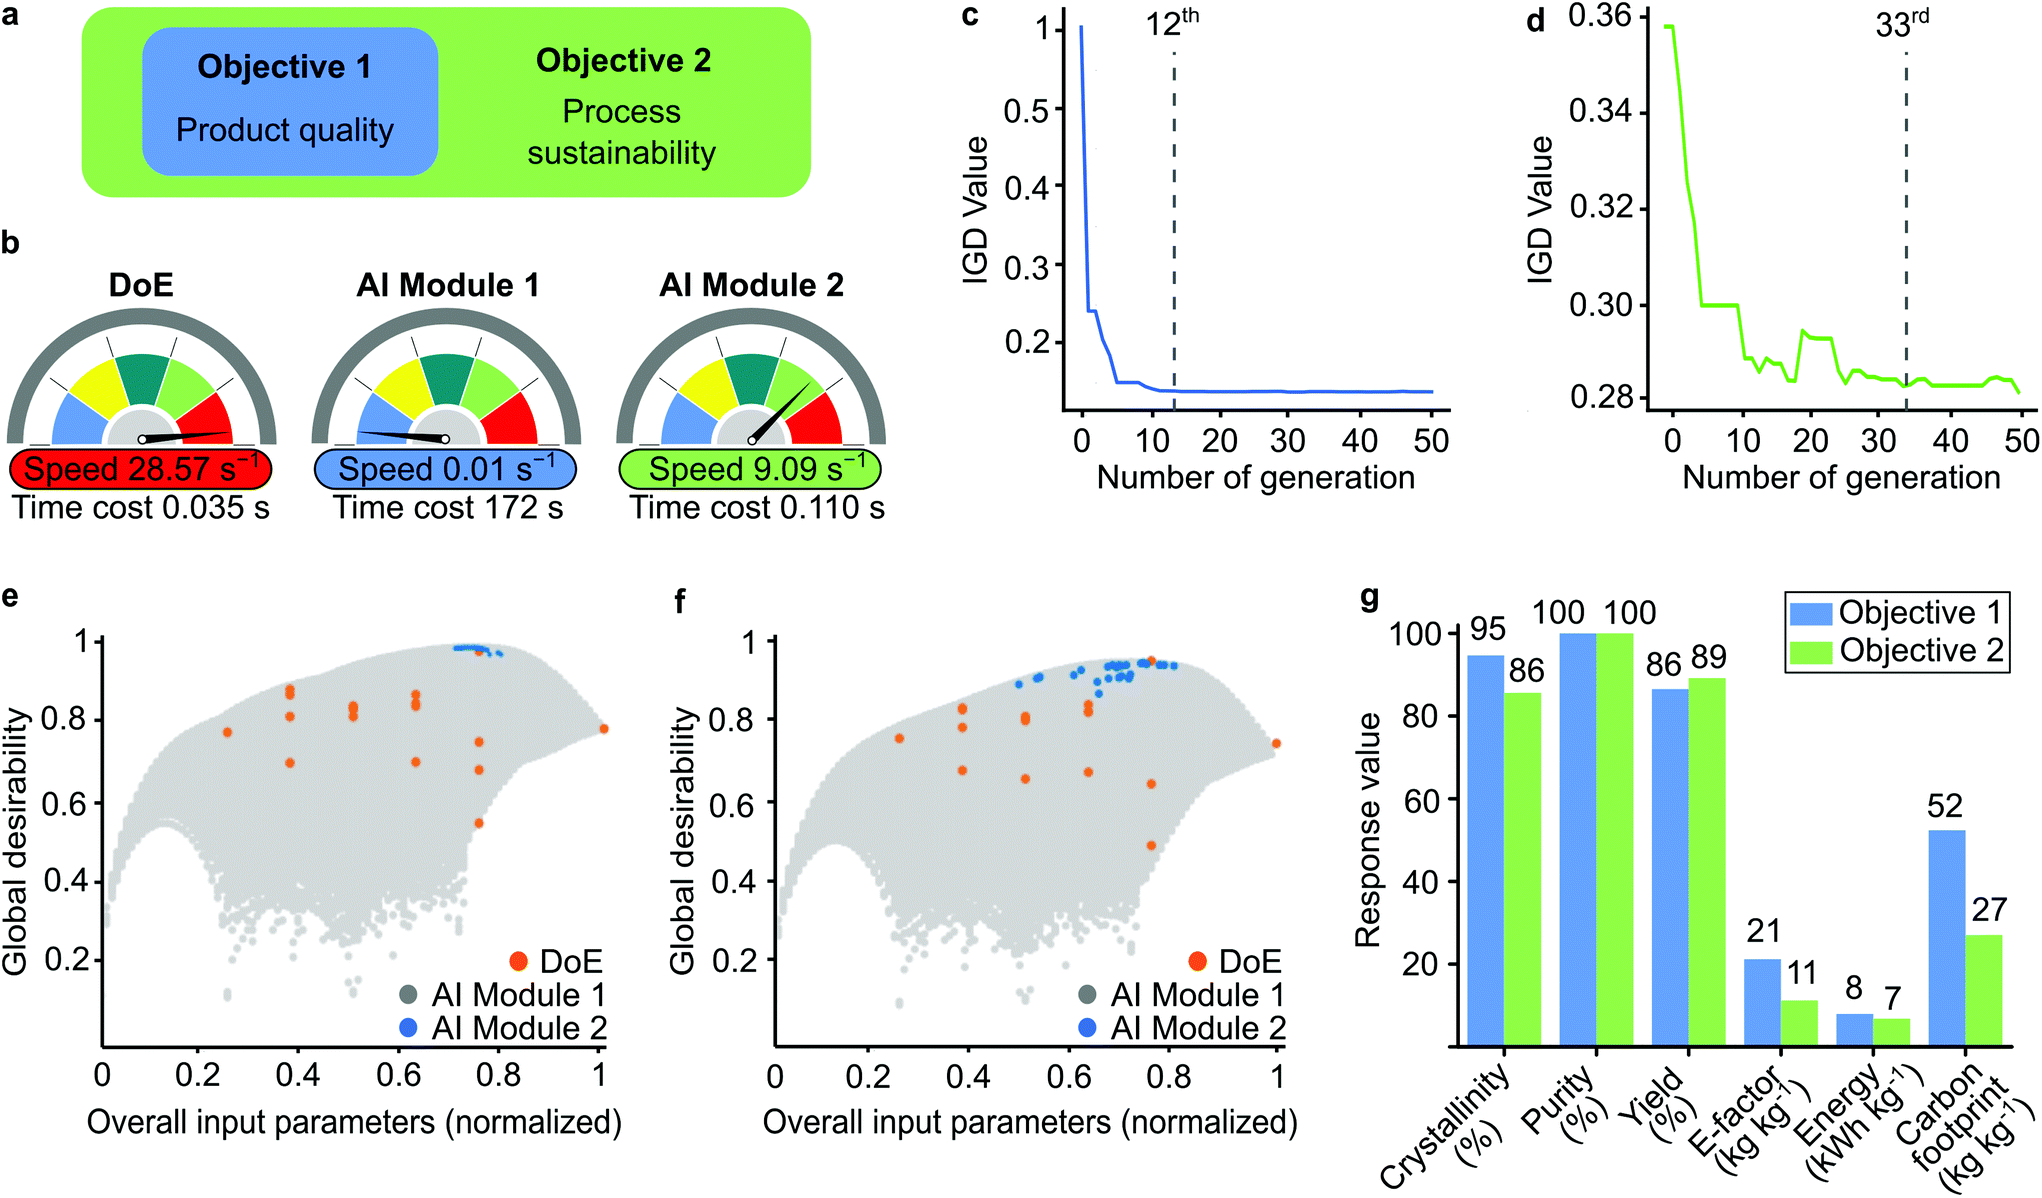 | ||
| Fig. 4 Hyperdimensional optimization strategy. Expanding objectives for optimizations (a). Time cost for the DoE and AI modules as part of the whole system (b). Inverted generational distance (IGD) test over the number of generations in genetic algorithm for objectives 1 (c) and 2 (d). Global desirability for the overall input parameters for objectives 1 (e) and 2 (f) using three methodologies: DoE, AI Modules 1 and 2. Response values for AI Module 2 (g). | ||
The global desirability graphs show the data points for DoE and AI Modules 1 and 2 for the normalized input parameters (Fig. 4e and f). The limited number of DoE results were insufficient to identify the optimal point, while AI Module 1 created an unnecessarily large dataset. Although the accuracy was good, the computational cost increased (Fig. 4b). The incorporation of the evolutionary algorithm in AI Module 2 made it possible to screen only the best data population. Therefore, AI Module 2 did not require too many data points, which significantly increased the computational speed from 0.01 s−1 to 9.09 s−1 to find the optimum solution. Owing to the small number of datapoints, the computational speed of DoE was the highest (28.57 s−1).
The single solutions for the optimum condition for each objective with different methodologies are compared in Table S12† and visualized in Fig. S30.† The solutions from both AI modules were better than the DoE results. Objective 2 accomplished with AI Module 2 required the least computational power and maintained a high-quality product while minimizing the environmental impact (Fig. 4g). Overall, the best performance achieved 86% crystallinity, 100% purity, and 88% yield using 0.07 M electrolyte, 1.86 M linker concentrations, and 18.5 V with a 0.9 h reaction time. Under these conditions, the E-factor and carbon footprint were found to be 11 and 27 kg kg−1, respectively, and the corresponding energy consumption was 7 kW h kg−1.
Conclusions
In this work, we have successfully demonstrated the power of artificial intelligence (AI) to reveal the complex hyperdimensional relationships often encountered in materials design and development. We developed a sustainable electrochemical synthesis of ZIF-8 metal–organic framework and designed a single-solution AI module that created virtual datasets, which mapped the design space of both the product quality and the process sustainability. The incorporation of an evolutionary algorithm (NSGA-II) enabled a rapid and accurate methodology to obtain ZIF-8 with 100% purity, 88% yield, and 86% crystallinity. The E factor, energy consumption and carbon footprint were minimized to 11 kg kg−1, 7 kW h kg−1 and 27 kg kg−1, respectively. This example for the electrochemical synthesis of ZIF-8 reveals the potential for other possible applications to apply AI approaches in much broader fields of materials fabrications and engineering, particularly to study product quality and process sustainability. Working towards the United Nations’ Sustainable Development Goals, the proposed methodology enables the precise molecular engineering of materials, while partially shifting from resource-intensive wet labs to more sustainable virtual labs.Experimental
Synthesis of ZIF-8
To achieve better control over the electrolyte conductivity, deionized water (18.2 MΩ at 23 °C, Milli-Q) was used. The electrolyte conductivity was governed by the addition of KCl salt (ACS reagent 99%, Sigma Aldrich). The concentration of electrolyte (KCl) and 2-methylimidazole (99%, Sigma Aldrich), as well as the reaction time and applied voltage were adjusted according to the face-centered central composite design model (Table S4†). The independent parameters with their three-factor levels were Ce = 0.01 M, 0.155 M, 0.3 M; V = 2 V, 11 V, 20 V; t = 0.2 h, 0.6 h, 1 h; Cl = 0.5 M, 0.125 M, 2 M. Electrochemical synthesis was performed at room temperature using a zinc electrode 0.7 in an IKA Electrasyn 2.0 instrument. Deionized water (15 mL) was used as the solvent. The product precipitated as a white powder and was further separated by using centrifuge at 5000 rpm for 10 minutes, followed by washing with deionized water for three times. The final precipitate was filtered and placed in a preheated oven at 120 °C for 24 h.Powder X-Ray diffraction (XRD)
The powder XRD data were collected using a Cu Kα Bruker D8 Advance diffractometer in the angular range containing the peaks of interest, 2θ 5–40° with a 0.02° increment and scanning speed of 10° min−1. Prior to data collection, the samples were placed on the zero-background XRD sample holder and flattened using a glass plate. The data were analyzed, and the profile fitting was carried out using Origin. Origin was also used to determine the integral breadth (the ratio of the area under the peak to the peak height) of the most intense diffraction peak at 2θ approx. 7.5°.Scanning electron microscopy (SEM)
A Magellan scanning electron microscope was used to record electron images of selected samples, using a working distance of 4.3 mm, 5 keV voltage, and 50 pA current at 100K × magnification under a TLD detector. The samples were placed on the aluminum sample holder prior to measurement using conductive carbon tape. The prepared samples were then coated with 4 nm thick iridium using a sputter coating machine Quorum Q150T.Thermogravimetric analysis (TGA)
Thermogravimetric analysis (TGA) was carried out using a TGA-Q500 (TA Instruments) with a temperature ramp rate of 10 °C min−1 from 25 °C to 700 °C under a nitrogen atmosphere.Surface area measurement (BET)
Nitrogen sorption measurement was performed with an ASAP 2020 instrument with nitrogen gas at 77 K. The sample was evacuated in a dynamic vacuum (p = 10−3 mbar) at 120 °C for 24 h prior to the measurement. Microactive software was used to evaluate the BET surface area.Product quality assessment
The percentage of relative crystallinity was calculated based on established methods,29–31 namely the comparison of the integral-breadth of the most intense XRD peak (2θ ≈ 7.5°). The purity indicates the ratio of the desired product to the undesired side-product. The percentage purity was determined through XRD measurement by dividing the area under the peaks corresponding to the XRD pattern of ZIF-8 with the whole integral of the XRD pattern. The yield was calculated by dividing the obtained mass of the product with the calculated theoretical product mass (assuming 100% yield) and considering zinc as the limiting reactant. The XRD patterns of the synthesized products (accompanied by corresponding SEM images) and example of the relative crystallinity and purity calculations are provided in the ESI† (section 2.5–2.6, and Fig. S31–S49†).Process sustainability assessment
E-factor is defined as the ratio of the mass of waste to the mass of product.32 Energy consumption during electrochemical synthesis was derived from the reaction time, the applied voltage, and the number of charges involved. The carbon footprint, which is considered a standardized indicator of greenhouse gas emissions,33,34 was calculated to estimate the equivalent CO2 generated for the production of ZIF-8. Further detail on the calculations of the sustainability assessments is provided in the ESI† (section 2.8–2.10).Machine learning
A support vector machine (SVM) was employed to predict the characteristics of the reaction products. The input data were obtained from the experimental results obtained through DoE (section 2.1 in the ESI†). The codes for the ML algorithms are provided in section 2.14 of the ESI.† All codes used in this paper were implemented by Python, and the code is available online to download free of charge. The Pandas5 package was used to import all the original data and export all the generated data. The SVM model was created and fitted by the Scikit-learn6 package. All visualization work was accomplished using the Matplotlib7 package. The radial basis function kernel was used on the SVM model due to its fitting flexibility for high-dimension data.The parameter of the SVM model, such as ‘gamma’, is crucial for its performance. A gamma value that is too small leads to low accuracy, while a high value of gamma could cause an overfitting problem. To choose the best parameters for the SVM model such as ‘gamma’ and ‘C’, we applied cross-validation method. After cross-validation, the gamma was set to 1, and C was set to 10. The min-max normalization method was used to scale all the input and output variables to a certain range (0–1). The step value of 0.04 was used to generate a 4-dimension grid (for 4-input variables in this experiment). For each dimension there are 1/0.04 + 1 = 26 steps; thus, the total number of generated points was 26 × 26 × 26 × 26 = 456976. The model was validated by comparing the fitting of two ML algorithms; the SVM and the RF. The model validation is provided in section 2.12 in the ESI.†
After designing and training the ML model, evolutionary algorithm was used to perform optimization based on that surrogate model. Non-dominated Sorting Genetic Algorithm (NSGA-II) was used to achieve the best solutions. Our genetic algorithm started from a randomly initialized population with a sample size of 50, which was the potential solution set of the problem. After the initialization of the first-generation population, the generation evolved by crossover and mutation to produce increasingly better approximate solutions. In each generation, the best individuals were selected according to the fitness of the objective function. To show the progress of evolution, we used IGD (Inverted Generational Distance) as the evaluation metric.
Conflicts of interest
There are no conflicts to declare.Acknowledgements
Fig. 1 and the table of contents illustrations were created by Xavier Pita, scientific illustrator at King Abdullah University of Science and Technology (KAUST). The research reported in this publication was supported by funding from KAUST.References
- G. Szekely and A. Livingston, Sustainable Nanoscale Engineering, Elsevier, 2020 Search PubMed.
- B. Cao, L. A. Adutwum, A. O. Oliynyk, E. J. Luber, B. C. Olsen, A. Mar and J. M. Buriak, ACS Nano, 2018, 12, 7434–7444 CrossRef CAS.
- L. Wei, X. Xu, Gurudayal, J. Bullock and J. W. Ager, Chem. Mater., 2019, 31, 7340–7350 CrossRef CAS.
- J. K. Behera, X. Zhou, A. Ranjan and R. E. Simpson, ACS Appl. Mater. Interfaces, 2018, 10, 15040–15050 CrossRef CAS.
- A. O. Oliynyk and J. M. Buriak, Chem. Mater., 2019, 31, 8243–8247 CrossRef CAS.
- K. T. Butler, D. W. Davies, H. Cartwright, O. Isayev and A. Walsh, Nature, 2018, 559, 547–555 CrossRef CAS.
- M. Kim, B. C. Yeo, Y. Park, H. M. Lee, S. S. Han and D. Kim, Chem. Mater., 2020, 32, 709–720 CrossRef CAS.
- L. Rivers III, Nat. Sustain., 2018, 1, 537–537 CrossRef.
- M. Hino, E. Benami and N. Brooks, Nat. Sustain., 2018, 1, 583–588 CrossRef.
- G. Borboudakis, T. Stergiannakos, M. Frysali, E. Klontzas, I. Tsamardinos and G. E. Froudakis, npj Comput. Mater., 2017, 3, 1–7 CrossRef CAS.
- P. Z. Moghadam, S. M. J. Rogge, A. Li, C.-M. Chow, J. Wieme, N. Moharrami, M. Aragones-Anglada, G. Conduit, D. A. Gomez-Gualdron, V. Van Speybroeck and D. Fairen-Jimenez, Matter, 2019, 1, 219–234 CrossRef.
- H. Furukawa, K. E. Cordova, M. O'Keeffe and O. M. Yaghi, Science, 2013, 341, 230444 Search PubMed.
- S. Kaskel, The Chemistry of Metal–Organic Frameworks, John Wiley & Sons, Ltd, 1st edn., 2016 Search PubMed.
- S. Yuan, L. Feng, K. Wang, J. Pang, M. Bosch, C. Lollar, Y. Sun, J. Qin, X. Yang, P. Zhang, Q. Wang, L. Zou, Y. Zhang, L. Zhang, Y. Fang, J. Li and H.-C. Zhou, Adv. Mater., 2018, 30, 1704303 CrossRef.
- E.-S. M. El-Sayed and D. Yuan, Green Chem., 2020, 22, 4082–4104 RSC.
- P. A. Julien, C. Mottillo and T. Friščić, Green Chem., 2017, 19, 2729–2747 RSC.
- E. R. Engel and J. L. Scott, Green Chem., 2020, 22, 3693–3715 RSC.
- G. Schukraft and C. Petit, in Sustainable Nanoscale Engineering, ed. G. Szekely and A. Livingston, Elsevier, 2020, pp. 139–162 Search PubMed.
- B. Chen, Z. Yang, Y. Zhu and Y. Xia, J. Mater. Chem. A, 2014, 2, 16811–16831 RSC.
- C. L. Hobday, C. H. Woodall, M. J. Lennox, M. Frost, K. Kamenev, T. Düren, C. A. Morrison and S. A. Moggach, Nat. Commun., 2018, 9, 1429 CrossRef.
- D. Fairen-Jimenez, S. A. Moggach, M. T. Wharmby, P. A. Wright, S. Parsons and T. Düren, J. Am. Chem. Soc., 2011, 133, 8900–8902 CrossRef CAS.
- B. A. Frontana-Uribe, R. D. Little, J. G. Ibanez, A. Palma and R. Vasquez-Medrano, Green Chem., 2010, 12, 2099–2119 RSC.
- Y. Yuan and A. Lei, Nat. Commun., 2020, 11, 802 CrossRef CAS.
- A. M. Joaristi, J. Juan-Alcañiz, P. Serra-Crespo, F. Kapteijn and J. Gascon, Cryst. Growth Des., 2012, 12, 3489–3498 CrossRef.
- D. Zhao, P. K. Thallapally, C. Petit and J. Gascon, ACS Sustainable Chem. Eng., 2019, 7, 7997–7998 CrossRef CAS.
- B. C. Gibb, Nat. Chem., 2019, 11, 963–965 CrossRef CAS.
- D. Câmara, in Bio-inspired Networking, ed. D. Câmara, Elsevier, 2015, pp. 1–30 Search PubMed.
- T. Ghosh and K. Martinsen, Eng. Sci. Technol. Int. J., 2020, 23(3), 650–663 Search PubMed.
- E. F. Baxter, T. D. Bennett, A. B. Cairns, N. J. Brownbill, A. L. Goodwin, D. A. Keen, P. A. Chater, F. Blanc and A. K. Cheetham, Dalton Trans., 2016, 45, 4258–4268 RSC.
- T. D. Bennett, J. Sotelo, J.-C. Tan and S. A. Moggach, CrystEngComm, 2015, 17, 286–289 RSC.
- V. Guillerm, F. Ragon, M. Dan-Hardi, T. Devic, M. Vishnuvarthan, B. Campo, A. Vimont, G. Clet, Q. Yang, G. Maurin, G. Férey, A. Vittadini, S. Gross and C. Serre, Angew. Chem., 2012, 124, 9401–9405 CrossRef.
- R. A. Sheldon, Green Chem., 2017, 19, 18–43 RSC.
- B. Rugani, I. Vázquez-Rowe, G. Benedetto and E. Benetto, J. Cleaner Prod., 2013, 54, 61–77 CrossRef.
- T. Fodi, C. Didaskalou, J. Kupai, G. T. Balogh, P. Huszthy and G. Szekely, ChemSusChem, 2017, 10, 3435–3444 CrossRef CAS.
Footnote |
| † Electronic supplementary information (ESI) available: For detailed experimental design, calculations, data analysis, structure and morphology analysis. See DOI: 10.1039/d0gc02956d |
| This journal is © The Royal Society of Chemistry 2020 |