 Open Access Article
Properties and activity of Zn–Ta-TUD-1 in the Lebedev process†
Guillaume
Pomalaza
a,
Pardis
Simon
a,
Ahmed
Addad
b,
Mickaël
Capron
a and
Franck
Dumeignil
 *a
*a
aUniv. Lille, CNRS, Centrale Lille, Univ. Artois, UMR 8181 – UCCS – Unité de Catalyse et Chimie du Solide, F-59000 Lille, France. E-mail: franck.dumeignil@univ-lille.fr
bUniv. Lille, CNRS, UMR 8207 – UMET, F-59000 Lille, France
First published on 27th March 2020
Abstract
A zinc and tantalum-containing mesoporous silica catalyst highly active and selective in the Lebedev process has been prepared using the one-pot TUD-1 methodology. Selectivity towards butadiene reached 60–70%, making Zn–Ta-TUD-1 one of the best performing catalysts in the literature. To rationalize these results and establish a structure–activity relationship, a series of similar catalysts was prepared and characterized. Nitrogen physisorption, XPS, ICP-AES, XRD, TEM, UV-vis spectroscopy, TGA NH3-TPD, H2-TPR and FT-IR techniques were used. The most active samples were found to possess a large specific surface area and highly dispersed metal oxide phase incorporated within the mesoporous silica matrix. In combination with catalytic testing, characterization also showed a direct correlation between the number of Lewis acid sites and butadiene yield, confirming the structure–activity relationship theory prevalent for the Lebedev process. Deactivation of Zn–Ta-TUD-1 was also studied using the same techniques to characterize the properties of spent catalysts. It was found that the accumulation of heavy carbonaceous species caused a reduction of specific surface area and pore size coinciding with the observed loss in activity. Nevertheless, the pores of TUD-1 were large enough to avoid total pore blockage and a high selectivity could be maintained for 72 hours.
1. Introduction
Catalytic conversion of ethanol to value-added chemicals is a promising alternative to fossil-based processes. Because of the availability of ethanol, which is produced in the 100 s of billions of liters yearly via the fermentation of biomass, it is an attractive renewable feedstock.1,2 Owing to its convertibility into a wide range of chemical commodities,3 ethanol is expected to play an increasing role in replacing unsustainable hydrocarbon feedstocks.4 Sun and Wang, who compiled a list of valuable chemicals obtainable from ethanol, showed that the development of catalytic processes is essential for making ethanol a viable alternative to fossil feedstocks.3The Lebedev process, the conversion of ethanol to butadiene,5,6 has attracted attention as an on-purpose technology for producing the world's most important conjugated diene in an environmentally sound fashion. Butadiene, which is essential to the automotive industry as the main feedstock for manufacturing the synthetic rubber used in tires,7 predominantly comes from the steam cracking of naphtha.8 However, this method was found unsustainable ecologically9 and economically,10 in part due to recent trends in the cracking feedstock.11,12 This situation has spurred interest into the Lebedev process, which produces butadiene from gaseous ethanol via a catalytic reaction. In fact, it was an important source of butadiene in the first half of the last century.5 However, to compete financially with fossil-based routes, the Lebedev process must overcome performance limitations.13,14
Limitations to the Lebedev process are comparable to that of other ethanol conversion reactions.2,3 At relevant reaction conditions, the high reactivity of ethanol not only forms the desired butadiene and the intermediate species, but also to large numbers of undesirable byproducts, including coke precursors responsible for catalytic deactivation.14,15 In addition, low butadiene productivity could hinder the economic viability of the process,13 but attaining high butadiene space–time yield by increasing the ethanol flow rate was found to coincide with lower selectivity.16 Catalyst design can help overcoming these limitations by improving performances in the Lebedev process. However, this requires a better understanding of the structure–activity relationship so that new materials are tailored for optimal catalytic activity.5
It is generally recognized that the ethanol-to-butadiene reaction mechanism depicted in Fig. 1 requires a multi-functional catalyst.5,6 However, the relationship between the performances of catalysts and their properties remain under debate.17–19 Although much insight has been acquired in the recent years, the rational design of catalysts for optimal performances in terms of butadiene productivity, selectivity and stability.
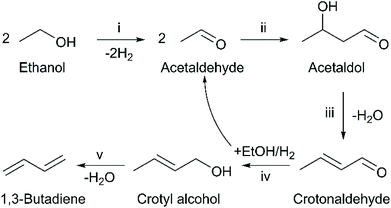 | ||
| Fig. 1 Toussaint–Kagan mechanism for the conversion of ethanol to 1,3-butadiene. Reaction steps: (i) Ethanol dehydrogenation; (ii) self-aldol condensation; (iii) dehydration of acetaldol; (iv) Meerwin–Ponndorf–Verley–Oppenaur (MPVO) reaction; (v) dehydration of crotyl alcohol.5 | ||
Much attention has focused on the role of Lewis acid sites, also known as Lewis acid–base pairs, which have been proposed to catalyze the condensation of acetaldehyde to C4 intermediates that lead butadiene, depicted in step (ii) of Fig. 1.20,21 Ivanova et al. established a direct correlation between the relative number of “open” Zr(IV) sites and initial butadiene formation using a supported silver-zirconium catalyst.20,22,23 Since acetaldehyde condensation is often recognized as the rate-determining step,20,24,25 their observation strongly supports the involvement of Lewis acid–base pairs in the reaction. Kyriienko et al. also reported a direct relationship between butadiene productivity and the relative amount of Lewis acid sites probed by CDCl3 on Cu-doped Zr-containing zeolites.26 Similar correlations have yet to be established on other materials, but there is strong evidence that Lewis acidity plays a role in other catalytic systems.27
Another crucial component of catalysts active in the Lebedev process is their ability to convert ethanol to acetaldehyde.28 Several dehydrogenation promoters have been tested and their activity investigated: Ivanova et al. proposed a mechanism for dehydrogenation on silica-supported metallic silver;20,29 Dagle et al. found silver particle size to be a crucial parameter;30 Angelici et al. and Taifan et al. researched the activity and deactivation of copper on MgO-SiO2;14,31,32 Kyriienko et al. compared the promoter effect of Ag, Zn and Cu on Ta-containing zeolites, identifying the latter as better suited for the Lebedev process.33 Because the results of mechanistic studies differ from one promoter to another, it is likely that different mechanisms leading to acetaldehyde can take place depending on the catalytic system.
Neglected for long, the topic of deactivation has been the subject of recent articles, providing new information useful for preparing catalysts with improved stability. Many authors argue that coke deposition on the catalyst surface results in loss of activity.24,34,35 Accordingly, highly active acidic or basic sites are responsible for the formation polyaromatic carbonaceous species that, once deposited at the surface of the catalyst, block the access to active sites. Alternatively, Li et al. suggested that relatively lighter oxygenated cyclic species formed by the condensation of aldehydes poison the sites responsible for butadiene formation.15 Sintering and changes in the active phase oxidation state have also been proposed.31,32,36 As Taifan et al. proved,32 the deactivation mechanism depends on the type of catalyst used. Hence, the individual study of catalytic systems appears necessary.
In a previous issue of this journal, we published a short communication on our early findings concerning a zinc–tantalum catalyst introduced into TUD-1 mesoporous silica; it exhibited unprecedented activity and stability in the Lebedev process compared to the literature.37 The performances of Zn–Ta-TUD-1 were compared with those of equivalent catalysts supported on dealuminated zeolite β and commercial silica, with TUD-1 found to be the best carrier to reach high activity with the Zn–Ta couple. Better suited morphological properties and the TUD-1 synthesis process were seen as potential contributors to catalytic activity. In addition, a correlation between the number of acid sites probed by NH3 and butadiene productivity of each catalyst tested was established, suggesting the involvement of acid sites in the reactions.17,22 More than a highly active catalyst, Zn–Ta-TUD-1 has the advantage of using an environmentally benign synthesis. Contrarily to other structure-directing agents used for preparing mesoporous materials, the agents used in TUD-1 synthesis—either triethanolamine or tetraethylene glycol—are non-toxic and biodegradable.38
The present work gives a detailed study of the Zn–Ta-TUD-1 catalytic system and its activity in the Lebedev process, unravelling fundamental aspects of the reaction by studying the relationship between the chemical properties of this catalytic system and its performances. Various techniques were employed to characterize the catalyst: N2 physisorption, inductively coupled plasma atomic emission spectroscopy, X-ray powder diffraction, X-ray photoelectron spectroscopy, UV-Vis diffuse reflectance spectroscopy, infrared spectroscopy techniques, transmission electronic microscopy and temperature-programmed experiments. The as-obtained results confirmed the existence of Zn–Ta-TUD-1 as a mesoporous material with highly dispersed Zn(II) and Ta(V) phases.
A set of catalysts with varying metal loading and synthesis procedure were prepared and compared to investigate the structure–activity relationship. Notably, a direct correlation between the number Lewis acid sites probed by pyridine and the initial butadiene formation rate was established. This is the first account of such a relationship on a non-Zr catalyst in the Lebedev reaction. In addition, deactivation of Zn–Ta-TUD-1 during the Lebedev process was investigated by catalytic testing, surface-sensitive analytic techniques and other characterization methods. Reduction of the active phase was ruled out as a deactivation mechanism. Instead, deposition of carbonaceous species on the pore channels of the catalyst blocking the access to active sites appear to cause the observed loss of activity with time on stream.
2. Experimental
2.1. Catalyst preparation
Zn–Ta-TUD-1 with molar Si/Zn and Si/Ta ratios within 4–100 were synthesized using the procedure detailed in our previous article,37 itself adapted from the TUD-1 methodology.39,40 Briefly, the TUD-1 synthesis process involves the gelation by TEAOH of TEOS dissolved in ethanol with metal precursors complexed by tetraethylene glycol to ensure their dispersion. The resulting gel is dried and treated in a Teflon-lined autoclave at 180 °C, which creates the mesoporous morphology using tetraethylene glycol as a structure-directing agent. The resulting solid is calcined under air flow at 600 °C, ground in a mortar and sieved to 125 μm, affording a white powder. The precursor gel were prepared with the following reagents: optical grade tantalum ethoxide (Alfa Aeser, 99.95%); zinc acetate dehydrate (Acros Organics, 98+%); tetraethylene glycol (or TEG, Agros Organics, 99.5%) was used as complexing agent; tetratethyl orthosilicate, (or TEOS, Agros Organics, 98%) was used silica precursor; tetraethyl ammonium hydroxide (or TEAOH, Aldrich, 35 wt% in water) acted as the alkalizing agent; absolute ethanol (Aldrich, 99.8%) was used as solvent.In total, 5 catalysts labelled ZTT were prepared. To achieve different properties, the synthesis method was modified with regards to the thermal treatment duration and calcination method. Table 1 lists the synthesis details of the ZTT catalysts series. The final gel compositions before thermal treatment were: 1.0 TEOS:x Zn:y Ta:0.5 TEAOH:1.0 TEG, where x and y correspond the loadings listed in Table 1 for the respective gels. As the best performing catalyst resulting for previous synthesis studies,37 ZTT-1 was the main focus of our investigation, and the primary subject of characterization. Other ZTT samples were used for comparative purposes when the need arose.
| Catalyst | Zn loading (mol%) | Ta (mol%) | Treatment time (h) | ||
|---|---|---|---|---|---|
| Gel | Product | Gel | Product | ||
| ZTT-1 | 3.0 | 2.9 | 2 | 1.9 | 24 |
| ZTT-2 | 2 | 2.1 | 1 | 1.1 | 6 |
| ZTT-3 | 2 | 2.3 | 1 | 0.9 | 48 |
| ZTT-4 | 25.2 | 22.2 | 4.2 | 4.9 | 24 |
| ZTT-5 | 6.3 | 8.7 | 4.2 | 4.5 | 24 |
To complete our study, TUD-1 materials containing exclusively Zn or Ta were prepared in the same way with the following loadings: Zn = 3.0 mol% and Ta = 2 mol% in two different materials. Hemimorphite, a zinc silicate, was also synthesized according to the method detailed in the patent of Teles et al.41
2.2. Catalyst characterization
N2 physisorption at −196 °C with a Micrometric Tristar II instrument was used to study the morphological properties of the ZTT series, spent ZTT-1 and monometallic TUD-1 samples. Analysis was performed after outgassing 50–200 mg of powder at 150 °C for 6 hours. The Brunauer–Emmett–Teller (BET) and Barret–Joyner–Halenda (BJH) methods were used to calculate specific surface area (SBET) as well as pore diameter (Dp) distribution and pore volume (Pvol).Elemental analysis of the as-synthesized ZTT samples was performed using inductively coupled plasma atomic emission spectroscopy (ICP-AES). 50 mg of catalyst were dissolved in a heated mixture of HF, HNO3 and H3BO3 prior to analysis.
Catalysts were analysed with X-ray powder diffraction (XRD) using a Brüker D8 apparatus using Cu-Kα1 a source (λ = 1.5406 Å). A step of 0.02° with an acquisition time of 0.5 s was used.
Thermogravimetric analysis (TGA) and differential scanning calorimetric analysis (DSC) were performed with a TA Instrument SDT-Q600. Experiments proceeded under air flow (100 mL min−1), where spent samples were heated up to 700 °C (10 °C min−1). Pure alumina was used a reference.
X-ray photoelectron spectroscopy (XPS) experiments were carried out using an AXIS Ultra DLD Kratos spectrometer equipped with a monochromatic AlKα radiation (1486.6 eV) operating at 225 W (15 mA, 15 kV). Binding energies were calibrated according to the C 1s core level set at 284.8 eV. Spectra of C 1s, O 1s, Zn 2p, Zn LMM and Ta 4d were analysed using the CasaXPS software.42 Spectra decomposition was performed via mixed Gaussian–Lorentzian peak fitting; semiquantitative analysis was performed after a Shirley-type background subtraction.
UV-Vis diffuse reflectance spectra of the as-synthesized catalysts were acquired at room temperature using a Lambda 650 PerkinElmer spectrophotometer equipped with an integrating sphere. Recoding ranged between 200 and 800 nm at a step of 0.2 nm with a slit width of 1 nm. BaSO4 was used as standard. Reflectance spectra were converted using the Kubelka–Munk function f(R) = (1 − R)2/2R.43
Attenuated total reflection infrared (ATR-IR) spectra of the synthesized catalysts were recorded using a Nicolet iS50 FT-IR spectrometer from Thermo-Fisher equipped with an iS50 ATR sampling station. 50 scans over a scanning range of 4000 and 200 cm−1 with a resolution of 2 cm−1 were recorded.
High-resolution transmission electron microscopy (HR-TEM) images were obtained using a TECNAI electron microscope operating at 200 kV. Samples were deposited onto holey-carbon copper grids.
High-angle annular darkfield imaging during TEM has been performed on a FEI Titan themis 300, equipped with a Cs probe corrector and a High-efficiency Super-X detector (EDX). At 300 kV in HRSTEM mode it is possible to reach a resolution of 0.7 Å.
Infrared spectra were recorded during pyridine adsorption–desorption experiments using a Nicolet Protege 460 infrared spectrometer fitted with an MCT detector (4 cm−1). Outgassing at 400 °C under vacuum (10−1 mbar) for 1 hour preceded each experiment. Pyridine (Fischer, general purpose grade) adsorption took place at room temperature up to saturation coverage. Desorption under vacuum was performed at 150 °C, 250 °C, 350 °C and 450 °C. IR spectra were acquired before and after every desorption step of the experiment. Acid sites were quantified based on the integrated IR bands using an extinction coefficient found in the literature.44
Acid sites number and strength were evaluated by temperature-programmed desorption using ammonia as a probe (NH3-TPD). The experiments were performed on a Micrometrics Autochem 2920 apparatus equipped with a Pfeiffer mass spectrometer used to monitor NH3 desorption. NH3 was adsorbed over 100 mg of catalyst at room temperature for 30 minutes using a 50 mL min−1 flow of 5% NH3 in He. A ramp of 10 °C min−1 until 900 °C was used to desorb NH3.
Temperature-programmed reduction with hydrogen (H2-TPR) was used to study the reducibility of selected catalysts with a Micromeritics Autochem 2920 coupled with a with a thermal conductivity detector. The samples were heated to 1100 °C (10 °C min−1) while being reduced using a 50 mL min−1 flow of 5% H2 in argon.
2.3. Catalyst, poisoning and stability tests
Catalytic testing was performed with a Multi-R® apparatus from Teamcat Solutions SAS,45 which is a high-throughput device for heterogeneous catalyst screening. Four parallel glass reactors are used simultaneously with the gaseous reactant feed calibrated by a splitter that ensured an equal inlet flow. Reactor outputs were analysed online with an Agilent 7890 A equipped with an FID detector. An independently controlled valve selected the output of each reactor for analysis.Comparison the different catalysts in the ZTT series and monometallic TUD-1 was performed at 350 °C and a pressure of 1 atm. Each sample was ground and sieved to 120 mesh granules. 30 mg of solid were loaded inside the glass reactors and held in place with SiC. He was passed through a bubbler containing ≥99.8% ethanol, set at a pressure and temperature adjusted to afford a gaseous ethanol concentration of 4.5% according to the Antoine's law, which was fed into the reactors. Weighted hourly space velocity of ethanol (WHSVEtOH) was adjusted to 5.3 h−1 by tuning the inlet flow rate and catalyst mass.
Catalytic deactivation tests were performed at 400 °C at a WHSVEtOH of 5.3 h−1 with ZTT-1 using the Multi-R® apparatus. Rather than interrupting the reaction to sample the spent catalyst for analysis, 5 reactions were scheduled and conducted in parallel to provide catalysts with 1.5, 6, 24, 48 and 72 hours spent on stream. Samples were kept in a sealed N2 atmosphere until characterization.
A pyridine poison study was conducted in a steady-state fixed bed glass reactor at 350 °C. Ethanol was fed by pumping absolute ethanol with an HPLC pump into a vaporizer maintained at 200 °C, into which 30 mL min−1 of He was flown and fed to the reactor, affording a WHSVEtOH of 0.3 h−1. After 1 hour on stream, the feed was switched to an ethanol-pyridine mixture containing 5 mol% of pyridine (Fisher, 99%); the reactor lines were kept above 125 °C to avoid condensation. After 1 hour of pyridine co-feeding, the feed was returned to pure ethanol. The reactor output was monitored with an online GC-FID throughout the experiment.
Ethanol conversion (X, %), the selectivity towards each product (Si, %), the molar yield of each product (Yi, %) and the molar productivity of butadiene (PBD, mmolBD gcat−1 h−1)—eqn (1), (2), (3) and (4) respectively—were used to describe catalytic activity, where ci represents the number of carbon moles measured for a given compound i. When initial values are concerned, such as the initial butadiene productivity, they represent the value obtained by extrapolating to zero the data obtained over time on stream. The carbon balance (CB) for each test was calculated by dividing the sum of carbon moles detected with the molar amount of carbon introduced as ethanol and found to range between 95–105%.
 | (1) |
 | (2) |
| Yi = X × Si | (3) |
| PBD = X × SBD × WHSVEtOH × 0.1087 | (4) |
3. Results and discussion
3.1. Structural properties
N2 physisorption of ZTT-1, 2 and 3 showed Type IV physisorption isotherm with an H2 type hysteresis loop indicative of their mesoporous morphology (Fig. S1†);46 the nitrogen intake plateau above 0.9P/P0 further suggested an absence of macropores.47 ZTT-4 and 5 with high metal loading instead showed nitrogen adsorption beyond 0.9P/P0 with H1 hysteresis loop, implying the presence of macropores and a different mesoporous morphology (Fig. S1†).47 At high metal loadings (10–60 wt%), M-TUD-1 materials are known to possess extra-framework metal nanoparticles that typically reduce pore size by obstruction.47,48The morphological characteristics of Zn–Ta-TUD-1 evaluated with the BET and BJH methods are listed in Table 2. ZTT-1 possessed a large specific surface area of 658 m2 g−1, a porous volume of 2.45 cm3 g−1 and a mesopore diameter averaging 11.9 nm; as illustrated in Fig. S2,† pore size distribution was narrow. Comparatively, ZTT-2 exhibited a larger surface area, but smaller pores due to the shorter thermal treatment time; the longer treatment duration of ZTT-3 resulted in the opposite effect.40 At higher metal loading, ZTT-4 and ZTT-5, the treatment time had similar effect on the morphological properties, but porous volume was overall smaller, possibly due to the formation of mentioned extra-framework particles.
The presence and amounts of Zn and Ta into the series of ZTT catalysts were confirmed and evaluated by ICP-AES (Table 1). As evidenced by the observed metal loadings, the TUD-1 synthesis method efficiently introduced the desired amount of active phase at metal loading below 5.0 mol%. At higher loadings, e.g., 27.2 and 13.3 mol% for ZTT-4 and 5, respectively, metal content deviated significantly from the target values. The TUD-1 preparation method is known, depending on the type of metal and method used, to have loading limits beyond which incorporation is less successful.40
XPS was used to determine the oxidation state of Zn and Ta in ZTT-1; the results obtained are depicted in Fig. 2. The two peaks of Fig. 2(a) at 1046.0 eV and 1022.8 eV in the Zn 2p1/2 and 2p3/2 range suggested the presence of Zn(II), as the binding energy (BE) of the latter peak was close to the expected value for oxidized zinc compounds, which lies between 1022.1–1022.7 eV.49,50 However, distinguishing Zn(II) from its metallic form is ambiguous due to the small BE difference (<1 eV) between the two states. The 2+ oxidation state was confirmed by inspecting the X-ray induced Zn L3M4,5M4,5Auger peak, for the larger kinetic energy (KE) shift that separates Zn(II) from its metal form allowed a clear identification. As can be seen in Fig. 2, the Auger electron peak of Zn had a value of 986.3 eV, lower than expected >990.0 eV of metallic Zn, and lacked the distinctive double-peak shape of the latter.51
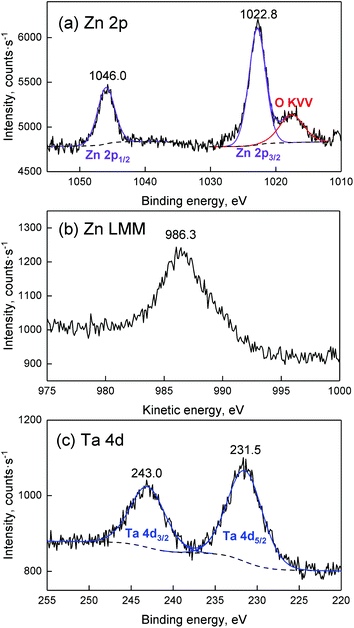 | ||
Fig. 2 XPS spectra of ZTT-1 for (a) Zn 2p, (b) Zn L3M4,5M4,5![[thin space (1/6-em)]](https://www.rsc.org/images/entities/char_2009.gif) 52 Auger peak and (c) Ta 4d regions. 52 Auger peak and (c) Ta 4d regions. | ||
The chemical environment of Zn was further investigated using the modified Auger parameter. Shifts in this parameter—defined as the sum of the KE of an Auger transition involving electrons from a core level and the corresponding binding energy—can be used to monitor changes in the chemical environment of a given element. The KE of the Zn L3M4,5M4,5 Auger electron and the BE of the Zn 2p3/2 peak of ZTT-1 were used to compute a modified Auger parameter of 2009.1 eV. A Wagner plot, which provides rapid visualization of the modified Auger parameter by plotting the Auger electron KE in function of the photoelectron BE, is illustrated in Fig. 3 and compares the chemical environment of Zn in ZTT-1 to other Zn samples available in the NIST database. As can be seen, the modified Auger parameter of Zn in the TUD-1 material is different from that of metallic Zn, but also of ZnO. Instead, the Wagner plot indicates that the chemical environment of Zn in ZTT-1 is closer to that of natural zinc minerals, such as of zinc silicates, notably of hemimorphite supported on SiO2, or Zn(OH)2,53,54 suggesting it is incorporated within the silica matrix of ZTT-1, rather than as extra-framework oxide particles that may form during the TUD-1 synthesis.
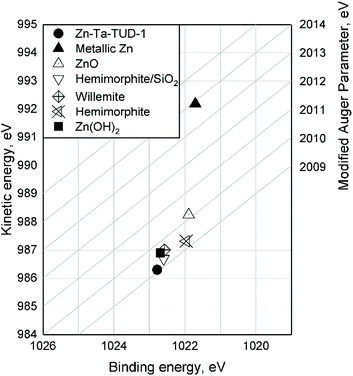 | ||
| Fig. 3 Wagner plot for Zn compounds comparing Zn–Ta-TUD-1 to those found in the literature.53,54 | ||
Regarding the Ta 4d core level (Fig. 2(d)), the doublet peak shown correspond to Ta 4d5/2 and 4d3/2 contributions. The Ta 4d5/2 BE (243.0 eV) is consistent with that of Ta2O5,55 suggesting the presence of Ta(V) in ZTT-1. Contrarily to recent publications on similar materials,33,56 analysis and quantification of Ta was not performed with Ta 4f peak to avoid the interference by prominent O 2s signals due to the SiO2 matrix.
The Kerkhof–Moulijn (K–M) model was employed to study the dispersion state of Zn(II) and Ta(V) of the entire ZTT series by analyzing the XPS results.57–59 The K–M model predicts the XPS relative intensity of a homogeneously supported phase, e.g., the “promoters”, and its catalyst carrier according to eqn (5):
 | (5) |
 | (6) |
Fig. 4 represents the experimental XPS intensity ratios (a) Zn/Si and (b) Ta/Si as a function of the bulk ratio determined by ICP-AES; the experimental points are compared to the red lines representing the theoretical intensity ratio predicted by the K–M model corresponding to the monolayer limit where (1 − e−α1)/α1 = 1, that is to say the maximum dispersion of the supported phase that can be measured with the XPS technique. It should be noted that the monolayer limit implies only the monolayer thickness of the promoter phase, not its monatomic dispersion. According to León,58 monatomic and monolayered clusters give the same effect in the model. Experimental XPS intensities below the monolayer limit indicate that the promoter phase exists in three-dimensional particles heterogeneously dispersed on the surface of the support.57 In addition, data points further below the theoretical line are indicative of particles with relatively larger diameter.
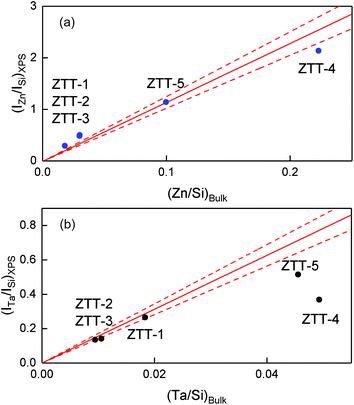 | ||
| Fig. 4 Comparison between the experimental and calculated intensity ratios of (a) Zn/Si and (b) Ta/Si versus the bulk ratios according to the model of Kerkhof and Moulijn.57 The dashed red lines represent a 10% error on the calculated value. | ||
Fig. 4(a) shows that only ZTT-4, with a 22.3% atomic loading of Zn, was below the monolayer limit, indicating that three-dimensional ZnO particles were formed. Concerning ZTT-1 and the other catalysts of the ZTT-series, the experimental ratio obtained by XPS was either within or above the monolayer limit for Zn. It is unclear why ratios over the maximum dispersion prediction were obtained. We suggest the similitude between the photo-emitted electron escape path of Zn and the thickness of SiO2 layers to be the source of this discrepancy, as it implies that not all the emitted Zn electrons could be seen by XPS. Nevertheless, the absence of extra-framework ZnO particles as shown by UV-Vis spectroscopy (vide infra) suggests that Zn(II) in ZTT-1 is very highly dispersed.
In the case of Ta(V), Fig. 4(b) shows that ZTT-1, 2 and 3, with total atomic content of Ta below 2% were within the monolayer limit of the K–M, indicative of their homogeneous dispersion. Interestingly, the case of ZTT-4 denotes how, in bimetallic TUD-1 catalyst, the detrimental effect of high metal loading on dispersion is not self-contained to each individual metal: the larger Zn content resulted in a greater deviation of the Ta(V) points from the K–M model compared to ZTT-5 despite having similar Ta mol.% loading—4.6 and 4.9%, respectively. Optimization of α1—the dimensionless particle size parameter—indicates that the effective particle size of the latter two is 3.3 and 0.9 nm, respectively. This observation further confirms that the TUD-1 synthesis method fails to achieve a homogeneous dispersion at higher metal loadings.40
XRD patterns of as-prepared ZTT catalysts showed a broad peak at 2θ around 25°, typical of amorphous silica (Fig. S3†). Moreover, the diffractogram suggested the absence of crystalline ZnO or Ta2O5 particles, even at higher metal loadings. This suggests that the metal oxides are either poorly crystalized and/or highly dispersed in the silica phase.
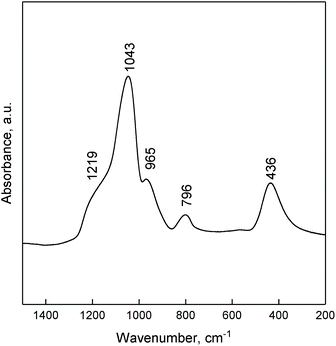
The ATR FTIR spectra of ZTT-1 (Fig. 5) showed the signals typical of silica can be found in the 1500–200 cm−1 region: bands at 1043 and 1219 cm−1 are due to the asymmetric stretching vibrations of Si–O–Si; symmetric stretching vibration of Si–O–Si results in the band at 796 cm−1; the band at 436 cm−1 is owed to O–Si–O bending vibrations. The absorption at 965 cm−1 could be generated by the stretching vibrations of Si–O–M62,63 and/or terminal silanol groups.
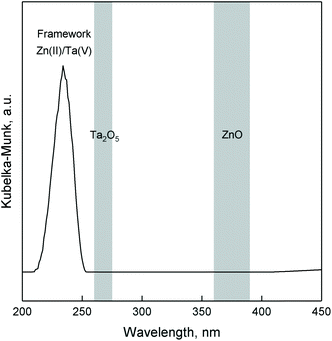
DRS UV-Vis analysis was used to verify the incorporation of Zn(II) and Ta(V) within the mesoporous silica framework. Fig. 6 represents the UV-Vis spectra of ZTT, which is characterized by an intense band cantered at 233 nm. According to the literature, such a signal can be attributed to the charge transfer between silica lattice oxygen and transition metals, notably tetrahedral TaO4 species dispersed on silica,64,65 as well as tetrahedral Zn(II) incorporated within silicates.66–68 This suggestions is supported by the similar presence of an intense band in the same UV region for monometallic Zn3%-TUD-1 and Ta2%-TUD-1 materials (Fig. S4†). The sharp band at 216–221 nm indicative of monoatomic Ta(V)33,69–71 or Zn(II)33 in silicates was not observed, but could be hidden in the shoulder of the main signal. These results suggest that tantalum and zinc exist in Zn–Ta-TUD-1 as single-atom sites or small oxide domains contained within the mesoporous silica framework, likely in their tetrahedral form. Bandgap transitions typical of ZnO and Ta2O5 at 360–390 nm72–74 and 260–275 nm,21,56,65 respectively were absent excluding their presence in the bulk form.
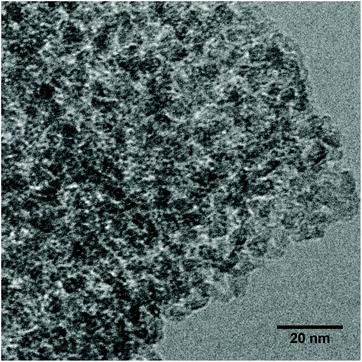
HR-TEM of ZTT-1 depicted in Fig. 7 confirmed the sponge-like mesoporous morphology expected of TUD-1 materials.40 Moreover, no oxide particles could be detected, further confirming homogeneous incorporation of Zn(II) and Ta(V) inside the catalyst carrier of ZTT-1.
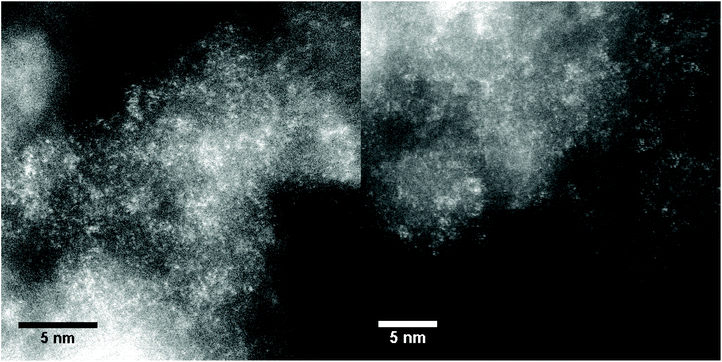
HAADF-STEM was used to further investigate the structure of metals inside Zn–Ta-TUD-1. As illustrated in Fig. 8, ZTT-1 consisted of mononuclear metal sites and small polymeric oxide clusters around 1 nm in diameter. These were attributed exclusively to Ta(V) as the Z contrast between Si and Zn was too low to clearly identify the structure of Zn(II) within the mesoporous silica. Nevertheless, STEM-EDX mapping (Fig. 9) confirmed the presence of Zn(II) and its strong degree of proximity with the Ta(V) phase.
Based on the combined characterization results, we can then describe the structure of our best-performing Zn–Ta-TUD-1 catalysts. The mesoporous sponge-like morphology typical of TUD-1 materials was confirmed by HR-TEM. N2 physisorption further provided the dimensions of pore diameter and specific surface; uniform pores between 6–20 nm were obtained together with high specific areas larger than 390 m2 g−1, even reaching 658 m2 g−1 for the best performing catalyst. IR spectroscopy showed signals typical of silica materials interacting with a metal oxide phase, in this case Zn and Ta. Oxidation states of Zn(II) and Ta(V) were determined by XPS analysis. XPS further revealed that below 5.0 mol% of metal, Zn–Ta-TUD-1 catalysts were homogeneously dispersed over the silica surface in the form of metal oxides with the Kerkhof–Moulijn model. HAADF-STEM indicated that Ta(V) in ZTT-1 existed in the form of mononuclear sites, along with polymeric oxide clusters no greater than 1 nm in diameter. UV-vis showed Ta(V) to be incorporated within the silica matrix with a band at 233 nm. According to the literature, such signal belongs to tetrahedral TaO4 sites, as octahedral species were not detected.65 The exact coordination of Zn(II) could not be determined, but UV-vis analysis found zinc oxide to be incorporated within the carrier matrix. The modified Auger parameter further supported this conclusion, as the chemical environment of Zn was closer to that of zinc silicates than bulk ZnO. Both phases were found to be in close proximity with one another by EDX mapping.
3.2. Chemical properties
The surface acid properties of ZTT samples were evaluated using pyridine chemisorption monitored by IR spectroscopy. Fig. 10(a) depicts the results for the ZTT-1 sample at different desorption temperature. The bands detected at 1611, 1578 and 1454 cm−1 are attributable to pyridine coordinatively bound on metal cations, e.g., Lewis acid sites (LAS).44,75 No signal at 1545 and 1638 cm−1 attributable to pyridinium ions formed on Brønsted acid sites (BAS) were observed. However, their presence on the surface of Zn–Ta-TUD-1 cannot be excluded, as weak BAS have been detected using stronger basic probes on catalysts highly active in the Lebedev process.23,33 Bands located at 1490 cm−1 can be attributed to both LAS and BAS. The progressive desorption of pyridine with increased temperatures entails the existence of LAS with different strengths on the surface of ZTT-1. Our results are similar to those observed with pyridine over silicate-supported transition metals active in the Lebedev process, including the related Zn–Ta-SiBEA catalyst prepared by Kyriienko et al.33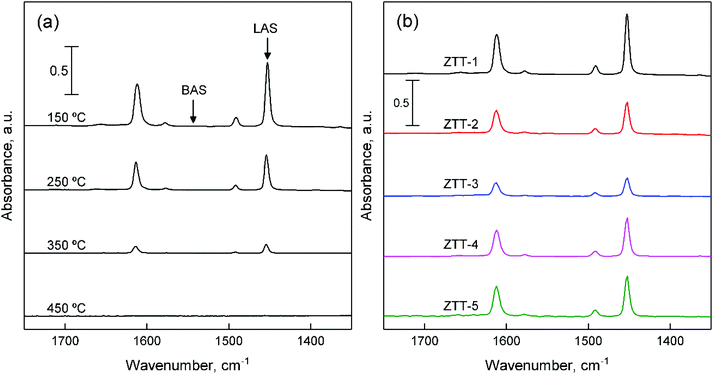 | ||
| Fig. 10 FTIR spectra of chemisorbed pyridine: (a) on ZTT-1 sample at different temperature; (b) on samples of the ZTT series for comparison. | ||
As Fig. 10(b) illustrates, the ZTT series also showed an absence of signal attributable to BAS. However, the intensity of the bands present differed, implying different amounts of LAS. Their quantification was performed using the Beer–Lambert law (eqn (7)):
 | (7) |
| Catalyst | LAS (mmol g−1) | Zn (mol%) | Ta (mol%) |
|---|---|---|---|
| ZTT-1 | 0.276 | 3.1 | 1.9 |
| ZTT-2 | 0.153 | 2.1 | 1.1 |
| ZTT-3 | 0.101 | 2.3 | 1.0 |
| ZTT-4 | 0.163 | 22.3 | 4.9 |
| ZTT-5 | 0.199 | 8.8 | 4.6 |
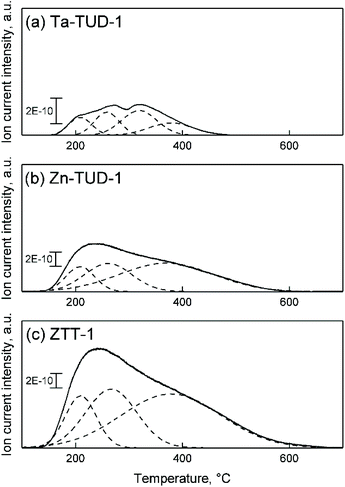
Using NH3-TPD, the acid strength distribution of ZTT-1 was studied and compared to that of Zn3%-TUD-1 and Ta2%-TUD-1. As we previously reported, Zn–Ta-TUD-1 showed a single broad and asymmetric desorption peak indicative of a somewhat heterogeneous acid strength distribution (Fig. 11(c)). Similar experiments on other bimetallic catalysts, e.g., Zn–Zr/SiO2 and MgO-SiO2, for the ethanol-to-butadiene reaction have shown comparable results,77,78 although some authors were able to clearly identify acid sites of distinct strengths on other materials.28,79 Gaussian decomposition of the NH3-TPD profiles, although purely a mathematical tool, showed at least three hidden peaks centred at different temperatures, denoting the heterogeneous strength distribution, which can be classified as weak, medium and strong.80 When contrasted with monometallic samples, the desorption profile of ZTT-1 more closely resembled that of Zn-TUD-1 (Fig. 11(b)), revealing almost identical “hidden” peaks. Ta-TUD-1 showed more discernible peaks with similar desorption temperatures, except for a second medium-strength acid site centred at 320 °C absent on ZTT-1 (Fig. 11(a)).
Nevertheless, comparing the sum of surface acid sites numbers on each monometallic sample suggested both Zn(II) and Ta(V) contributed to the acid properties of ZTT-1 (Table 4). Interestingly, we did not observe the passivation of stronger acid sites caused by the presence of Zn as reported by other scholars on Zn–Hf and Zn–Zr catalysts.28,36,81 Instead, the Zn-TUD-1 possessed more strong sites than Ta-TUD-1. The significantly different preparation methods used may explain this discrepancy, as other works have generally added Zn subsequently. It should be noted that the dissimilar number of acid sites quantified by NH3-TPD and pyridine-FTIR is not an uncommon observation, and the difference in probe size and pKa may account for it.75,82
| Catalyst | Number of acid site (mmol g−1) | ||||
|---|---|---|---|---|---|
| Weak (205 ± 5 °C) | Medium 1 (261 ± 5 °C) | Medium 2 (320 °C) | Strong (382 ± 2 °C) | Total | |
| ZTT-1 | 0.112 | 0.231 | n/a | 0.418 | 0.772 |
| Zn-TUD-1 | 0.068 | 0.134 | n/a | 0.276 | 0.478 |
| Ta-TUD-1 | 0.036 | 0.058 | 0.061 | 0.043 | 0.198 |
The observed LAS can be attributed to the Zn(II) and Ta(V) species, both having demonstrated Lewis characteristics when supported on silicates and studied with pyridine-FTIR analysis.70,83,84 In Zn–Ta-TUD-1, Lewis acidity—the ability to accept a pair of electron—originates from the partial positive charge of the metal cations that comes about when its valence electrons covalently bound with the oxygen atoms of the framework, which becomes a Lewis basic site.85 The resulting Lewis acid–base pairs can participate in a variety of organic reactions by interacting with electron-rich compounds, often via the cooperation between the acid and basic moiety.
Both zinc86–89 and, more rarely, tantalum oxide64 have been described as amphoteric materials. In fact, the necessity of basic or redox sites for converting ethanol first to acetaldehyde before BD has often been highlighted.33,36,90 However, in our previous publication, we reported that CO2-TPD of Zn and Ta-containing catalysts revealed little correlation between the basic properties of our samples and their performances;37 the inadequacy of CO2 for probing sites active in the Lebedev process reported by other scholars may be the cause.77,91
H2-TPR was also used to characterize the properties of catalysts capable of dehydrogenation reactions, as their reducibility can be related to activity.92,93 In accordance with the literature, Ta-TUD-1 did not reduce in a hydrogen atmosphere even at 1100 °C.64
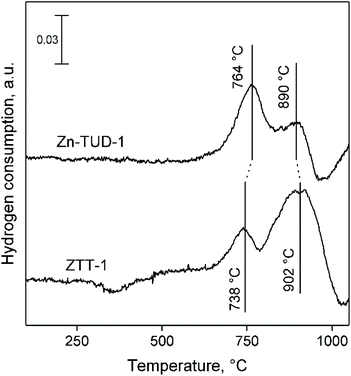
Fig. 12 compares the H2-TPR profiles of Zn-TUD-1 and ZTT-1. In Zn-TUD-1, Zn(II) predominantly reduces at 764 °C, with a secondary signal around 890 °C. With ZTT-1, the presence of Ta(V) significantly lowers the reducibility of Zn(II), the major species now reducing at 902 °C, with a smaller signal at 738 °C.
3.3. Acidity & catalytic activity
To perform the many steps in the conversion of ethanol to butadiene (Fig. 1), catalysts require a combination of chemical properties. As stipulated by Ivanova et al., this is often achieved by combining metal oxides, each possessing part of the desired activity, most notably a dehydrogenation function and a condensation function.90 It is assumed that the necessary dehydration steps are so thermodynamically favoured that the aforementioned active phases suffice.5 In the case of our catalyst, Zn(II) and Ta(V) are the active phases. Zinc oxide, whether as a bulk phase or supported, can dehydrogenate and dehydrate short-chain alcohols.87,88,93 Supported tantalum oxide has long been known to catalyse the conversion of ethanol-acetaldehyde mixtures to butadiene.21,94–96 Consequently, a simple explanation of the Zn–Ta-TUD-1 activity would be that the zinc phase provides the ability to catalyst of forming acetaldehyde from ethanol and the tantalum phase to condense it to precursors of butadiene.37 Catalytic testing combined with characterization was employed to check this hypothesis.The catalytic activity of Zn–Ta-TUD-1 under conditions aimed at maximizing butadiene productivity have formerly been reported.37 As we previously noted, increasing contact time and temperature improves ethanol conversion and butadiene yield. In this work, temperature and ethanol space velocity were controlled allowing a better comparison between the selected catalysts by avoiding total ethanol conversion. At 350 °C and a WHSVEtOH of 5.3 h−1, conversion did not exceed 67%. The performances exhibited by ZTT-1 under these conditions are depicted in Fig. 13. It shows the main products were butadiene, acetaldehyde and ethylene—other compounds such as diethyl ether, propylene and crotonaldehyde accounted for less than 4% of products on a carbon basis. Ethanol conversion and product selectivity remained stable for the duration of catalytic test of 4 hours. Initial conversion and BD selectivity, which were obtained by extrapolation at TOS = 0 h, were 67.0% and 68.1%, respectively. Although the resulting butadiene yield was lower than at 400 °C,37 BD selectivity is comparable to that of other well-performing catalysts found in the literature.5,6
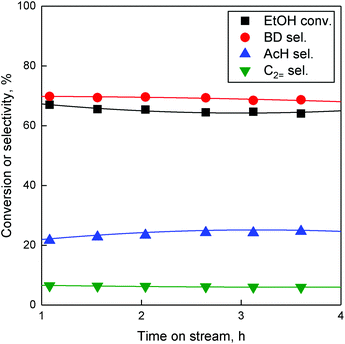 | ||
| Fig. 13 Conversion and selectivity towards major products of ethanol conversion on ZTT-1 over time. T = 350 °C, P = 1 atm, WHSVEtOH = 5.3 h−1. | ||
Catalytic test results for the other samples of the ZTT series are listed in Table 5. Obviously, performances differed from one catalyst to another, notably in terms of butadiene yield. This provided us with the opportunity to establish a relationship between the properties characterized and catalytic activity.
| Catalyst | X EtOH (%) | BD S. (%) | AcH S. (%) | C2 = S. (%) | CB (mol C %) | iBD Prod. (mmol gcat−1 h−1) |
|---|---|---|---|---|---|---|
| X EtOH: ethanol conversion; BD S.: butadiene selectivity; AcH S.: acetaldehyde selectivity; C2 = S.: ethylene selectivity; CB: carbon balance; iBD Prod.: initial butadiene productivity. | ||||||
| ZTT-1 | 67.0 | 68.1 | 21.9 | 6.5 | 96.5 | 26.3 |
| ZTT-2 | 53.6 | 42.8 | 24.6 | 24.1 | 91.5 | 13.2 |
| ZTT-3 | 36.2 | 49.3 | 24.3 | 18.1 | 91.7 | 10.3 |
| ZTT-4 | 40.6 | 50.6 | 40.0 | 7.1 | 97.7 | 11.8 |
| ZTT-5 | 57.3 | 58.8 | 30.5 | 6.5 | 95.8 | 19.4 |
As previously mentioned, Ivanova et al. established a correlation between the relative amount of ‘open’ Lewis acid sites on Zr-containing dealuminated zeolites, and the initial formation rate of BD.17 For the first time, we report a similar correlation on zirconium-free catalyst.
As illustrated in Fig. 14, a linear correlation exists between the number of Lewis acid sites quantified by pyridine-FTIR (Table 3) and the initial productivity of BD (Table 5). The best fit was obtained with the quantification after desorption at 150 °C, suggesting that strong acid sites were not exclusively required, although their rapid deactivation may also explain the lack of fit. The relationship observed suggests Lewis acid sites catalyse the rate-limiting step, which is believed to be the aldol condensation due to the accumulation of acetaldehyde at high WHSVEtOH.20,24,37 To confirm the involvement of the Lewis acid sites probed by pyridine in the conversion of ethanol to butadiene, a poison study was conducted. As shown in Fig. S5,† upon co-feeding pyridine with ethanol at shown at 350 °C, an important decrease in the butadiene yield and increase in acetaldehyde yield was observed. Consequently, the Lewis acid sites poisoned by pyridine are proposed to catalyse the condensation of acetaldehyde to the C4 precursors that ultimately lead to butadiene. This conclusion is in agreement with the experiments conducted with Zr catalysts,17,20,23 as well as the mechanistic studies performed with Ta-containing catalysts using ethanol-acetaldehyde feeds.21
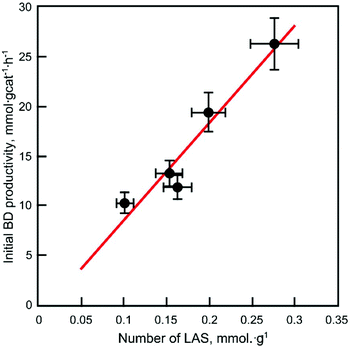 | ||
| Fig. 14 Initial butadiene productivity versus the number of Lewis acid sites on the ZTT series quantified by FTIR after pyridine desorption at 150 °C. | ||
Evidenced by the surface probing with NH3 (Fig. 11), both the Zn(II) and Ta(V) contribute to the to the surface acidity of Zn–Ta-TUD-1, which is predominantly Lewis acidic due the absence of pyridinium IR bands. As a result, it is unlikely that aldol condensation exclusively takes place on Lewis Ta(V) sites, despite its well-established condensation activity.5,21,94,95 In agreement with Li et al.,97 who studied the Lebedev mechanism on Zn–Y/SiBEA, Zn(II) is likely to contribute to the coupling activity of the catalyst. This conclusion is further reinforced by a linear correlation we previously observed between the total number of acid sites probed by NH3 on Zn–Ta catalysts37 and BD selectivity.
3.4. Synergism between Zn & Ta
To test the presumed role of Zn(II) and Ta(V), monometallic TUD-1 materials were tested under reaction conditions comparable to those used with the ZTT series. Table 6 details the catalytic performances of these monometallic samples.| Catalyst | X EtOH (%) | BD S. (%) | AcH S. (%) | C2 = S. (%) |
|---|---|---|---|---|
| X EtOH: ethanol conversion; BD S.: butadiene selectivity; AcH S.: acetaldehyde selectivity; C2 = S.: ethylene selectivity. TOS = 1 h; T = 350 °C; WHSVEtOH = 5.3 h−1. | ||||
| Zn3%-TUD-1 | 20.7 | 0.0 | 34.7 | 31.0 |
| Ta2%-TUD-1 | 24.5 | 0.0 | 2.0 | 45.9 |
| Zn3%-TUD-1+ | 35.1 | 47.5 | 19.8 | 33.6 |
| Ta2%-TUD-1 | ||||
Ta2%-TUD-1 exclusively formed products of ethanol dehydration, e.g., ethylene and diethyl ether. Selectivity towards dehydration products of short-chain alcohol are typical of highly dispersed Ta2O5 supported on silica and associated with primarily acidic properties.64 The absence of dehydrogenation function to produce acetaldehyde explains why the acid sites previously correlated with butadiene productivity are inactive in the Lebedev process. It can be concluded that Ta(V) in TUD-1 exclusively contributes to the condensation reaction when alone.
Zn3%-TUD-1 primarily formed acetaldehyde, highlighting the crucial role of Zn(II) in providing the necessary multi-functionality to the catalyst. However, Zn3%-TUD-1 also displayed a high selectivity towards ethylene that was not observed with ZTT-1. Yet, despite possessing the both acid sites—as evidenced by NH3-TPD—and a redox functionality, no butadiene was detected, suggesting that the acid sites present on Zn3%-TUD-1 do not contribute to the condensation.
The presence of synergism between Zn(II) and Ta(V) was investigated by performing a catalytic test with the mechanical mixture of Zn3%-TUD-1 and Ta2%-TUD-1. This was done so as to create a catalyst that contained both Zn(II) and Ta(V) phases without the close proximity afforded by the TUD-1 preparation method. As can be seen in Table 6, this mixture proved significantly more active in the Lebedev than either monometallic catalyst. The high selectivity towards butadiene observed can be explained by the presence of Ta(V) inside the catalyst. However, the higher selectivity towards ethylene recorded when compared to the performances of ZTT-1 (Table 5), indicate that properties resulting from the mechanical mixing of the two monometallic TUD-1 samples. This suggests that the TUD-1 method produces materials with properties favourable to the Lebedev process: enhanced dehydrogenation and condensation activity, and suppression of dehydration activity.
These favourable conditions may arise from the proximity of the two oxide phases established using STEM-EDX mapping (Fig. 9) that are unlikely to occur through mechanical mixing at room temperature; such a proximity may result in a synergism between the two phases. As illustrated with the NH3-TPD studies, no significant difference in acid strength could be distinguished the monometallic samples and ZTT-1, it can be concluded that this phenomenon does not occur as a passivation of acid sites resulting in lower dehydration activity. Another possibility is may be found in changes induced by the presence of Ta(V) to the chemical state of Zn(II)—this factor is known to influence the activity of Zn.88,93 The change observed in the reducibility of Zn(II) monitored by H2-TPR (Fig. 12) further suggests that the high activity in the Lebedev process of Zn–Ta-TUD-1 and its low selectivity to ethylene lies in changes to the redox properties of Zn(II).
Explaining the superior activity of Zn(II) in presence of Ta(V) is difficult, in part because the parameters that favour alcohol dehydrogenation over dehydration with Zn catalysts are not fully understood. For bulk ZnO, Drouilly et al. attributed its alcohol dehydrogenation activity to the presence of oxygen vacancies.88,98 The structural properties of ZnO were also found to influence its activity with short-chain alcohol.87,93,99 Unfortunately, fewer studies have been conducted regarding the activity of supported zinc oxide in dehydrogenation reactions,100 and none could be found regarding ethanol dehydrogenation.
The work of Perez-Lopez et al. showed that increasing the reducibility of zinc oxide nanoparticles by tuning their synthesis method favored the dehydrogenation of short-chain alcohols over dehydration. Zn(II) reducilibty was also identified as a parameter in the ability of zinc-containing catalysts to dehydrogenate propanol87,99 and propane.92 We suspect that the changes to the redox properties of Zn(II) in presence of Ta(V) evidenced by H2-TPR may explain the superior activity in ethanol dehydrogenation of Zn–Ta-TUD-1 in comparison to Zn-TUD-1.
Judging from the results of the monometallic catalysts Ta(V) contributes to the condensation activity and Zn(II) to the dehydrogenation activity. However, a synergism provided by the TUD-1 synthesis both suppresses ethylene formation and enhances ethanol dehydrogenation, improving the overall performances in the Lebedev process. Clearly, the proximity with the Ta(V) phase is needed to enhance the dehydrogenation activity of Zn(II) and suppress dehydration reactions when incorporated within TUD-1. Most likely, this effect is linked to the redox properties of Zn, not the strength of acid sites. Instead, Lewis acid sites attributable to both the Zn(II) and Ta(V) phases have been found to directly correlate with the initial productivity in butadiene. Maximizing the number of available Lewis acid sites by increasing the active phase dispersion has been identified as a key factor for achieving high performances in the Lebedev process.
3.5. Deactivation
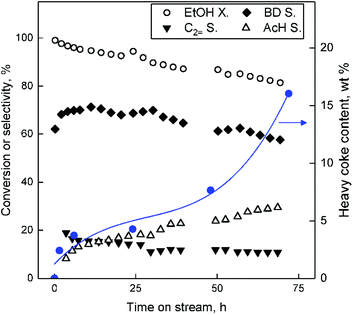
There are strong economic incentives to limit the deactivation that occurs during the Lebedev process.5,101,102 Understanding the deactivation mechanism would assist the design of more resistant catalysts. While recent work has provided precious insights,15,35,36 catalyst deactivation has not been fully understood, in part due to the multiplicity of materials and reaction conditions used.Deactivation of Zn–Ta-TUD-1 was studied by testing ZTT-1 at 400 °C for a period of 70 hours. The higher temperature was used to reflect reaction conditions more suitable for maximizing butadiene productivity. As shown in Fig. 15, ethanol conversion decreased in a linear fashion. Selectivity towards BD initially increased and stabilized for the first 6 hours. Interestingly, it was mirrored by a loss in ethylene selectivity. This phenomenon may be explained by the initial poisoning of acid sites favourable to ethanol dehydration. BD selectivity peaked after six hours on stream and gradually decreased. This decline was compensated by an increase in acetaldehyde selectivity.
Coking has been identify major as source of deactivation during the conversion of ethanol to BD over many different catalysts.19,24,34–36 Moreover, our team previously reported that calcination under air regenerated the catalytic activity of Zn–Ta-TUD-1—a possible sign of deactivation by coking.37,102
Coke deposits occurring in the Lebedev process on ZTT-1 were quantified by the TGA of spent catalysts after 1.5–72 hours on stream at 400 °C. The resulting thermograms (Fig. 16) indicated the accumulation of removable matter with increased reaction time. Deposited substances were classified according the methodology of Liu et al.103 into three temperature regions. Weight loss in region I (T < 180 °C) was assigned to water and volatile species, e.g., reactants, intermediates and products. Region II (180 °C ≤ T ≤ 330 °C) was attributed to the loss of soft cokes—mobile, yet heavier carbonaceous species such as bulkier byproducts. The loss in region III (330 °C ≤ T) corresponded to the combustion of heavy coke compounds, further evidenced by the combined DSC-TGA analysis performed with ZTT-1 after 72 hours, which indicated an exothermal process took place beginning near 330 °C (Fig. S6†). TGA results summarized in Table S1† indicated that soft coke represented <1% weight loss, a proportion which decreased after peaking at 6 h on stream. Heavy coke represented the greater fraction of substances accumulated; its content in ZTT-1 as a function of reaction time was plotted in Fig. 15. As shown, heavy carbon content rapidly increased during the first 6 hours of the reaction, coinciding with the initial stabilization of product selectivity mentioned previously. Beyond six hours, heavy coke content slowly increased as catalyst activity similarly decreased, implying the participation such specie in the deactivation process.
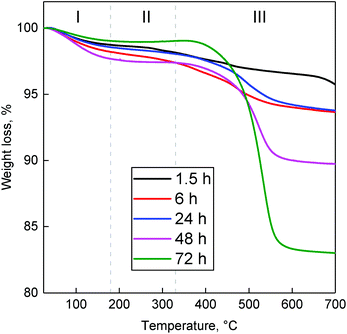 | ||
| Fig. 16 Thermograms of spent ZTT-1 at different TOS in the Lebedev process at 400 °C and WHSVEtOH of 5.3 h−1. | ||
XPS was used to characterize the evolution of the surface of spent ZTT-1 as a function of time on stream. Bibby et al. developed a simple model for studying the coke deposition on catalyst pores using XPS.104 For materials with surface area larger than 200 m2 g−1, the dispersion of carbonaceous species within pore channels was proposed to proceed homogeneously following eqn (8).
 | (8) |
Fig. 17, the resulting plot is compared to the atomic concentration of C and Si on ZTT-1 (TOS of 1.5 to 48 hours) versus TGA, where wt% was considered as the total weight loss accounting for trapped reactants. As illustrated, the model accurately predicted the relative XPS signal of carbon species inside ZTT-1 pore channels—deposition on the outer surface would have resulted in a drastic break-off from the theoretical line. Accordingly, the observations indicated that mesoporous structure of ZTT-1 accommodated the homogeneous deposition of carbonaceous compounds formed during the conversion of ethanol. Total pore blockage can be disregarded a significant source of deactivation up to 48 hours, as no deviation from the theoretical model was observed. N2 porosimetry confirmed that catalytic testing resulted in a reduction in average pore diameter, porous volume and specific surface area (Table 2).
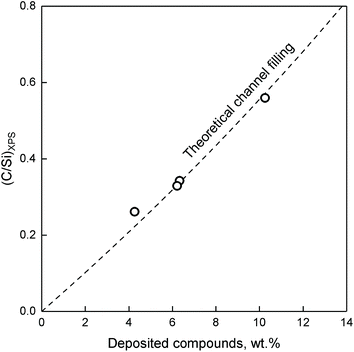 | ||
| Fig. 17 Measured C/Si ratio compared to the weight percent of carbonaceous species on spent ZTT-1 catalyst. The dashed line represents the C/Si function calculated assuming internal coke filling from a solid solution of carbon in SiO2.104 | ||
Recently, Villanueva Perales et al. proposed that the deactivation of their silica-supported hafnium-containing catalyst was owed to the in situ reduction of Zn(II) sites containing within hemimorphite—a zinc silicate used to promote ethanol dehydrogenation.36 To verify whether this phenomenon took place with Zn–Ta-TUD-1, the Zn LMM Auger line of spent ZTT-1 sample was analysed. Although the ethanol atmosphere of the Lebedev process can reduce metal oxides,31,105Fig. 18 depicts how the oxidation state of Zn(II) in ZTT-1 was unaffected after several hours on stream. As expected, neither was Ta(V) (not shown). Consequently, we conclude that in situ reduction of the active phase is not a source of deactivation in Zn–Ta-TUD-1. Ostensibly, the low reducibility of Zn(II) in the presence of Ta(V) which was observed with H2-TPR increased the resistance to deactivation of Zn–Ta-TUD-1.
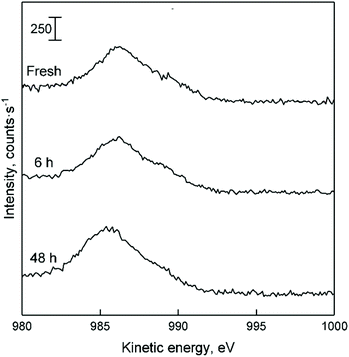 | ||
| Fig. 18 LMM Auger line of spent ZTT-1 with increasing time on stream during the Lebedev process. Dotted lines represent the appearance of Zn at different oxidation sate, as found in the literature.52 | ||
Considering that the accumulation of heavy carbon species coincided with catalytic deactivation, we propose that the predominant deactivation mechanism is the formation and deposition of carbonaceous species inside the pores of Zn–Ta-TUD-1. Initially, there appears to be a selective poisoning of some active sites responsible for ethanol dehydration, as evidenced by the relatively faster change in selectivity during the first 6 hours (Fig. 18). However, the subsequent homogeneous channel filling indicated by the XPS analysis suggested the carbon deposition was not selective beyond that point. It also found that total pore blockage did not occur after 48 hours on stream. Rather, the surface of pore channels was progressively filled with heavy carbon species, reducing the average pore diameter, porous volume and specific surface area. In this scenario, the loss of activity can be attributed to the physical inaccessibility of active sites. No change to the oxidation state of the metal oxide phase was observed by XPS, excluding it as a source of deactivation.
4. Conclusion
Our previous study showed Zn–Ta-TUD-1 to be one of the best performing catalyst in the production of butadiene from ethanol.37 In the present study, a stable selectivity of 68% towards butadiene was achieved with Zn3.1%–Ta1.9%-TUD-1 at 350 °C and 5.3 h−1, confirming the high performance of this catalytic system. The TUD-1 preparation method allows for the one-pot synthesis of mesoporous materials with highly dispersed metal oxide phases. To verify the success of the synthesis method, 5 Zn–Ta-TUD-1 solids were synthesized with different metal loadings parameters, characterized and compared. For the best performing catalyst, N2 porosimetry and TEM confirmed the foam-like mesoporous morphology expected of TUD-1 material. A combination of spectroscopy techniques revealed that the active phase consisted of highly dispersed Zn(II) and Ta(V) species incorporated within the silica matrix. TEM showed the Ta(V) phase to consist of mononuclear species and small metal oxide domains around 1 nm in diameter. This high degree of dispersion resulted in a strong concentration of Lewis acid sites. Contrarily, the TUD-1 synthesis could not be highly dispersed when 13 mol% of metal were loaded in the synthesis, indicative of the method's limit for introducing a highly dispersed active phase. Instead extra-framework nanoparticles where formed, resulting in a lower Lewis acid site concentration despite the higher metal content.A strong correlation between the initial productivity of BD and the concentration of Lewis acid sites in Zn–Ta-TUD-1 quantified with the IR spectroscopy of chemisorbed pyridine was established. Furthermore, a pyridine poison study confirmed the involvement of the probed sites in the condensation of acetaldehyde, which is recognized as the rate-determining step of the ethanol-to-butadiene reaction. Consequently, we propose that Lewis acid sites are the active sites in this reaction step. Characterization of the surface acidity suggested that both the Zn(II) and Ta(V) phases contributed to the condensation reactivity. Furthermore, synergy between Zn(II) and Ta(V) species was found necessary for enabling both the dehydrogenation of ethanol to acetaldehyde and its subsequent condensation.
The deactivation of Zn–Ta-TUD-1 was studied under reaction conditions intended to maximize butadiene productivity, e.g., 400 °C and WHSVEtOH of 5.3 h−1. Analysis of spent catalysts recovered after 72 h runs revealed a significant accumulation of up to 16 wt% of heavy carbonaceous species coinciding with the loss of catalytic activity. XPS revealed the deposition of carbon species proceeded homogeneously within the channels of the catalyst, which reduced its specific surface area, pore volume and pore size. Consequently, the deactivation mechanism appears to be the deposition of heavy carbon species within the catalyst, hindering the access to active sites. Total pore blockage and the reduction of the oxide active phase were ruled out as a source of deactivation.
Conflicts of interest
There are no conflicts to declare.Acknowledgements
Oliver Gardoll is acknowledged for performing the temperature-programmed experiments. Authors acknowledge the support from the French National Research Agency (ANR-15-CE07-0018-01). Chevreul Institute (FR 2638), Ministère de l'Enseignement Supérieur, de la Recherche et de l'Innovation, Région Hauts-de-France and FEDER are acknowledged for supporting and funding partially this work.Notes and references
- OECD-FAO Agricultural Outlook 2017–2026, OECD, 2017 Search PubMed.
- H. T. Abdulrazzaq and T. J. Schwartz, Catalytic Conversion of Ethanol to Commodity and Specialty Chemicals, Elsevier Inc., 2018 Search PubMed.
- J. Sun and Y. Wang, ACS Catal., 2014, 4, 1078–1090 CrossRef CAS.
- J. J. Bozell and G. R. Petersen, Green Chem., 2010, 12, 539 RSC.
- E. V. Makshina, M. Dusselier, W. Janssens, J. Degrève, P. A. Jacobs and B. F. Sels, Chem. Soc. Rev., 2014, 43, 7917–7953 RSC.
- G. Pomalaza, M. Capron, V. Ordomsky and F. Dumeignil, Catalysts, 2016, 6, 203 CrossRef.
- W. C. White, Chem.-Biol. Interact., 2007, 166, 10–14 CrossRef CAS PubMed.
- M. Dahlmann, J. Grub and E. Löser, in Ullmann's Encyclopedia of Industrial Chemistry, Wiley-VCH Verlag GmbH & Co. KGaA, Weinheim, Germany, 2011, vol. 100C, pp. 1–24 Search PubMed.
- T. Ren, M. K. Patel and K. Blok, Energy, 2008, 33, 817–833 CAS.
- J. S. Plotkin, The Continuing Quest for Butadiene, 2016, https://www-acs-org/content/acs/en/pressroom/cutting-edge-chemistry/the-continuing-quest-for-butadiene.html (Accessed on December 20, 2018) Search PubMed.
- I. Amghizar, L. A. Vandewalle, K. M. Van Geem and G. B. Marin, Engineering, 2017, 3, 171–178 CrossRef CAS.
- P. C. A. Bruijnincx and B. M. Weckhuysen, Angew. Chem., Int. Ed., 2013, 52, 11980–11987 CrossRef CAS PubMed.
- E. V. Makshina, W. Janssens, B. F. Sels and P. A. Jacobs, Catal. Today, 2012, 198, 338–344 CrossRef CAS.
- C. Angelici, M. E. Z. Velthoen, B. M. Weckhuysen and P. C. A. Bruijnincx, ChemSusChem, 2014, 7, 2505–2515 CrossRef CAS PubMed.
- T. Yan, L. Yang, W. Dai, C. Wang, G. Wu, N. Guan, M. Hunger and L. Li, J. Catal., 2018, 367, 7–15 CrossRef CAS.
- S. Da Ros, M. D. Jones, D. Mattia, M. Schwaab, F. B. Noronha and J. C. Pinto, Appl. Catal., A, 2017, 530, 37–47 CrossRef CAS.
- V. L. Sushkevich and I. I. Ivanova, ChemSusChem, 2016, 9, 2216–2225 CrossRef CAS PubMed.
- S.-H. Chung, C. Angelici, S. O. M. Hinterding, M. Weingarth, M. Baldus, K. Houben, B. M. Weckhuysen and P. C. A. Bruijnincx, ACS Catal., 2016, 6, 4034–4045 CrossRef CAS.
- W. E. Taifan and J. Baltrusaitis, J. Phys. Chem. C, 2018, 122, 20894–20906 CrossRef CAS.
- V. L. Sushkevich and I. I. Ivanova, Appl. Catal., B, 2017, 215, 36–49 CrossRef CAS.
- P. Müller, S. P. Burt, A. M. Love, W. P. McDermott, P. Wolf and I. Hermans, ACS Catal., 2016, 6, 6823–6832 CrossRef.
- V. L. Sushkevich, D. Palagin and I. I. Ivanova, ACS Catal., 2015, 5, 4833–4836 CrossRef CAS.
- V. L. Sushkevich, A. Vimont, A. Travert and I. I. Ivanova, J. Phys. Chem. C, 2015, 119, 17633–17639 CrossRef CAS.
- W. Janssens, E. V. Makshina, P. Vanelderen, F. De Clippel, K. Houthoofd, S. Kerkhofs, J. A. Martens, P. A. Jacobs and B. F. Sels, ChemSusChem, 2015, 8, 994–1008 CrossRef CAS PubMed.
- S. Kvisle, A. Aguero and R. P. A. Sneeden, Appl. Catal., 1988, 43, 117–131 CrossRef CAS.
- M. M. Kurmach, O. V. Larina, P. I. Kyriienko, P. S. Yaremov, V. V. Trachevsky, O. V. Shvets and S. O. Soloviev, ChemistrySelect, 2018, 3, 8539–8546 CrossRef CAS.
- Q. Zhu, B. Wang and T. Tan, ACS Sustainable Chem. Eng., 2017, 5, 722–733 CrossRef CAS.
- R. A. L. Baylon, J. Sun and Y. Wang, Catal. Today, 2014, 259, 446–452 CrossRef.
- V. L. Sushkevich, I. I. Ivanova and E. Taarning, ChemCatChem, 2013, 5, 2367–2373 CrossRef CAS.
- V. L. Dagle, M. D. Flake, T. L. Lemmon, J. S. Lopez, L. Kovarik and R. A. Dagle, Appl. Catal., B, 2018, 236, 576–587 CrossRef CAS.
- C. Angelici, F. Meirer, A. M. J. van der Eerden, H. L. Schaink, A. Goryachev, J. P. Hofmann, E. J. M. Hensen, B. M. Weckhuysen and P. C. A. Bruijnincx, ACS Catal., 2015, 5, 6005–6015 CrossRef CAS.
- W. E. Taifan, Y. Li, J. P. Baltrus, L. Zhang, A. I. Frenkel and J. Baltrusaitis, ACS Catal., 2019, 9, 269–285 CrossRef CAS.
- P. I. Kyriienko, O. V. Larina, S. O. Soloviev, S. M. Orlyk, C. Calers and S. Dzwigaj, ACS Sustainable Chem. Eng., 2017, 5, 2075–2083 CrossRef CAS.
- T. W. Kim, J. W. Kim, S. Y. Kim, H. J. Chae, J. R. Kim, S. Y. Jeong and C. U. Kim, Chem. Eng. J., 2014, 278, 217–223 CrossRef.
- M. Zhang, X. Tan, T. Zhang, Z. Han and H. Jiang, RSC Adv., 2018, 8, 34069–34077 RSC.
- G. M. Cabello González, R. Murciano, A. L. Villanueva Perales, A. Martínez, F. Vidal-Barrero and M. Campoy, Appl. Catal., A, 2019, 570, 96–106 CrossRef.
- G. Pomalaza, G. Vofo, M. Capron and F. Dumeignil, Green Chem., 2018, 20, 3203–3209 RSC.
- S. Telalović, A. Ramanathan, G. Mul and U. Hanefeld, J. Mater. Chem., 2010, 20, 642–658 RSC.
- J. C. Jansen, Z. Shan, L. Marchese, W. Zhou, N. v d Puil and T. Maschmeyer, Chem. Commun., 2001, 713–714 RSC.
- S. Telalović, A. Ramanathan, G. Mul and U. Hanefeld, J. Mater. Chem., 2010, 20, 642 RSC.
- K. D. Breuer, D. D. Demuth, A. D. Hagemeyer, N. D. Rieber, J. H. D. Teles and A. Teles, Joaquim Henrique; Rieber, Norbert; Breuer, Klaus; Demuth, Dirk; Hibst, Hartmut; Hagemeyer, EU, EP0887330B1, 1998.
- J. Walton, P. Wincott, N. Fairley and A. Carrick, Peak Fitting with CasaXPS: A Casa Pocket Book, Accolyte Science, Knutsford, UK, 2010 Search PubMed.
- P. Kubelka and F. Munk, Z. Tech. Phys., 1931, 12, 593–601 Search PubMed.
- M. Tamura, K. Shimizu and A. Satsuma, Appl. Catal., A, 2012, 433–434, 135–145 CrossRef CAS.
- F. Dumeignil, S. Paul, L. Duhamel, J. Faye, P. Miquel, M. Capron and J.-L. Dubois, WO2015118263A1, 2015.
- K. S. W. Sing and J. Rouquerol, Handb. Heterog. Catal., 2008, 2–5, 427–439 Search PubMed.
- A. Ramanathan, M. C. Castro Villalobos, C. Kwakernaak, S. Telalovic and U. Hanefeld, Chem. – Eur. J., 2008, 14, 961–972 CrossRef CAS PubMed.
- M. P. Pachamuthu, V. V. Srinivasan, R. Maheswari, K. Shanthi and A. Ramanathan, Appl. Catal., A, 2013, 462–463, 143–149 CrossRef CAS.
- L. S. Dake, D. R. Baer and J. M. Zachara, Surf. Interface Anal., 1989, 14, 71–75 CrossRef CAS.
- T. L. Barr, M. Yin and S. Varma, J. Vac. Sci. Technol., A, 1992, 10, 2383–2390 CrossRef CAS.
- E. Diler, B. Lescop, S. Rioual, G. Nguyen Vien, D. Thierry and B. Rouvellou, Corros. Sci., 2014, 79, 83–88 CrossRef CAS.
- J. A. Rodriguez, T. Jirsak, J. Dvorak, S. Sambasivan and D. Fischer, J. Phys. Chem. B, 2002, 104, 319–328 CrossRef.
- S. Catillon-Mucherie, H. Lauron-Pernot and C. Louis, J. Phys. Chem. C, 2010, 114(25), 11140–11147 CrossRef CAS.
- National Institute of Standards and Technology, NIST X-ray Photoelectron Spectroscopy Database, NIST Standard Reference Database Number 20, https://srdata.nist.gov/xps/Default.aspx.
- F. Garbassi, J. C. J. Bart and G. Petrini, J. Electron Spectrosc. Relat. Phenom., 1981, 22, 95–107 CrossRef CAS.
- J. N. Kondo, H. Yamazaki, A. Ishikawa, R. Osuga, S. Takao, T. Yokoi, S. Kikkawa, K. Teramura and T. Tanaka, ChemistrySelect, 2016, 1, 3124–3131 CrossRef CAS.
- F. P. J. M. Kerkhof and J. A. Moulijn, J. Phys. Chem., 1979, 83, 1612–1619 CrossRef CAS.
- V. León, Surf. Sci., 1995, 339, L931–L934 CrossRef.
- D. Nikolova, R. Edreva-Kardjieva, T. Grozeva and G. Gouliev, A Comparative Study of XPS Models for Particle Size Determination of Molybdenum Supported Catalysts, 2006 Search PubMed.
- S. Tanuma, C. J. Powell and D. R. Penn, Surf. Interface Anal., 1994, 21, 165–176 CrossRef CAS.
- S. Tougaard, QUASES-IMFP-TPP2M: Database for Calculation of IMFPs by TPP2M Formula, version 3.0, QUASES-Tougaard Inc., Odense, Denmark, 2016 Search PubMed.
- M. A. Camblor, A. Corma and J. Pérez-Pariente, J. Chem. Soc., Chem. Commun., 1993,(6), 557–559 RSC.
- M. Sasidharan, Y. Kiyozumi, N. K. Mal, M. Paul, P. R. Rajamohanan and A. Bhaumik, Microporous Mesoporous Mater., 2009, 126, 234–244 CrossRef CAS.
- Y. Chen, J. L. G. Fierro, T. Tanaka and I. E. Wachs, J. Phys. Chem. B, 2003, 107, 5243–5250 CrossRef CAS.
- M. Baltes, A. Kytökivi, B. M. Weckhuysen, R. A. Schoonheydt, P. Van Der Voort, E. F. Vansant, A. Kyto, B. M. Weckhuysen, R. A. Schoonheydt, P. Van Der Voort, E. F. Vansant, A. Kytökivi, B. M. Weckhuysen, R. A. Schoonheydt, P. Van Der Voort, E. F. Vansant, A. Kyto, B. M. Weckhuysen, R. A. Schoonheydt, P. Van Der Voort, E. F. Vansant, A. Kytökivi, B. M. Weckhuysen, R. A. Schoonheydt, P. Van Der Voort and E. F. Vansant, J. Phys. Chem. B, 2001, 105, 6211–6220 CrossRef CAS.
- L. Wang, S. Sang, S. Meng, Y. Zhang, Y. Qi and Z. Liu, Mater. Lett., 2007, 61, 1675–1678 CrossRef CAS.
- S. G. Hur, T. W. Kim, S. J. Hwang, S. H. Hwang, J. H. Yang and J. H. Choy, J. Phys. Chem. B, 2006, 110, 1599–1604 CrossRef CAS PubMed.
- M. Popova, I. Trendafilova, Á. Szegedi, J. Mihály, P. Németh, S. G. Marinova, H. A. Aleksandrov and G. N. Vayssilov, Microporous Mesoporous Mater., 2016, 228, 256–265 CrossRef CAS.
- D. A. Ruddy and T. D. Tilley, J. Am. Chem. Soc., 2008, 130, 11088–11096 CrossRef CAS PubMed.
- M. Trejda, A. Wojtaszek, A. Floch, R. Wojcieszak, E. M. Gaigneaux and M. Ziolek, Catal. Today, 2010, 158, 170–177 CrossRef CAS.
- S. Dzwigaj, Y. Millot and M. Che, Catal. Lett., 2010, 135, 169–174 CrossRef CAS.
- P. B. Lihitkar, S. Violet, M. Shirolkar, J. Singh, O. N. Srivastava, R. H. Naik and S. K. Kulkarni, Mater. Chem. Phys., 2012, 133, 850–856 CrossRef CAS.
- F. Schröder, S. Hermes, H. Parala, T. Hikov, M. Muhler and R. A. Fischer, J. Mater. Chem., 2006, 16, 3565–3574 RSC.
- H. Yoshida, J. Catal., 2003, 220, 226–232 CrossRef CAS.
- T. Barzetti, E. Selli, D. Moscotti, L. Forni, C. Fisica, U. Milano and V. C. Golgi, J. Chem. Soc., Faraday Trans., 1996, 92, 1401–1407 RSC.
- P. I. Kyriienko, O. V. Larina, N. O. Popovych, S. O. Soloviev, Y. Millot and S. Dzwigaj, J. Mol. Catal. A: Chem., 2016, 424, 27–36 CrossRef CAS.
- C. Angelici, M. E. Z. Velthoen, B. M. Weckhuysen and P. C. A. Bruijnincx, Catal. Sci. Technol., 2015, 5, 2869–2879 RSC.
- P. T. Patil, D. Liu, Y. Liu, J. Chang and A. Borgna, Appl. Catal., A, 2017, 543, 67–74 CrossRef CAS.
- M. Gao, M. Zhang and Y. Li, RSC Adv., 2017, 7, 11929–11937 RSC.
- A. Auroux, Calorimetry and Thermal Methods in Catalysis, Springer Berlin Heidelberg, Berlin, Heidelberg, 2013, vol. 154 Search PubMed.
- T. De Baerdemaeker, M. Feyen, U. Müller, B. Yilmaz, F. S. Xiao, W. Zhang, T. Yokoi, X. Bao, H. Gies and D. E. De Vos, ACS Catal., 2015, 5, 3393–3397 CrossRef CAS.
- A. Corma, V. Fornés, F. V. Melo and J. Herrero, Zeolites, 1987, 7, 559–563 CrossRef CAS.
- G. CONNELL and J. A. Dumesic, J. Catal., 1987, 105, 285–298 CrossRef CAS.
- A. Corma, F. X. Llabrés i Xamena, C. Prestipino, M. Renz and S. Valencia, J. Phys. Chem. C, 2009, 113, 11306–11315 CrossRef CAS.
- H. Y. Luo, J. D. Lewis and Y. Román-Leshkov, Annu. Rev. Chem. Biomol. Eng., 2016, 7, 663–692 CrossRef CAS.
- K. Tanabe, M. Misono, H. Hattori and Y. Ono, New Solid Acids and Bases: Their Catalytic Properties, Elsevier, 1990 Search PubMed.
- J. M. Vohs and M. A. Barteau, Surf. Sci., 1989, 221, 590–608 CrossRef CAS.
- C. Drouilly, J. M. Krafft, F. Averseng, H. Lauron-Pernot, D. Bazer-Bachi, C. Chizallet, V. Lecocq and G. Costentin, Appl. Catal., A, 2013, 453, 121–129 CrossRef CAS.
- J. GOLDWASSER, J. Catal., 1981, 71, 53–63 CrossRef CAS.
- V. L. Sushkevich, I. I. Ivanova, V. V. Ordomsky and E. Taarning, ChemSusChem, 2014, 2527–2536 CrossRef CAS PubMed.
- V. V. Ordomsky, V. L. Sushkevich and I. I. Ivanova, J. Mol. Catal. A: Chem., 2010, 333, 85–93 CrossRef CAS.
- S. M. T. Almutairi, B. Mezari, P. C. M. M. Magusin, E. A. Pidko and E. J. M. Hensen, ACS Catal., 2012, 2, 71–83 CrossRef CAS.
- O. W. Perez-Lopez, A. C. Farias, N. R. Marcilio and J. M. C. Bueno, Mater. Res. Bull., 2005, 40, 2089–2099 CrossRef CAS.
- B. B. Corson, E. E. Stahly, H. E. Jones and H. D. Bishop, Ind. Eng. Chem., 1949, 41, 1012–1017 CrossRef CAS.
- H. E. Jones, E. E. Stahly and B. B. Corson, J. Am. Chem. Soc., 1949, 71, 1822–1828 CrossRef CAS.
- W. M. Quattlebaum, W. J. Toussaint and J. T. Dunn, J. Am. Chem. Soc., 1947, 1491, 593–599 CrossRef.
- T. Yan, W. Dai, G. Wu, S. Lang, M. Hunger, N. Guan and L. Li, ACS Catal., 2018, 8, 2760–2773 CrossRef CAS.
- C. Drouilly, J. Krafft, F. Averseng and H. Lauron-pernot, Catal. Today, 2013, 205, 67–75 CrossRef CAS.
- J. M. Vohs and M. A. Barteau, J. Phys. Chem., 1991, 95, 297–302 CrossRef CAS.
- H. A. Aleksandrov, G. N. Vayssilov and N. Rösch, J. Mol. Catal. A: Chem., 2006, 256, 149–155 CrossRef CAS.
- C. H. Bartholomew, Appl. Catal., A, 2001, 212, 17–60 CrossRef CAS.
- J. A. Moulijn, A. E. van Diepen and F. Kapteijn, in Handbook of Heterogeneous Catalysis, Wiley-VCH Verlag GmbH & Co. KGaA, Weinheim, Germany, 2008 Search PubMed.
- A. R. Pradhan, J. F. Wu, S. J. Jong, T. C. Tsai and S. B. Liu, Appl. Catal., A, 1997, 165, 489–497 CrossRef CAS.
- B. A. Sexton, A. E. Hughes and D. M. Bibby, J. Catal., 1988, 109, 126–131 CrossRef CAS.
- A. Klein, K. Keisers and R. Palkovits, Appl. Catal., A, 2016, 514, 192–202 CrossRef CAS.
Footnote |
| † Electronic supplementary information (ESI) available. See DOI: 10.1039/d0gc00103a |
| This journal is © The Royal Society of Chemistry 2020 |

