 Open Access Article
Creative Commons Attribution 3.0 Unported Licence
Role of life-cycle externalities in the valuation of protic ionic liquids – a case study in biomass pretreatment solvents†
Husain
Baaqel
 a,
Ismael
Díaz
 b,
Víctor
Tulus
 cd,
Benoît
Chachuat
 *a,
Gonzalo
Guillén-Gosálbez
 *c and
Jason P.
Hallett
 a
a
aDepartment of Chemical Engineering, Imperial College London, South Kensington Campus, London SW7 2AZ, UK. E-mail: b.chachuat@imperial.ac.uk
bDepartamento Ingeniería Química y del Medio Ambiente, Escuela Técnica Superior de Ingenieros Industriales, Universidad Politécnica de Madrid, C/José Gutiérrez Abascal, 2, 28006 Madrid, Spain
cInstitute for Chemical and Bioengineering, Department of Chemistry and Applied Biosciences, ETH Zürich, Vladimir-Prelog-Weg 1, 8093 Zürich, Switzerland. E-mail: gonzalo.guillen.gosalbez@chem.ethz.ch
dDepartament d'Enginyeria Química, Universitat Rovira i Virgili, Av. Països Catalans 26, 43007 Tarragona, Spain
First published on 29th April 2020
Abstract
Ionic liquids have found their way into many applications where they show a high potential to replace traditional chemicals. But concerns over their ecological impacts (toxicity and biodegradability) and high cost have limited their use so far. The outcome of existing techno-economic and life-cycle assessments comparing ionic liquids with existing solvents has proven hard to interpret due to the many metrics used and trade-offs between them. For the first time, this paper couples the concept of monetization with detailed process simulation and life-cycle assessment to estimate the true cost of ionic liquids. A comparative case study on four solvents used in lignocellulosic biomass pretreatment is conducted: triethylammonium hydrogen sulfate [TEA][HSO4], 1-methylimidazolium hydrogen sulfate [HMIM][HSO4], acetone from fossil sources, and glycerol from renewable sources. The results show that the total monetized cost of production accounting for externalities can be more than double the direct costs estimated using conventional economic assessment methods. [TEA][HSO4] is found to have the lowest total cost, while glycerol presents the highest total cost. We expect this methodology to provide a starting point for future research and development in sustainable ionic liquids.
Introduction
Ionic liquids are salts made of poorly coordinated ions with melting points generally below 100 °C and negligible vapor pressure.1 They can be synthesized from a wide range of cations and anions and may be used in many applications due to their unique characteristics, as most ionic liquids are non-volatile, non-flammable and thermally and chemically stable. But a major issue hindering their widespread application is environmental related concerns in terms of toxicity and biodegradability.2–4 There are also some concerns that their large-scale production could shift the use of VOCs upstream to the production phase.5 Therefore, a thorough assessment of ionic liquids across their life-cycle is necessary to better understand and quantify their environmental performance.Life-cycle assessment (LCA) is a methodology used to assess the environmental impact of products throughout their entire life cycle,6 covering resource extraction (cradle), production, use and disposal (grave). LCA is the main standardized environmental assessment method used worldwide and has been applied extensively to support decision-making by governments and private organizations.7 A key strength of LCA lies in the translation of environmental impacts into high-level areas such as human health and ecosystem quality, which facilitates the interpretation and communication of the results to stakeholders and decision-makers. In recent years, LCA has been applied to the assessment of a wide range of chemicals, enabling the identification of major hotspots and improvement opportunities.8–10
Environmental performance is not the only factor that impedes the penetration of ionic liquids, as their production cost may also be high.11–13 This economic barrier is mainly due to small production volumes and expensive purification procedures. But if they were used in large-scale processes and achieving high purity were not an issue, the cost of ionic liquids would likely be substantially reduced. For instance, a recent technoeconomic assessment14 has concluded that the cost of triethylammonium hydrogen sulfate [TEA][HSO4] and 1-methylimidazolium hydrogen sulfate [HMIM][HSO4] could be as low as $1.24 kg−1—a value below the cost of important organic solvents such as acetone and ethyl acetate which ranges between $1.3–1.4 kg−1.
The standard approach to economic assessment often disregards indirect costs due to environmental externalities, namely impacts that occur as part of a product's life cycle and incur a cost for their mitigation. Such externalities need to be taken into account as indirect costs alongside direct production costs in order to reflect a product's true cost.15,16 For instance, natural phenomena such as global warming can have adverse effects on both human health and ecosystem quality, both of which carry indirect costs. Poor health can affect an individual's capacity to perform certain tasks, which leads to the loss of productivity or the need for health care.17 Similarly, anthropogenic impacts on ecosystem quality may be reversed through environmental remediation projects.18
Because most decisions are economically driven, it is of paramount importance to account for the externalities associated with the production and use of ionic liquids in order to compare them in a fair way with their non-ionic counterparts. Monetary valuation—monetization in short—converts social and environmental impacts into currency (Fig. 1). It has been used to determine the cost of non-market goods in various sectors including energy systems to estimate the environmental damage cost of a specific energy mix,19 health care systems to quantify the benefits of informal care,20 and insurance systems to predict the demand by homeowners after a disaster.21 It has also been used in the weighting phase of LCA to evaluate trade-offs.22–24,60
Herein, we combine LCA and monetization to quantify the true cost of ionic liquids for the first time. The focus is on [TEA][HSO4] and [HMIM][HSO4], two widely used protic ionic liquids in biomass pretreatment for their lignin solvating power,25 which we compare against acetone and glycerol regarded as the business-as-usual solvents.26–30 The analysis starts with an environmental impact assessment of the solvents using LCA. These environmental impacts are then converted into currency via monetization and combined with the direct production costs to yield a total monetized cost.
Materials and methods
We consider four solvents for biomass pretreatment: two conventional solvents, acetone and glycerol, that are produced industrially; and two protic ionic liquids, [TEA][HSO4] and [HMIM][HSO4], for which only experimental synthesis procedures are currently available.Glycerol and acetone are both market products. Their price and LCA data are readily available, e.g., from the ecoinvent 3.5 database,31 where over 90% of the acetone is co-produced with phenol in the cumene process, while about 80% of the glycerol is a by-product of the biodiesel manufacturing process. Respectively 28% and 10% of the environmental impacts generated by these processes are allocated to acetone and glycerol accordingly.
By contrast, to circumvent the lack of data for both ionic liquids, detailed process models are developed by scaling-up the available experimental procedures. The same strategy is applied to the production process of the precursor 1-methylimidazole of [HMIM][HSO4] for which price and LCA data are also lacking. All of these process models as well as the methods and tools used to conduct the assessment are detailed in the following subsections.
Modelling of protic ionic liquid production processes
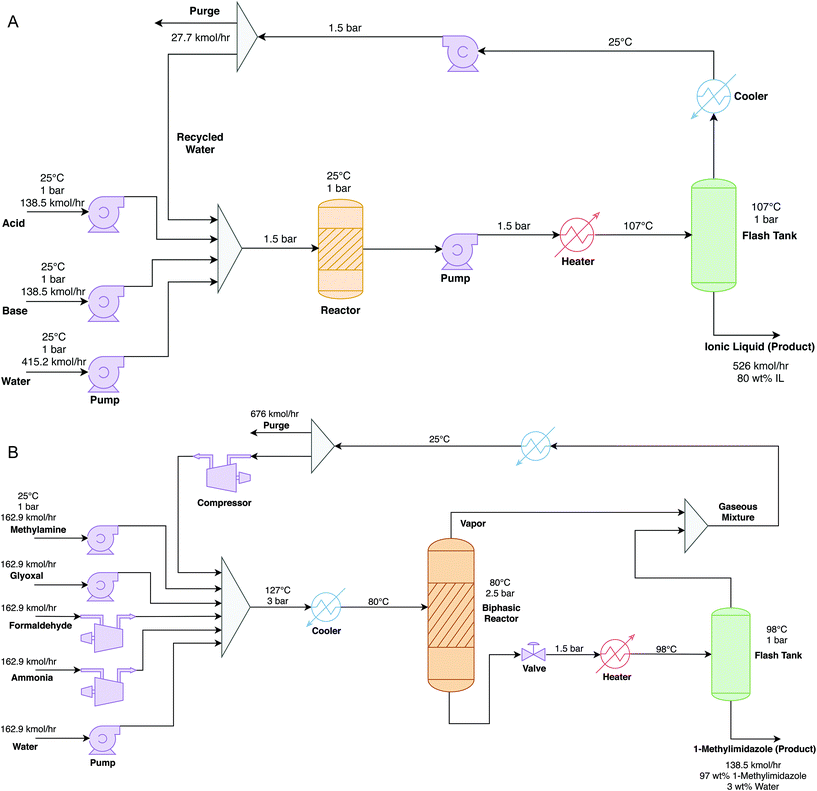
The process simulator Aspen-HYSYS® version 9 is used to model the production processes of the ionic liquids [TEA][HSO4] and [HMIM][HSO4] and of the precursor 1-methylimidazole. | (R1) |
LCA inventories for this synthesis were previously estimated by Righi et al.34 But due to lack of details about the process configuration and operating conditions and the fact that neither process water nor cooling water were reported, these inventories could not be used here. Instead, we develop a scaled-up process (Fig. 2B) using the standard method by Douglas,35 which is consistent with the modeling methodology of ionic liquid production (Fig. 2A). Equimolar amounts of the four reactants are mixed in water at 25 °C and under atmospheric pressure. This mixture is pressurized to 3 bar and then cooled down to 80 °C, before entering a biphasic reactor where it reacts at 80 °C and 2.5 bar to form the 1-methylimidazole and water with 75% conversion. The outlet liquid stream from the reactor is depressurized to 1.5 bar and heated up to 98 °C using steam, then feeds into a flash drum to separate the aqueous mixture of 1-methylimidazole from the unreacted feed products and steam inthe flashed gas. The outlet gas stream from the reactor is mixed with this flashed gas and recycled back to the reactor. This recycled stream is cooled down to 25 °C and compressed to 3 bar, and a 10% purge is applied.
Functional unit
The economic and environmental assessment below is conducted for a functional unit of “1 kg of solvent”, using a per-weight basis to reflect current commercial practice for solvent. By limiting the scope to the production phase of solvent only, this functional unit greatly simplifies the assessment. This approach is also appealing in that it enables the screening of candidate ionic liquids that have not yet been demonstrated at full commercial scale.In practice, one could also include the use phase of a solvent to reflect its actual function. There is indeed considerable variation in the design and operation of biomass pretreatment processes across the range of solvents, e.g. due to differences in lignin solvating power, heat of regeneration, or solvent degradation.38–40 A detailed modeling of bespoke pretreatment processes for each solvent is beyond the scope of the present paper. Instead, we consider three published pretreatment processes in order to enable an alternative comparison in terms of “1 kg of biomass”. Conversion factors on a weight-of-solvent-makeup-per-weight-of-treated-biomass basis are calculated using the solvent recycling rate, the mass fraction of solvent in the feed mixture, and the solvent-biomass feed ratio in each process: (i) 32 kg ton−1 for both ionic liquids using the ionoSolv process;39,41(ii) 140 kg ton−1 for acetone using the Organosolv process with ethanol as proxy solvent;38 and (iii) 2500 kg ton−1 for glycerol based on a recent process.40 Further details can be found in Appendix D of the ESI.† This preliminary comparison furthermore assumes a similar CAPEX and OPEX for the different processes and neglects any extra solvent or enzyme in the pretreatment.
Economic assessment
The production cost of the ionic liquids is estimated via the total annualized cost (TAC) of the scaled-up processes, following the approach by Towler and Sinnott42 as delineated in Table S4 in the ESI.† The TAC is comprised of the operating expenses (OPEX) and the annualized capital expenses (CAPEX). The latter represents the annual cost of paying off the fixed capital investment of a plant over its entire lifespan—here assuming 330 days of operation a year (equivalent to 7920 hours) over a 10-year period. The CAPEX itself consists of equipment costs, offsite costs, engineering and construction costs, and contingency charges. The CAPEX of the main units in each production process are reported in Tables S6, S8 and S10.† The inflation rate is furthermore set based on the Chemical Engineering Plant Cost Index (CEPCI). The OPEX consists of fixed production costs, which are associated to operation and labour, and variable production costs associated to the procurement of raw materials and utilities. The former are reported in Tables S7, S9 and S11† and the latter are sourced from ecoinvent 3.5 as given in Table S5.† All of the costs—including the externalities discussed below—are expressed in USD2019 using currency conversion and inflation factors.Environmental assessment
The LCA follows the ISO 14040 principles and is conducted using the software SimaPro® interfaced with ecoinvent 3.5. In agreement with the functional unit selection above, a cradle-to-gate scope is adopted that includes the impacts from the raw material extraction to the final product synthesis but excludes the product use phase assuming that the biomass pretreatment is identical for all the solvents. It is furthermore assumed that the production takes place in Europe as the geographical location. Notice that no allocation is required since the processes for producing the ionic liquids (Fig. 2) do not yield any by-products.Data for the background processes from the ecoinvent 3.5 database are combined with information about the foreground system, mainly mass and energy flows obtained from the process simulation in Aspen-HYSYS. A complete list of the life-cycle inventories (LCI) can be found in Tables S13–S15 of the ESI.† Detailed process simulation is also used to circumvent the lack of background data regarding the precursor 1-methylimidazole. The proxy data and methods used to quantify the air and water emissions are reported in Table S12.† To ensure consistency, they follow the guidelines by Hischier et al.43 which are used for many processes in ecoinvent.
The LCI entries are converted into environmental impact using the ReCiPe 2016 methodology.44 During this life-cycle impact assessment (LCIA), all of the LCI entries are categorized into 17 midpoint indicators, including global warming, toxicity, ozone depletion and land use. Severity of these impacts is determined from state-of-the-art environmental models such as the Absolute Global Warming Potential (AGWP) for climate change,45,46 and toxicity potential (TP) for human, marine and terrestrial toxicities.47,48 The midpoint indicators are further aggregated into 3 endpoint (damage) categories: resources, human health and ecosystem quality. The complete ReCiPe midpoint and endpoint results are given in Tables S16 and S17,† respectively.
Monetization
Monetization converts environmental impacts into currency. It is routinely used in cost benefit analysis (CBA) to support decision-making when both economic and environmental indicators need to be considered simultaneously. After the conversion, all of the economic and environmental metrics may be combined into a single total cost that is readily interpreted or used for comparison basis.Existing monetary valuation methods often measure an individual's willingness-to-pay (WTP) for preventing or mitigating the environmental impacts incurred by an activity.16 Herein, damages to human health and ecosystem quality are monetized using, respectively, the budget constraint and choice modeling methods.49 Budget constraint measures the potential economic production of an individual per year in terms of quality-adjusted life-year (QALY), a year-based biophysical unit describing human health quality. Though assuming that what is earned must be spent, budget constraint lowers the uncertainty by directly valuing the economic production compared to other valuation methods. Choice modeling measures ecosystem quality based on the economic penalty that an individual is willing to accept for environmental protection. This method is widely used in healthcare programmes as a means to monetize human well-being.50,51
The monetary values of 74k EUR2003 per DALY (125.3k USD2019 per DALY) and 9.5 M EUR2003 per species per year (16 M USD2019 per species per year) are used for the monetary valuation of human health and ecosystem quality, respectively.49 By contrast, resource damages are already expressed in monetary units and do not need conversion. Further details on the monetization approach can be found in Table S18 of the ESI.†
Uncertainty analysis
Of the possible sources of uncertainty, the focus is on uncertainty in LCA data and monetization factors. Uncertainty in LCA data is quantified using the Pedigree matrix approach,52 where a score between 1 and 5 is assigned to the data based on five criteria: reliability, completeness, temporal, geographical and technological differences. These scores are combined with a basic uncertainty factor to determine the standard deviation of a log-normal distribution for each mass and energy flow. The resulting standard deviations for the three modeled processes are reported in the Tables S13–S15 of the ESI.† Uncertainty in the monetization factors is modeled with a triangular distribution with limits between 62k and 84k EUR2003 per DALY (105k–142.3k USD2019 per /DALY) for human health, and 8 M–10.8 M EUR2003 per species per year (13.5 M–18.3 M USD2019 per species per year) for ecosystem quality. This uncertainty is propagated into the total monetized costs using Monte Carlo sampling, applying the test by Law and Kelton53 to determine the number of samples.Results and discussion
Economic assessment
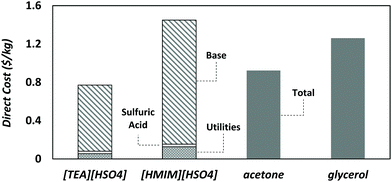
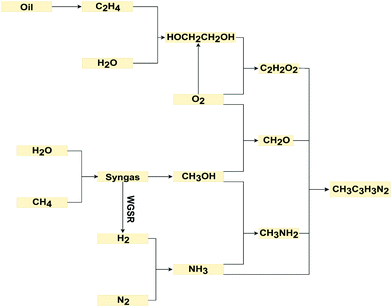
Fig. 3 presents the direct production costs per kg of solvent. [HMIM][HSO4] ($1.46 kg−1) has the highest cost and [TEA][HSO4] ($0.78 kg−1) the lowest one. This large gap between either of the ionic liquids is partly due to the larger number of steps involved in the production of [HMIM][HSO4] (cf.Fig. 4) compared to [TEA][HSO4] and the other solvents. The direct production cost of glycerol is higher than that of [TEA][HSO4] and acetone because glycerol production uses more expensive starting materials like rapeseed and soybean oils.54The OPEX comprises over 90% of the direct production cost of both ionic liquids, and the procurement of raw materials makes up most of the OPEX. This finding is consistent with previous reports.14 The precursors triethylamine ($1.4 kg−1) for [TEA][HSO4] and 1-methylimidazole ($2.8 kg−1) for [HMIM][HSO4] are indeed costly, even though this is mitigated by the very low cost of sulfuric acid ($0.05 kg−1). Other variable production costs such as utilities are low because the reactions are exothermic and the separations are straightforward due to the low volatility of ionic liquids. The CAPEX contribution is also relatively small, even though it might be overestimated by considering a lifespan of 10 years which is shorter than the usual lifetime of chemical plants.
Environmental assessment
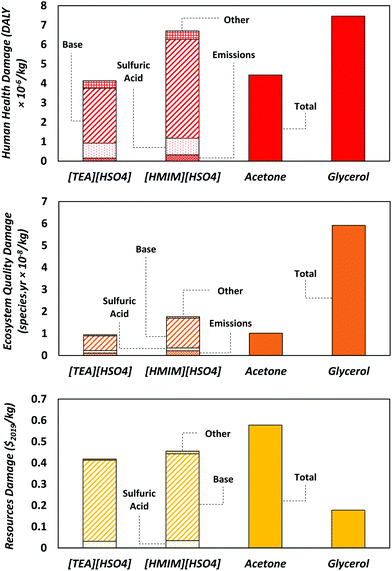
Fig. 5 presents the LCA results for all three endpoint impact categories: human health, ecosystem quality, and resources. In the human health category, the impacts of [HMIM][HSO4] and glycerol are, respectively, 50% and 80% higher than those of [TEA][HSO4] and acetone. As noted earlier, the production of 1-methylimidazole for [HMIM][HSO4] requires more steps than triethylamine for [TEA][HSO4], thus generating more waste and emissions (Fig. 4). This is reflected by the higher scores in multiple human health impact categories such as global warming potential (GWP), ozone depletion and ionizing radiation (cf. Table S16 of the ESI†). Higher emissions in ozone depleting substances such as chlorofluorocarbons (CFCs) and nitrous oxide, which are used as refrigerants in the production of bulk chemicals (ammonia, nitric acid) and fuels, occur in syntheses involving a greater number of intermediate steps since they become more reliant on heat integration.55 Whereas the major contributor to ionizing radiation is nuclear power in the electricity mix.56 By contrast, the higher impact of glycerol on human health is linked to the cultivation and processing of crops such as rapeseed and soybean. These processes combined with deforestation usually emit large amounts of pollutants such as CO2 and particulate matter (PM) that are detrimental to human health.57The impact of [HMIM][HSO4] on ecosystem quality is 86% higher than those of [TEA][HSO4] and acetone, but three-times lower than that of glycerol. The reason behind this is land use as producing 1 kg of glycerol requires almost 100 times more land area than [HMIM][HSO4], the second largest in this category. The large areas needed for crop cultivation and the related deforestation are responsible for soil damage and loss of habitat for plants and animals.58
Regarding resource depletion, both [TEA][HSO4] and [HMIM][HSO4] have a lower impact than acetone which consumes the largest amount of fossil resources among the solvents. This is because the production of acetone is nearly entirely reliant on fossil resources, whereas the ionic liquids comprise equimolar quantities of base and sulfuric acid, where only the bases are heavily reliant on fossil resources while sulfuric acid requires significantly less fossil resources. The slightly higher score of [HMIM][HSO4] over that of [TEA][HSO4] is again due to 1-methylimidazole requiring more synthesis steps than triethylamine, leading to higher consumption of fossil resources to cover the energy demand. It is also worth noting that while glycerol has high predicted impacts on both human health and ecosystem quality, its impact on resources is low since it is renewable and uses a minimal amount of fossil resources outside of processing. Production of the Brønsted bases makes up the largest impact on resources for both ionic liquids since they are derived from fossil resources. More generally, the bases yield the largest contributions in all three impact categories and should therefore be the primary focus for future improvements.
Externalities and total cost
Fig. 6 shows the combined monetized cost of externalities and direct cost for each solvent. [TEA][HSO4] presents the lowest indirect cost and glycerol the highest one. Resource and human health damages are the biggest contributors to the monetized externalities of solvent production, except for glycerol. As noted earlier, this is because acetone and the protic ionic liquids of interest are heavily reliant on fossil resources, whose extraction costs are expected to rise in the future due to resource scarcity.59 [HMIM][HSO4] has higher externalities than [TEA][HSO4] and acetone because of its higher impact on human health and ecosystem quality. As for glycerol, it is the substantially higher land use that makes its monetized impact on ecosystem quality, and thus its indirect cost, significantly higher than for the other solvents. This makes glycerol the worst solvent in terms of externalities, despite the fact that its direct production cost is lower than that of [HMIM][HSO4].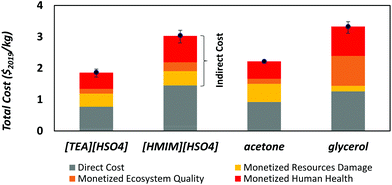 | ||
| Fig. 6 Total cost of solvent production combining direct production costs and externalities in terms of human health, ecosystem quality and resource damages. | ||
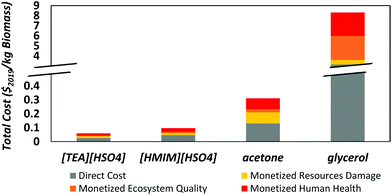
Notice that the indirect costs associated with all four solvents are larger than their direct production costs, so the total monetized costs are more than double the production costs. The total cost of glycerol ($3.33 kg−1) is the highest because of its very large externalities (>$2 kg−1). It is 10% higher than the total cost of [HMIM][HSO4] ($3.04 kg−1), 50% higher than that of acetone ($2.22 kg−1), and nearly 90% higher than that of [TEA][HSO4] ($1.87 kg−1). Also displayed on Fig. 6 is the uncertainty on the estimated externalities, where the whiskers corresponds to the 25th and 75th percentiles among all the scenarios generated by Monte Carlo sampling. These uncertainty ranges are generally small and do not overlap between each other, apart from those of glycerol and [HMIM][HSO4] that show a slight overlap. This uncertainty analysis confirms that the estimated externalities are representative and their comparison is therefore meaningful.
Lastly, Fig. 7 reports the total monetized cost per kg of pretreated biomass, for comparison with the costs per kg of solvent in Fig. 6. Although the applied conversion factors carry a large uncertainty due to the underlying assumptions (cf. Section Functional unit above and Appendix D of the ESI†), this analysis suggests that the advantages of ionic liquids compared with the other two solvents in terms of costs and environmental impacts might be unequivocal after integrating the use phase. Since the ionic liquids have a higher solvating power than acetone or glycerol and enjoy a near 100% recycling rate, the makeup of ionic liquid (32 kg ton−1) is indeed expected to be the lowest in a biomass pretreatment process. By contrast, the relatively poor recycling rate of glycerol (75%) requires by far the largest solvent makeup (2500 kg ton−1, about 80 times more than ionic liquids), which combined with its high externalities leads to a much higher total cost. Even with a more favorable recycling rate of 95%, the makeup would still be 16 times larger than ionic liquids. This cursory analysis illustrates that a solvent's use phase can radically change its economic and environmental valuation.
Concluding remarks
Interest in sustainable solvents has risen significantly over the past decades due to a growing awareness of the impact of solvents on organic pollution and energy consumption in the chemical industry. Ionic liquids are uniquely versatile and show a great potential for reducing solvent losses and regeneration expenditures, but their widespread application remains hindered by environmental related concerns in terms of toxicity and biodegradability alongside the general perception that they entail high production costs. Herein, the primary focus has been on a holistic framework that combines a conventional economic assessment with a cradle-to-gate life-cycle assessment in order to determine the total monetized cost of ionic liquids as a basis for comparison with other solvents. This framework relies on detailed models of the production processes of ionic liquids and their precursors in order to circumvent the lack of cost and LCA data.A case study in lignocellulosic biomass pretreatment has compared the production of the popular ionic liquids [TEA][HSO4] and [HMIM][HSO4] against acetone from fossil resources and glycerol from renewable resources. The economic valuation reveals that [HMIM][HSO4] has the highest direct cost of all four solvents due to the complex synthesis of its precursor 1-methylimidazole, while [TEA][HSO4] presents the lowest direct cost—about half of that of [HMIM][HSO4]. Glycerol is found to have the second highest production cost because of rapeseed oil and soybean oil being costly precursors. Adding externalities on top of these direct production costs does not change the comparison radically, but since the indirect costs from these externalities are larger than the corresponding production costs, the total monetized costs of all four solvents end up being more than double their production costs. Glycerol becomes the most expensive solvent in terms of total monetized cost, overtaking [HMIM][HSO4] due to its high externalities in the human health and ecosystem quality categories. By contrast, the ionic liquid [TEA][HSO4] is found to have the lowest total cost since its production requires relatively inexpensive materials and follows a simple synthesis procedure, followed by acetone. All of these conclusions are furthermore supported by an uncertainty analysis on the LCA data and monetization factors.
Finally, the results of an initial comparison between solvents on a per-weight-of-treated-biomass basis concluded that the benefits of ionic liquids for biomass pretreatment are likely to be downplayed by excluding the solvents’ use phase. This is because the makeup of ionic liquid in a biomass pretreatment process could be significantly lower than the makeup of other solvents, especially glycerol. Nevertheless, our analysis relies on conversion factors that carry large uncertainty. A recommended follow-up to this paper therefore entails expanding the valuation to include the use phase of solvents, for instance via detailed modeling of the biomass pretreatment processes themselves.
Overall, this case study provides a perfect illustration of the need to account for negative externalities in the comparison of solvents. By showing that solvents produced from renewable resources do not necessarily present lower externalities than other solvents derived from fossil resources, including ionic liquids, these results challenge the conventional wisdom about ionic liquids being more costly and damaging to the environment. Our advocacy is that such holistic comparison should be used more systematically for future research and development in sustainable solvents.
Conflicts of interest
There are no conflicts to declare.Acknowledgements
Jason Hallett would like to acknowledge the Supergen Bioenergy Hub of the Engineering and Physical Science Research Council (EP/S000771/1).References
- P. Wasserscheid and T. Welton, Ionic Liquids in Synthesis, John Wiley & Sons, 2008 Search PubMed.
- J. Neumann, O. Grundmann, J. Thöming, M. Schulte and S. Stolte, Green Chem., 2010, 12, 620–627 RSC.
- C. Pretti, C. Chiappe, I. Baldetti, S. Brunini, G. Monni and L. Intorre, Ecotoxicol. Environ. Saf., 2009, 72, 1170–1176 CrossRef CAS PubMed.
- M. Yu, S.-M. Li, X.-Y. Li, B.-J. Zhang and J.-J. Wang, Ecotoxicol. Environ. Saf., 2008, 71, 903–908 CrossRef CAS PubMed.
- P. L. Amado Alviz and A. J. Alvarez, J. Cleaner Prod., 2017, 168, 1614–1624 CrossRef CAS.
- J. B. Guinée, H. U. De Haes and G. Huppes, J. Cleaner Prod., 1993, 1, 3–13 CrossRef.
- W. Kloepffer, Int. J. Life Cycle Assess., 2008, 13, 89 Search PubMed.
- M. Yang, X. Tian and F. You, Ind. Eng. Chem. Res., 2018, 57, 5980–5998 CrossRef CAS.
- R. M. Cuéllar-Franca and A. Azapagic, J. CO2 Util., 2015, 9, 82–102 Search PubMed.
- A. Gonzalez-Garay, M. Gonzalez-Miquel and G. Guillén-Gosálbez, ACS Sustainable Chem. Eng., 2017, 5, 5723–5732 CrossRef CAS.
- D. Klein-Marcuschamer, B. A. Simmons and H. W. Blanch, Biofuels, Bioprod. Biorefin., 2011, 5, 562–569 CrossRef CAS.
- M. Ramdin, T. W. de Loos and T. J. Vlugt, Ind. Eng. Chem. Res., 2012, 51, 8149–8177 CrossRef CAS.
- S. M. Sen, J. B. Binder, R. T. Raines and C. T. Maravelias, Biofuels, Bioprod. Biorefin., 2012, 6, 444–452 CrossRef CAS.
- L. Chen, M. Sharifzadeh, N. Mac Dowell, T. Welton, N. Shah and J. P. Hallett, Green Chem., 2014, 16, 3098–3106 RSC.
- R. K. Turner, D. Pearce and I. Bateman, Environmental Economics: An Elementary Introduction, Harvester Wheatsheaf, 1994 Search PubMed.
- M. Pizzol, B. Weidema, M. Brandão and P. Osset, J. Cleaner Prod., 2015, 86, 170–179 Search PubMed.
- F. Bosello, R. Roson and R. S. J. Tol, Ecol. Econ., 2006, 58, 579–591 Search PubMed.
- S. Díaz, J. Fargione, F. S. C. Iii and D. Tilman, PLoS Biol., 2006, 4, e277 Search PubMed.
- I. M. Algunaibet, C. Pozo, A. Galán-Martín and G. Guillén-Gosálbez, Appl. Energy, 2019, 242, 588–601 CrossRef.
- B. V. Berg and A. Ferrer-i-Carbonell, Health Econ., 2007, 16, 1227–1244 Search PubMed.
- W. J. Wouter Botzen and J. C. J. M. Van Den Bergh, Int. Econ. Revi., 2012, 53, 1005–1026 Search PubMed.
- V. Fougerit, P. Auclair and S. Bonhoure, Proceedings 2nd LCA Conference, 2012, vol. 6, p. 7.
- T. L. T. Nguyen, B. Laratte, B. Guillaume and A. Hua, Resour., Conserv. Recycl., 2016, 109, 13–23 Search PubMed.
- S.-R. Lim, Y. R. Kim, S. H. Woo, D. Park and J. M. Park, J. Cleaner Prod., 2013, 39, 303–311 Search PubMed.
- A. Brandt, J. Gräsvik, J. P. Hallett and T. Welton, Green Chem., 2013, 15, 550–583 RSC.
- I. Hasegawa, K. Tabata, O. Okuma and K. Mae, Energy Fuels, 2004, 18, 755–760 CrossRef CAS.
- W. J. J. Huijgen, J. H. Reith and H. den Uil, Ind. Eng. Chem. Res., 2010, 49, 10132–10140 CrossRef CAS.
- J. Liu, R. Takada, S. Karita, T. Watanabe, Y. Honda and T. Watanabe, Bioresour. Technol., 2010, 101, 9355–9360 CrossRef CAS PubMed.
- H. Sadeghifar, T. Wells, R. K. Le, F. Sadeghifar, J. S. Yuan and A. Jonas Ragauskas, ACS Sustainable Chem. Eng., 2017, 5, 580–587 CrossRef CAS.
- F. Sun and H. Chen, Bioresour. Technol., 2008, 99, 5474–5479 CrossRef CAS PubMed.
- G. Wernet, C. Bauer, B. Steubing, J. Reinhard, E. Moreno-Ruiz and B. Weidema, Int. J. Life Cycle Assess., 2016, 21, 1218–1230 CrossRef.
- T. L. Greaves and C. J. Drummond, Chem. Rev., 2008, 108, 206–237 CrossRef CAS PubMed.
- K. Ebel, H. Koehler, A. O. Gamer and R. Jäckh, Imidazole and Derivatives, in Ullmann's Encyclopedia of Industrial Chemistry, Wiley-VCH, 2000 Search PubMed.
- S. Righi, A. Morfino, P. Galletti, C. Samorì, A. Tugnoli and C. Stramigioli, Green Chem., 2011, 13, 367–375 CAS.
- J. M. Douglas, Conceptual Design of Chemical Processes, McGraw-Hill, 1988 Search PubMed.
- Ionic Liquids Database – ILThermo, https://ilthermo.boulder.nist.gov/ Search PubMed.
- J. O. Valderrama and R. E. Rojas, Ind. Eng. Chem. Res., 2009, 48, 6890–6900 CrossRef CAS.
- C. Arato, E. K. Pye and G. Gjennestad, 26th Symposium on Biotechnology for Fuels and Chemicals, Humana Press, Totowa, NJ, 2005, pp. 871–882.
- A. Brandt-Talbot, F. J. V. Gschwend, P. S. Fennell, T. M. Lammens, B. Tan, J. Weale and J. P. Hallett, Green Chem., 2017, 19, 3078–3102 RSC.
- J. G. Lynam and C. J. Coronella, Bioresour. Technol., 2014, 166, 471–478 CAS.
- F. J. V. Gschwend, F. Malaret, S. Shinde, A. Brandt-Talbot and J. P. Hallett, Green Chem., 2018, 20, 3486–3498 CAS.
- G. Towler and R. Sinnott, Chemical Engineering Design: Principles, Practice and Economics of Plant and Process Design, Elsevier, 2012 Search PubMed.
- R. Hischier, S. Hellweg, C. Capello and A. Primas, Int. J. Life Cycle Assess., 2005, 10, 59–67 CAS.
- M. A. J. Huijbregts, Z. J. N. Steinmann, P. M. F. Elshout, G. Stam, F. Verones, M. D. M. Vieira, A. Hollander, M. Zijp and R. Van Zelm, ReCiPe 2016: A harmonized life cycle impact assessment method at midpoint and endpoint level, Report I: Characterization, 2016.
- F. Joos, R. Roth, J. S. Fuglestvedt, G. P. Peters, I. G. Enting, W. von Bloh, V. Brovkin, E. J. Burke, M. Eby, N. R. Edwards, T. Friedrich, T. L. Frölicher, P. R. Halloran, P. B. Holden, C. Jones, T. Kleinen, F. T. Mackenzie, K. Matsumoto, M. Meinshausen, G.-K. Plattner, A. Reisinger, J. Segschneider, G. Shaffer, M. Steinacher, K. Strassmann, K. Tanaka, A. Timmermann and A. J. Weaver, Atmos. Chem. Phys., 2013, 13, 2793–2825 Search PubMed.
- K. Pingoud, T. Ekholm and I. Savolainen, Mitigation and Adaptation Strategies for Global Change, 2012, vol. 17, pp. 369–386 Search PubMed.
- B. Y. Wu, Y. C. Chan, A. Middendorf, X. Gu and H. W. Zhong, J. Environ. Sci., 2008, 20, 1403–1408 CrossRef CAS.
- T. E. McKone and E. G. Hertwich, Int. J. Life Cycle Assess., 2001, 6, 106–109 CAS.
- B. P. Weidema, Ecol. Econ., 2009, 68, 1591–1598 CrossRef.
- J. Hall, R. Viney, M. Haas and J. Louviere, J. Bus. Res., 2004, 57, 1026–1032 Search PubMed.
- R. Gates, C. McDaniel and K. Braunsberger, J. Bus. Res., 2000, 48, 247–257 Search PubMed.
- B. P. Weidema and M. S. Wesnæs, J. Cleaner Prod., 1996, 4, 167–174 CrossRef.
- A. M. Law and W. D. Kelton, Simulation Modeling and Analysis, McGraw-Hill, 2000 Search PubMed.
- C. A. G. Quispe, C. J. R. Coronado and J. A. Carvalho Jr., Renewable Sustainable Energy Rev., 2013, 27, 475–493 CAS.
- A. McCulloch, P. M. Midgley and P. Ashford, Atmos. Environ., 2003, 37, 889–902 CAS.
- B. L. Cohen, Am. Sci., 1976, 64, 550–559 CAS.
- P. M. Fearnside, For. Ecol. Manage., 1996, 80, 21–34 CrossRef.
- M. H. Graham, Ecosystems, 2004, 7, 341–357 Search PubMed.
- R. B. Norgaard, J. Environ. Econ. Manage., 1990, 19, 19–25 CrossRef.
- D. F. Rodríguez-Vallejo, G. Guillén-Gosálbez and B. Chachuat, ACS Sustainable Chem. Eng., 2020, 8, 3072–3081 Search PubMed.
Footnote |
| † Electronic supplementary information (ESI) available. See DOI: 10.1039/D0GC00058B |
| This journal is © The Royal Society of Chemistry 2020 |


