
 Open Access Article
 This Open Access Article is licensed under a Creative Commons Attribution-Non Commercial 3.0 Unported Licence
Solid state thermomechanical engineering of high-quality pharmaceutical salts via solvent free continuous processing†
Md Sadeque Hossain
Mithu
 ab,
Steven A.
Ross
ab,
Bruce D.
Alexander
a and
Dennis
Douroumis
*ac
ab,
Steven A.
Ross
ab,
Bruce D.
Alexander
a and
Dennis
Douroumis
*ac
aFaculty of Engineering and Science, University of Greenwich, Medway Campus, Chatham Maritime, Kent ME4 4TB, UK. E-mail: d.douroumis@gre.ac.uk
bCubi-Tech Extrusion Ltd., Sextant Park, Neptune Close, Medway City Estate, Rochester, Kent ME2 4LU, UK
cCIPER Centre for Innovation and Process Engineering Research, Kent ME4 4TB, UK
First published on 23rd December 2019
Abstract
Thermomechanical engineering of pharmaceutical salts in the solid state using continuous extrusion processing (ssTME) is a new novel manufacturing approach. In the present work, we introduce a paradigm for the synthesis of ketoconazole – oxalic acid and ciprofloxacin – maleic acid salts by imparting temperature, shear rate and stress in comparison to liquid assisted grinding (LAG) approach. We demonstrated that thermomechanical synthesis is advantageous by producing high quality and pure, solvent-free pharmaceutical salts by tailoring extrusion processing variables.
1. Introduction
In the last 20 years, the concept of pharmaceutical salt engineering has attracted tremendous interest. Salts are defined as crystalline materials composed of two or more different molecules, typically drug and salt formers in the same crystal lattice, where the components in the crystal lattice are in an ionized state and interact via ionic interactions.1 The development of pharmaceutical salts offers an efficient way to alter the physicochemical properties of a drug substance (e.g. dissolution rate, intrinsic solubility, hygroscopicity, melting point) and subsequently, to enhance bioavailability, stability, and processability.2 Typically, salt formation is the most preferred method for enhancing the properties of poorly bioavailable API in the pharmaceutical industry, with over half of the top 200 prescription drugs currently approved for use in the USA being pharmaceutical salts.3To accommodate this demand, the pharmaceutical industry employs a range of salt production processes such as; single and multiple effect evaporation, solvent recrystallisation methods, Mechanical Vapor Recompression, solid and liquid assisted mechanochemical grinding as well as a range of emerging microfluidic based methods.4 However, many of these processing strategies have a number of reported issues, such as low yield, incomplete reaction, long processing times and high waste content.5 Many of these issues are the result of two significant issues with current methods of salt production, and that is they are mostly batch production methods and require a large a solvent component.
One prevalent issue plaguing pharmaceutical salt development is the batch production nature associated with most of the widely used salification methods. Batch manufacture is a long-standing obstacle in the pharmaceutical industry, accounting for higher numbers of processing steps, increased manufacturing costs, lower yields and increased environmental impact when compared to continuous processing.6 One recent perspective found an overall 10.2% reduction in resource consumption over the process, plant and industrial level when using continuous methods over batch production, highlighting the need for a switch to continuous manufacturing to promote sustainability.7
Another common problem plaguing the traditional manufacturing methods of salts is that they require solvent addition to facilitate the process. Though solvents use in salification has long been seen as a necessary catalyst, it brings with it a range of issues. Due to the ionic nature of salts, they have a propensity for solvate formation.8 Solvate formation is an undesirable by-product in salt processing, as the additional agent can react with the bulk constituents, potentially causing uncontrollable changes to the physiochemical properties of the product, leading to incomplete transformations and low-purity batches and the creation of more industrial waste.9 This by-product has been shown as difficult to control, due to the relative unpredictability of solvate formation across similar batches.10 Another drawback of organic solvent use in pharmaceutical processing is the shear amount of waste that it accounts for, with it being estimated that solvents account for 50% of green-house gas emissions from pharmaceutical manufacture.11 In addition, the use of organic solvent requires the implementation of extra waste disposal systems, raises the risk of environmental hazards and more volatile solvents can impose increased health and safety considerations. These issues highlight the need to develop solvent free process's for pharmaceutical manufacture, with one retrospective stating that “The best solvent, is no solvent” and concluding that the replacement of solvents with greener alternatives is an important step on the road to sustainability.12
One alternative to liquid assisted methods is neat (solid state) mechanochemical grinding, however, with the lack of a solvent to act as a catalyst during pharmaceutical process, there is often insufficient energy present to facilitate a complete conversion from one form to another.12,13 Recently, milling technologies, such as mixer and ball milling, have been highlighted for their use as a solvent-free method of mechanochemical processing, with the shear forces provided by the balls as a way to introduce more energy to the system without the need of solvent.14 However, milling technologies still have issues with their limited scalability and are batch processed, increasing their environmental impact. Furthermore, solid-state methods have been shown as slower and display reduced batch purity when compared to Liquid assisted grinding methods (LAG).15
Recently extrusion processing has seen increased use as an environmentally friendly, solvent-free, continuous technology for the synthesis of pharmaceutical products including salts and cocrystals.16 The application of elevated temperatures during the extrusion process, in combination with high-shear mixing via co-rotating twin screws, has been shown to compensate for the lack of a solvent component, producing high-purity pharmaceutical products through continuous production.17 Extrusion processing is gaining attraction as a more environmentally friendly, scalable and solvent-free approach to pharmaceutical processing, with its potential for organic synthesis through condensation reactions and cocrystal production being widely reported.18
In this study, we introduce a solid-state thermomechanical extrusion process (ssTME) for the continuous synthesis of two different pharmaceutical salts with high quality and yield, fast processing times and complete process control without using any solvent. It is important to emphasise that the solvent free synthesis of pharmaceutical products with high throughput is an attractive alternative for modern manufacturing processes. Prior to the processing of drug-former pairs and evaluation of extrusion as a continuous process for the thermomechanical synthesis of salts, we employed liquid assisted grinding (LAG) as a conventional process for comparison purposes. LAG has been used for screening and optimisation of different multicomponent pharmaceutical products in small scale productions.19 In order to demonstrate the potential of the system process, two well studied pharmaceutical salts, ketoconazole–oxalic acid (KTZ–OA) and ciprofloxacin–maleic acid (CFX–MA) were selected for processing.
2. Experimental
2.1 Chemicals
All chemicals were purchased from Sigma-Aldrich Company, Ltd (Gillingham, UK) except Ciprofloxacin, which was obtained from TCI (Belgium) and was used as received. The ssTME and LAG processes are discussed below.2.2 Solid-state thermomechanical extrusion process (ssTME)
KTZ oxalate extrusion was performed on a co-rotating twin screw extruder Eurolab-16 (Thermo Fisher, Germany). KTZ and OA (1![[thin space (1/6-em)]](https://www.rsc.org/images/entities/char_2009.gif) :1.1; molar stoichiometric ratio) were blended together for 10 minutes in a Turbula TF2 mixer (Basel, Switzerland) to produce a uniform mix. The blended physical mixture of KTZ and OA was then added into the feeder of the extruder. In this study, a number of variable and non-variable processing parameters were explored, to find the optimal processing conditions. Salts were extruded along a 16 mm, 25 L/D barrel by two 15.6 mm co-rotating twin screws with a 0.47m2 L−1 clearance space. Extruder contains 9 separate heating zones, which were set to variable temperatures during optimisation (Table 1). Screws configuration consisted of 8 zones, 4 conveying zones and 3 kneading zones and one discharge zone. There were 22 individual conveying elements used along the screw profile and 8 kneading elements at 60 and 90° in zone A, 6 kneading elements at 60 and 90° angles in zone B and 12 kneading elements at 90° in zone C (full screw design is available in the ESI†). The kneading zones were designed this way to provide high shear mixing in the initial extruder zones to encourage interaction. The screw configuration remained constant across the different processing conditions. Critical processing parameters such as temperature, screw speed and feed rates were varied across experiments in order to find the optimal extrusion conditions for the salts and can be seen in Table 1. No Die was used in his experiment. After ssTME processing, extruded samples were collected and further analysed. For the ciprofloxacin (CFX) maleate extrusion, a physical mixture of CFX–MA (1:1; molar stoichiometric ratio) was blended, as before, and transferred into the feeder. The material was fed from a single-screw volumetric feeder (Brabender Technology, Germany), which was calibrated to feed into the first feed port in conveying zone 1 at 0.25 kg h−1 (35%) to 0.3 kg h−1 (40%) for CFX–MA and 0.3 kg h−1 (38%) for KTZ–OA. Extruded materials were collected at discharge zone and further analysed.
:1.1; molar stoichiometric ratio) were blended together for 10 minutes in a Turbula TF2 mixer (Basel, Switzerland) to produce a uniform mix. The blended physical mixture of KTZ and OA was then added into the feeder of the extruder. In this study, a number of variable and non-variable processing parameters were explored, to find the optimal processing conditions. Salts were extruded along a 16 mm, 25 L/D barrel by two 15.6 mm co-rotating twin screws with a 0.47m2 L−1 clearance space. Extruder contains 9 separate heating zones, which were set to variable temperatures during optimisation (Table 1). Screws configuration consisted of 8 zones, 4 conveying zones and 3 kneading zones and one discharge zone. There were 22 individual conveying elements used along the screw profile and 8 kneading elements at 60 and 90° in zone A, 6 kneading elements at 60 and 90° angles in zone B and 12 kneading elements at 90° in zone C (full screw design is available in the ESI†). The kneading zones were designed this way to provide high shear mixing in the initial extruder zones to encourage interaction. The screw configuration remained constant across the different processing conditions. Critical processing parameters such as temperature, screw speed and feed rates were varied across experiments in order to find the optimal extrusion conditions for the salts and can be seen in Table 1. No Die was used in his experiment. After ssTME processing, extruded samples were collected and further analysed. For the ciprofloxacin (CFX) maleate extrusion, a physical mixture of CFX–MA (1:1; molar stoichiometric ratio) was blended, as before, and transferred into the feeder. The material was fed from a single-screw volumetric feeder (Brabender Technology, Germany), which was calibrated to feed into the first feed port in conveying zone 1 at 0.25 kg h−1 (35%) to 0.3 kg h−1 (40%) for CFX–MA and 0.3 kg h−1 (38%) for KTZ–OA. Extruded materials were collected at discharge zone and further analysed.
| Formulation | Thermal profile (°C) | Screw speed (rpm) | Feed rate (%) | Torque (%) | Residence Time (s) | Salt purity (%) |
|---|---|---|---|---|---|---|
| CFX–MA F1 | 100-160-160-160-200-200-200-200-200 | 50.0 | 40 | ∼10 | 97.2 | 10.6 |
| CFX–MA F2 | 100-160-160-160-160-160-160-160-160 | 70.0 | 35 | ∼10 | 69.5 | 93.0 |
| CFX–MA F3 | 80-120-120-120-140-140-140-140-140 | 70.0 | 35 | ∼15 | 69.5 | 96.6 |
| CFX–MA F4 | 80-100-100-130-130-130-100-100-100 | 50.0 | 40 | ∼20 | 97.5 | 99.0 |
| KTZ–OA | 50-75-110-175-185-185-185-185-185 | 50.0 | 38 | ∼15 | 97.5 | 100.0 |

|
||||||
2.3 Liquid assisting grinding (LAG) process
LAG was performed in 25 ml stainless steel jars using an oscillatory ball mill (Retsch MM 400, Germany). Each jar contained one stainless steel ball. Grinding was at a frequency of 19 Hz. A physical mixture of bulk KTZ and OA (1:1.1 molar stoichiometric ratio) was grinded together for 30 minutes. A 200 μl per g solvent mixture of acetone and methanol (1:1) was used during the process. For the case of CFX and MA (1:1 molar stoichiometric ratio), a solvent mixture of water and ethanol (1:1) was used for the grinding process for the same duration of time. Batches size was 2 g and performed in triplicate.
2.4 Powder X-ray diffraction (PXRD)
PXRD analyses were performed using a D8 Advanced X-ray diffractometer (Bruker, Germany) where the data were collected in the 2θ range 2–55° at room temperature. EVA phase analysis (Bruker, Germany) software was used to analyse the data and compare the peak positions between bulk materials and processed ones. The structure of KTZ oxalate and CFX maleate salt was obtained from the Cambridge structural database (CSD). Rietveld refinements were performed by using TOPAS V4.2 (Bruker) software.2.5 Scanning electron microscopy (SEM)
The morphology of extruded products was examined by using SEM (Hitachi SU8030, Hitachi High-Tech, Japan), operating at a voltage of 1 kV. A small portion of the sample was placed on a sample stub and was subject to analysis after coating was done by chromium for about 3 min.2.6 Particle size distribution (PSD)
Particle size distribution of salts was determined using a laser diffraction instrument (Mastersizer 2000, Malvern, UK), equipped with a dry powder dispersion accessory (Scirocco 2000, Malvern UK) with a controllable airflow set to 2 bar applied pressure to break apart any agglomerates. Bulk KTZ, CFX and post extruded samples were placed into a vibratory tray, set at 50% to continuously control the rate of powder flow and assist breaking apart agglomerates. Sampling time was set at 15 s and each sample was measured three times, in continuous sequence to assist the reproducibility of the batches. A similar procedure was applied for the measurement of particle size distribution for the liquid assisted grinded (LAG) materials.2.7 Differential scanning calorimetry (DSC)
Thermal analyses were performed using differential scanning calorimetry (Mettler Toledo 823e, Greifensee, Switzerland). Samples were accurately weighed (2–4 mg), placed into aluminium pans and heated over a temperature range starting from 0 °C to 300 °C at a scan rate of 10 °C min−1 under an atmosphere of nitrogen using a gas flow of 50 ml min−1. STARe software was used to analyse the data.2.8 Fourier transform infrared spectroscopy (FTIR)
The IR Spectra of analysed salts was obtained via FTIR (Spectrum Two, PerkinElmer, UK) recorded in the wavelength region of 4000–400 cm−1. The FTIR was equipped with OMINC® software and a diamond universal attenuated total reflection unit. The samples were placed on the diamond crystal and a pressure clamp was used to ensure contact between the samples and crystal. In all cases, background spectra were subtracted prior to analysis. All spectra were collected as a mean of three scans at a resolution of 4 cm−1.2.9 Molecular modelling
All molecular modelling performed using Mercury CSD 3.7. CCDC 970189 (KTZ–OA) and 1501152 (CFX–MA)† contain the crystallographic data for reference in this paper.2.10 Dissolution studies
The dissolution studies were conducted using a USP method (Varian 705 DS dissolution paddle apparatus; Varian Inc., North Carolina, US). For KTZ, acetate buffer pH 4.4 was made by using glacial acetic acid and anhydrous sodium trihydrate. For CFX, acidic media pH 1.2 and phosphate buffer pH 6.8 was used as the dissolution medium. 100 mg of bulk KTZ/CFX and an equivalent amount of extruded and grinded powder was placed in the apparatus. The total buffer used in each apparatus was 900 ml and the temperature of the buffer was set 37.5 ± 1 °C with a rotation speed of 100 rpm. 5 ml of sample was collected from the apparatus after 15 min and immediately replaced by 5 ml of buffer. This process was repeated at the following time intervals: 30, 60, 90, 120 and 180 min. All samples collected at different time intervals were taken immediately for HPLC analysis.2.11 High-performance liquid chromatography
The amount of KTZ and CFX present in the collected samples was determined by HPLC analysis. A fresh mobile phase consisting of methanol: water: triethylamine (TEA) 80:20:0.02% (v/v) was used and the flow rate of the mobile phase was 1 ml min−1. The injection volume of the sample was fixed at 20 μl and the eluent was monitored with a UV detector set at a wavelength of 240 nm. The pressure bar of the column was 110 bar and the retention time for KTZ peak was ∼3.0 min. The results were integrated by using Chemstation® software. For CFX detection, the mobile phase was 2% acetic acid: acetonitrile (70:30; v/v). The wavelength of the detector was set at 264 nm and pressure bar of the column was 137 bars. The retention time was about 4.73 min. All other parameters were the same as for KTZ detection, including flow rate.
3. Results and discussion
During the extrusion, both drug-former blends were subjected to thermal and mechanical processing within the heated barrel using specific screw configurations. In addition, the processing parameters such as feed rate, screw speed, and thermal profile were optimised to achieve a complete transformation of the raw materials to pharmaceutical salts, with CFX–MA F4 showing to be the most optimal processing method. CFX–MA F1 produced sludge, as the screw temperatures were too high and the components degraded, while CFX–MA F2 and F3 were shown to produce inferior quality salts after PXRD evaluation (Table 1). Investigation of the extruded powder revealed some blackened material in the batch, indicating that the screw temperatures were still too high, leading to the degradation of some of the malic acid in the batch before it could salify.21 Due to the different melting temperatures of the starting materials the processing temperature profile of KTZ–OA was found between the melting points of the reactants (50°, 75°, 110°, 175°, 185°, 185°, 185° and 185 °C). In contrast, the CFX–MA processing temperatures were approximately 10 °C below the melting point of MA (50°, 80°, 100°, 100°, 130°, 130°, 130° and 100 °C). This is not unusual for salt extrusion processing and it is related to the drug-former miscibility. Table 1 shows the thermal profiles used for the optimization of CFX–MA salts which shows that lower processing temperatures resulted in better salt crystallinity. It is evident that the processing temperature profile plays a key role in the salt formation and it is important to identify the suitable settings for the synthesis of high-quality salts. At the end of the ssTME process, the formed salts were collected. The CFX–MA and KTZ–OA salts both presented a granular morphology after ssTME processing. The crystal structure of KTZ–OA can be seen in Fig. 1A which shows a single ketoconazole and oxalic acid molecule in one asymmetric unit. This compound is classed as an oxalate salt because proton transfer takes place between the hydroxyl O-atom of the OA molecule and the imidazole N-atom of the KTZ molecule, resulting in then KTZ and OA moieties being bonded via a N (1)–H(1A)⋯O(4A) hydrogen bond. Strong dimers are formed between the OA moieties via O(1A)–H(1AA)⋯O(3A) bidentate intermolecular hydrogen bonds. The imidazole ring of the KTZ molecule is linked to the contiguous OA dimers through a C–H⋯O hydrogen bond with the carbonyl O-atom of the OA moiety. The crystal packing arrangement of KTZ–OA salts can be seen in Fig. 1B, showcasing the stacking interactions between KTZ's imidazole rings. The 5- and 6-member rings adopt an envelope and chair conformation respectively.4a The CFX–MA salt forms when one ciprofloxacin cation and one maleate anion crystallize within the monoclinic P21/n space group. The CFX and MA ions are joined via two charged assisted N+–HO hydrogen bonds which form a closed tetrameric ring, while weaker van der Waals interactions occur between the neighbouring units20 (Fig. 2A). Pi stacking occurs between the parallel quinolone moieties of the ciprofloxacin molecules (Fig. 2B).9Fig. 3 shows SEM images of the KTZ–OA, and CFX–MA salts which appear to be aggregates of smaller particles with spherical-shaped morphology. In comparison the bulk materials particle size were slightly smaller and showed no apparent aggregates to be present. The agglomeration of the extrudates is attributed to the partial melting of the raw materials and the molecular interactions of the drug-former pairs during processing.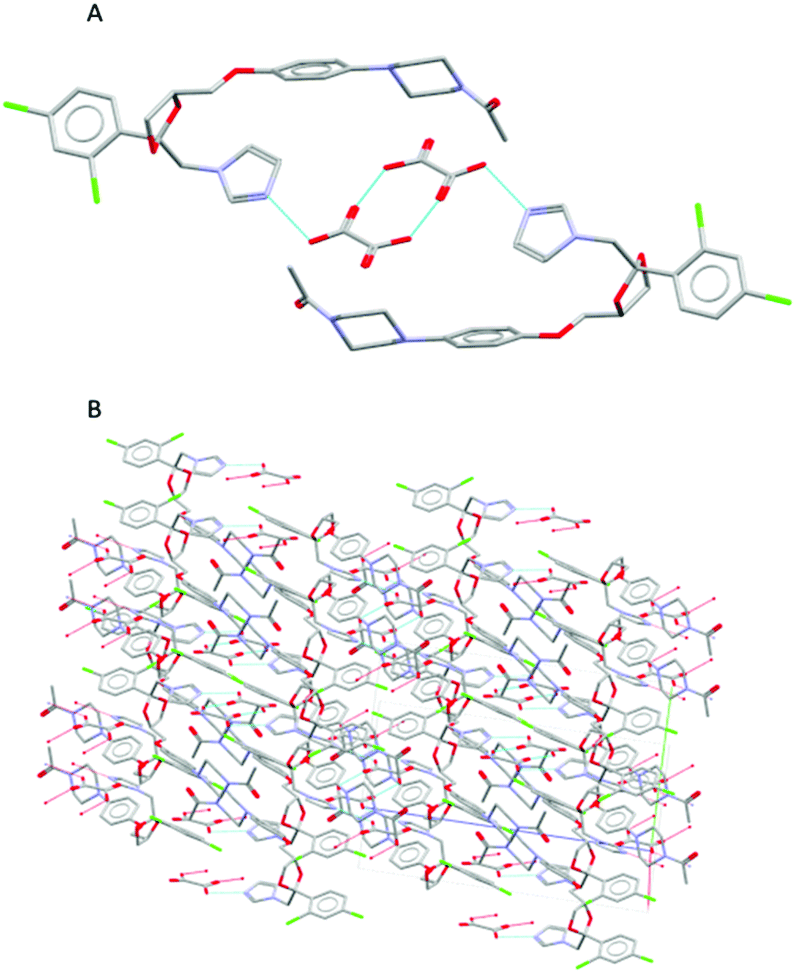 | ||
| Fig. 1 (A) Hydrogen bonds between OA dimers and imidazole ring of the KTZ moiety (B) crystal packing projections for KTZ–OA salt. Other hydrogen and van der Waals bonds have been omitted for clarity. | ||
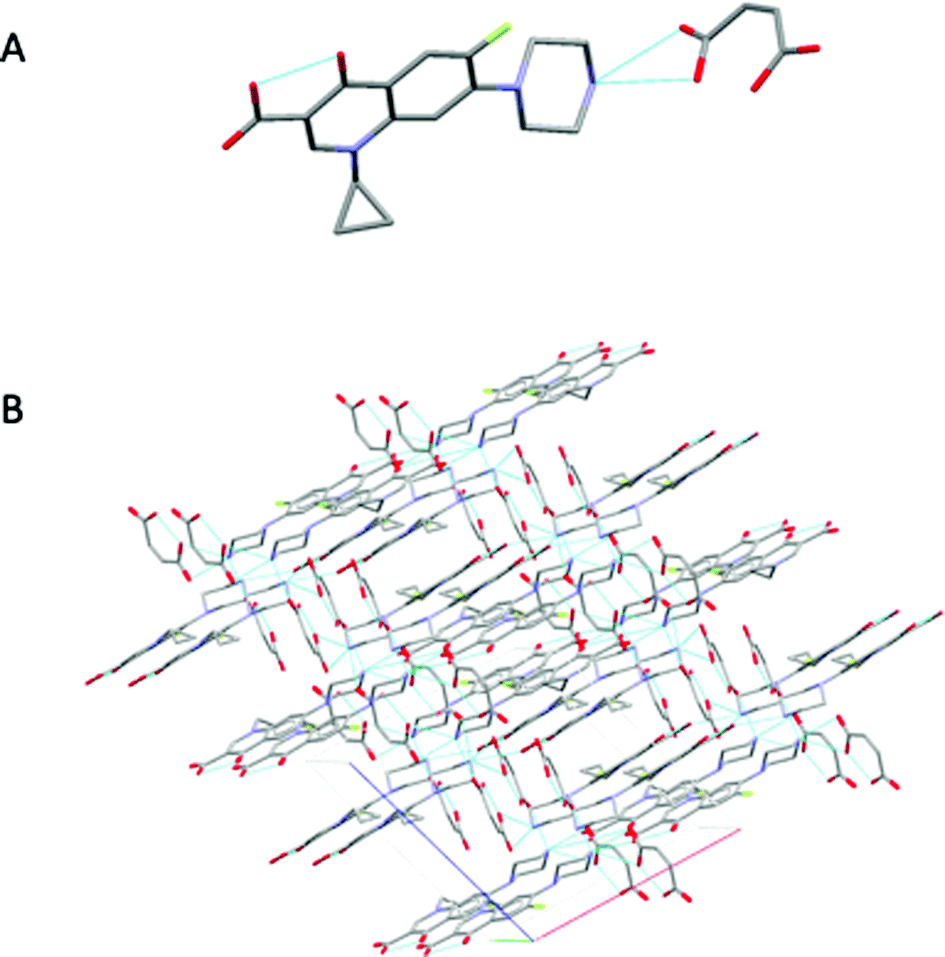 | ||
| Fig. 2 (A) Interaction between the CFX and MA molecules via duel N+–HO hydrogen bonds (B) crystal packing projections for CFX–MA salts. Other hydrogen and van der Waals bonds have been omitted for clarity. | ||
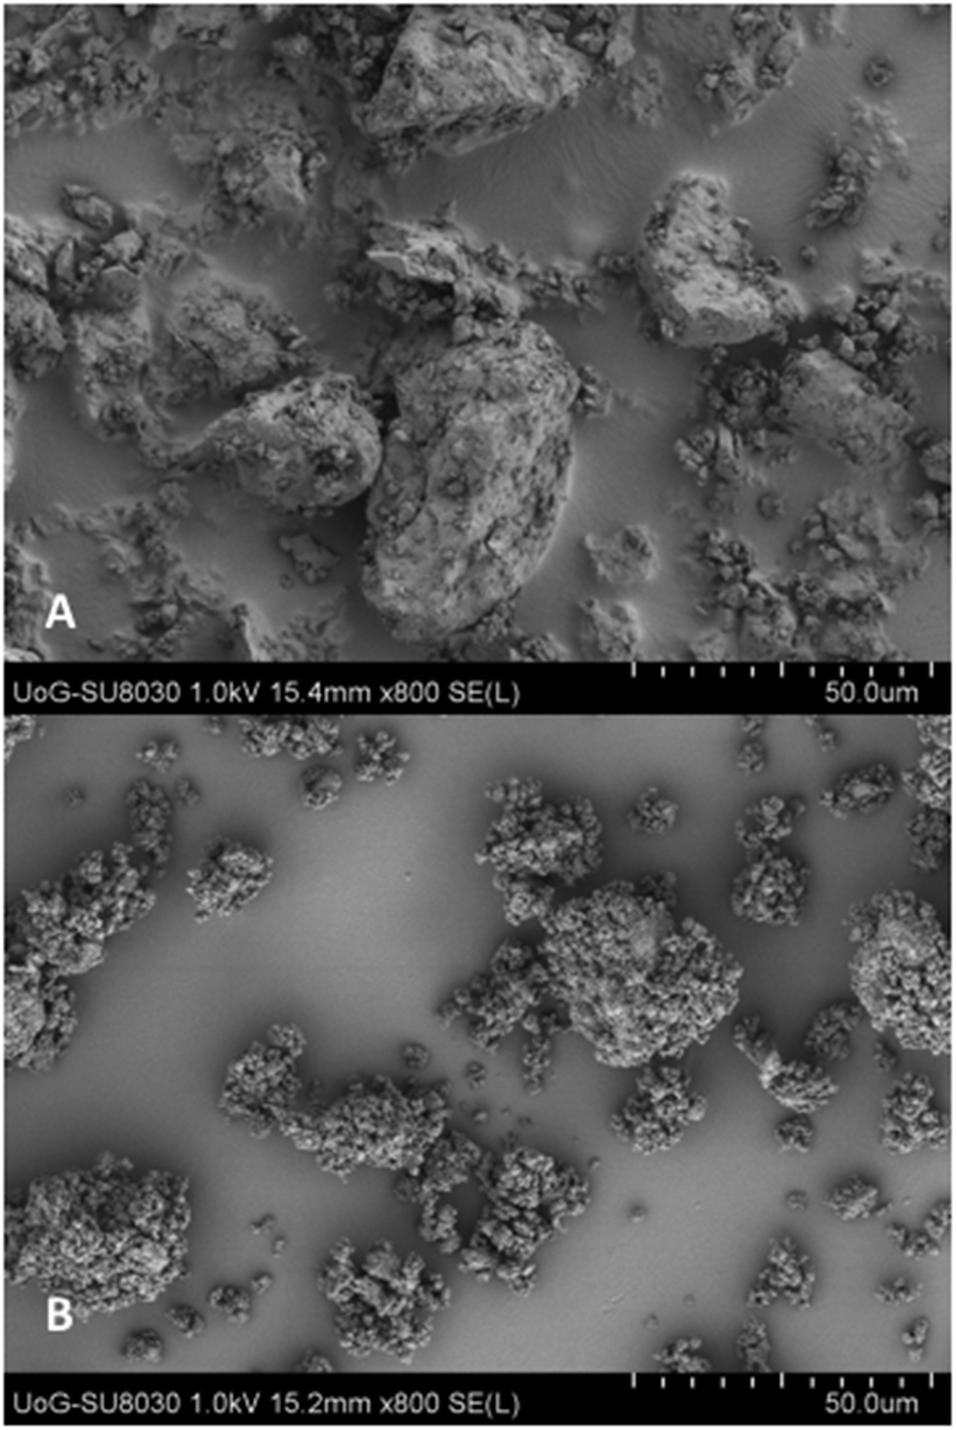 | ||
| Fig. 3 SEM images of (A) KTZ–OA and (B) CFX–MA synthesised by ssTME. | ||
The graph in Fig. 4 illustrates the particle size distribution, showing a significant decrease of the small particle size fractions (from 5–40 μm), in the extruded salts compare to the bulk drug substance suggesting a change of the size during extrusion processing. The rest of the particle sizes are distributed between 40–300 μm, with negligible amounts above 500 μm. By comparing the particle size of bulk KTZ and CFX to that of the feeding materials (ESI†) it is evident that the thermomechanical processing reduced the fines and increased particle agglomeration. The LAG processed salts presented particle size distributions similar to the ssTME produced batch. Although SEM results show the presence of big aggregates in the extruded materials which can be attributed to the partial melting of the raw materials and the molecular interactions of the drug-former pairs during processing. The partial melting of the raw materials facilitates the formation of salts during the extrusion process and as salts were formed, these aggregates don't affect the rate of dissolution, as they quickly deagglomerate once added into the dissolution medium. A similar morphological effect was observed in the salt prepared by LAG, which was the effect of milling for a longer time and use of small amount of solvents which worked as a catalyst for the salt formation in grinding process. One outlier here was the CFX–MA amounts processed via LAG which produced aggregates of a much larger particle size distribution compared the ssTME salts. Though morphologically, as observed through SEM, the CFX–MA salts are near identical, whether produced by LAG or ssTME, it was observed during dissolution that the LAG produced CFX–MA salts were slower to disintegrate, partially contributing to their slower dissolution rate compared to the ssTME produced salts. It should be further noted that the CFX–MA salts showed great variation in particle size distribution depending on how they were processed. As Fig. 4 shows the ssTME salts had almost double the number of particles <10 μm when compared to LAG produced salts, while the LAG prepared sample had almost double the number of particles >100 μm in contrast to the ssTME salts. In contrast the KTZ–OA salts tended to be much similar in particle size distribution, though there were noticeably more particles >100 μm in the ssTME salts. This is likely due to the shorter formation time seen for CFX–MA during ssTME processing, providing a reduced chance for aggregate formation.13 The SEM images for bulk and LAG processed materials can be found in the ESI.†
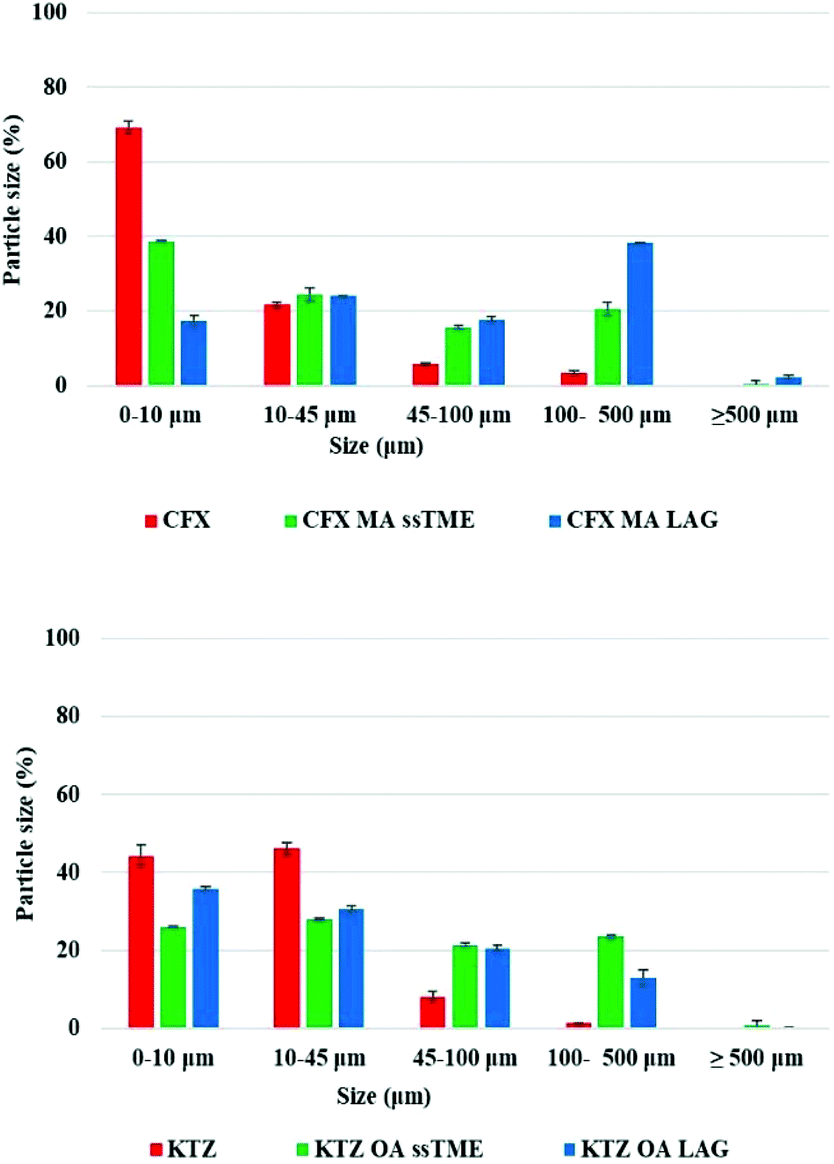 | ||
| Fig. 4 Particle size distribution of bulk materials and salts synthesised by ssTME and LAG. | ||
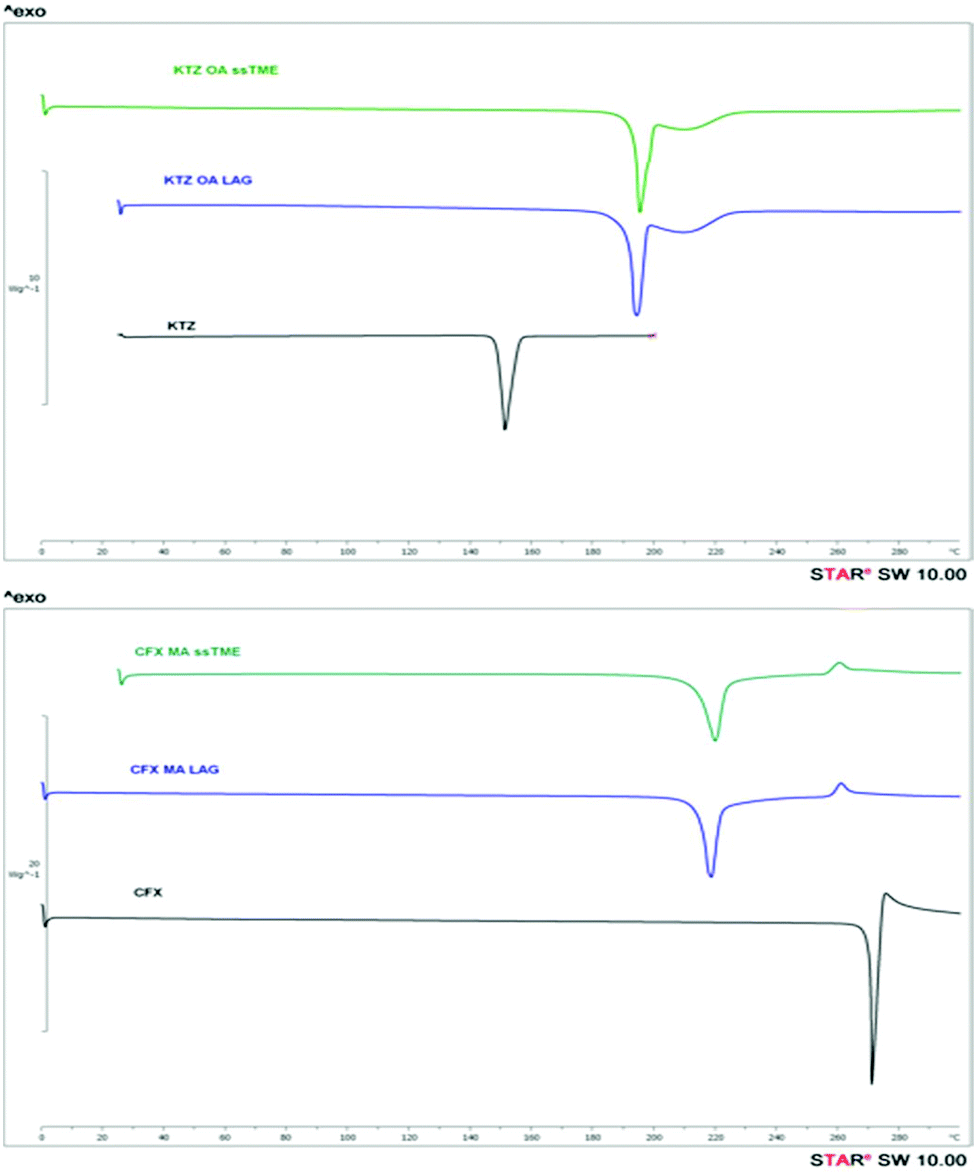
Further characterisation involved DSC and PXRD analysis to evaluate the quality of the ssTME salts. The bulk KTZ and CFX showed melting endotherms at 151.19 °C and 270.0 °C respectively. For the CFX–MA physical mixture the low endothermic peaks at 114.77 °C and 205.77 °C were attributed to the eutectic and melting point of the salt respectively. The analysis of KTZ–OA physical mixture indicates the eutectic melt occurring at 140.9 °C. The thermograms of KTZ–OA, and CFX–MA in Fig. 5, presented a single endothermic peak at 193.26 °C and 219.86 °C respectively which are completely different from those of the bulk materials. The presence of a single melting endotherm indicates the complete conversion of the drug-former pairs, with the absence of any residual bulk constituents, suggesting the formation of a new entity.
 | ||
| Fig. 5 DSC thermograms of bulk KTZ, CFX and synthesised KTZ–OA, CFX–MA salt. | ||
It is also evident that due to the excellent mixing, ssTME processing facilitated strong interactions between the functional groups of the reactants. The DSC analysis of the LAG synthesised salts showed similar melting endotherms at 195.37 °C and 222.92 °C but at slightly higher temperatures. The melting endotherm of KTZ–OA appeared at higher temperatures of those of the bulk materials as a result of high packing efficiency (high density and packing index) caused by stronger ionic bonds in the salt. From Fig. 5 is evident that ssTME synthesised salts were of similar quality to LAG processing. The PXRD patterns of KTZ–OA, and CFX–MA salts are shown in Fig. 6 which confirm the synthesis of the salts with intensity peaks at completely different 2theta values of the starting materials. For the KTZ–OA salt intensity peaks appeared at 8.75°, 10.81°, 11.95°, 13.27°, 17.72°, 18.5°, 19.89°, 20.42°, and 28.14° 2theta values while for CFX–MA salt at 10.42°, 11.25°, 13.43°, 14.65°, 17.21°, 20.37°, 24.74° and 27° 2theta values.
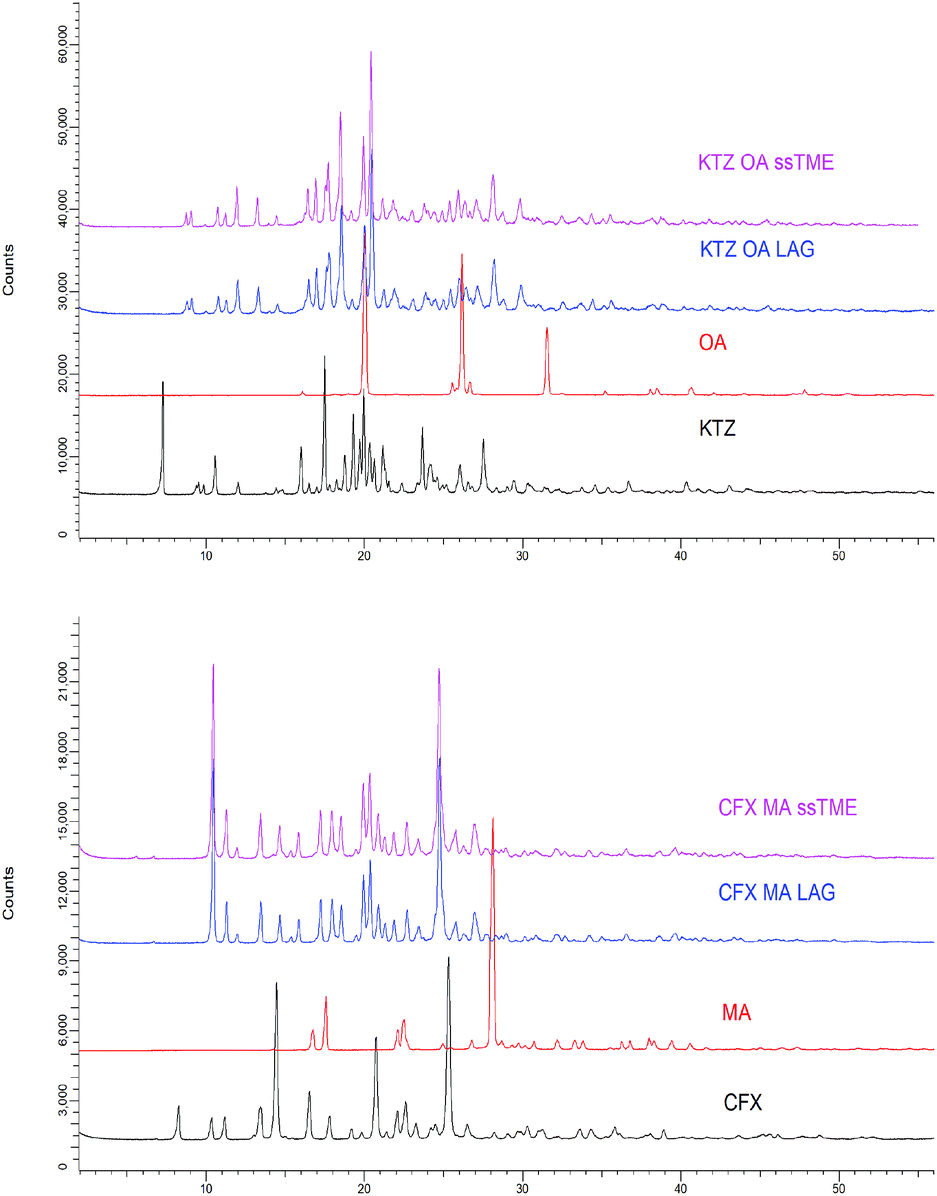 | ||
| Fig. 6 PXRD diffractograms of the bulk constituents, the KTZ–OA (top) salts and the CFX–MA (bottom) salts processed by ssTME and LAG. | ||
The KTZ–OA diffraction patterns compared to those obtained by Martin et al. were found to be in good agreement.4a,22 Rietveld refinements were conducted using TOPAS V4.2 to validate the crystallinity of the extruded salts and compare the structure of the salts produced in this study to simulated patterns taken from the Cambridge structural database (CSD), to estimate the percentage of the batch which formed into a salt, whilst identifying any remaining bulk constituents or contamination. Consensus regarding Rietveld refinements is that if the weighted profile R-factor (Rwp) is within 3× the expected R factor (Rexp), the fitting can be considered accurate.23 Here, each Rietveld fitting is within this limit, with no fitting receiving goodness of fit (GoF) above 3. Furthermore, the model of the observed and calculated pattern is chemically plausible, so the standard of the fittings done in this work can be considered of good quality. As can be seen in Fig. 6, the measured pattern for the KTZ–OA salts closely match the simulated pattern with minimal spikes in the difference plot, indicating a close match between the salts produced in this work and the CSD reference structure. This confirms that the extruded salt is completely crystalline with no unprocessed material present. All peaks from the KTZ–OA sample match that of the simulated structure indicating pure salt formation, with a GoF value of 1.85 suggesting the fitting is of excellent quality. Similarly, the newly obtained diffraction patterns of the extruded CFX–MA were compared with reported data from the CSD. Surov et al., previously reported three polymorphic forms CFX–MA and one hydrate with the stability of the three polymorphs being in the following descending order form I > form II > form III.9 Both the extruded and LAG produced CFX–MA salts were fitted to reference patterns of the salt from all three polymorphs to assess the physical form. The salts processed via ssTME show complete conversion into form II, indicating pure salt formation has taken place. This matches the LAG produced salts, which also underwent full conversion into form II. This shows complete salification into a stable polymorph form is possible with ssTME.
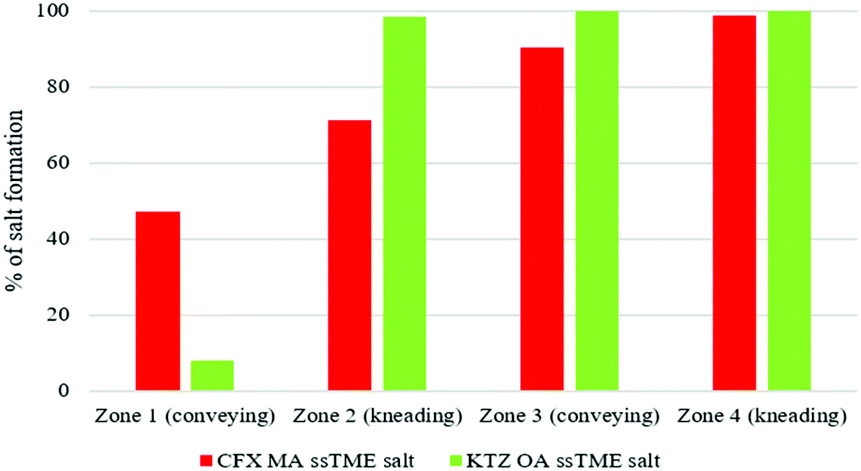
Off-line sample analysis, from different extrusion zones, revealed that the salt formation was initiated in conveying zone 1 and completed in zone 3. It is evident that the configuration of mixing elements at 60 and 90° angles played a significant role in the salt formation. Additional extrusion studies involved investigating the transformation pathway of the drug-former pairs along the extrusion barrels.
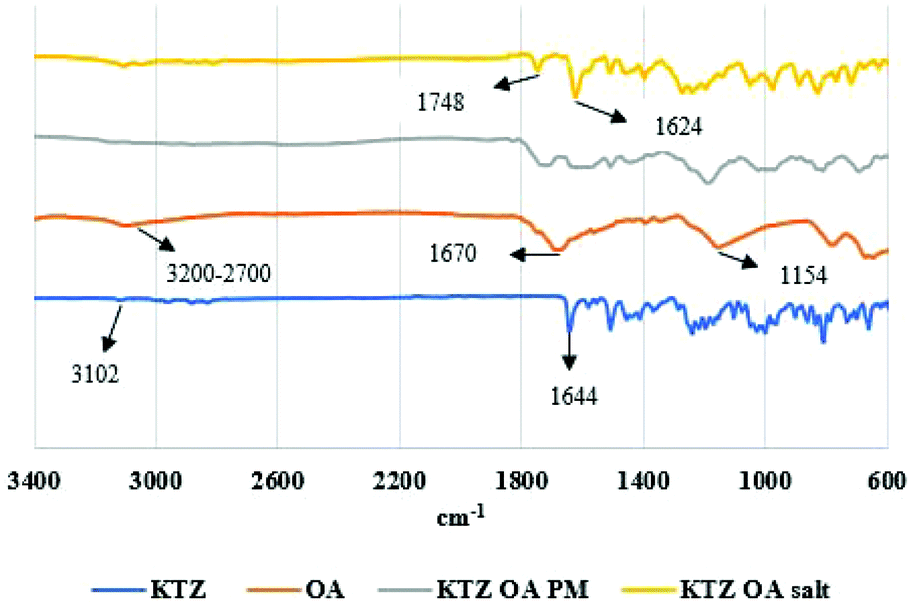
As shown in Fig. 7 the transformation pathways vary upon the drug-former pair. It is evident that, although the same screw configuration was used in both cases, KTZ–OA was almost completely converted to salt at 98.3% in the first kneading zone. In contrast, CFX–MA was gradually transformed across the process, being 71.8% complete after kneading zone 1, 90.4% complete after kneading zone 2 and 98.65% after kneading zone 3, being fully transformed after collection at the discharge zone. It is usually accepted that for stable salt formation there should be a minimum difference of about 3 units between the pKa values of the salt forming groups. Although, for both cases, KTZ–OA and CFX–MA, pKa difference between salt forming groups were more than 3, KTZ–OA demonstrated a faster transformation to the final salt form compared to CFX–MA. This could be attributed to the robust dimer forming ability of OA molecules with the imidazole rings of the KTZ molecules. This salt paring has more readily available donor and acceptor sites on the molecule surface to form these charged dimers with less energy required than seen with the CFX–MA pair. Therefore, it is likely the heat applied during the first conveying stage in extrusion provided the necessary energy required to start the formation of bonds between the ionized ketoconazole and oxalate moieties. Due to this relative ease in bonding, by the time the KTZ–OA mixture had passed the first kneading zone, salification was mostly complete. Conversely, the CFX–MA pairs required greater energy to promote salification, which occurred later in the extrusion process after being exposed to the high-shear mixing in the first and second kneading zones. Similar to cocrystals, the mechanism of action for salification is through eutectic formation.12,16,20 Due to the elevated temperature of the extruder barrel weakening bonds within the bulk materials, and through dispersive and distributive mixing occurring in the kneading zones, causing particle size reduction and homogeneous spatial distribution between the two materials within the extruder barrel, a eutectic melt occurs within the extruder barrel. The elevated temperatures and pressures inside the extruder barrel, expediates the dissolution of one constituent in the melt of the other, without reaching the materials melting points and without the presence of a solvent catalyst. Kinetic energy applied through the high shear kneading, induces viscous dissipation, further heating the mixture and thus contributing to the eutectic event. That ssTME can induce the dissipation process is a contributing factor in how salification is possible at relatively low temperatures, in the absence of any solvent. As one material dissolves into the other, the eutectic melt experiences supersaturation, which results in the formation of the new crystal form.8,13,16d The comparison of IR spectra of bulk materials with synthesised salt was studied to validate the proton transfer between the salt former and the API. KTZ showed characteristic broad NH-stretch peak at 3102 cm−1. The peak at 1644 cm−1 was observed due to carbonyl C![[double bond, length as m-dash]](https://www.rsc.org/images/entities/char_e001.gif) O stretch of KTZ (Fig. 8).24
O stretch of KTZ (Fig. 8).24
 | ||
| Fig. 7 Transformation kinetics of CFX–MA (red) and KTZ–OA (green) salts in the extrusion segments. | ||
 | ||
| Fig. 8 FTIR spectra of bulk KTA, OA, KTZ–OA physical mixture and KTZ–OA salt. | ||
Salt former OA has two COOH groups. The –C (O) OH group is characterised by the OH stretch, the CO stretch, C–O stretch, OH in-plane deformation and the OH out-of-plane deformation modes. An O–H group of oxalic acid is present in the region 3200–2700 cm−1, whilst the intense peak at 1670 cm−1 is due to CO stretching and the C–O stretching of the carboxylic acid is identified at 1154 cm−1 in the IR spectrum.25 In the KTZ OA salt, the CO group stretching of KTZ shift to 1624 cm−1, whilst a new peak can be observed at 1748 cm−1. The presence of shifting in the vibrational frequencies of KTZ and OA indicated the formation of a supramolecular hetero synthon. The loss of a broad band OH group indicated the formation of hydrogen bond in KTZ OA salt crystals.26
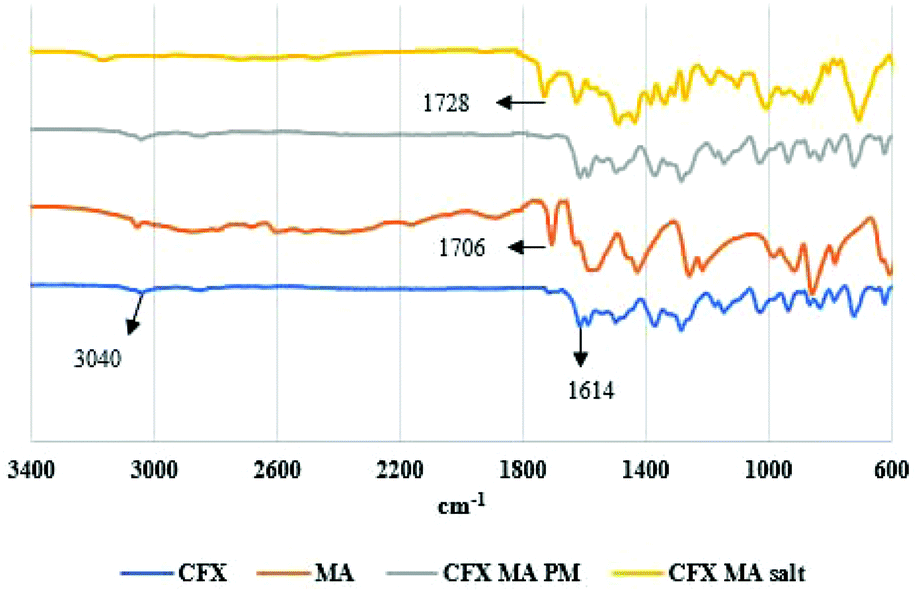
CFX showed a characteristic absorption peak at 3040 cm−1 which can be assigned to C–H olefinic and aromatic chains, with 1614 cm−1 corresponding to keto (CO) group. The carboxylic group COOH didn't appear in the IR spectra as CFX is a zwitterion. The COOH group is present in CFX–MA salt at 1728 cm−1 indicating that the zwitterionic nature of the CFX was reverted by proton transfer from the MA (Fig. 9).27
 | ||
| Fig. 9 FTIR spectra of bulk CFX, MA, CFX–MA physical mixture and CFX–MA salt. | ||
MA has an asymmetric carboxylate anion peak at 1564 cm−1 and symmetric carboxylate anion at 1430 cm−1. Analysis revealed a peak shift “N–H” stretching frequency at 3168 cm−1. This is due to hydrogen bonding between the CFX and MA molecules. The broad IR absorption frequencies 2509–2535 cm−1 indicated the protonation of the piperazinyl ring N atom (NH2+). Moreover, the appearance of two characteristic carboxylate IR absorption vibrations at 1486 cm−1 and 1436 cm−1, due to asymmetric and symmetric O–C–O stretch respectively, confirmed the proton transfer from the –COOH group in MA. The “CO” stretching frequency for MA is 1706 cm−1 whereas it is 1728 cm−1 for CFX MA salt.27 This corresponded to the dimer formation of MA molecules within the crystal packing of salt. The evidence of proton transfer between the two salt formers, in both instances, indicates the formation of salts and not the cocrystal forms of these drugs, as proton transfer between an acidic substance to a more basic one does not take place in cocrystallisation in systems where the ΔpKa difference is greater than 4.28
As has been exemplified in numerous studies, in instances where the pKa difference between a cocrystallising or salt forming acid and base is greater than 3 (ΔpKa = pKa[protonated base] − pKa[acid] > 3), salification is almost always expected. Conversely in cases where the pKa difference ≤1 then cocrystallisation is always afforded, with any system falling between that leading to less predictable outcomes.28 In a 2012 study, analysing over 6000 systems Cruz-Cabeza found that ionized acid–base complexes are seen exclusively for systems with ΔpKa > 4 and in 80% of cases with ΔpKa > 3.29 In the case of KTZ–OA, in which is protonated through the imidazole ring of KTZ, there is a pKa difference of 4.95, almost guaranteeing salt formation. This combined with the fact that the thermal profile and diffraction pattern reported herein, far more closely resemble the reported values to KTZ–OA salts than KTZ–OA cocrystals confirm that the pure salt was formed through ssTME.30 In the case of CFX–MA, as showed through the FTIR analysis, the bonding occurs through the protonation of the N atom on the piperazinyl ring, which has a pKa of 8.74.31 The proton is donated from the MA molecule (pKa = 3.51), giving a pKa Difference of 5.23, strongly indicating cocrystallisation is not possible. Combined with this, the fact that Rietveld analysis indicated a 100% match with CFX–MA salt reference data, and the fact no cocrystal form of CFX and MA has been reported, it can be confidently stated that the pure salt of CFX–MA was formed.
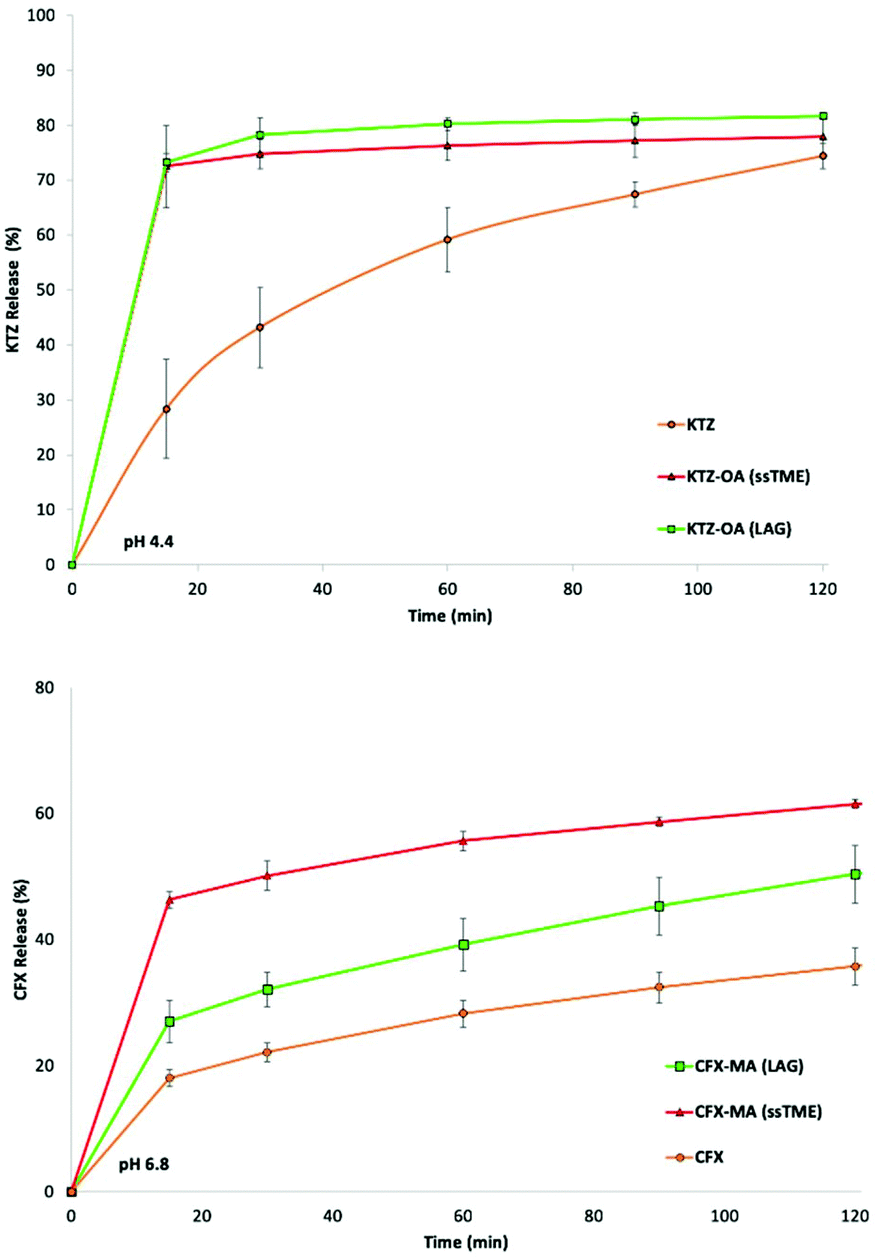
The solubility of the ssTME synthesised salts were assessed via in vitro dissolution testing (Fig. 10). The extruded salts were tested alongside their LAG produced counterparts, over a two-hour period to observe any improvement in drug release. The ssTME extruded salt showed a significantly more rapid release rate than the poorly water soluble KTZ. After 15 minutes, over 70% of the ssTME produced salt had been released into the dissolution medium, compared to the bulk KTZ which displayed only 28% release of drug over in the same time period. The ssTME produced salts reached 81% drug release after 30 minutes, before it plateaued. The bulk KTZ did not catch up for 120 minutes at which point it plateaued at 74%. Salts prepared by LAG displayed slightly less overall drug release compared to that of the extruded salt, though they shared similar release rates. KTZ is known to easily dissolve in acidic conditions but shows worse solubility the closer the medium is to neutral/basic conditions.32 As such, dissolution testing was not conducted at 1.2 pH conditions, but at 4.4 pH. The results in this study show that salt versions of KTZ can achieve greater dissolution in less basic conditions than the bulk substance. The dissolution profiles of bulk CFX and the LAG prepared and ssTME synthesised CFX–MA salts show similar findings. The extruded CFX–MA salt showed enhanced drug release over time compared to the bulk CFX at pH 6.8. The salt prepared by LAG showed better release compared to bulk CFX as well, but lesser to extruded salt. Interestingly, at pH 1.2, the release profile is different compared to pH 6.8, where bulk CFX showed more drug release than the CFX maleate salt prepared by both grinding and extrusion process (ESI†) which is due to the protonation of the piperazine ring in the acidic medium. The same behaviour for the dissolution profile of CFX was reported previously by Surov et al. and Reddy et al.33 It should also be noted that the CFX–MA salts showed greater variation in particle size, dependent on the processing method. The LAG produced salts showed a far greater particle size distribution when compared to the ssTME samples. This effect can be seen in the dissolution, contributing to the increased solubility the seen in the ssTME salts, while the larger LAG produced salts display a slower and reduced dissolution rate. Meanwhile the KTZ–OA salts displayed similar particle sizes across the two processing methods, which also correlates with the solubility profiles of the two methods, as there is less difference between the dissolution of the two KTZ–OA salts. It must be noted, however, that the media pH is still the much greater factor on the solubility of the CFX–MA salt, as with this large difference in drug release and dissolution time has been closed in the samples dissolved at 1.2 pH. Here, the dissolution rates are more similar, though the particle size effect can still be observed, as there still exists a slight increase in the CFX drug release in the smaller ssTME produced particles.
 | ||
| Fig. 10 Dissolution rates of KTZ–OA, CFX–MA salt synthesised by ssTME and LAG. | ||
4. Conclusions
In conclusion, ssTME processing has been shown as a continuous, solvent-free process for the formation of two high purity pharmaceutical salts. ssTME overcomes previously reported issues with pharmaceutical salt production, being both a continuous, scaleable process capable of excellent process control, reproducibility and high yield production, whilst also negating the use of solvents and being more cost-effective due to the smaller number of process steps. This approach opens up new avenues for the synthesis of new drug products, providing a greener approach to the conventional solvent-mediated process's for pharmaceutical salt formation.Conflicts of interest
The authors declare no conflict of interest.Acknowledgements
This project has received funding from the Interreg 2 Seas programme 2014-2020 co-funded by the European Regional Development Fund under subsidy contract 2S01-059_IMODE.Notes and references
- (a) D. P. Elder, R. Holm and H. L. D. Diego, Adv. Drug Delivery Rev., 2013, 453, 88–100 CAS; (b) Guidance for industry: classification of pharmaceutical co-crystals. FDA guidance 2016, http://www.fda.gov/downloads/Drugs/Guidances/UCM516813.pdf.
- (a) P. C. Vioglio, M. R. Chierotti and R. Gobetto, Adv. Drug Delivery Rev., 2017, 110, 86–110 CrossRef PubMed; (b) G. Zhang, L. Zhang, D. Yang, N. Zhang, L. He, G. Du and Y. Lu, Acta Crystallogr., Sect. B: Struct. Sci., Cryst. Eng. Mater., 2016, 72, 20–28 CrossRef CAS PubMed; (c) A. T. M. Serajuddin, Adv. Drug Delivery Rev., 2007, 59, 603–616 CrossRef CAS PubMed.
- D. L. Prohotsky and F. Zhao, J. Pharm. Sci., 2011, 101, 1–6 CrossRef PubMed.
- (a) F. A. Martin, M. M. Pop, G. Borodi, X. Filip and I. Kacso, Cryst. Growth Des., 2013, 13, 4295–4304 CrossRef CAS; (b) A. V. Trask, D. A. Haynes, W. D. S. Motherwell and W. Jones, Chem. Commun., 2006, 51–53 RSC; (c) S. L. James, C. J. Adams, C. Bolm, D. Braga, P. Collier, T. Friscic, F. Grepioni, K. D. M. Harris, G. Hyett, W. Jones, A. Krebs, J. Mack, L. Maini, A. G. Orpen, I. P. Parkin, W. C. Shearouse, J. W. Steed and D. C. Waddell, Chem. Soc. Rev., 2012, 41, 413–447 RSC; (d) G. Bánsághi, E. Székely, D. M. Sevillano, Z. Juvancz and B. Simándi, J. Supercrit. Fluids, 2012, 69, 113–116 CrossRef.
- (a) H. G. Moradiya, M. T. Islam, N. Scoutaris, S. A. Halsey, B. Z. Chowdhry and D. Douroumis, Cryst. Growth Des., 2016, 16, 3425–3434 CrossRef CAS; (b) R. Baumgartner, A. Eitzlmayr, N. Matsko, C. Tetyczka, J. Khinast and E. Roblegg, Int. J. Pharm., 2014, 477, 1–11 CrossRef CAS PubMed.
- S. L. Lee, T. F. O'Connor, X. Yang, C. N. Cruz, S. Chatterjee, R. D. Madurawe, C. M. V. Moore, L. X. Yu and J. Woodcock, J. Pharm. Innovation, 2015, 10, 191–199 CrossRef.
- W. D. Soete, J. Dewulf, P. Cappuyns, G. V. Vorst, B. Heirman, W. Aelterman, K. Schoetersc and H. V. Langenhove, Green Chem., 2013, 15, 3039–3048 RSC.
- (a) N. K. Duggirala, M. L. Perry, Ö. Almarsson and M. J. Zaworotko, Chem. Commun., 2016, 52, 640–655 RSC; (b) S. A. Ross, D. A. Lamprou and D. Douroumis, Chem. Commun., 2016, 52, 8772–8786 RSC.
- A. O. Surov, A. V. Churakov and G. L. Perlovich, Cryst. Growth Des., 2016, 16, 6556–6567 CrossRef CAS.
- N. Madusanka, M. D. Eddleston, M. Arhangelskis and W. Jones, Acta Crystallogr., Sect. B: Struct. Sci., Cryst. Eng. Mater., 2014, 70, 72–80 CrossRef CAS PubMed.
- C. J. González, A. D. Curzons, D. J. C. Constable and V. L. Cunningham, Clean Technol. Environ. Policy, 2005, 7, 42–50 CrossRef.
- R. A. Sheldon, Green Chem., 2017, 19, 18–43 RSC.
- (a) D. Daurio, C. Medina, R. Saw, K. Nagapudi and F. Alvarez-Núñez, Pharmaceutics, 2011, 3, 582–600 CrossRef CAS PubMed; (b) S. Mascia, P. L. Heider, H. Zhang, R. Lakerveld, B. Benyahia, P. I. Barton, R. D. Braatz, C. L. Cooney, J. M. B. Evans, T. F. Jamison, K. F. Jensen, A. S. Myerson and B. L. Trout, Angew. Chem., Int. Ed., 2013, 52, 12359–12363 CrossRef CAS PubMed.
- (a) Q. Cao, J. L. Howard, D. E. Crawford, S. L. James and D. L. Browne, Green Chem., 2018, 20, 4443–4447 RSC; (b) M. Ferguson, N. Giri, X. Huang, D. Apperley and S. L. James, Green Chem., 2014, 16, 1374–1382 RSC.
- (a) S. Rehder, M. Klukkert, K. A. M. Löbmann, C. J. Strachan, A. Sakmann, K. Gordon, T. Rades and C. S. Leopold, Pharmaceutics, 2011, 3, 706–722 CrossRef CAS PubMed; (b) S. Karki, T. Friščić, W. Jones and W. D. S. Motherwell, Mol. Pharmaceutics, 2007, 4, 347–354 CrossRef CAS PubMed.
- (a) D. Daurio, C. Medina, R. Saw, K. Nagapudi and F. Alvarez-Núñez, Pharmaceutics, 2011, 3, 582–600 CrossRef CAS PubMed; (b) S. Mascia, P. L. Heider, H. Zhang, R. Lakerveld, B. Benyahia, P. I. Barton, R. D. Braatz, C. L. Cooney, J. M. B. Evans, T. F. Jamison, K. F. Jensen, A. S. Myerson and B. L. Trout, Angew. Chem., Int. Ed., 2013, 52, 12359–12363 CrossRef CAS PubMed; (c) M. Bookwala, P. Thipsay, S. Ross, F. Zhang, S. Bandaria and M. A. Repka, Eur. J. Pharm. Biopharm., 2018, 131, 109–119 CrossRef CAS PubMed; (d) H. Lee, J. Vasoya, M. Cirqueira, K. Yeh, T. Lee and A. Serajuddin, Mol. Pharm., 2017, 14, 1278–1291 CrossRef CAS PubMed.
- R. S. Dhumal, A. L. Kelly, P. York, P. D. Coates and A. Paradkar, Pharm. Res., 2010, 27, 2725–2733 CrossRef CAS PubMed.
- D. E. Crawford, C. K. G. Miskimmin, A. B. Albadarin, G. Walkerb and S. L. James, Green Chem., 2017, 19, 1507–1518 RSC.
- (a) V. André, D. Braga, F. Grepioni and M. T. Duarte, Cryst. Growth Des., 2009, 9, 5108–5116 CrossRef; (b) I. Halasz, A. Puškarić, S. A. J. Kimber, P. J. Beldon, A. M. Belenguer, F. Adams, V. Honkimaki, R. E. Dinnebier, B. Patel, W. Jones, V. Štrukil and T. Friščić, Angew. Chem., Int. Ed., 2013, 52, 11538–11541 CrossRef CAS PubMed; (c) T. Friščić, A. V. Trask, W. Jones and W. D. S. Motherwell, Angew. Chem., Int. Ed., 2006, 45, 7546–7550 CrossRef PubMed; (d) H. Kulla, S. Haferkamp, I. Akhmetova, M. Röllig, C. Maierhofer, K. Rademann and F. Emmerling, Angew. Chem., Int. Ed., 2018, 57, 5930–5933 CrossRef CAS PubMed.
- M. C. Etter, Acc. Chem. Res., 1990, 23, 120–126 CrossRef CAS.
- H. Moradiya, M. T. Islam, G. Woollam, I. J. Slipper, S. Halsey, M. J. Snowden and D. Douroumis, Cryst. Growth Des., 2014, 14, 189–198 CrossRef CAS.
- A. G. De la Torre, S. Bruque and M. A. G. Aranda, J. Appl. Crystallogr., 2001, 34, 196–202 CrossRef CAS.
- (a) B. H. Toby, Powder Diffr., 2006, 21, 67–70 CrossRef CAS; (b) L. B. McCusker, R. B. Von Dreele, D. E. Cox, D. Louër and P. Scardi, J. Appl. Crystallogr., 1999, 32, 36–50 CrossRef CAS.
- (a) R. N. Kamble, C. Bothiraja, P. P. Mehta and V. Varghese, J. Pharm. Invest., 2017, 48, 541–549 CrossRef; (b) A. Shayanfar and A. Jouyban, Powder Technol., 2014, 262, 242–248 CrossRef CAS.
- C. Muthuselvi, A. Arunkumar and G. Rajaperumal, Chem. Sin., 2016, 7, 55–62 CAS.
- F. Alatas, H. Ratih and S. N. Soewandhi, Int. J. Pharm. Pharm. Sci., 2015, 7, 423–426 CAS.
- (a) R. Chadha, P. Singh, S. Khullar and S. Mandal, Cryst. Growth Des., 2016, 16(9), 4960–4967 CrossRef CAS; (b) A. ElShaer, D. Ouyang and P. Hanson, J. Pharm. Drug Delivery Res., 2013, 02(01), 1–10 Search PubMed.
- (a) S. Childs, G. Stahly and A. Park, Mol. Pharm., 2007, 4, 323–338 CrossRef CAS PubMed; (b) S. Sedghiniya, J. Soleimannejad and J. Janczak, Acta Crystallogr., Sect. C: Struct. Chem., 2019, 75, 412–421 CrossRef CAS PubMed; (c) G. Stahly, Cryst. Growth Des., 2007, 7, 1007–1026 CrossRef CAS.
- A. Cruz-Cabeza, CrystEngComm, 2012, 14, 6362 RSC.
- R. Kamble, C. Bothiraja, P. Mehta and V. Varghese, J. Pharm. Invest., 2017, 48, 541–549 CrossRef.
- K. Torniainen, S. Tammilehto and V. Ulvi, Int. J. Pharm., 1996, 132, 53–61 CrossRef CAS.
- M. Adachi, Y. Hinatsu, K. Kusamori, H. Katsumi, T. Sakane, M. Nakatani, K. Wada and A. Yamamoto, Eur. J. Pharm. Sci., 2015, 76, 225–230 CrossRef CAS PubMed.
- (a) A. O. Surov, A. N. Manin, A. P. Voronin, K. V. Drozd, A. A. Simagina, A. V. Churakov and G. L. Perlovich, Eur. J. Pharm. Sci., 2015, 77, 112–121 CrossRef CAS PubMed; (b) J. S. Reddy, S. V. Ganesh, R. Nagapalli, R. Dandela, K. A. Solomon, K. A. KUMAR, N. R. Goud and A. NANGIA, J. Pharm. Sci., 2011, 100, 3160–3175 CrossRef CAS PubMed.
Footnote |
| † Electronic supplementary information (ESI) available. See DOI: 10.1039/c9gc03528a |
| This journal is © The Royal Society of Chemistry 2020 |