Selective conversion of chitin to levulinic acid catalyzed by ionic liquids: distinctive effect of N-acetyl groups†
Wuxin
Hou
,
Qingyang
Zhao
and
Li
Liu
 *
*
School of Chemistry, Dalian University of Technology, Dalian 116024, China. E-mail: lliu@dlut.edu.cn
First published on 21st October 2019
Abstract
Selective and green conversion of chitin to levulinic acid (LA) has been realized by the catalysis of the ionic liquid (IL) 1-methyl-3-(3-sulfopropyl)imidazolium hydrogen sulfate ([C3SO3Hmim]HSO4) up to a yield of 67.0%. The relationship between the structure of IL and the yield of LA was investigated, demonstrating that both acidity and the hydrogen bonding ability of IL dictate its catalytic activity. Furthermore, by means of NMR, IR, SEM, GPC analyses and determination of the degree of acetylation (DA), two approaches of deacetylation–depolymerization to glucosamine (GlcN) and direct depolymerization to N-acetylglucosamine (GlcNAc) were proposed as chitin hydrolysis mechanisms, which occur only at the outer surface while leaving the interior crystalline chitin intact. The N-acetyl groups in chitin construct strong intramolecular and intermolecular hydrogen bond networks that contribute to the integration of the crystalline structure and building up of barriers to shield the accessibility of glycosidic linkages with the acidic catalyst.
Introduction
As the second most abundant biomass next to cellulose, chitin primarily originates from crustacean shells, such as those of crab and shrimp. There is a well-established protocol for chitin extraction from the shell waste, including demineralization, deproteinization and decolorization. Alternatively, greener technologies are being developed such as the plasma-based process and ionic liquid (IL) extraction.1–5In spite of enormous economic and environmental interest, conversion of renewable chitin biomass has been rather limited due to its poor solubility. Corresponding to plant biomass-based refinery, shell biorefinery was proposed by Yan et al., suggesting that chitin holds great potential to be converted into chemicals.6 The recent decade has been dedicated to improving the efficiency and selectivity of chitin conversion. For instance, by use of a simple biphasic reactor, Maskal and Nikitin converted chitin into 5-(chloromethyl)furfural (CMF) in 45% yield, together with levulinic acid (LA) in 29% yield.7 Kerton and Yan developed the synthesis routes of 3-acetamido-5-acetylfuran (3A5AF) from chitin monomer N-acetylglucosamine (GlcNAc, 60%)8 and chitin (7.5%),9 respectively. Hou and co-workers hydrolysed chitin in 67 wt% ZnCl2 aqueous solution and obtained 5-hydroxymethylfurfural (HMF) in 9% yield.10 Zang and co-workers adopted FeCl2 as the catalyst to improve the yield of HMF further to 19.3%.11 Jin and Yan hydrolysed chitin in NaOH solution using CuO and oxygen, resulting in an acetic acid (AcOH) yield of 38.1%.12
Levulinic acid (LA) is widely recognized as one of the top twelve platform chemicals starting from biomass, which acts as a versatile building block towards the synthesis of solvents, fuel additives, flavor substances, herbicides, pharmaceutical agents, or resin and polymer precursors.13–23 Chitin conversion to LA has been initially reported under microwave irradiation. Kerton and co-workers hydrolyzed chitin by using Lewis acids at 200 °C for 30 min, whereas SnCl4·5H2O provided LA in 22.2% yield.24 Dibó and Mika hydrolyzed chitin in the presence of H2SO4 at 190 °C for 20 min, improving the LA yield to 37.8%.25 However, the aforementioned acidic catalysts are difficult to recycle, and highly selective conversion of chitin to LA remains challenging.
ILs have brought new vitality in biopolymer research starting from cellulose,26 due to their structural designability and recyclability.27–37 Applications of ILs in chitin research are mostly focused on chitin dissolution.5,38–43 Zhao and co-workers used HCl as the catalyst and 1-butyl-3-methylimidazolium chloride ([Bmim]Cl) as the solvent to convert chitin into total reducing sugars (TRS) of 25%.42 Reports of ILs as catalysts for chitin conversion have been rather limited. One example is N-methyl imidazolium hydrogen sulfate ([Mim]HSO4) used to convert chitin into HMF with a yield of 19.3%.43 To the best of our knowledge, selective conversion of chitin to LA by the catalysis of ILs has not been reported so far. On the basis of our recent research on IL-catalyzed conversions of cellulose,44,45 lignocellulose,46 and chitosan,47 we further explored the selective conversion of chitin to LA catalyzed by acidic ILs.48
Different from cellulose and chitosan, hydrolysis of chitin comprises two major chemical reactions including the cleavage of the glycosidic linkage on the main chain (depolymerization) and deacetylation on the side chain.7,8,10,12,49,50 The existing mechanisms of chitin hydrolysis mainly embrace (i) selective depolymerization without deacetylation51–54 and (ii) simultaneous depolymerization and deacetylation.55 Under both circumstances, the chitin structures fall apart, and the polymeric chains are cleaved into oligomers at random. We report here a different mechanism of chitin hydrolysis, demonstrating the distinctive effect of N-acetyl groups on the mechanism in comparison with chitosan.
Experimental
Materials and equipment
Chitin was purchased from TCI (Shanghai, China). Chitosan was supplied by Beijing Solarbio Science & Technology Co., Ltd (Beijing, China). Six ionic liquids including 1-methyl-3-(3-sulfopropyl)imidazolium hydrogen sulfate ([C3SO3Hmim]HSO4), 1-methyl-3-(3-sulfopropyl)imidazolium methanesulfonate ([C3SO3Hmim]CH3SO3), 1-methyl-3-(3-sulfopropyl)imidazolium phenylsulfonate ([C3SO3Hmim]PhSO3), 1-methyl-3-(3-sulfopropyl)imidazolium 1-naphthalenesulfonate ([C3SO3Hmim]1-NS), 1-methyl-3-(3-sulfopropyl)imidazolium dihydrogen phosphate ([C3SO3Hmim]H2PO4) and 1-methyl-3-(3-sulfopropyl)imidazolium chloride ([C3SO3Hmim]Cl) were synthesized according to the literature,46 and characterized by NMR prior to use (see the ESI†). The NMR spectra were recorded on a Bruker Avance II 400 MHz spectrometer. The Fourier transform infrared (FT-IR) spectra were recorded on a Bruker Equinox 55 infrared spectrometer. The scanning electron microscopy (SEM) images were obtained by using a NOVA NanoSEM 450 microscope.General procedure for chitin and chitosan conversion
A mixture of chitin (or chitosan), deionized water and IL was heated in a Teflon-lined autoclave that was preheated to a given temperature under magnetic stirring. The reaction mixture was analyzed by 1H NMR with IL as the internal standard, whereas H2, CH3 and Hc/d were used for integrations of LA, AcOH and IL, respectively (Fig. S2†), according to our previous procedure.47 The 1H NMR spectra were attained at 296 ± 0.5 K, using 12 μs pulse width and 1 s delay time. A total of 32 scans were collected. All spectra were referenced relative to residual HOD at 4.79 ppm. The yields of LA and AcOH were calculated from the following equations:| YLA (mol%) = (mol of LA)/(mol of chitin) × 100% |
| YAcOH (mol%) = (mol of AcOH)/(mol of chitin) × 100% |
All the results were repeated at least three times. The analytical error was below 5% through comparison with standard samples of known concentrations. The solid residues were filtered, dried under high vacuum and weighed, whereas the yield of solid in weight percentage was calculated relative to chitin.
It should be noted that all the reactions were carried out in a similar manner whilst varying the following parameters: reaction temperature and time, water amount, IL dosage and chitin input. The amount of water was optimized using iterative methods, in combination with reaction temperature and time. Under the optimized conditions derived as above, the effects of IL dosage and chitin input were investigated.
IL recycling and LA separation
For the first cycle, chitin (250 mg), deionized water (6.000 g), and [C3SO3Hmim]HSO4 (1.000 g) were heated in a Teflon-lined autoclave at 180 °C for 5 h. After the solid residues were filtered, the aqueous IL solution was extracted by methyl isobutyl ketone (MIBK) 60 mL × 3 and then dried under high vacuum. Over 95% of the IL can be recovered after extraction. Afterwards, the IL was adjusted to 1.000 g (3.31 mmol) by adding fresh IL of no more than 5% for subsequent cycles, whereas 1-naphthalenesulfonic acid was used as the standard to determine the amount of recycled IL by 1H NMR. IL recycling was also tested for acidity loss after supplementation with 1 equiv. of H2SO4. The LA product was isolated by evaporation of MIBK, which was confirmed by NMR and mass spectrometry (MS) (see the ESI†).Gas chromatography (GC)-MS analysis
The qualitative analysis of LA was conducted by GC-MS using an Agilent 7890A gas chromatograph equipped with an Agilent J&W 123-0732 capillary column (30 m × 0.32 mm × 0.25 mm), as well as an MS triple quadrupole detector. The GC temperature program was applied: an initial temperature of 100 °C for 2 min, followed by heating to 210 °C at a rate of 10 °C min−1, and finally at 210 °C for 5 min. Mass spectrometric measurement was performed by using electron impact ionization (EI) at 70 eV and a scan range of m/z 30–500.Gel permeation chromatography (GPC) analyses
The molecular weights were analyzed by a GPC system equipped with a Waters 2414 refractive index detector, a Waters 1525 HPLC pump, and an Agilent PLgel 5 μm MIXED-C column, using LiCl/DMF (0.1 mol L−1) as the eluent at a flow rate of 1.0 mL min−1 at 35 °C. The samples (2 mg mL−1) were dissolved in the same mobile phase solution through rigorous stirring for one day. The raw data were calibrated using narrow polydispersity polystyrene (PS) standards.Measurement of the degree of acetylation (DA)
The chitin and chitosan samples were dissolved in 8 wt% of NaOH/4 wt% of urea (D2O, −30 °C)56 and 1% DCl/D2O solutions,47 respectively. According to a published protocol using the 1H NMR method,55 the DA values were calculated from the following equation:| DA% = 2HAc/H2 to 6 × 100% |
Quantification of GlcNAc and glucosamine (GlcN) intermediates
The yields of GlcNAc and GlcN were calculated from the following equations:| YGlcNAc (mol%) = (mol of GlcNAc)/(mol of chitin) × 100% |
| YGlcN (mol%) = (mol of GlcN)/(mol of chitin) × 100% |
GlcNAc and GlcN intermediates were quantified by using a Dionex ICS-5000 ion chromatography system equipped with an IPAD detector and a CarboPac PA20 column (30 °C), whereas an aqueous solution of NaOH (20.0 mM) at a flow rate of 0.45 mL min−1 was used as the mobile phase. Identification and quantification were done by analysis of the standard samples with known concentrations.
Results and discussion
The effects of reaction conditions on chitin conversion
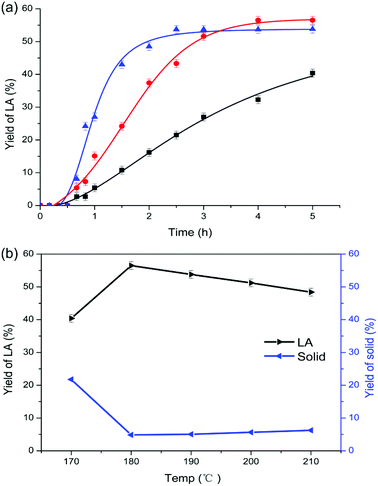
In comparison with chitosan, chitin conversion is more difficult and higher temperature is required. At 170 °C which is the optimum temperature for chitosan, chitin conversion to LA was incomplete and only 40.4% of LA yield was obtained after 5 h. As shown in Fig. 1a, as the reaction temperature increased from 170 to 190 °C, the yield of LA was enhanced initially, and reached plateaus of 56.5% and 53.8% at 180 and 190 °C, respectively. During the conversion, a dark colored solid known as humins was inevitably formed, and the yield of solid residues in weight percentage was calculated relative to chitin input. When the temperature was further increased up to 210 °C (Fig. 1b), the yield of LA continued to decrease down to 48.4% whereas the yield of humins increased slightly to 6.2%. Hence, higher temperature favors the formation of humins57 but decreases the yield of LA. To suppress the formation of humins, a lower reaction temperature was adopted. However, a much higher yield of solid (21.8%) was obtained at 170 °C, which was ascribed to the relatively slower and incomplete chitin conversion at too low temperatures. Therefore, the reaction temperature was kept at 180 °C for chitin conversion to LA.Notably, the decreased yield of LA can be ascribed to either the incomplete conversion of chitin feedstock or the increase of humins. Under both circumstances, the yield of solid increased. Characterisation of the solid residues by IR spectroscopy was helpful to distinguish whether the residues were unconverted chitin polymers or humins predominantly; the process is elucidated in the characterisation section.
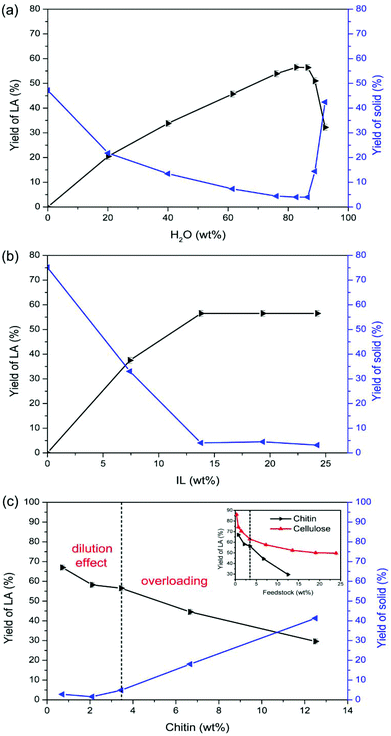
Water plays a vital role in promoting the conversion of chitin to LA. As depicted in Fig. 2a, LA could not be obtained in the absence of water. When the amount of water was increased from 20.1 wt% to 82.7 wt%, the LA yield ascended from 20.5% to 56.5%. In contrast, the yield of solid decreased from 21.8% to 4.0%, indicating that the dilution effect inhibits humin formation and thus promotes the production of LA. When the amount of water was further increased from 82.7 wt% to 92.3 wt%, the yields of LA and solid both plateaued until 86.5 wt%, and then the yield of LA descended markedly to 32.2% and the yield of solid increased to 42.4%, suggesting that excessive dilution, i.e., too low IL concentration, is not efficient for the complete conversion of chitin to LA.
IL is essential to catalyse chitin conversation to LA, without which LA could not be produced (Fig. 2b). Increasing the IL dosage led to an increase in LA yield, whereas the yield of LA was maximized at 56.5% in the presence of 13.8 wt% of IL and plateaued out with an IL dosage above 13.8 wt%. Meanwhile, the yield of solid decreased and stabilized at ca. 4% with an IL dosage above 13.8 wt%, confirming that too low IL concentration is insufficient for complete chitin conversion. This is consistent with the water effect. Therefore, 13.8 wt% of IL was adopted in the conversion system.
As depicted in Fig. 2c, less chitin input resulted in a remarkable increase of LA yield up to 67.0% with a chitin input of 0.7 wt%. Conversely, the yield of solid kept decreasing with less chitin input. Compared to modulating the parameters of water and IL to improve the LA yield, a decrease of chitin input further inhibits the yield of humins to below 2%, thereby demonstrating a more pronounced dilution effect than that by increasing the amount of water. This is attributed to the fact that intermediate concentration could be lowered down more efficiently without the consequences of too low IL concentration, which suppressed the intermolecular polymerization to humins on the basis of complete conversion of chitin.
A similar dilution effect was observed for cellulose in which the LA yield decreased slightly from 63.0% to 52.4% with the cellulose input increasing from 3.4 wt% to 13.6 wt%.45 However, in the case of chitin, the yield of LA decreased abruptly from 56.5% (at a chitin input of 3.4 wt%) to 29.6% (at a chitin input of 12.5 wt%), disclosing the overloading of chitin feedstock in addition to the dilution effect. As discussed in the subsequent section, this hypothesis could be supported by our results on IL recycling.
Recycling of the IL
Compared with inorganic acid catalysts, IL is characteristic of its recyclability. Upon chitin conversion, MIBK proved to be the optimum extractant for the LA product, with an extraction efficiency of up to 98%.58 The recyclability of IL was demonstrated through phase separation.Unexpectedly, as illustrated in Fig. 3, continued cycles show a downward trend of LA yield from 56.5% to 48.5%, 46.0%, 40.4%, and 34.9%. It is assumed that the reduced catalytic activity could be ascribed to NH3 elimination during chitin conversion leading to a decrease in IL acidity. Although NH3 elimination was proposed during chitin conversion in the literature,11,12,24,25 attempts to detect NH3 in the reaction mixture have been unsuccessful. During our investigation, characteristic triplet peaks appeared on the 1H NMR spectra of the reaction mixture (Fig. S2†), which are attributed to NH4+ by comparison with the standard NH4HSO4. Thus, NH3 elimination has been unambiguously confirmed during chitin conversion. Furthermore, to offset the acidity loss, 1 equiv. of H2SO4 was supplemented to the reused IL, whereas the yield of LA did not decrease noticeably over five cycles (Fig. 3). For the same reason, the aforementioned overloading phenomenon at higher chitin input could be attributed to the larger amount of NH3 formed during chitin conversion, causing a significant decrease in IL acidity and resulting in a steep decline in LA yield.
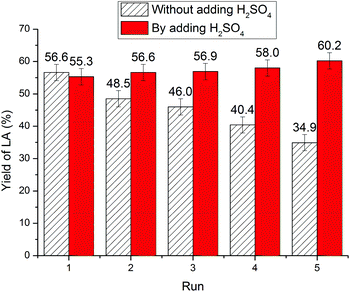 | ||
| Fig. 3 The reuse of IL. Reaction conditions: 180 °C, 5 h, 250 mg of chitin, 1.000 g of [C3SO3Hmim]HSO4, and 6.000 g of H2O. | ||
The effect of IL structures on chitin conversion
To gain insight into the catalytic mechanism of IL, six ILs were applied for chitin conversion, whose Brønsted acidities were evaluated by using the Hammett acidity function (H0) with 4-nitroaniline as the basic indicator.45 As shown in Table 1, the acidities of ILs were found to follow the sequence of HSO4− > PhSO3− ∼ CH3SO3− > 1-NS > H2PO4−. As a result, the stronger the acidity of IL, the higher the LA yield was achieved, highlighting the essential role of acid catalysis in the process of chitin conversion.| IL | A max | [I]b (%) | [IH+]b (%) |
H
0![[thin space (1/6-em)]](https://www.rsc.org/images/entities/char_2009.gif) c c |
Y LA (mol%) |
|---|---|---|---|---|---|
| a Reaction conditions: 180 °C, 5 h, 250 mg of chitin, 3.31 mmol IL, 6.000 g of H2O. b IH+ and I refer to the protonated and unprotonated forms of 4-nitroaniline, respectively. c H 0 = pK(I)aq + log([I]/[IH+]) (for 4-nitroaniline, pK(I)aq = 0.99). | |||||
| — | 0.426 | 100 | 0 | — | 0 |
| [C3SO3Hmim]HSO4 | 0.252 | 59 | 41 | 1.15 | 56.5 |
| [C3SO3Hmim]CH3SO3 | 0.283 | 66 | 34 | 1.28 | 50.8 |
| [C3SO3Hmim]PhSO3 | 0.283 | 66 | 34 | 1.28 | 51.6 |
| [C3SO3Hmim]1-NS | 0.352 | 83 | 17 | 1.68 | 49.0 |
| [C3SO3Hmim]H2PO4 | 0.364 | 85 | 15 | 1.74 | 5.4 |
| [C3SO3Hmim]Cl | 0.316 | 74 | 26 | 1.44 | 54.0 |
Surprisingly, when [C3SO3Hmim]Cl was tested, 54.0% yield of LA was achieved, which is abnormally high and inconsistent with the acidity sequence. This could be attributed to the stronger H-bonding ability of Cl−, which contributes to the breaking of the H-bonding network amongst chitin, enhancing the accessibility of the acidic catalyst to chitin and thereby improving the catalytic activity of IL.45
However, for cellulose, [C3SO3Hmim]Cl gave rise to an even higher LA yield than [C3SO3Hmim]HSO4.45 It can be learnt from our results on IL recycling during chitin conversion that deamination causes a decrease in IL acidity. Therefore, it was speculated that the yield of LA catalysed by 3.31 mmol of [C3SO3Hmim]Cl may not reach its maximum yield. After increasing the dosage of [C3SO3Hmim]Cl to 4.97 mmol, the yield of LA for chitin conversion indeed increased to 61.5% and then plateaued out. Hence, taking the acidity loss into consideration, the Cl− proved to have a definitely prominent effect on chitin conversion that could surpass [C3SO3Hmim]HSO4, despite the fact that the acidity of [C3SO3Hmim]Cl is relatively lower than [C3SO3Hmim]HSO4.
Characterisation of the solid residues
In the process of chitin conversion, insoluble solid residues were obtained, which could provide real-time monitoring of the reaction pathway. As depicted in Fig. 4, the solid residues gradually decreased and levelled off at 4 h. The 1H NMR spectra (Fig. S3†) remained basically the same as that of chitin feedstock until 3 h, suggesting that the chitin skeletal structure was maintained. After reaction for 4 h, the solid residues turned from grey into dark and were stabilized at 11 mg, suggestive of mainly leftover humins, which was further supported by IR and SEM analyses.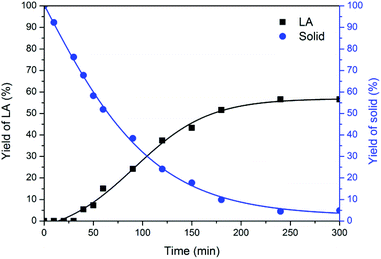 | ||
| Fig. 4 Time course of the solid residues. Reaction conditions: 180 °C, 250 mg of chitin, 6.000 g of H2O, 1.000 g of [C3SO3Hmim]HSO4. | ||
According to the FT-IR spectroscopy results (Fig. 5), the α-chitin feedstock was characteristic of the amide I band split at 1660 and 1626 cm−1, which have been assigned to the stretching vibrations of C![[double bond, length as m-dash]](https://www.rsc.org/images/entities/char_e001.gif) O forming an H-bond to N–H on the adjacent chain and the C
O forming an H-bond to N–H on the adjacent chain and the C![[double bond, length as m-dash]](https://www.rsc.org/images/entities/char_e001.gif) O bifurcation with an additional H-bond to the primary O–H on the same chain, respectively.39,53,56 Meanwhile, 1558 cm−1 was ascribed to the amide II band (stretching vibrations of C–N and bending vibrations of N–H).
O bifurcation with an additional H-bond to the primary O–H on the same chain, respectively.39,53,56 Meanwhile, 1558 cm−1 was ascribed to the amide II band (stretching vibrations of C–N and bending vibrations of N–H).
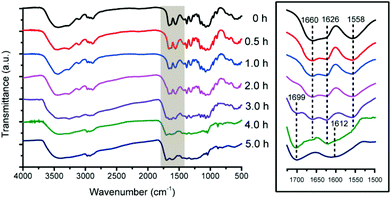 | ||
| Fig. 5 IR spectra of the solid residues. Reaction conditions: 180 °C, 250 mg of chitin, 6.000 g of H2O, 1.000 g of [C3SO3Hmim]HSO4. | ||
After reaction for 0.5 h, the unchanged amide I bands at 1660 (C![[double bond, length as m-dash]](https://www.rsc.org/images/entities/char_e001.gif) O⋯H–N) and 1626 cm−1 (C
O⋯H–N) and 1626 cm−1 (C![[double bond, length as m-dash]](https://www.rsc.org/images/entities/char_e001.gif) O⋯H–O and C
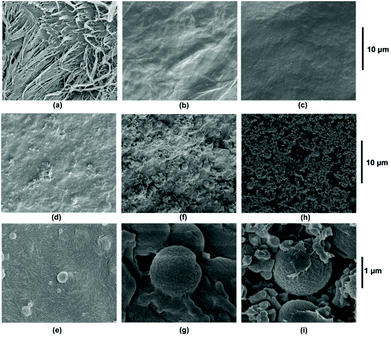
O⋯H–O and C![[double bond, length as m-dash]](https://www.rsc.org/images/entities/char_e001.gif) O⋯H–N) convinced that the chitin structure was well preserved at the early stage. Furthermore, starting from the fibrous surface (Fig. 6a), a smooth surface shows up on the SEM image after 0.5 h (Fig. 6b and c), indicating the limited accessibility of glycosidic bonds in the interior of the chitin structure at the micrometer level. This was distinctly different from the porous surface morphology in the cases of cellulose and chitosan, in which the glycosidic bonds were accessible throughout the structure.
O⋯H–N) convinced that the chitin structure was well preserved at the early stage. Furthermore, starting from the fibrous surface (Fig. 6a), a smooth surface shows up on the SEM image after 0.5 h (Fig. 6b and c), indicating the limited accessibility of glycosidic bonds in the interior of the chitin structure at the micrometer level. This was distinctly different from the porous surface morphology in the cases of cellulose and chitosan, in which the glycosidic bonds were accessible throughout the structure.
After reaction for 3 h, the IR spectra show two new bands at 1699 and 1612 cm−1, corresponding to the stretching vibrations of the C![[double bond, length as m-dash]](https://www.rsc.org/images/entities/char_e001.gif) O and C
O and C![[double bond, length as m-dash]](https://www.rsc.org/images/entities/char_e001.gif) C groups, respectively, which are the characteristics of humins as reported.45,59 However, 3 h is solely the starting time point for humin formation but not the ending time point for chitin conversion. The amide I bands at 1660 (C
C groups, respectively, which are the characteristics of humins as reported.45,59 However, 3 h is solely the starting time point for humin formation but not the ending time point for chitin conversion. The amide I bands at 1660 (C![[double bond, length as m-dash]](https://www.rsc.org/images/entities/char_e001.gif) O⋯H–N) and 1626 cm−1 (C
O⋯H–N) and 1626 cm−1 (C![[double bond, length as m-dash]](https://www.rsc.org/images/entities/char_e001.gif) O⋯H–O and C
O⋯H–O and C![[double bond, length as m-dash]](https://www.rsc.org/images/entities/char_e001.gif) O⋯H–N) gradually weakened after 4 h and vanished after 5 h along with the amide II band at 1558 cm−1, suggesting that 5 h is more likely the ending time point for chitin conversion.
O⋯H–N) gradually weakened after 4 h and vanished after 5 h along with the amide II band at 1558 cm−1, suggesting that 5 h is more likely the ending time point for chitin conversion.
Correspondingly, the SEM images show only a few isolated spherical particles smaller than 1 μm after 3 h (Fig. 6d and e), which then grow both in size and amount after 4 h (Fig. 6f and g) until mainly agglomeration without the continuous surface underneath after 5 h (Fig. 6h and i). Thereby, the SEM results are consistent with the IR analyses, verifying that humins appeared a little bit after 3 h and became widespread after 4 h, with chitin disappearing until 5 h.
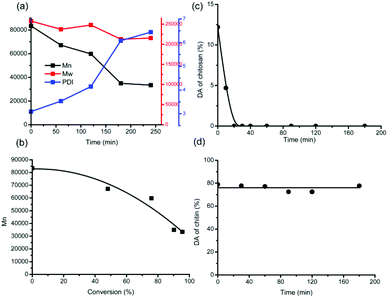
Hence, from the beginning to 3 h, the solid residues are basically unconverted chitin polymers, whereas humins could be neglected. In order to demonstrate how chitin depolymerization proceeds straightforwardly, the molecular weights (MWs) of the solid residues were analysed by GPC and calculated. As shown in Fig. 7a, the polydispersity (PDI) broadens during the reaction, implying that more and more low-MW parts come into being. Moreover, the number-average molecular weight (Mn) decreased from the beginning 83![[thin space (1/6-em)]](https://www.rsc.org/images/entities/char_2009.gif) 000 to 35
000 to 35![[thin space (1/6-em)]](https://www.rsc.org/images/entities/char_2009.gif) 000 at 3 h, verifying the ongoing depolymerization process. However, the weight-average molecular weight (Mw) decreased slightly from the beginning 258
000 at 3 h, verifying the ongoing depolymerization process. However, the weight-average molecular weight (Mw) decreased slightly from the beginning 258![[thin space (1/6-em)]](https://www.rsc.org/images/entities/char_2009.gif) 000 to 213
000 to 213![[thin space (1/6-em)]](https://www.rsc.org/images/entities/char_2009.gif) 000 at 3 h. This can be explained since the emerging low-MW parts affect Mn more remarkably than Mw.
000 at 3 h. This can be explained since the emerging low-MW parts affect Mn more remarkably than Mw.
Unexpectedly, even for the solid residues at 3 h whereas only 24.6 mg of solid residues were left and the conversion was close to completion, high molecular weights of 213![[thin space (1/6-em)]](https://www.rsc.org/images/entities/char_2009.gif) 000 (Mw) and 35
000 (Mw) and 35![[thin space (1/6-em)]](https://www.rsc.org/images/entities/char_2009.gif) 000 (Mn) were determined. Thereby, it can be inferred that chitin depolymerization does not proceed at random. Due to the massive hydrogen bond networks, the interior of the chitin crystal structure was retained, while the depolymerization occurs only at the outer surface. Throughout the conversion process of chitin feedstock, the inclination of Mn decrease becomes steeper gradually, supportive of chitin depolymerization in a stepwise manner (Fig. 7b).
000 (Mn) were determined. Thereby, it can be inferred that chitin depolymerization does not proceed at random. Due to the massive hydrogen bond networks, the interior of the chitin crystal structure was retained, while the depolymerization occurs only at the outer surface. Throughout the conversion process of chitin feedstock, the inclination of Mn decrease becomes steeper gradually, supportive of chitin depolymerization in a stepwise manner (Fig. 7b).
Chitin hydrolysis mechanism
Here a question arises: what is the mechanism of chitin hydrolysis like, in the presence of hydrogen bond networks? The degree of acetylation (DA) signifies the deacetylation level in relation to depolymerization during the hydrolysis process, which can be calculated from the integrals on the 1H NMR spectra (Fig. S3†). For IL-catalyzed chitosan hydrolysis (Fig. 7c), the DA value is reduced quickly to zero after 20 min, whereas only 9.6% of chitosan feedstock has been converted, suggesting that deacetylation becomes prone to completion once the polymeric structure falls apart.47From chitosan to chitin, the DA value of the feedstock increases, giving rise to stronger intra- and intermolecular hydrogen bonding interactions. Upon comparison, it can be seen from the DA plot of chitin (Fig. 7d) that the DA values nearly remained constant until 3 h, with an average value of 76.1%. Not taking into account the inert acetyl groups in the interior of the chitin crystal structure, the invariable DA values during chitin conversion suggest either depolymerization without deacetylation or equivalent deacetylation/depolymerization at the outer surface.
Undoubtedly, the intermediates provide direct evidence of the depolymerization mechanism, which indicated that both the aforementioned approaches exist. For IL-catalyzed chitin hydrolysis, it is relatively difficult for depolymerization reaction to occur, as chitin does not depolymerize at all at 80 °C for 5 h. According to the 1H NMR spectrum, the characteristic resonance signal of acetic acid was observed alone, which was reasonable taking into account that GlcNAc could deacetylate even at a lower temperature of 40 °C. Likewise, with the temperature increased to 180 °C, from the quantitative product analyses (Fig. 8) and 1H NMR spectra (Fig. S4†), the earliest product emerging at 10 min was acetic acid from deacetylation, thus confirming that deacetylation occurs easier than depolymerization. Subsequently, both GlcNAc and GlcN intermediates came into being at 12 min. The detection of GlcNAc intermediate verified the first approach of depolymerization without deacetylation. After 13 min, GlcN and acetic acid remained, whereby GlcNAc presumably deacetylated into GlcN as well and could be barely observed. GlcN increased to reach the maximum at 30 min, then decreased and disappeared after 4 h, whereas LA emerged after 30 min due to GlcN transformation. As a deacetylation product, acetic acid increased steeply after the turning point at 12 min; however, it is synchronous with the depolymerization products of GlcN and LA, and levelled out after 4 h, justifying the second approach of equivalent deacetylation/depolymerization. Thus, for the IL-catalyzed chitin hydrolysis, there are two approaches of depolymerization: (i) direct depolymerization to the GlcNAc monomer and (ii) deacetylation followed by depolymerization to release the GlcN monomer.
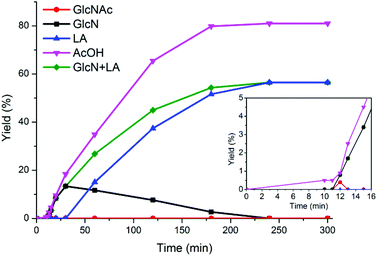 | ||
| Fig. 8 Product analyses during chitin conversion. Conditions: 250 mg of chitin, 6.000 g of H2O, and 1.000 g of [C3SO3Hmim]HSO4, 180 °C. | ||
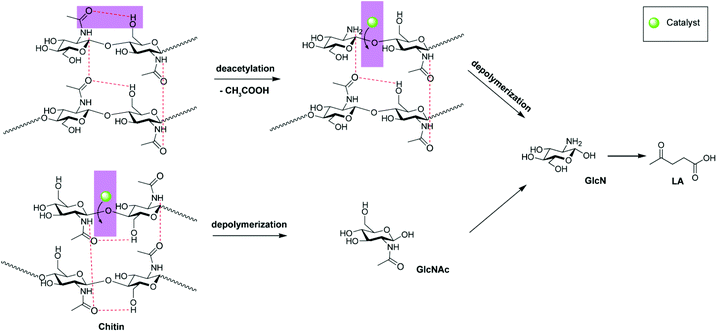
Apparently, the depolymerization mechanism of chitin is distinctly different from that of chitosan, highlighting the effect of the N-acetyl group which is essential to form stronger hydrogen bond networks. Novak and co-workers also pointed out the disturbed crystal structure and the weakened hydrogen bonds by N-deacetylation of chitin.60 It is well known that the C![[double bond, length as m-dash]](https://www.rsc.org/images/entities/char_e001.gif) O groups in chitin can serve as acceptors for both the primary O–H groups of the same chain and the N–H groups of the adjacent chain.39,50,56 As proposed in Fig. 9, these hydrogen bonds help to hold the crystalline structure together and build up barriers to prevent the hydrolysis of the β-(1–4)-linkage from the acidic catalyst at the molecular level.50,53,61 For these acetyl groups protruding outwards, due to easy accessibility of the acidic catalyst, the –GlcNAc unit first deacetylates to transform into the GlcN unit. After removal of the acetyl group to break its hydrogen bonding, the β-(1–4)-linkage was exposed to a catalytic attack. Secondly, the unshielded –GlcN unit dehydrates from the polymeric chain. On the other hand, for those acetyl groups whose hydrogen bonds are unable to block the hydrolysis of the β-(1–4)-linkage spatially, the corresponding –GlcNAc unit could be cleaved directly without resorting to deacetylation first to break the hydrogen bond barriers. Given that oligomers were not detected in solution, if the internal β-(1–4)-linkage was cleaved by either means rather than the terminal linkage, the oligomers were assumed to be still attached to the hydrogen bond networks, as reflected by the GPC analysis.
O groups in chitin can serve as acceptors for both the primary O–H groups of the same chain and the N–H groups of the adjacent chain.39,50,56 As proposed in Fig. 9, these hydrogen bonds help to hold the crystalline structure together and build up barriers to prevent the hydrolysis of the β-(1–4)-linkage from the acidic catalyst at the molecular level.50,53,61 For these acetyl groups protruding outwards, due to easy accessibility of the acidic catalyst, the –GlcNAc unit first deacetylates to transform into the GlcN unit. After removal of the acetyl group to break its hydrogen bonding, the β-(1–4)-linkage was exposed to a catalytic attack. Secondly, the unshielded –GlcN unit dehydrates from the polymeric chain. On the other hand, for those acetyl groups whose hydrogen bonds are unable to block the hydrolysis of the β-(1–4)-linkage spatially, the corresponding –GlcNAc unit could be cleaved directly without resorting to deacetylation first to break the hydrogen bond barriers. Given that oligomers were not detected in solution, if the internal β-(1–4)-linkage was cleaved by either means rather than the terminal linkage, the oligomers were assumed to be still attached to the hydrogen bond networks, as reflected by the GPC analysis.
Such a depolymerization process is then continued on the outer surface until the chitin feedstock is converted completely, whereas deacetylation–depolymerization or direct depolymerization affords GlcN and GlcNAc monomers, respectively, leaving the interior crystalline chitin intact. Meanwhile, GlcNAc could deacetylate into GlcN. The resultant glucosammonium dehydrates and deaminizes to HMF and subsequently LA through rehydration.50
Conclusions
We have demonstrated a selective route to convert chitin biomass to LA up to 67% by the catalysis of ILs. The effect of IL structures on chitin conversion has been investigated, whereas both acidity and the hydrogen bonding ability of ILs exert significant influences on the yield of LA. Herein, the N-acetyl groups of chitin construct strong intramolecular and intermolecular hydrogen bond networks that contribute to the integration of the crystalline structure and building up of the barriers to shield the accessibility of glycosidic linkages with the acidic catalyst, resulting in two approaches of deacetylation–depolymerization to GlcN and direct depolymerization to GlcNAc. While for chitosan, strong hydrogen bond networks are not formed due to low DA values, hence the accessibility of acidic catalysts to chitosan was enhanced, causing the polymeric structure ready to fall apart and be cleaved into oligomers irregularly. The demonstration of the chitin depolymerization mechanism is deemed to promote the in-depth understanding and thereby offer new insight into the utilization of renewable chitin resources.Conflicts of interest
There are no conflicts to declare.Acknowledgements
This project was supported by the Fundamental Research Funds for the Central Universities (DUT18JC16).Notes and references
- H. K. No, S. P. Meyers and K. S. Lee, J. Agric. Food Chem., 1989, 37, 575–579 CrossRef CAS.
- F. Shahidi and J. Synowiecki, J. Agric. Food Chem., 1991, 39, 1527–1532 CrossRef CAS.
- P. Beaney, J. Lizardi-Mendoza and M. Healy, J. Chem. Technol. Biotechnol., 2005, 80, 145–150 CrossRef CAS.
- M. Boric, H. Puliyalil, U. Novak and B. Likozar, Green Chem., 2018, 20, 1199–1204 RSC.
- J. L. Shamshina, Green Chem., 2019, 21, 3974–3993 RSC.
- N. Yan and X. Chen, Nature, 2015, 524, 155–157 CrossRef CAS.
- M. Mascal and E. B. Nikitin, ChemSusChem, 2009, 2, 859–861 CrossRef CAS.
- M. W. Drover, K. W. Omari, J. N. Murphy and F. M. Kerton, RSC Adv., 2012, 2, 4642–4644 RSC.
- X. Chen, S. L. Chew, F. M. Kerton and N. Yan, Green Chem., 2014, 16, 2204–2212 RSC.
- Y. Wang, C. M. Pedersen, T. Deng, Y. Qiao and X. Hou, Bioresour. Technol., 2013, 143, 384–390 CrossRef CAS.
- S. Yu, H. Zang, S. Chen, Y. Jiang, B. Yan and B. Cheng, Polym. Degrad. Stab., 2016, 134, 105–114 CrossRef CAS.
- X. Gao, X. Chen, J. Zhang, W. Guo, F. Jin and N. Yan, ACS Sustainable Chem. Eng., 2016, 4, 3912–3920 CrossRef CAS.
- D. W. Rackemann and W. O. S. Doherty, Biofuels, Bioprod. Biorefin., 2011, 5, 198–214 CrossRef CAS.
- S. M. Sen, D. M. Alonso, S. G. Wettstein, E. I. Gurbuz, C. A. Henao, J. A. Dumesic and C. T. Maravelias, Energy Environ. Sci., 2012, 5, 9690–9697 RSC.
- F. D. Pileidis and M.-M. Titirici, ChemSusChem, 2016, 9, 562–582 CrossRef CAS PubMed.
- S. Li, Y. Wang, Y. Yang, B. Chen, J. Tai, H. Liu and B. Han, Green Chem., 2019, 21, 770–774 RSC.
- Y. Shao, K. Sun, Q. Li, Q. Liu, S. Zhang, Q. Liu, G. Hu and X. Hu, Green Chem., 2019, 21, 4499–4511 RSC.
- Y. Bernhard, L. Pagies, S. Pellegrini, T. Bousquet, A. Favrelle, L. Pelinski, P. Gerbaux and P. Zinck, Green Chem., 2019, 21, 123–128 RSC.
- J. J. Bozell, Science, 2010, 329, 522–523 CrossRef CAS PubMed.
- J. Q. Bond, D. M. Alonso, D. Wang, R. M. West and J. A. Dumesic, Science, 2010, 327, 1110–1114 CrossRef CAS PubMed.
- S. Van de Vyver, J. Thomas, J. Geboers, S. Keyzer, M. Smet, W. Dehaen, P. A. Jacobs and B. F. Sels, Energy Environ. Sci., 2011, 4, 3601–3610 RSC.
- R. Weingarten, W. C. Conner and G. W. Huber, Energy Environ. Sci., 2012, 5, 7559–7574 RSC.
- S. G. Wettstein, D. M. Alonso, Y. X. Chong and J. A. Dumesic, Energy Environ. Sci., 2012, 5, 8199–8203 RSC.
- K. W. Omari, J. E. Besaw and F. M. Kerton, Green Chem., 2012, 14, 1480–1487 RSC.
- Á. Szabolcs, M. Molnár, G. Dibó and L. T. Mika, Green Chem., 2013, 15, 439–445 RSC.
- R. P. Swatloski, S. K. Spear, J. D. Holbrey and R. D. Rogers, J. Am. Chem. Soc., 2002, 124, 4974–4975 CrossRef CAS.
- A. Brandt, J. Grasvik, J. P. Hallett and T. Welton, Green Chem., 2013, 15, 550–583 RSC.
- C. Li and Z. K. Zhao, Adv. Synth. Catal., 2007, 349, 1847–1850 CrossRef CAS.
- H. Zhao, J. E. Holladay, H. Brown and Z. C. Zhang, Science, 2007, 316, 1597–1600 CrossRef CAS PubMed.
- R. Rinaldi, R. Palkovits and F. Schueth, Angew. Chem., Int. Ed., 2008, 47, 8047–8050 CrossRef CAS PubMed.
- J. B. Binder and R. T. Raines, J. Am. Chem. Soc., 2009, 131, 1979–1985 CrossRef CAS.
- M. E. Zakrzewska, E. Bogel-Łukasik and R. Bogel-Łukasik, Chem. Rev., 2011, 111, 397–417 CrossRef CAS.
- A. M. da Costa Lopes and R. Bogel-Łukasik, ChemSusChem, 2015, 8, 947–965 CrossRef CAS.
- M. Grilc, B. Likozar and J. Levec, Catal. Today, 2015, 256, 302–314 CrossRef CAS.
- A. S. Amarasekara, Chem. Rev., 2016, 116, 6133–6183 CrossRef CAS.
- Z. Zhang, J. Song and B. Han, Chem. Rev., 2017, 117, 6834–6880 CrossRef CAS.
- L. T. Mika, E. Cséfalvay and A. Németh, Chem. Rev., 2018, 118, 505–613 CrossRef CAS.
- H. Xie, S. Zhang and S. Li, Green Chem., 2006, 8, 630–633 RSC.
- Y. Wu, T. Sasaki, S. Irie and K. Sakurai, Polymer, 2008, 49, 2321–2327 CrossRef CAS.
- Y. Qin, X. Lu, N. Sun and R. D. Rogers, Green Chem., 2010, 12, 968–971 RSC.
- P. S. Barber, C. S. Griggs, G. Gurau, Z. Liu, S. Li, Z. Li, X. Lu, S. Zhang and R. D. Rogers, Angew. Chem., Int. Ed., 2013, 52, 12350–12353 CrossRef CAS.
- Z. Zhang, C. Li, Q. Wang and Z. K. Zhao, Carbohydr. Polym., 2009, 78, 685–689 CrossRef CAS.
- M. Li, H. Zang, J. Feng, Q. Yan, N. Yu, X. Shi and B. Cheng, Polym. Degrad. Stab., 2015, 121, 331–339 CrossRef CAS.
- H. Ren, Y. Zhou and L. Liu, Bioresour. Technol., 2013, 129, 616–619 CrossRef CAS.
- H. Ren, B. Girisuta, Y. Zhou and L. Liu, Carbohydr. Polym., 2015, 117, 569–576 CrossRef CAS.
- L. Liu, Z. Li, W. Hou and H. Shen, Carbohydr. Polym., 2018, 181, 778–784 CrossRef CAS.
- W. Hou, L. Liu and H. Shen, Carbohydr. Polym., 2018, 195, 267–274 CrossRef CAS.
- A. C. Cole, J. L. Jensen, I. Ntai, K. L. T. Tran, K. J. Weaver, D. C. Forbes and J. H. Davis, J. Am. Chem. Soc., 2002, 124, 5962–5963 CrossRef CAS PubMed.
- X. Chen, Y. Gao, L. Wang, H. Chen and N. Yan, ChemPlusChem, 2015, 80, 1565–1572 CrossRef CAS.
- X. Chen, H. Yang and N. Yan, Chem. – Eur. J., 2016, 22, 13402–13421 CrossRef CAS.
- M. Yabushita, H. Kobayashi, K. Kuroki, S. Ito and A. Fukuoka, ChemSusChem, 2015, 8, 3760–3763 CrossRef CAS.
- H. Kobayashi, K. Techikawara and A. Fukuoka, Green Chem., 2017, 19, 3350–3356 RSC.
- G. Margoutidis, V. H. Parsons, C. S. Bottaro, N. Yan and F. M. Kerton, ACS Sustainable Chem. Eng., 2018, 6, 1662–1669 CrossRef CAS.
- E. Husson, C. Hadad, G. Huet, S. Laclef, D. Lesur, V. Lambertyn, A. Jamali, S. Gottis, C. Sarazin and A. Nguyen Van Nhien, Green Chem., 2017, 19, 4122–4131 RSC.
- X. Chen, H. Yang, Z. Zhong and N. Yan, Green Chem., 2017, 19, 2783–2792 RSC.
- Y. Fang, R. Zhang, B. Duan, M. Liu, A. Lu and L. Zhang, ACS Sustainable Chem. Eng., 2017, 5, 2725–2733 CrossRef CAS.
- B. Girisuta, L. P. B. M. Janssen and H. J. Heeres, Ind. Eng. Chem. Res., 2007, 46, 1696–1708 CrossRef CAS.
- L. C. Nhien, N. V. D. Long, S. Kim and M. Lee, Ind. Eng. Chem. Res., 2016, 55, 5180–5189 CrossRef CAS.
- C. Falco, N. Baccile and M. M. Titirici, Green Chem., 2011, 13, 3273–3281 RSC.
- B. Bradic, D. Bajec, A. Pohar, U. Novak and B. Likozar, React. Chem. Eng., 2018, 3, 920–929 RSC.
- M. Petrov, L. Lymperakis, M. Friak and J. Neugebauer, Biopolymers, 2013, 99, 22–34 CrossRef CAS.
Footnote |
| † Electronic supplementary information (ESI) available. See DOI: 10.1039/c9gc02669j |
| This journal is © The Royal Society of Chemistry 2020 |

