
Hypoglycemic effects of polysaccharides from Gomphidiaceae rutilus fruiting bodies and their mechanisms
Siwen
Yang
,
Yunhe
Qu
,
Hang
Zhang
,
Zhujun
Xue
,
Ting
Liu
,
Lulu
Yang
,
Lin
Sun
 ,
Yifa
Zhou
and
Yuying
Fan
*
,
Yifa
Zhou
and
Yuying
Fan
*
School of Life Sciences, Northeast Normal University, Changchun, Jilin 130024, PR China. E-mail: fanyy033@nenu.edu.cn; Fax: +86-431-8509-8212; Tel: +86-431-8509-8908
First published on 29th November 2019
Abstract
Insulin resistance is the main cause of type 2 diabetes, fatty liver and obesity. Our previous study found that mushroom polysaccharides improved insulin resistance in vitro, but the underlying mechanisms were still unknown. Thus, we investigate the hypoglycemic effects of polysaccharides from Gomphidiaceae rutilus fruiting bodies and their mechanisms. The total polysaccharides (AGRP) from Gomphidiaceae rutilus fruiting bodies and the neutral polysaccharide (AGRP-N) fraction both enhance insulin-stimulated glucose uptake in an autophagy-dependent manner in high glucose and fatty acid-treated hepatic cells, but not the acidic polysaccharide (AGRP-A) fraction. Further, we elucidate the oral hypoglycemic effects of polysaccharides on ob/ob mice. AGRP and AGRP-N lower blood glucose and improve insulin sensitivity. They inhibit liver lipid deposition, not only by activating AMPK to increase autophagy but also by increasing the expressions of PPARα and CPT-1a to enhance lipolysis. Our results provide a basis for the development of polysaccharides from Gomphidiaceae rutilus as a hypoglycemic healthy food.
1. Introduction
Insulin resistance refers to tissue exerting an impaired response to insulin, resulting in a decrease in the efficiency of insulin-stimulated glucose uptake and utilization, and compensatory excessive secretion of insulin occurring in the body.1–3 Insulin resistance contributes to the development of type 2 diabetes, obesity, hypertension and hyperlipidemia.4–8 Excess fatty acids cause triglycerides to accumulate and appear in the form of lipid droplets in liver and muscle, which in turn interfere with the insulin signaling pathway and induce insulin resistance. Fatty acid homeostasis is the consequence of the balance between lipid catabolism and anabolism. Lipid catabolism includes beta oxidation of fatty acids and degradation of triglycerides. The former requires the involvement of the transcription factor (peroxisome proliferator-activated receptor, PPAR) and metabolic enzymes (carnitine palmitoyl transferase 1a, CPT), while the latter requires regulation of lipase or autophagy.9–13 Lipid anabolism is also accomplished by the regulation of transcription factors (sterol regulatory element-binding protein-1, SREBP1) and proteins (acetyl-CoA carboxylase, ACC).14,15 Inhibition of ACC in the liver decreases hepatic malonyl-CoA and lipogenesis.Autophagy is a cellular process involving the lysosome-dependent degradation of damaged organelles, unfolded or misfolded proteins and pathogens, etc., which achieves the recycling and utilization of intracellular substances, providing essential materials for cell reconstruction, regeneration and repair.16–18 Autophagy diminishes the accumulation of lipid droplets in hepatocytes under energy stress, reduces the lipotoxicity to hepatocytes, and enhances insulin sensitivity.19,20 Hepatic autophagy is blocked and the expression of autophagy-related genes is decreased in obese mice. After overexpression of the autophagy gene ATG7, the level of autophagy in the liver is upregulated, and insulin resistance and glucose intolerance significantly improve.21,22 The molecular mechanism by which autophagy participates in the development of insulin resistance is complex and has not yet been clarified. However, some compounds, especially natural products, have been revealed to improve insulin resistance by regulating autophagy.23 Our previous data show that ginsenoside Rg2 enhances insulin sensitivity in high-fat-diet (HFD) fed mice by activating autophagy.24
Gomphidiaceae rutilus (a basidiomycete) is an edible fungus and functional food that is commonly grown in the northeast of China.25 The fruiting body is rich in polysaccharides.26 The polysaccharides possess various biological activities, including regulation of cell division, differentiation, growth and senescence, immunomodulation, and anti-oxidative and anti-tumor activities.25,27,28
We recently isolated the total polysaccharide (AGRP), acidic polysaccharide (AGRP-A) and neutral polysaccharide (AGRP-N) fractions from Gomphidiaceae rutilus fruiting bodies. In our previous study,29 the effects of different mushroom polysaccharides on insulin resistance were compared using high fatty acid and glucose (FG)-treated hepatocytes. We found that both the AAMP-N polysaccharide fractions from Armillaria mellea and AGRP-N polysaccharide fractions from Gomphidiaceae rutilus showed the best activity in vitro, but we did not deeply investigate the oral hypoglycemic effects and mechanisms of AGRP-N.
Thus, here we evaluate the ability of the polysaccharides from Gomphidiaceae rutilus to improve insulin resistance in obese mice caused by genetic defects and identify the autophagy-associated mechanisms.
2. Materials and methods
2.1 Preparation and characterization of polysaccharides
The polysaccharides were extracted based on our previous publication.29 Briefly, fruiting bodies were extracted with dH2O at 100 °C and then with 0.5 M NaOH solution. The extracts were neutralized with glacial acetic acid and precipitated with ethanol. The total polysaccharide AGRP fraction was obtained. The AGRP fraction was further fractionated by DEAE-cellulose column (7.5 × 30 cm, Cl−). The eluate included a neutral fraction (AGRP-N) eluted with dH2O and an acidic fraction (AGRP-A) eluted with 0.4 M NaCl.The total carbohydrate content was determined using the phenol sulfuric acid method with glucose as the standard. The uronic acid content was determined using the meta-hydroxyl diphenyl method with glucuronic acid as the standard. The monosaccharide composition was determined using high-performance liquid chromatography (HPLC). Briefly, polysaccharides were initially hydrolysed with anhydrous methanol containing 2 M MeOH/HCl at 80 °C and then with 2 M trifluoroacetic acid at 120 °C. After derivatization with 1-phenyl-3-methyl-5-pyrazolone (PMP), the derivatives were analysed by HPLC.
2.2 Cell culture
Mouse hepatoma Hepa1–6 cell line was purchased from ATCC. The cells were grown in DMEM (25 mM glucose, Gibco) supplemented with 10% FBS at 37 °C and 5% CO2. GFP-LC3/HeLa cells were maintained in DMEM supplemented with 10% FBS and 0.4 mg ml−1 G418 at 37 °C and 5% CO2. All experiments were performed when the cells reached 80% confluence.2.3 Immunofluorescence assay
GFP-LC3/HeLa cells were seeded in 24-well plates at a density of 5 × 10⁴ cells per well. After 24 h, the cells were then treated with normal medium, starvation medium (Earle's balanced salt solution; Sigma-Aldrich, E7510), and normal medium containing 0.1 mg ml−1 or 1.0 mg ml−1 of AGRP, AGRP-N or AGRP-A for 3 h. The cells were then washed with PBS and fixed with 4% PFA for 15 min. Intracellular puncta were quantified by fluorescence microscopy (Olympus).2.4 Glucose uptake assay
High glucose and fatty acid (FG)-induced insulin-resistant cells were established as described previously.29 Hepa1–6 cells were cultured in high glucose (25 mM) DMEM supplemented with 10% FBS and 1% antibiotics in a 96 well plate at a density of 5 × 10³ cells per well for 24 h. The cell culture medium was changed to FG-conditioned medium (25 mM glucose and 0.5 mM palmitic acid and oleic acid) with or without polysaccharides for 24 h. Subsequently, the cells were treated with 1 nM insulin for 12 h in serum-free low glucose DMEM medium (5 mM glucose). The cell culture medium was collected for glucose uptake measurement (Applygen, China) using a microplate reader (Infinite 50, Tecan, Switzerland). Glucose content is determined by the formation of hydrogen peroxide by glucose catalysed by glucose oxidase, which in turn produces colored quinone-imine via peroxidase catalysis. The glucose content is determined by detecting the color of quinone-imine.2.5 Western blots
The cells or tissues (70 mg) were homogenized in buffer (50 mM Tris, 150 mM NaCl, 1 mM EDTA, 1% Triton X-100, proteinase inhibitor cocktail and phosphatase inhibitor cocktail) at a ratio of 1![[thin space (1/6-em)]](https://www.rsc.org/images/entities/char_2009.gif) :10 (w/v). The cell lysates (10 μg) or tissue lysates (30 μg) were subjected to immunoblotting. Western blots were performed using the following primary antibodies: anti-LC3 (Novus Biologicals, NB100-2220), anti-p62 (Abnova, H00008878-M01), anti-p-AMPK (Cell Signaling, 2535), anti-AMPK (Cell Signaling, 2532), anti-p-mTOR (Cell Signaling, 9862), anti-mTOR (Cell Signaling, 9964), anti-p-IRS1 (ser 318) (Cell Signaling, 5610 T), anti-IRS1 (Cell Signaling, 3407T), anti-PPARα (Santa Cruz, sc-398394), anti-CPT1a (Abcam, ab234111), anti-SREBP1 (Novus Biologicals, NB100-2215), anti-ACC (Cell Signaling, 3676) or anti-β-actin (BD Biosciences, 612657) antibodies.
:10 (w/v). The cell lysates (10 μg) or tissue lysates (30 μg) were subjected to immunoblotting. Western blots were performed using the following primary antibodies: anti-LC3 (Novus Biologicals, NB100-2220), anti-p62 (Abnova, H00008878-M01), anti-p-AMPK (Cell Signaling, 2535), anti-AMPK (Cell Signaling, 2532), anti-p-mTOR (Cell Signaling, 9862), anti-mTOR (Cell Signaling, 9964), anti-p-IRS1 (ser 318) (Cell Signaling, 5610 T), anti-IRS1 (Cell Signaling, 3407T), anti-PPARα (Santa Cruz, sc-398394), anti-CPT1a (Abcam, ab234111), anti-SREBP1 (Novus Biologicals, NB100-2215), anti-ACC (Cell Signaling, 3676) or anti-β-actin (BD Biosciences, 612657) antibodies.
2.6 Oil Red O staining
Hepa1–6 cells were seeded in a 24 well plate at a density of 5 × 10⁴ cells per well for 24 h and treated with FG or FG plus polysaccharides for 24 h. This was followed by incubation with bafilomycin A1 (100 nm) for 6 h, then the cells were washed with PBS. The cells were fixed with 4% paraformaldehyde for 20 min and washed twice with dH2O. After further washing for 5 min with 1,2-propanediol, the cells were stained with 0.5% Oil Red O solution (0.5% Oil Red O in 1,2-propanediol; Alfa Aesar, A12989) and heated at 60 °C for 20 min. Finally, the cells were incubated in 85% 1,2-propanediol for 5 min. Lipid droplets were examined by light microscopy.2.7 Animals and treatment
Male C57BL/6J and ob/ob mice (leptin-deficient mice usually used as a model for obesity-induced type II diabetes) were obtained from GemPharmatech Co., Ltd (Nanjing, China ). Mice were provided with a standard laboratory chow (60% cereals, 33% protein and 3% oil) and water, and were used at 5 weeks of age. All experiments were performed in accordance with the NIH guidelines for the care and use of laboratory animals (NIH Publication no. 85-23, revised 1996) and were approved by the Animal Care and Use Committee of Northeast Normal University (SYXK 2018-0015).Mice were randomly allocated into six groups given 50 mg kg−1 d−1 orally (by gavage) of the indicated polysaccharides or metformin for 4 weeks. On the last day of the experiment, serum was collected from the orbital sinus after centrifugation at 14000 rpm and 4 °C for 20 min. Besides that, the tissues were harvested, weighed, and processed for subsequent analysis.
2.8 Glucose tolerance test and insulin tolerance test
For the glucose tolerance test, mice were fasted for 8 h followed by intraperitoneal injection of glucose (2 g kg−1). For the insulin tolerance test, mice were fasted for 6 h followed by injection of insulin (1.5 U kg−1). Blood glucose concentrations were determined at 0, 15, 30, 60 and 120 min after injection using a One Touch Ultra Easy Glucometer (Johnson, New Brunswick, NJ, USA).2.9 Biochemical analyses
The activity for non-esterified fatty acid (NEFA, A042-2) and triglyceride (TG, A110-1) in serum or homogenized liver was examined according to the oxidase method provided by a standard assay kit (Nanjing Jiancheng Bioengineering Institute, China). Alanine aminotransferase (ALT, C009-2) and aspartate aminotransferase (AST, C010-2) in serum were evaluated using a standard assay kit (Nanjing Jiancheng Bioengineering Institute, China). The method was based on the spectrophotometric measurement of the product color during the reaction of 2,4-dinitrophenylhydrazine with pyruvic acid.2.10 H&E staining
Livers were fixed in 4% paraformaldehyde (Sangon Biotech, A500684-0500), and then embedded in paraffin. Sections of 5 μm thickness were stained with H&E for morphometry analysis. Photomicrographs were taken using a light microscope equipped with a camera.2.11 Quantitative real-time PCR (RT-qPCR)
Total RNA was prepared from the mouse liver (70 mg) using TRNzol A+ (700 μl, TIANGEN BIOTECH, DP421) and RNA (3 μg) was then reverse transcribed into cDNA using M-MLV reverse transcriptase (Promega, Fitchburg, WI, USA). 1 μg of DNA was used for real-time PCR using SYBR green master mix (Roche Applied Science, 4913850001) and a LightCycler 480 real-time PCR system (Roche Applied Science, Indianapolis, IN, USA). The amplification was performed with a three-step program: 1 cycle at 95 °C for 10 min, followed by 45 cycles of 95 °C for 30 s, 68 °C for 30 s, and 72 °C for 30 s, with a signal collecting step after annealing and extending for 10 s. Specific primers for each gene were designed using NCBI Primer Blast. The sequences of the qPCR primers are as follows:Ppara-F, 5′-CTTCAACATGAACAAGGTCAAAGC-3′
Ppara-R, 5′-AGCCATACACAGTGTCTCCATATC-3′
Cpt1a-F, 5′-CTCAGTGGGAGCGACTCTTCA-3′
Cpt1a-R, 5′-GGCCTCTGTGGTACACGACAA-3′
Gapdh-F, 5′-TGTGTCCGTCGTGGATCTGA-3′
Gapdh-R, 5′-TTGCTGTTGAAGTCGCAGGAG-3′
2.12 Statistical analysis
The results were expressed as the means ± s.e.m. Statistical analysis of the data was performed using two-way repeated-measures ANOVA with Dunnett's post-hoc test (IBM SPSS Statistics 17.0, Armonk, NY, USA). Significance was defined as p < 0.05, 0.01 or 0.001.3. Results
3.1 Extraction of the polysaccharides from the fruiting bodies of Gomphidiaceae rutilus
The polysaccharides were extracted from the fruiting bodies of Gomphidiaceae rutilus (AGRP) using an NaOH solution, followed by neutralization and ethanol precipitation according to our previous study.29 The AGRP was fractionated using a DEAE-cellulose column into a neutral polysaccharide fraction (AGRP-N) with a yield of 30.0% and an acidic polysaccharide fraction (AGRP-A) with a yield of 43.7% (Fig. 1). Monosaccharide composition analysis showed that AGRP was mainly composed of glucose (Glc, 70.8%), galactose (Gal, 13.2%), mannose (Man, 6.7%) and xylose (Xyl, 6.1%). AGRP-N mainly contained Glc (53.0%), Gal (29.4%), Man (9.8%) and fucose (Fuc, 4.4%). AGRP-A was composed of Glc (69.3%), Gal (14.2%), Man (10.9%) and a trace amount of GlcA (Fig. 1). As mushroom polysaccharides mainly contain homo- or hetero-glucans, galactans or mannans according to the published literature,30 AGRP-N perhaps contained heterogalactans or heteroglucans, while AGRP-A might contain heteroglucans. The molecular weight distributions of the three polysaccharide fractions are presented in Fig. 1C–E.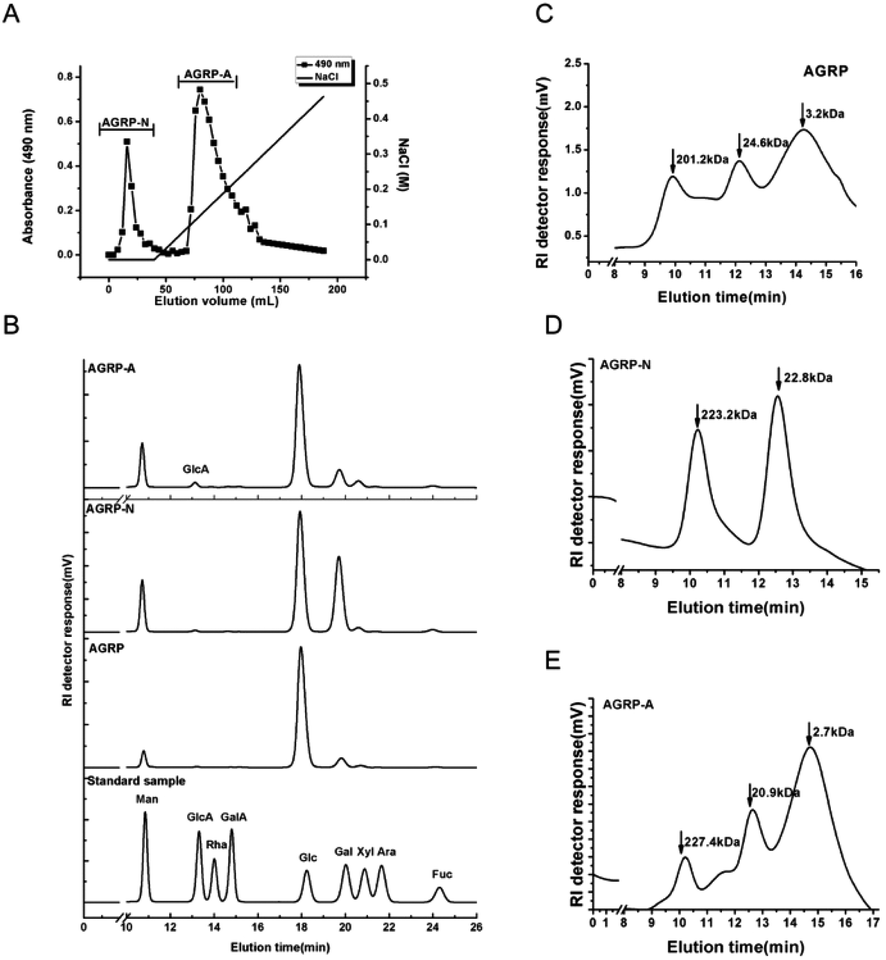 | ||
| Fig. 1 Characterization of the polysaccharide fractions. (A) Elution profiles of the polysaccharide fractions on a DEAE-cellulose column. (B) The monosaccharide composition of the polysaccharide fractions was analysed by HPLC. (C) The molecular weight distribution of AGRP was analysed on the TSK column. (D) The molecular weight distribution of AGRP-N was analysed on the TSK column. (E) The molecular weight distribution of AGRP-A was analysed on the TSK column. | ||
3.2 The polysaccharides from the fruiting bodies of Gomphidiaceae rutilus induced autophagy
HeLa cells stably expressing GFP-LC3 puncta are commonly used to screen autophagy inducers,31 thus the effects of the polysaccharides from Gomphidiaceae rutilus on autophagy induction in GFP-LC3/HeLa cells were assessed. Compared to the normal cells, the number of puncta increased in each polysaccharide-treated cell, indicating that all the polysaccharides from Gomphidiaceae rutilus induced autophagy. At a low concentration (0.1 mg ml−1), the autophagy induction intensities were AGRP-N > AGRP > AGRP-A. However, at a higher concentration (1.0 mg ml−1), their autophagy induction ability was similar and weakened compared with the respective activities at the lower concentration (Fig. 2). We speculated that the high concentration of polysaccharides might exert stress on the cells, meaning that the autophagy enhancement is not specific to the polysaccharide treatment (Fig. 2).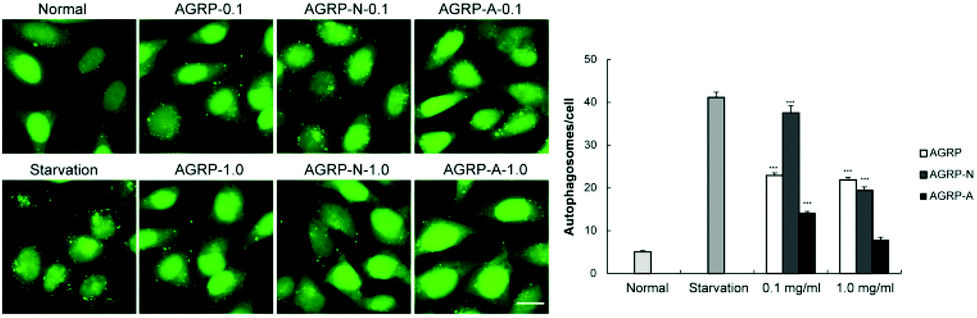 | ||
| Fig. 2 The polysaccharides induced autophagy in vitro. (A) Representative images of GFP-LC3 puncta in GFP-LC3 expressing HeLa cells treated with normal, starvation or polysaccharides for 3 h. Scale bar: 100 μm. (B) Quantification of (A). Results represent means ± s.e.m. ***p < 0.001. | ||
3.3 The polysaccharides from the fruiting bodies of Gomphidiaceae rutilus improved insulin resistance through autophagy enhancement in vitro
Some autophagy enhancers have been reported to increase insulin sensitivity in diabetic mice,23 and the three polysaccharide fractions from Gomphidiaceae rutilus showed different autophagy induction abilities; therefore, their effects on insulin function correlated with autophagy were examined in vitro. In our previous study, high fatty acid and glucose (FG) induced insulin resistance in hepatocytes,29 herein the effects of polysaccharides on insulin resistance were assessed in this cell model. The polysaccharide fractions were applied at a low concentration of 0.1 mg ml−1 and a high concentration of 1.0 mg ml−1 according to our previous work.29 In Fig. 3A, compared to the control cells, the insulin-stimulated glucose uptake decreased in FG-treated cells. The glucose uptake significantly reversed in cells treated with FG plus AGRP or AGRP-N, but not in the FG plus AGRP-A treated cells. However, the abilities of AGRP and AGRP-N to increase glucose uptake were suppressed by treatment with the autophagy inhibitor bafilomycin A1. The results indicated that AGRP and AGRP-N improved insulin resistance through autophagy induction.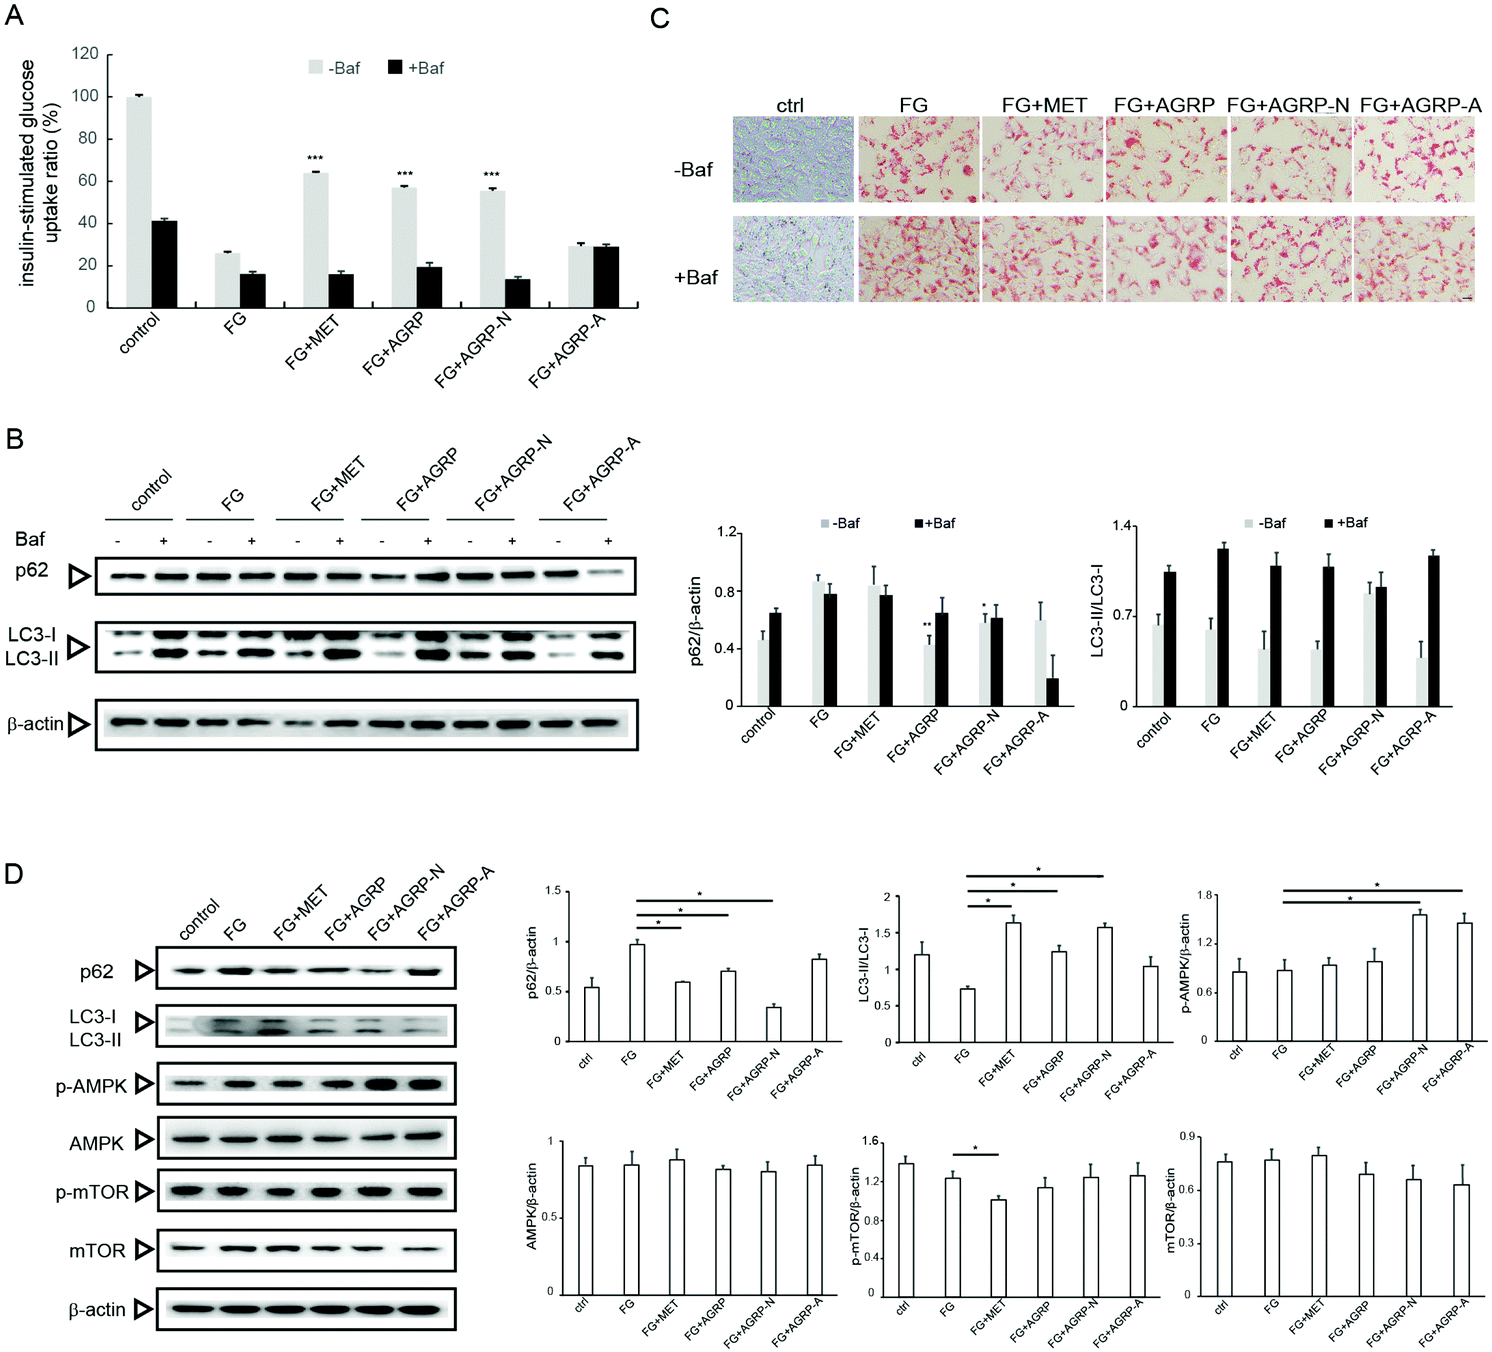 | ||
| Fig. 3 The polysaccharides enhanced autophagy by activating the AMPK pathway to improve insulin resistance in vitro. The Hepa1–6 cells were cultured in normal medium or FG medium, or FG medium containing metformin (MET), or FG medium containing polysaccharides. (A) The insulin-stimulated glucose uptake in the presence or absence of the lysosomal inhibitor bafilomycin A1 (Baf). (B) Western blot detection of p62 and LC3 in the presence or absence of the lysosomal inhibitor Baf. (C) Representative images of lipid droplets with Oil Red O staining in Hepa1–6 cells in the presence or absence of the lysosomal inhibitor Baf. Scale bar: 100 μm. (D) AMPK and mTOR signaling pathways were analysed by western blot (left) and quantified (right) in Hepa1–6 cells. Results are presented as means ± s.e.m. *p < 0.05; ***p < 0.001. | ||
To further confirm this conclusion, we also examined the expressions of autophagy markers p62 and LC3. In Fig. 3B, compared to FG-treated cells, p62 degraded and the ratio of LC3-II/LC3-I increased in AGRP and AGRP-N treated cells, but not in AGRP-A treated cells. However, the increased autophagy by AGRP and AGRP-N was impaired in the presence of the autophagy inhibitor.
In addition, we observed the amount and morphology of lipid droplets in the cells using oil red staining (Fig. 3C). It was found that the numbers of lipid droplets in the cells treated with the AGRP and AGRP-N polysaccharide fractions were both significantly reduced and the lipid droplets were smaller than those in the FG-treated cells. AGRP-A did not change the lipid droplets. However, the amount of lipid droplets in the cells treated with FG and polysaccharides all increased and became larger after the addition of bafilomycin A1, indicating that AGRP and AGRP-N inhibited the formation of lipid droplets in cells via activating autophagy.
The AMPK/mTOR axis is regarded as the major signaling pathway in autophagy induction,32 therefore autophagy activation by AGRP and AGRP-N associated with this pathway was examined as well. In Fig. 3D, AGRP and AGRP-N markedly increased AMPK phosphorylation, while they had no effects on mTOR phosphorylation, suggesting that AGRP and AGPR-N activated autophagy in an AMPK-dependent but mTOR-independent manner.
3.4 The polysaccharides AGRP and AGRP-N increased insulin sensitivity in ob/ob mice
Since the polysaccharides AGRP and AGRP-N improved insulin resistance in hepatocytes, their oral hypoglycemic effects in ob/ob mice were tested. The polysaccharide was administered at a low dose of 50 mg kg−1 according to our published article.29 Besides that, this dose is commonly used in the literature. After the mice were administered 50 mg kg−1 of polysaccharides for 4 weeks, the three polysaccharide fractions from Gomphidiaceae rutilus did not impact body weight (Fig. 4A), gonadal WAT mass and inguinal WAT mass (Fig. 4C and D). Nevertheless, AGRP and AGPR-N were able to decrease blood glucose in mice, even more strongly than the positive hypoglycemic drug metformin (Fig. 4B). Furthermore, AGRP and AGRP-N showed similar blood glucose curves to metformin either in GTT or in ITT, indicating that AGRP and AGRP-N improved glucose intolerance and insulin resistance (Fig. 4E and F). Compared to the ob/ob mice, AGRP and AGRP-N decreased the insulin level and HOMA-IR (Fig. 4G). The results were in accordance with the in vitro results showing that AGRP and AGRP-N had the potential to enhance insulin sensitivity, but not AGRP-A.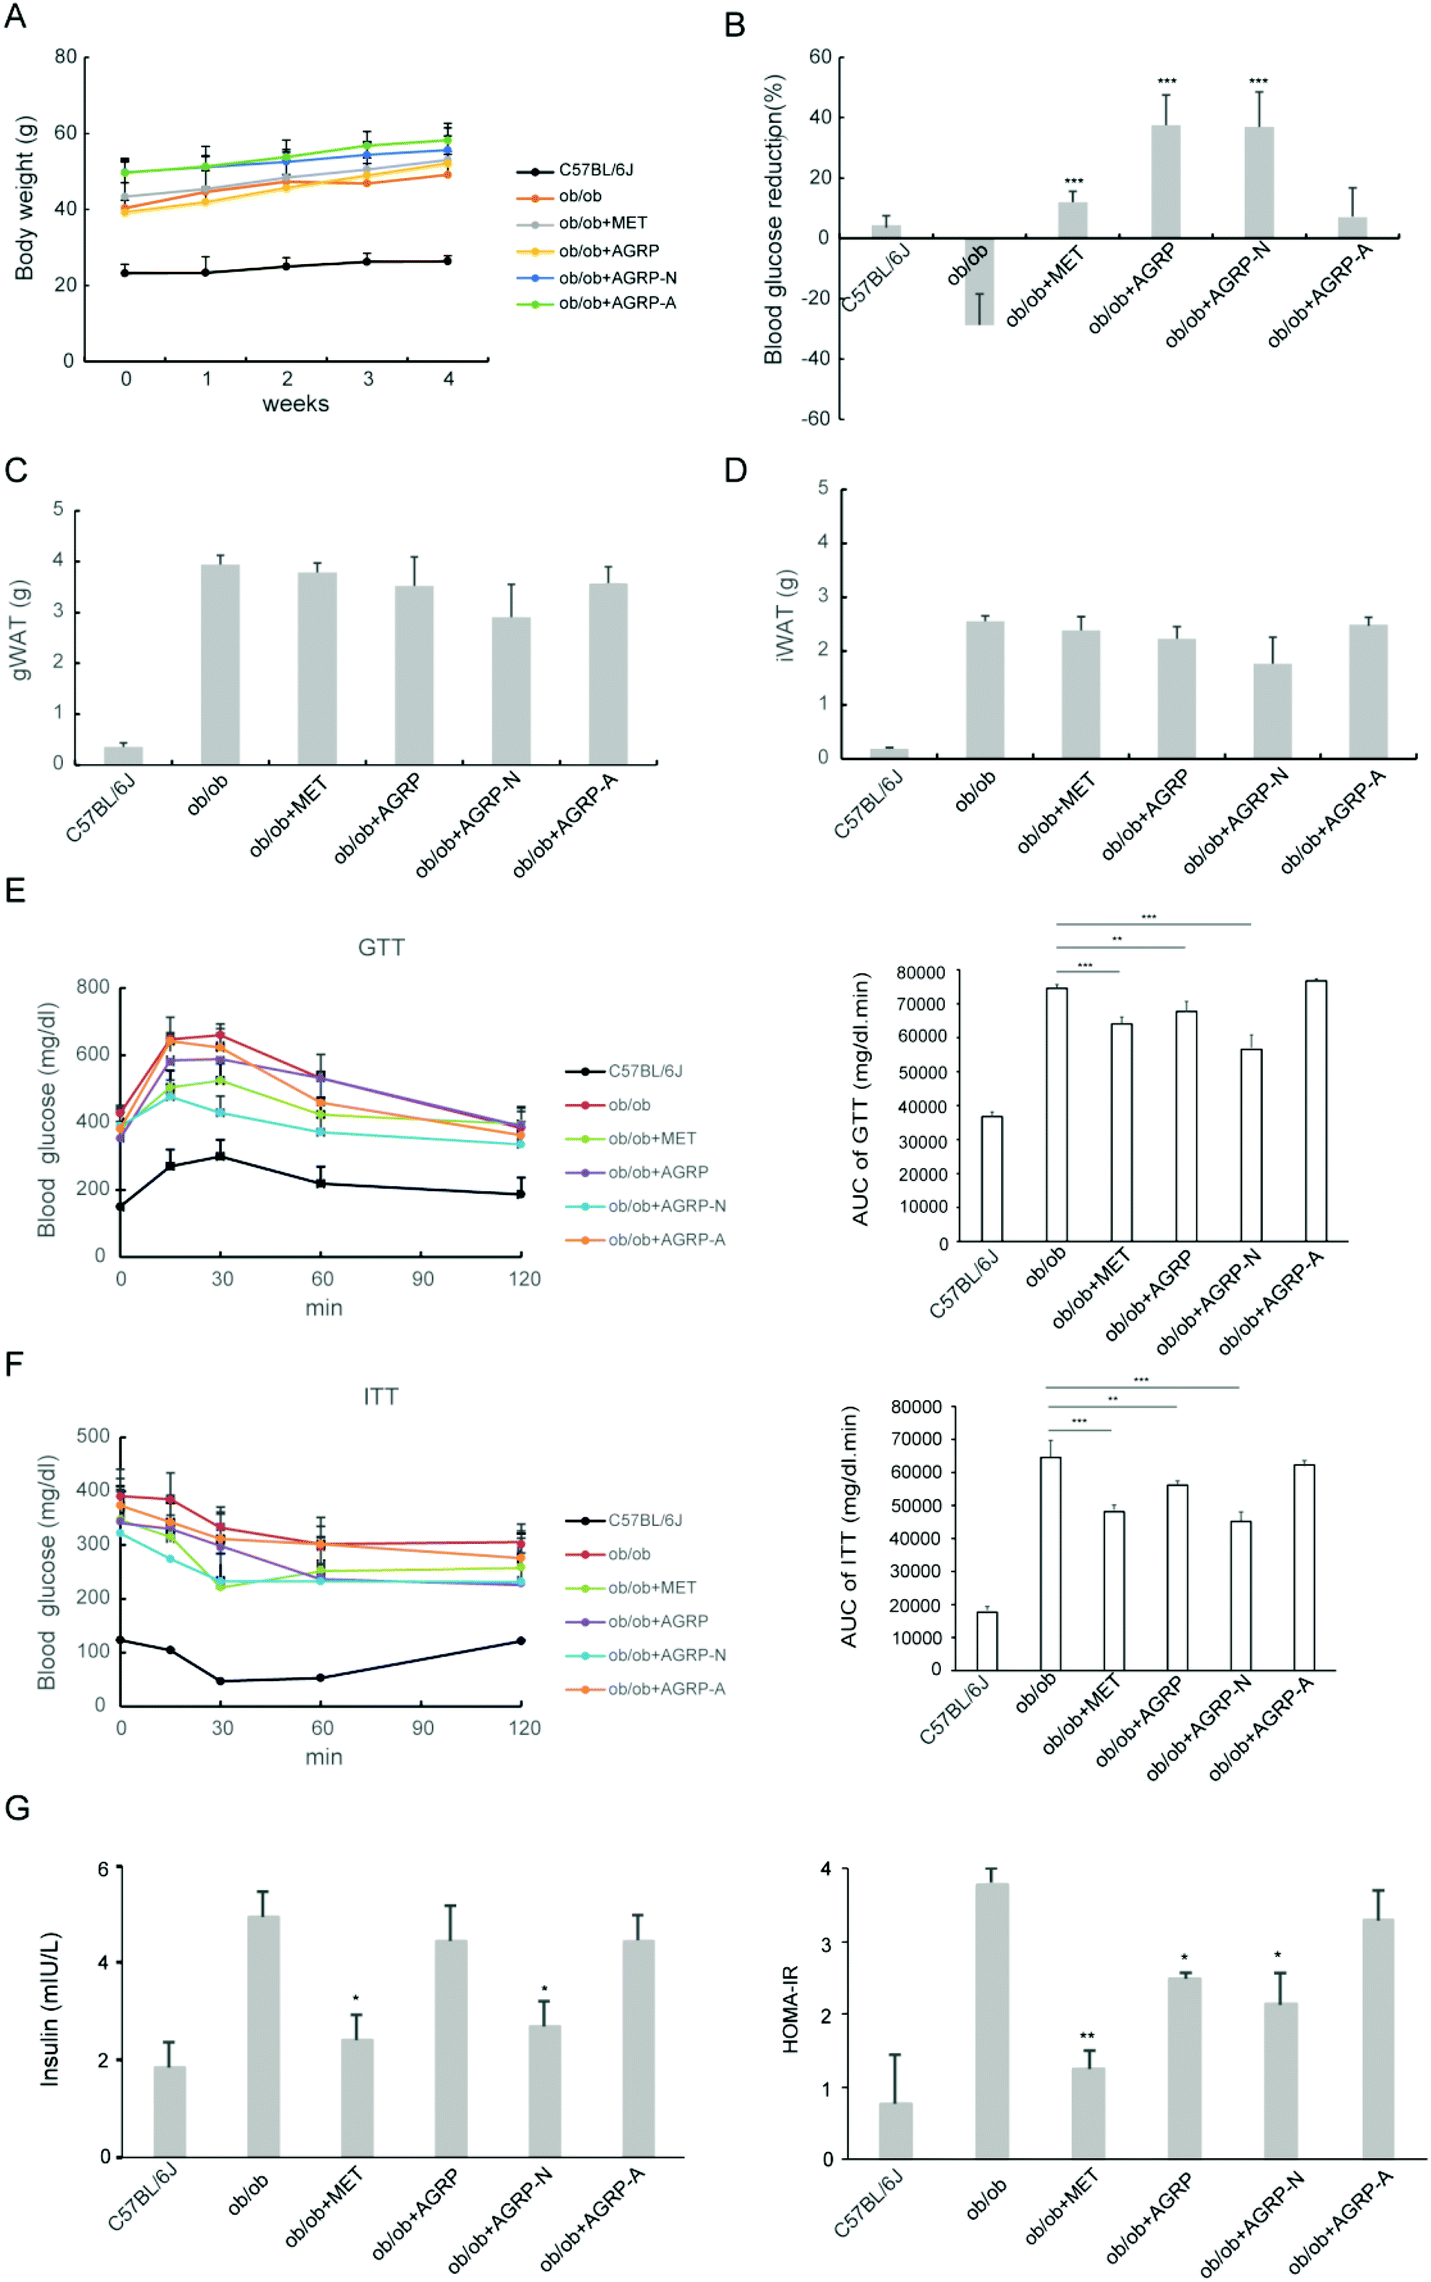 | ||
| Fig. 4 Treatment with polysaccharides improved insulin resistance to reduce blood glucose in ob/ob mice. The mice were treated with metformin or polysaccharides for 4 weeks. (A) Body weight. (B) Reduction ratio of blood glucose compared to their initial blood glucose. (C) Gonadal white adipose tissue (gWAT) mass. (D) Inguinal white adipose tissue (iWAT) mass. (E) Glucose tolerance test (GTT) (left) and area under the curve (AUC) of the GTT. (F) Insulin tolerance test (ITT) and AUC of the ITT. (G) Insulin levels in serum and HOMA-IR. Results are presented as means ± s.e.m. Statistics compare each value in ob/ob mice and polysaccharide-treated obese mice. N = 6–8. **p < 0.01; ***p < 0.001. | ||
3.5 The polysaccharides AGRP and AGRP-N reduced fat accumulation in the liver
The liver is the main insulin-responsive tissue and also contributes to maintaining glucose homeostasis. Since AGRP and AGPR-N enhanced insulin sensitivity, we investigated their effects on liver function. The polysaccharides did not improve ALT and AST (Fig. 5A and B). However, the levels of TG and NEFA in the liver and serum were all significantly reduced in AGRP and AGRP-N treated mice (Fig. 5C–F). Moreover, AGRP and AGRP-N caused a significant decrease in the number of lipid droplets in the liver, indicating that they attenuated fat accumulation (Fig. 5G).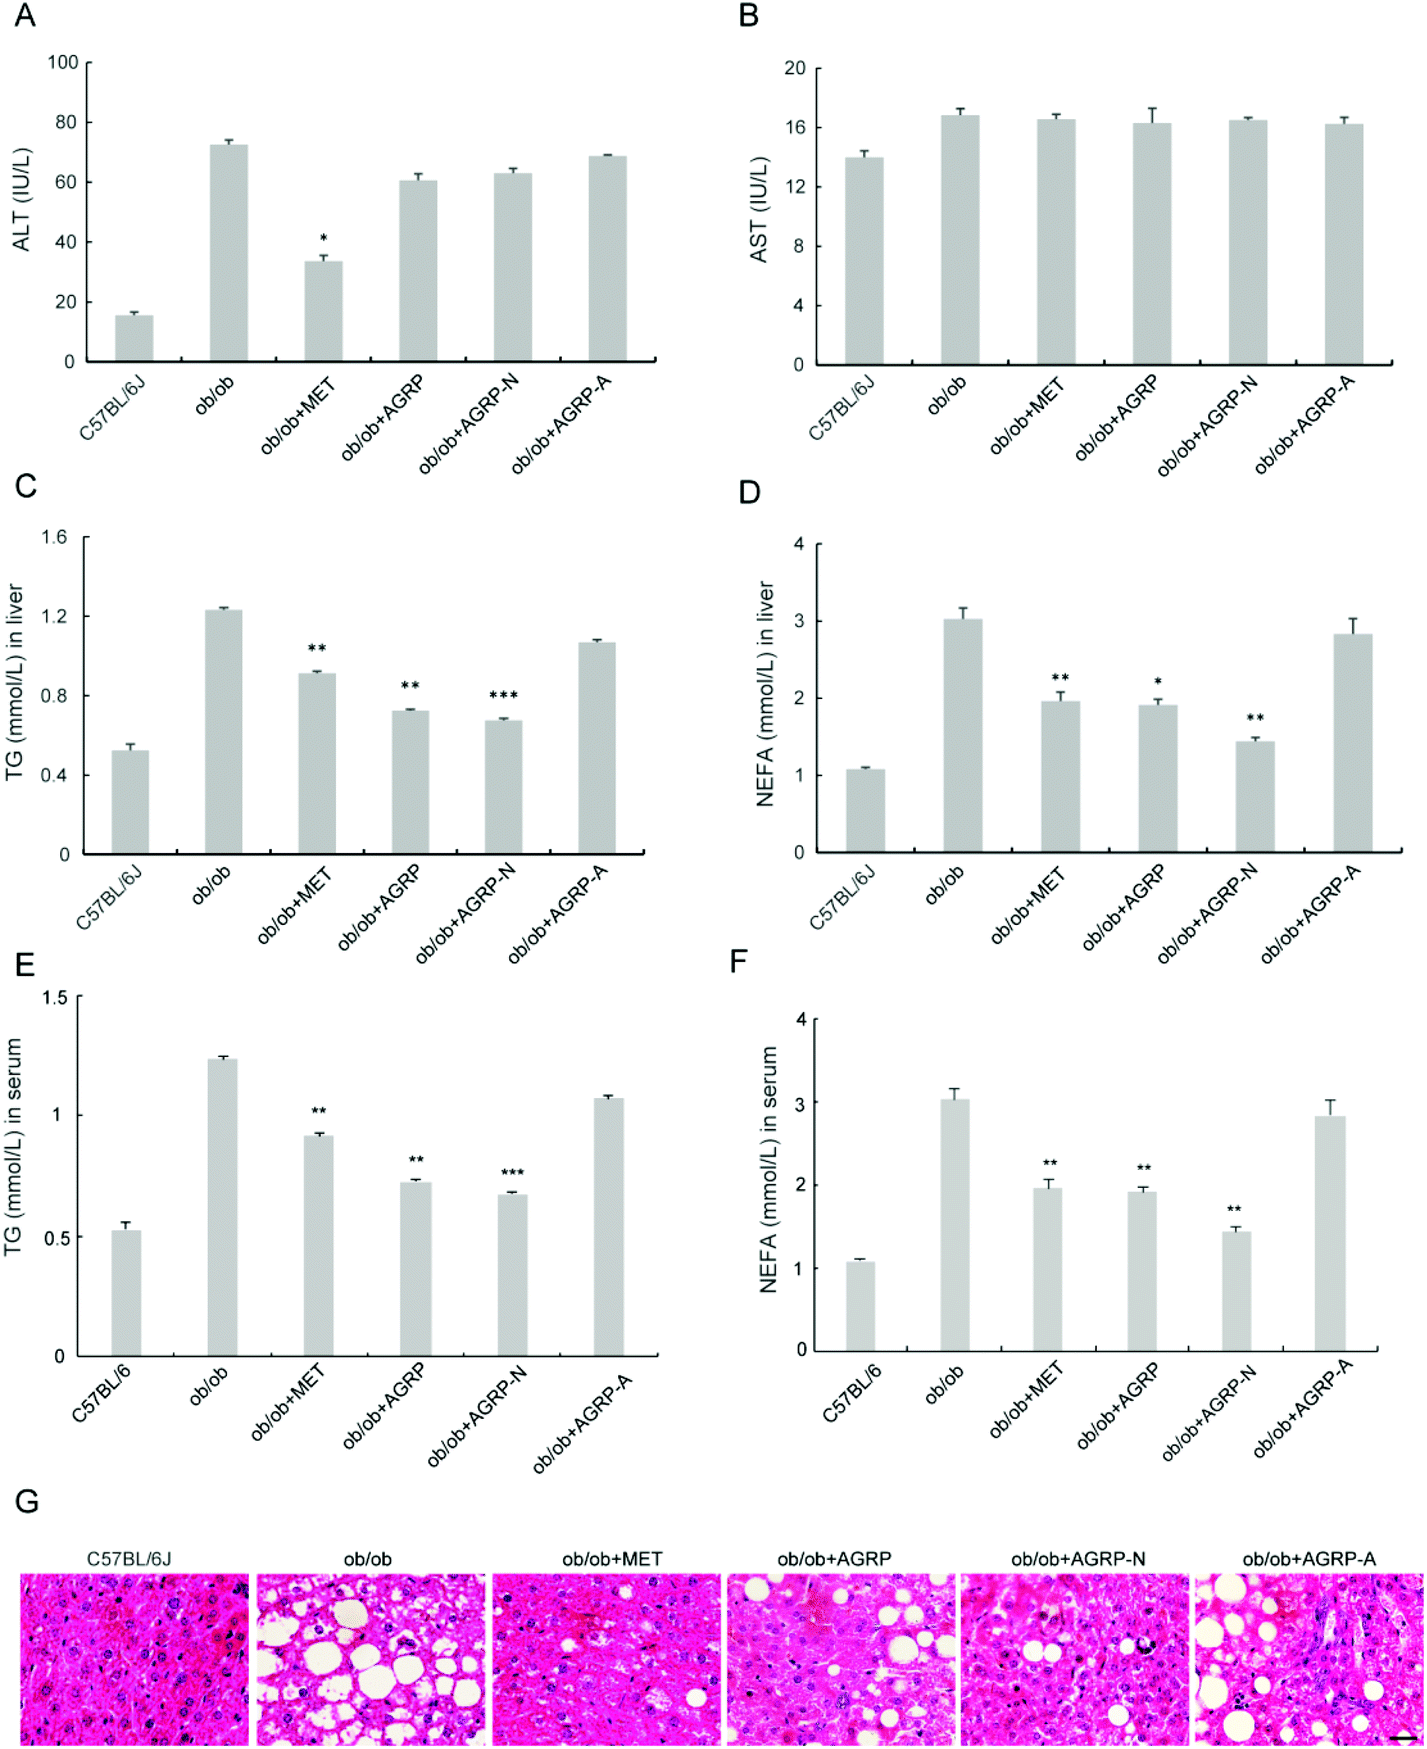 | ||
| Fig. 5 Treatment with the polysaccharides decreased fat deposition in the liver of ob/ob mice. (A) Alanine transaminase (ALT) content in serum. (B) Aspartate transaminase (AST) content in serum. (C) Triglyceride (TG) content in liver. (D) Non-esterified free fatty acid (NEFA) content in liver. (E) Contents of TG in serum. (F) NEFA content in serum. (G) Representative images of the liver sections with HE staining. Scale bar: 100 μm. Results are presented as means ± s.e.m. Statistics compare each value in ob/ob mice and polysaccharide-treated obese mice. N = 6–8. *p < 0.05; **p < 0.01; ***p < 0.001. | ||
3.6 The polysaccharides AGRP and AGRP-N enhanced autophagy and lipolysis
Numerous studies have revealed that enhancement of autophagy can accelerate the breakdown of lipid droplets in the liver, and AGRP and AGRP-N were able to enhance insulin sensitivity via activating autophagy in vitro. Therefore, we investigated whether their improvement of hepatic insulin sensitivity and reduction of fat accumulation is associated with autophagy. Compared to the ob/ob mice liver, AGRP and AGRP-N distinctly increased the degradation of p62 and the conversion of LC3-I to II. They activated AMPK phosphorylation, but not mTOR, suggesting that they enhanced autophagy in an AMPK-dependent and mTOR-independent manner. Meanwhile, they also markedly enhanced the phosphorylation of IRS, indicating that they increased insulin sensitivity in the liver (Fig. 6A).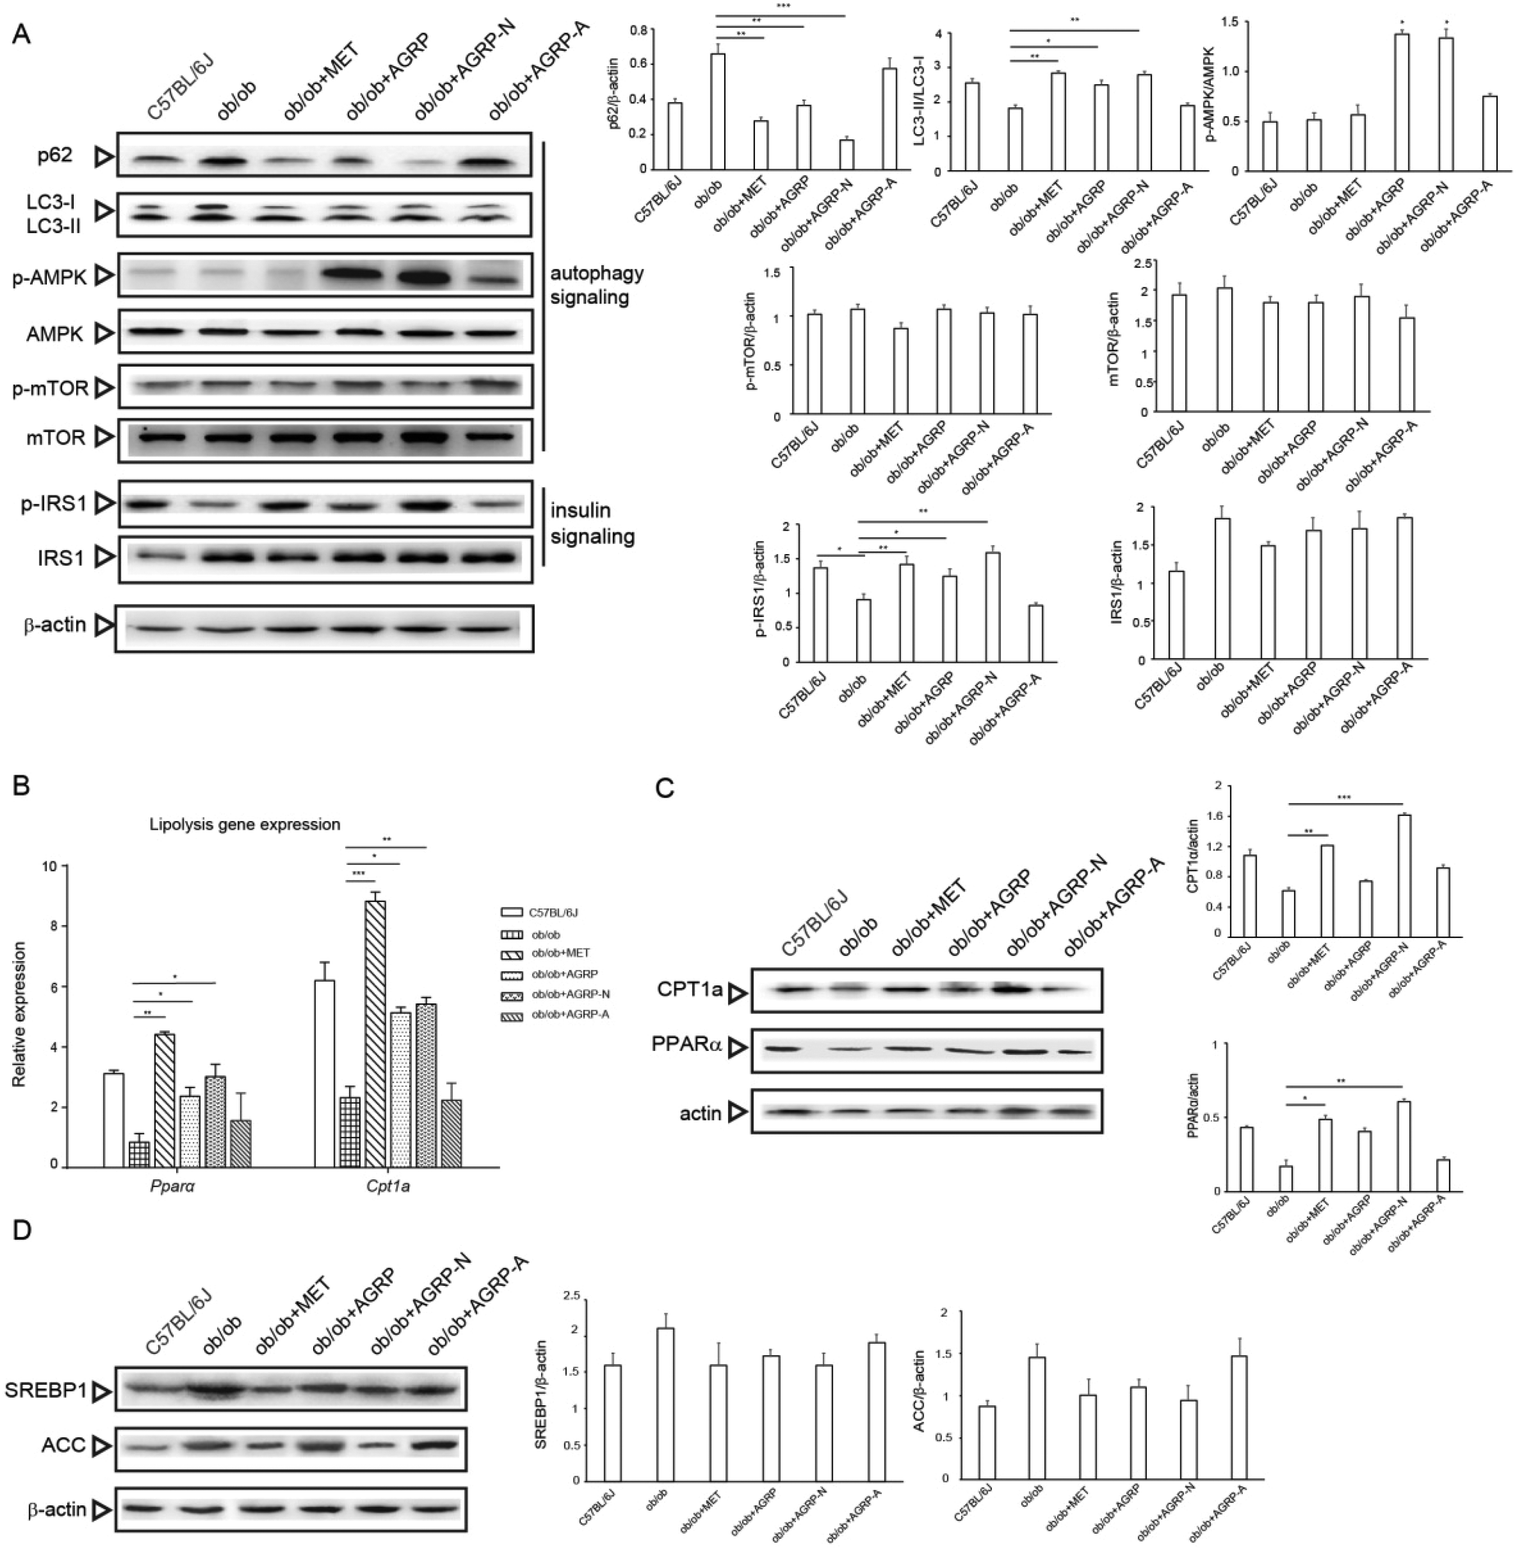 | ||
| Fig. 6 The polysaccharides enhanced autophagy and lipolysis in the liver of ob/ob mice. (A) The autophagy signaling pathway and insulin signaling pathway were detected by western blot (left) and quantified (right). (B) Expression of lipolysis regulators in the liver by real-time PCR (Pparα: peroxisome proliferator-activated receptor; Cpt1a: carnitine palmitoyl transferase 1a). (C) Expressions of lipolysis regulators in the liver by western blot. (D) Expressions of lipogenesis regulators in the liver by western blot. SREBP1: Sterol regulatory element-binding protein 1; ACC: acetyl-CoA carboxylase. Results are presented as means ± s.e.m. Statistics compare each value in ob/ob mice and polysaccharide-treated obese mice. N = 6–8. *p < 0.05; **p < 0.01; ***p < 0.001. | ||
Although autophagy regulates lipolysis, some fatty acid oxidation regulators are also involved.33 Compared to the ob/ob mice, the polysaccharides AGRP and AGRP-N not only obviously increased the gene expressions of PPARα and CPT1a, but also enhanced their protein levels (Fig. 6B and C), suggesting that the polysaccharides could enhance fatty acid beta oxidation. However, the polysaccharides have no effect on the expression of lipogenesis regulators, indicating that they only specifically affect fat catabolism (Fig. 6D).
4. Discussion
Insulin shows different effects in its target tissues; it promotes glucose absorption in fat and muscle, whereas it increases the synthesis and storage of glycogen in the liver to suppress release of glucose into the bloodstream.34 Thus, insulin resistance is characterized by elevated blood glucose. Using high fatty acid and glucose (FG)-induced insulin resistance in hepatocytes, the effects of polysaccharides from Gomphidiaceae rutilus on insulin-stimulated glucose uptake were examined. AGRP and AGRP-N exerted dominant improvement, but not AGRP-A, suggesting that heterogalactans or heteroglucans may be the active domain. These results were consistent with our previous study.29 The AAMP-N polysaccharide fraction from Armillaria mellea and AGRP-N showed similar monosaccharide compositions, with AAMP-N containing Glc (49.8%) and Gal (25.2%) and AGRP-N containing Glc (53.0%) and Gal (29.4%). AAMP-N also improved insulin resistance in vitro and in vivo, thus we are further convinced that heterogalactans or heteroglucans are the active domain.Autophagy is the major method of intracellular nutrient metabolism and energy recycling.35 Autophagy inducers have been shown to regulate blood glucose and lipid metabolism. Although certain compounds have been reported to improve diabetes or obesity through the autophagy pathway, it is unclear whether polysaccharides can function through autophagy. In our previous work, bee pollen polysaccharides were found to regulate blood glucose in high-fat-diet-fed mice by activating autophagy.23 Therefore, we speculated that polysaccharides from Gomphidiaceae rutilus are likely to improve insulin resistance through autophagy. In a previous study, we established a cell model, using HeLa cells expressing GFP-LC3, to rapidly screen autophagy inducers. We found that hepatocytes and HeLa cells respond to autophagy activators in the same way, so we used HeLa cells with simple culture conditions in experiments screening for activators.24 AGRP and AGRP-N significantly increased the number of autophagosomes on GFP-LC3/HeLa cells, suggesting that AGRP and AGRP-N could activate autophagy. Thus, do AGRP and AGRP-N activate autophagy to regulate lipid metabolism, thereby improving insulin resistance under FG treatment? In FG-treated hepatocytes, AGRP and AGRP-N were able to attenuate the inhibitory effect of FG on autophagy. However, the promotion of glucose uptake and the activation of autophagy by AGRP and AGRP-N in hepatocytes were weakened after the addition of autophagy inhibitors. Excessive lipid accumulation could result in decreased sensitivity of cells or tissues to insulin.36 We also found that AGRP and AGRP-N reduced FG-induced intracellular lipid accumulation via autophagy activation. These results indicated that AGRP and AGRP-N improve insulin resistance by activating autophagy to reduce lipid deposition, which is consistent with the reports of autophagy being involved in the regulation of insulin resistance.37
Further, we tested the effects of AGRP and AGRP-N on insulin resistance in obesity-induced hyperglycemic mice. Here we used metformin as the positive control, because it is the most important oral drug for the treatment of obesity-induced diabetes and type 2 diabetes, and it can activate autophagy as well. AGRP and AGRP-N could significantly lower blood glucose, improve glucose and insulin tolerance, and reduce hepatic lipid deposition, similar to metformin, but AGRP-A had no effect. Moreover, the effect of AGRP-N was better than that of AGRP, which further confirmed that they have the same active domain. The different hypoglycemic abilities perhaps result from the effective concentration of the active domain after the intragastric administration. According to the equivalent dose relationship between different experimental animals and humans, mice were orally administered polysaccharides at a dose of 50 mg kg−1, equivalent to a human oral dose of 5.5 mg kg−1. If a man weighs 70 kg, the daily oral polysaccharide dose is 0.375 g. The daily dose of metformin is 0.5–2 g, which means that the effective polysaccharide dose is lower than that of metformin. This is one of the advantages of polysaccharides as a hypoglycemic health food. Numerous literature reports show that most autophagy inducers stimulate autophagy by activating AMPK and inhibiting mTOR,38 but both cell and animal assays have shown that AGRP and AGRP-N activate autophagy via an AMPK-dependent and mTOR-independent signaling pathway. Autophagy is generally regulated by both mTOR-dependent and -independent ways.39 At present, a number of cellular machineries, including calpain40 and JNK/Beclin1/PI3K,41 have been shown to regulate autophagy in an mTOR-independent manner. Trehalose has been found to protect myocardium from insulin resistance-induced myocardial contractile anomalies in an mTOR-independent autophagy induction manner.42 Our previous work also found that ginsenoside Rg2 improves insulin resistance in an AMPK/ULK1-dependent but mTOR-independent autophagy induction manner.24 Therefore, AGRP and AGRP-N activate autophagy in an mTOR-independent manner, indicating that they act on different components of the autophagy machinery.
As well as autophagy, fat catabolism also requires the regulation of lipolytic factors.43 PPAR is the critical transcriptional regulator of lipolytic enzyme expression, an increase of which reflects enhanced lipolysis.10,44 CPT1 is an important lipase in which fatty acids enter the mitochondria for beta oxidation, the increase of which reflects enhanced fatty acid oxidation.45 In the liver of ob/ob mice, AGRP and AGRP-N both increased the expressions of PPARα and CPT1a. This indicates that the polysaccharides regulate lipid metabolism through both autophagy and lipolysis, which confirms that polysaccharides could play roles in multiple ways and via multiple targets.
Besides lipolysis, we also analysed the effects of the polysaccharides on lipogenesis. SREBP1 is the key regulator of lipid anabolism.14 ACC catalyses the carboxylation of acetyl-CoA to form malonyl-CoA, leading to hepatic TG synthesis and accumulation.15 However, the polysaccharides did not show a marked influence on the expressions of SREBP1 and ACC, indicating that AGRP-N and AGRP had no significant effects on lipogenesis.
Currently, our results show that the polysaccharides have oral hypoglycemic effects through the above mechanisms. After gastrointestinal digestion, polysaccharides are usually degraded into oligosaccharides with lower molecular weight, and the degradation products are probably effective ingredients. Therefore, in subsequent experiments, we will continue to deeply analyse the degradation of active polysaccharides by gastrointestinal digestion. The hypoglycemic effects and mechanisms of these products will also be studied. We hope to provide more powerful experimental evidence for Gomphidiaceae rutilus polysaccharides as a novel hypoglycemic health food.
5. Conclusions
Insulin resistance is the main cause of abnormal metabolic diseases, including type 2 diabetes, fatty liver and obesity. The total polysaccharide (AGRP) and the neutral polysaccharide (AGRP-N) fractions isolated from Gomphidiaceae rutilus enhance lipolysis and autophagy to inhibit lipid accumulation in the liver, resulting in increased insulin sensitivity and thus leading to lower blood glucose (Fig. 7). Combining these results, the polysaccharides from Gomphidiaceae rutilus could be used as a functional food or drug against obesity-induced diabetes.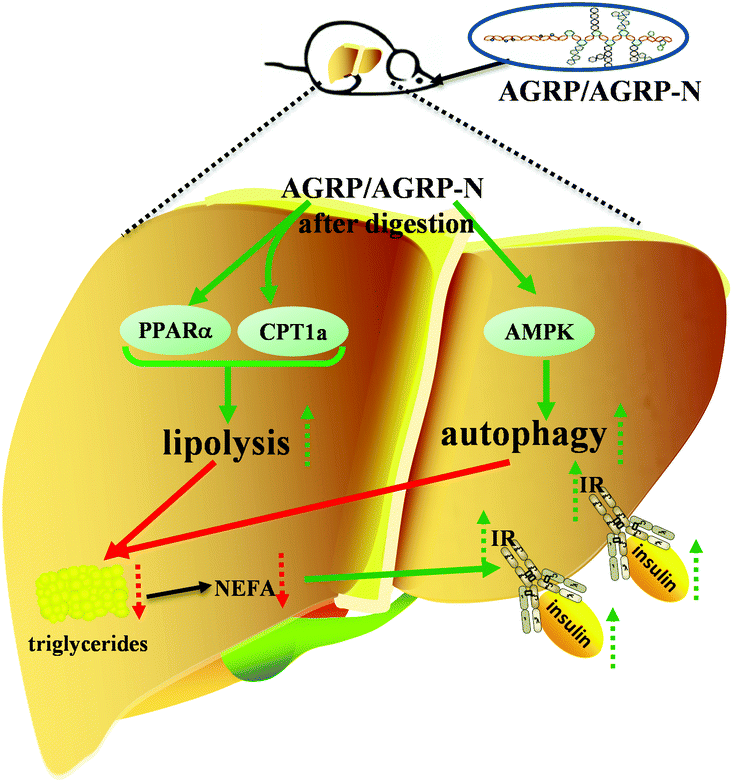 | ||
| Fig. 7 The illustration of the hypoglycemic mechanisms of AGRP and AGRP-N. | ||
Author contributions
S. Y. examined the hypoglycemic effects of the polysaccharides in mice. Y. Q. and L. S. isolated and characterized polysaccharides from Gomphidiaceae rutilus. H. Z. and Z. X. examined the effects of the polysaccharides on insulin resistance in vitro. L. Y. and T. L. detected the autophagy induction activities of the polysaccharides. Y. Z. revised the manuscript. Y. F. contributed to the design of the study, data interpretation and the preparation of the manuscript.Conflicts of interest
The authors declare that they have no conflicts of interest.Acknowledgements
This work was supported by the National Natural Science Foundation of China (No. 31872764), the Scientific and Technologic Foundation of Jilin Province (No. 20180311068YY), Jilin Province Development and Reform Commission (No. 2018C047-2), and Fundamental Research Funds for the Central Universities (No. 2412019ZD009).References
- J. I. Odegaard and A. Chawla, Pleiotropic actions of insulin resistance and inflammation in metabolic homeostasis, Science, 2013, 339, 172–177 CrossRef CAS PubMed.
- S. B. Biddinger, A. Hernandez-Ono, C. Rask-Madsen, J. T. Haas, J. O. Aleman, R. Suzuki, E. F. Scapa, C. Agarwal, M. C. Carey, G. Stephanopoulos, D. E. Cohen, G. L. King, H. Ginsberg and C. R. Kahn, Hepatic insulin resistance is sufficient to produce dyslipidemia and susceptibility to atherosclerosis, Cell Metab., 2008, 7, 125–134 CrossRef CAS PubMed.
- A. M. Johnson and J. M. Olefsky, The origins and drivers of insulin resistance, Cell, 2013, 152, 673–684 CrossRef CAS PubMed.
- G. Boden, Obesity, insulin resistance and free fatty acids, Curr. Opin. Endocrinol., 2011, 18, 139–143 CrossRef CAS PubMed.
- S. E. Kahn, R. L. Hull and K. M. Utzschneider, Mechanisms linking obesity to insulin resistance and type 2 diabetes, Nature, 2006, 444, 840–846 CrossRef CAS PubMed.
- N. K. Lima, F. Abbasi, C. Lamendola and G. M. Reaven, Prevalence of insulin resistance and related risk factors for cardiovascular disease in patients with essential hypertension, Am. J. Hypertens., 2009, 22, 106–111 CrossRef CAS PubMed.
- J. Schrezenmeir, Hyperinsulinemia, hyperproinsulinemia and insulin resistance in the metabolic syndrome, Experientia, 1996, 52, 426–432 CrossRef CAS PubMed.
- M. H. Shanik, Y. Xu, J. Skrha, R. Dankner, Y. Zick and J. Roth, Insulin resistance and hyperinsulinemia: is hyperinsulinemia the cart or the horse?, Diabetes Care, 2008, 31, 262–268 CrossRef PubMed.
- M. Fischer, M. You, M. Matsumoto and D. W. Crabb, Peroxisome proliferator-activated receptor alpha (PPARalpha) agonist treatment reverses PPARalpha dysfunction and abnormalities in hepatic lipid metabolism in ethanol-fed mice, J. Biol. Chem., 2003, 278, 27997–28004 CrossRef CAS PubMed.
- T. Varga, Z. Czimmerer and L. Nagy, PPARs are a unique set of fatty acid regulated transcription factors controlling both lipid metabolism and inflammation, Biochim. Biophys. Acta, 2011, 1812, 1007–1022 CrossRef CAS PubMed.
- W. Keung, J. R. Ussher, J. S. Jaswal, M. Raubenheimer, V. H. M. Lam, C. S. Wagg and G. D. Lopaschu, Inhibition of carnitine palmitoyltransferase-1 activity alleviates insulin resistance in diet-induced obese mice, Diabetes, 2013, 62, 711–720 CrossRef CAS PubMed.
- A. Grijalva, X. Xu and A. W. Ferrante, Autophagy Is Dispensable for Macrophage-Mediated Lipid Homeostasis in Adipose Tissue, Diabetes, 2016, 65, 967–980 CrossRef CAS PubMed.
- R. Singh, S. Kaushik, Y. Wang, Y. Xiang, I. Novak, M. Komatsu, K. Tanaka, A. M. Cuervo and M. J. Czaja, Autophagy regulates lipid metabolism, Nature, 2009, 458, 1131–1135 CrossRef CAS PubMed.
- Y. Li, S. Q. Xu, M. M. Mihaylova, B. Zheng, X. Y. Hou, B. B. Jiang, O. Park, Z. J. Luo, E. Lefai, J. Y. Shyy, B. Gao, M. Wierzbicki, T. J. Verbeuren, R. J. Shaw, R. A. Cohen and M. W. Zang, AMPK phosphorylates and inhibits SREBP activity to attenuate hepatic steatosis and atherosclerosis in diet-induced insulin-resistant mice, Cell Metab., 2011, 13, 376–388 CrossRef CAS PubMed.
- W. Li, Y. Li, Q. Wang and Y. Yang, Crude extracts from Lycium barbarum suppress SREBP-1c expression and prevent diet-induced fatty liver through AMPK activation, BioMed. Res. Int., 2014, 2014, 196198 Search PubMed.
- A. D. Barlow and D. C. Thomas, Autophagy in diabetes: β-cell dysfunction, insulin resistance, and complications, DNA Cell Biol., 2015, 34, 252–260 CrossRef CAS PubMed.
- A. Kuma and N. Mizushima, Physiological role of autophagy as an intracellular recycling system: with an emphasis on nutrient metabolism, Semin. Cell Dev. Biol., 2010, 21, 683–690 CrossRef CAS PubMed.
- H. Nakatogawa, K. Suzuki, Y. Kamada and Y. Ohsumi, Dynamics and diversity in autophagy mechanisms: lessons from yeast, Nat. Rev. Mol. Cell Biol., 2009, 10, 1–10 CrossRef PubMed.
- C. Ebato, T. Uchida, M. Arakawa, M. Komatsu, T. Ueno, K. Komiya, K. Azuma, T. Hirose, K. Tanaka, E. Kominami, R. Kawamori, Y. Fujitani and H. Watada, Autophagy is important in islet homeostasis and compensatory increase of beta cell mass in response to high-fat diet, Cell Metab., 2008, 8, 325–332 CrossRef CAS PubMed.
- N. Martinez-Lopez and R. Singh, Autophagy and Lipid Droplets in the Liver, Annu. Rev. Nutr., 2015, 35, 15–37 CrossRef PubMed.
- M. Komatsu, S. Waguri, T. Ueno, J. Iwata, S. Murata, I. Tanida, J. Ezaki, N. Mizushima, Y. Ohsumi, Y. Uchiyama, E. Kominami, K. Tanaka and T. Chiba, Impairment of starvation-induced and constitutive autophagy in Atg7-deficient mice, J. Cell Biol., 2005, 169, 425–434 CrossRef CAS PubMed.
- K. Tsuboyama, I. Koyama-Honda, Y. Sakamaki, M. Koike, H. Morishita and N. Mizushima, The ATG conjugation systems are important for degradation of the inner autophagosomal membrane, Science, 2016, 354, 1036–1041 CrossRef CAS PubMed.
- H. Q. Gong, X. Z. Li, S. W. Yang, L. L. Yang, Y. Y. Fan and Y. F. Zhou, Pectic Bee Pollen Polysaccharide from Rosa rugosa Alleviates Diet-Induced Hepatic Steatosis and Insulin Resistance via Induction of AMPK/mTOR-Mediated Autophagy, Molecules, 2017, 22, 699 CrossRef PubMed.
- Y. Y. Fan, N. Wang, A. Rocchi, W. R. Zhang, R. Vassar, Y. F. Zhou and C. C. He, Identification of natural products with neuronal and metabolic benefits through autophagy induction, Autophagy, 2017, 13, 41–56 CrossRef CAS PubMed.
- C. J. Gao, Y. H. Wang, C. Y. Wang and Z. Y. Wang, Antioxidant and immunological activity in vitro of polysaccharides from Gomphidius rutilus mycelium, Carbohydr. Polym., 2013, 92, 2187–2192 CrossRef CAS PubMed.
- Y. X. Sun, X. Li, J. F. Yang, J. C. Liu and J. F. Kennedy, Water-soluble polysaccharide from the fruiting bodies of Chroogomphis rutilus (Schaeff.: Fr.) O. K. Miller: Isolation, structural features and its scavenging effect on hydroxyl radical, Carbohydr. Polym., 2010, 80, 720–724 CrossRef CAS.
- Y. X. Sun, J. F. Kennedy and O. K. Miller, Antioxidant activities of different polysaccharide conjugates (CRPs) isolated from the fruiting bodies of Chroogomphis rutilus (Schaeff.: Fr.), Carbohydr. Polym., 2010, 82, 510–514 CrossRef CAS.
- C. Y. Wang, J. Zhang, F. Wang and Z. Y. Wang, Extraction of crude polysaccharides from Gomphidius rutilus and their antioxidant activities in vitro, Carbohydr. Polym., 2013, 94, 479–486 CrossRef CAS PubMed.
- S. W. Yang, J. M. Yan, L. L. Yang, Y. H. Meng, N. Wang, C. C. He, Y. Y. Fan and Y. F. Zhou, Alkali-soluble polysaccharides from mushroom fruiting bodies improve insulin resistance, Int. J. Biol. Macromol., 2019, 126, 466–474 CrossRef CAS PubMed.
- J. Yin, H. Lin, J. Li, Y. X. Wang, S. W. Cui, S. P. Nie and M. Y. Xie, Structural characterization of a highly branched polysaccharide from the seeds of Plantago asiatica L., Carbohydr. Polym., 2012, 87, 2416–2424 CrossRef CAS.
- H. M. Ni, B. Abigail, L. W. Ann, J. Kellyann, W. Steven, X. M. Yin and W. X. Ding, Dissecting the dynamic turnover of GFP-LC3 in the autolysosome, Autophagy, 2011, 7, 188–204 CrossRef CAS PubMed.
- A. Ost, K. Svensson, I. Ruishalme, C. Brannmark, N. Franck, H. Krook, P. Sandstrom, P. Kjolhede and P. Stralfors, Attenuated mTOR signaling and enhanced autophagy in adipocytes from obese patients with type 2 diabetes, Mol. Med., 2010, 16, 235–246 Search PubMed.
- C. W. Lin, H. Zhang, M. Li, X. Xiong, X. Chen, X. C. Dong and X. M. Yin, Pharmacological promotion of autophagy alleviates steatosis and injury in alcoholic and non-alcoholic fatty liver conditions in mice, J. Hepatol., 2013, 58, 993–999 CrossRef CAS PubMed.
- G. Dimitriadis, P. Mitrou, V. Lambadiari, E. Maratou and S. A. Raptis, Insulin effects in muscle and adipose tissue, Diabetes Res. Clin. Pract., 2011, 93, 52–59 CrossRef.
- L. E. Gallagher, L. E. Williamson and E. Y. Chan, Advances in autophagy regulatory mechanisms, Cells, 2016, 5, 24 CrossRef PubMed.
- H. Y. Lee, J. S. Lee, T. Alves, W. Ladiges, P. S. Rabinovitch, M. J. Jurczak, C. S. Choi, G. I. Shulman and V. T. Samuel, Mitochondrial-Targeted catalase protects against high-fat diet-induced muscle insulin resistance by decreasing intramuscular lipid accumulation, Diabetes, 2017, 66, 2072–2081 CrossRef CAS PubMed.
- P. Codogno and A. J. Meijer, Autophagy: a potential link between obesity and insulin resistance, Cell Metab., 2010, 11, 449–451 CrossRef CAS PubMed.
- J. Kim, M. Kundu, B. Viollet and K. L. Guan, AMPK and mTOR regulate autophagy through direct phosphorylation of Ulk1, Nat. Cell Biol., 2011, 13, 132–141 CrossRef CAS PubMed.
- S. Sarkar, Regulation of autophagy by mTOR-dependent and mTOR-independent pathways: autophagy dysfunction in neurodegenerative diseases and therapeutic application of autophagy enhancers, Biochem. Soc. Trans., 2013, 41, 1103–1130 CrossRef CAS PubMed.
- A. Williams, S. Sarkar, P. Cuddon, E. K. Ttofi, S. Saiki, F. H. Siddiqi, L. Jahreiss, A. Fleming, D. Pask, P. Goldsmith, C. J. O'Kane, R. A. Floto and D. C. Rubinsztein, Novel targets for Huntington's disease in an mTOR-independent autophagy pathway, Nat. Chem. Biol., 2008, 4, 295–305 CrossRef CAS PubMed.
- S. Sarkar, V. I. Korolchuk, M. Renna, S. Imarisio, A. Fleming, A. Williams, M. Garcia-Arencibia, C. Rose, S. Luo, B. R. Underwood, G. Kroemer, C. J. O'Kane and D. C. Rubinsztein, Complex inhibitory effects of nitric oxide on autophagy, Mol. Cell, 2011, 43, 19–32 CrossRef CAS PubMed.
- Q. Wang and J. Ren, mTOR-independent autophagy inducer trehalose rescues against insulin resistance-induced myocardial contractile anomalies: Role of p38 MAPK and Foxo1, Pharmacol. Res., 2016, 111, 357–373 CrossRef CAS PubMed.
- Y. Yang, W. Li, Y. Liu, Y. Sun, Y. Li, Q. Yao, J. N. Li, Q. Zhang, Y. J. Gao, L. Gao and J. J. Zhao, Alpha-lipoic acid improves high-fat diet-induced hepatic steatosis by modulating the transcription factors SREBP-1, FoxO1 and Nrf2 via the SIRT1/LKB1/AMPK pathway, J. Nutr. Biochem., 2014, 25, 1207–1217 CrossRef CAS PubMed.
- H. Keller, C. Dreyer, J. Medin, A. Mahfoudi, K. Ozato and W. Wahli, Fatty acids and retinoids control lipid metabolism through activation of peroxisome proliferator-activated receptor-retinoid X receptor heterodimers, Proc. Natl. Acad. Sci. U. S. A., 1993, 90, 2160–2164 CrossRef CAS PubMed.
- C. R. Bruce, A. J. Hoy, N. Turner, M. J. Watt, T. L. Allen, K. Carpenter, G. J. Cooney, M. A. Febbraio and E. W. Kraegen, Overexpression of carnitine palmitoyltransferase-1 in skeletal muscle is sufficient to enhance fatty acid oxidation and improve high-fat diet-induced insulin resistance, Diabetes, 2009, 58, 550–558 CrossRef CAS PubMed.
| This journal is © The Royal Society of Chemistry 2020 |