DOI:
10.1039/C9FO01963D
(Paper)
Food Funct., 2020,
11, 305-317
Physicochemical characterisation and release behaviour of curcumin-loaded lactoferrin nanohydrogels into food simulants
Received
26th August 2019
, Accepted 16th November 2019
First published on 18th November 2019
Abstract
Whey protein nanostructures can be used as vehicles for the incorporation of nutraceuticals (e.g., antioxidants or vitamins) aimed at the development of functional foods, because nanostructures provide greater protection, stability and controlled release to such nutraceuticals. Fundamental knowledge is required regarding the behaviour of nanostructures when associated with nutraceuticals and their interactions with real food matrices. In this study, a lactoferrin (LF) nanohydrogel was developed to encapsulate curcumin (nutraceutical model) and its behaviour was evaluated in terms of the LF structure and the interaction with curcumin. The release kinetics of curcumin from LF nanohydrogels was also assessed using food simulants with a hydrophilic nature (10% ethanol) and lipophilic nature (50% ethanol). This system was able to encapsulate curcumin at 80 μg mL−1 with an efficiency of ca. 90% and loading capacity of ca. 3%. Through spectroscopic characterisation, it is suggested that LF and curcumin bind via hydrophobic interactions and the average binding distance between LF and curcumin was found to be 1.91 nm. Under refrigerated conditions (4 °C), this system showed stability for up to 35 days, while at room temperature (25 °C) it was shown to be stable for up to 14 days of storage. The LF nanohydrogel presented higher release rates of curcumin in a lipophilic food simulant (stable after ca. 7 h) as compared to a hydrophilic simulant (stable after ca. 4 h). LF nanohydrogels were successfully incorporated into a gelatine matrix and showed no degradation in this process. The behaviour of this system and the curcumin release kinetics in food stimulants make the LF nanohydrogel an interesting system to associate with lipophilic nutraceuticals and to incorporate in refrigerated food products of a hydrophilic nature.
1. Introduction
The incidence of several health problems such as diabetes, cardiovascular and gastrointestinal diseases, which directly affect human wellbeing, is still growing. This evidence has motivated researchers and technology professionals from different fields of knowledge, including food, nutrition and health, to address these public concerns, while facing the consumer's demands for high quality, safer, nutritious and healthier food products, thus contributing to better global aging and quality of life. One of the possible ways to overcome these issues is by promoting the consumption of bioactive compounds as nutraceuticals, e.g., vitamins, antioxidants, antimicrobials, and prebiotics or probiotics.1 Nutraceuticals are products derived from food sources with a high nutritional value that have the potential to provide health benefits, depending on their dosage and bioavailability. However, the nature of the vast majority of these compounds (e.g., poor solubility in an aqueous medium and low stability) may limit their bioavailability and therefore their application in the food industry.2,3 These limitations have led researchers to design and apply novel and more efficient delivery systems to address these challenges. One of the major concerns in terms of the use of nanostructures for food applications is the replacement of non-food-grade materials by bio-based, biodegradable and generally recognised as safe (GRAS) materials.4,5 Regarding the characteristics of nutraceuticals, one of the most recent and interesting vehicles used for their protection and controlled release in food matrices is whey protein-based nanostructured systems.2,6 However, due to the lack of information regarding the incorporation of nanostructures in foods, elucidation of how those protein nanostructures behave when in contact with food matrices is needed before considering their application in the functional foods field.
Bovine lactoferrin (LF), a globular single-chain glycoprotein from whey, has high nutritional and functional value, as well as the ability to form gels.7,8 Such properties make this protein a high-quality ingredient with application in the pharmaceutical, cosmetic, food, and beverage industries.
This study is focused on the development and characterisation of an innovative LF nanohydrogel to encapsulate curcumin, a lipophilic polyphenolic compound used as a model nutraceutical. The release kinetics of curcumin from LF nanohydrogels when incorporated into food simulants with different hydrophilic natures, i.e., hydrophilic (ethanol 10% v/v) and lipophilic (ethanol 50% v/v) media, were evaluated, as well as the behaviour of the LF nanohydrogels and curcumin in a real food matrix (i.e., gelatine).
2. Materials and methods
2.1. Materials
Purified bovine lactoferrin (LF) powder, composed of 96% protein, 0.5% ash, 3.5% moisture and 0.012% iron (data supplied by the manufacturer), was purchased from DMV International (USA). Hydrochloric acid (HCl) (37–38.0% purity), 8-anilinonaphthalene-1-sulfonic acid (ANS) and curcumin powder with purity >65% (HPLC grade) were purchased from Sigma-Aldrich Chemical Co. Ltd (Darmstadt, Germany). Pure ethanol (99.5% purity) and sodium hydroxide (pellets) were obtained from Merck (Merck KGaA, Darmstadt, Germany). Unflavoured gelatine (powder) from Royal (USA) was purchased in a local hypermarket (Braga, Portugal). Gelatine has the following nutritional information (per 100 g of the product): energy, 1505 kJ (355 kcal); lipids, <0.1 g, of which <0.1 g is saturated; carbohydrates, 0.5 g, of which 0.5 g is sugars; proteins, 88.0 g; salt, 0.73 g.
2.2. Preparation of nanohydrogels
The nanohydrogel preparation was based on the methodology used by other authors, with some modifications.9,10 Briefly, a weighed amount of LF was dissolved in distilled water at 25 °C and stirred (300 rpm) for 1 h reaching a 0.2% (w/v) concentration. The pH value of the LF solution was adjusted to 7.0, with 0.1 mol L−1 of sodium hydroxide (NaOH). LF aqueous solutions were subjected to thermal treatment in which they were heated at 75 °C for 10 min in a water bath (closed system) to promote the formation of a monodisperse nanohydrogel solution. All the samples were made in triplicate and kept at room temperature (25 °C) for at least 30 min until further characterisation.
To determine the LF nanohydrogels’ encapsulation efficiency (EE) and loading capacity (LC) for curcumin, an experimental methodology was adopted and designed as described below. A range of ethanolic solutions was prepared with concentrations between 66 and 1066 μg mL−1 from a curcumin stock solution (3000 μg mL−1), previously dissolved in pure ethanol and stirred for 20 min (to ensure complete dissolution of curcumin powder). To obtain LF-curcumin solutions, approximately 750 μL from each curcumin solution was added to the corresponding LF solution to give increasing curcumin concentrations between 10 and 120 μg mL−1. The final volume was fixed at 10 mL per solution and after 20 min of gentle stirring, the LF-curcumin mixtures were finally heated at 75 °C in a water bath (closed system) for 10 min. The unbound curcumin was removed from the nanohydrogel solutions by centrifuging at 12![[thin space (1/6-em)]](https://www.rsc.org/images/entities/char_2009.gif) 000g for 20 min. The pellet composed of undissolved curcumin was thoroughly dissolved in pure ethanol and further analysed spectroscopically at 425 nm, following the previously described procedure.11
000g for 20 min. The pellet composed of undissolved curcumin was thoroughly dissolved in pure ethanol and further analysed spectroscopically at 425 nm, following the previously described procedure.11
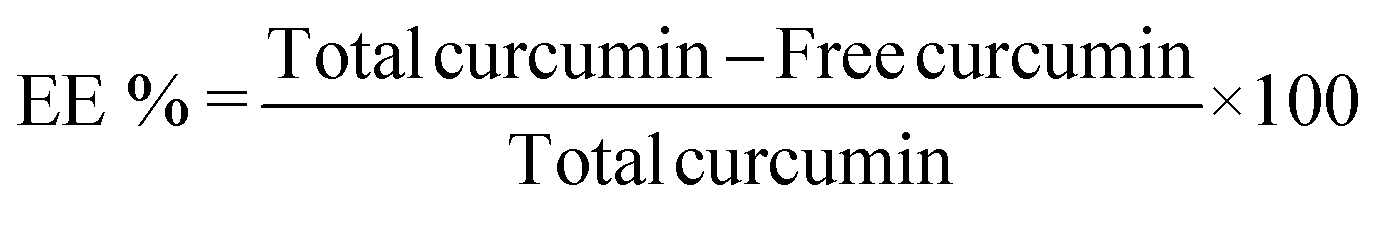
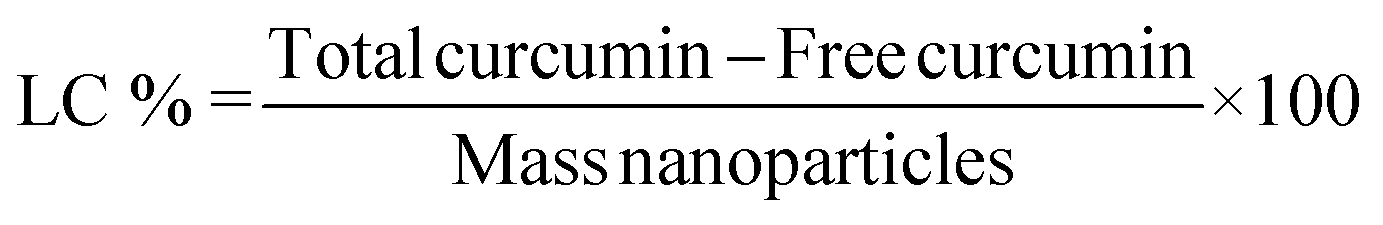
The EE was determined by estimating the amount of free curcumin, using a calibration curve made under the same conditions as the solutions from the re-dissolved pellet. The resulting equation y = 0.1285x, R2 = 0.9955, with y being the absorbance and x the unknown concentration of free curcumin, allowed the determination of the concentration values required for application in a standard EE equation. EE and LC were calculated as follows:
‘Total curcumin’ represents the total amount of curcumin initially added to the LF nanohydrogel, ‘free curcumin’ is the amount of undissolved curcumin that did not associate with the nanohydrogel, and ‘mass nanoparticles’ represent the total mass (μg) of nanoparticles after the drying process.
2.3. Nanohydrogel dehydration after freeze-drying
LF and LF-curcumin samples were dehydrated after being subjected to a freeze-drying process, in order to facilitate their incorporation into a gelatine food matrix. Furthermore, these samples were also used to compare both hydrated and dehydrated nanohydrogels in terms of size, PdI and protein secondary structure. The solutions were prepared as described in section 2.2, followed by a quick freeze at −80 °C in a sample container and then freeze-drying (CHRIST – Alpha 1-4 LD plus, Germany). After this process, dried samples were stored at 20 °C in a desiccator until further utilisation.
2.4. Dynamic light scattering
The size, polydispersity index (PdI) and surface charge (ζ-potential) of LF nanohydrogels were evaluated by dynamic light scattering (DLS, Zetasizer Nano ZS, Malvern Instruments, United Kingdom) equipped with a He–Ne laser at a wavelength of 633 nm, as described previously.12,13 This methodology was applied to monitor changes in the size, PdI and ζ-potential of the LF nanohydrogel before and after its association with curcumin, as well as to validate the LF-curcumin nanohydrogel stability after the freeze-drying process and after the release kinetics experiments. This technique was also used to monitor the system stability in storage conditions (refrigerated at 4 °C and 25 °C) and after the release kinetics experiments. All measurements were performed at 25 °C in triplicate. The results are shown as the average ± standard deviation of the experimental values.
2.5. Fluorescence measurements
To evaluate the structural changes of LF after curcumin association, fluorescence measurements were performed in a spectrofluorometer (Horiba Scientific, USA) equipped with a standard cell holder. LF and LF-curcumin samples were placed in a quartz cuvette with a path length of 1.0 cm, and spectra were recorded with a resolution of 1.17 nm, 1 accumulation and an integration time of 0.1 s. The fluorescence bands were obtained in the spectral range between 300 nm and 400 nm, with an excitation wavelength of 280 nm, where both tryptophan and tyrosine were excited near their maximum intensity.14 All samples were made in triplicate, where the spectra are presented as the average of the experimental values. To evaluate the occurrence of potential hydrophobic interactions between LF and curcumin, ANS fluorescence measurements were performed. ANS, a fluorescent probe that emits fluorescence when it is bound to protein hydrophobic residues, was added to the sample solution and excited at 370 nm.15 LF-curcumin solutions with increasing curcumin concentrations (between 10 μg mL−1 and 80 μg mL−1) were prepared separately and the fluorescence bands were obtained in the spectral range between 400 nm and 600 nm. The fluorescence emissions of the respective controls were obtained (LF-curcumin samples without ANS, LF excited at 280 nm and curcumin at 425 nm) and this experiment also served to evaluate the fluorescence inhibition phenomena as a function of increasing curcumin concentrations on LF-curcumin nanohydrogels. The acquired spectra did not present sufficient emission intensity for the performance of adequate analysis and discussion of the results. This lack of intensity can be explained by excitation light attenuation and auto-absorption phenomena, which are usual occurrences within highly concentrated samples. Therefore, a triangular quartz cuvette, which enables the collection of emission on the first millimetres of the sample, was used and thus, it avoided the previous related phenomena. Samples were prepared in triplicate and spectra are presented as the average of the experimental values.
2.6. Circular dichroism
To evaluate the effect of increasing holding times during nanohydrogel development and the effect of curcumin association on the LF secondary structure, circular dichroism (CD) measurements were carried out in a high-performance CD spectrometer J-1500 m (Jasco, Italy). The LF secondary structure was analysed in the far-UV (190 to 250 nm) region of the CD spectra. Firstly, native LF, LF nanohydrogel and LF-curcumin nanohydrogel (curcumin at 80 μg mL−1) solutions were freshly prepared as described in section 2.2 and diluted ten times in distilled water for proper signal acquisition. Then, 350 μL of each sample was carefully pipetted into CD cells with a path length of 0.1 cm. The effect of the freeze-drying process on the LF secondary structure was also assessed. CD spectra were recorded with a scanning speed of 50 nm min−1, 1.0 nm resolution, 3 accumulations and a bandwidth of 1.0 nm. The blank from the analysed solutions and curcumin backgrounds were subtracted from the raw spectra, and the results are shown as the average of experimental values as samples were measured in triplicate.
2.7. Fluorescence resonance energy transfer
Förster resonance energy transfer (FRET) assay was carried out using a spectrofluorometer (Horiba Scientific, USA) and a UV-Vis spectrophotometer (Jasco V-560, Japan) for the fluorescence and absorption measurements, respectively. In both measurements, solutions were diluted until the acquisition of a reasonable signal to avoid being outside of the equipment's recommended range, where the initial LF-curcumin solutions were prepared in the same ratio as described in section 2.2, at the maximum AE%. For the fluorescence spectra records, the excitation wavelengths were set at 280 nm and 425 nm for tryptophan (from LF) and curcumin, respectively. A triangular cuvette was used in this experiment for the fluorescence emission records for the same reasons as described in section 2.5.
2.8. Transmission electron microscopy
To obtain valuable images of LF nanohydrogels before and after association with curcumin, transmission electron microscopy (TEM) was used. LF and LF-curcumin nanohydrogels were prepared as described in section 2.2. TEM imaging was conducted on a Zeiss EM 902A (Thornwood, N.Y., USA) microscope at an accelerating voltage of 50 and 80 kV. A drop of sample dispersion was deposited onto a carbon support film mounted on a TEM copper grid (Quantifoil, Germany). The excess solution was removed after 2 min using a filter paper, and the grid was left to air-dry. The samples were then negatively stained with uranyl acetate (2%, w/w) (Merck, Germany) for 15 s. The grid was finally air-dried at room temperature (ca. 25 °C) before introducing it in the electron microscope. These conditions were used based on procedures usually adopted by our research group.16–18
2.9. Evaluation of the stability of nanohydrogels under environmental conditions
LF-curcumin nanohydrogel stability was evaluated at 4 °C and 25 °C during 35 days of storage. Briefly, LF (control) and LF-curcumin solutions (curcumin at 80 μg mL−1) were prepared on day 0 as described in section 2.2 and for each of the analysis periods. Then, for storage at 25 °C, samples were kept at room temperature (25 °C) and protected from light. Further, for storage at 4 °C, the samples were stored in a regular fridge (set at 4 °C) and protected from light until further analysis. The stability of nanohydrogels under storage was evaluated by measuring the size and PdI from day 0 to day 35. These parameters were assessed using DLS, as previously described. All measurements were performed in triplicate and the results are presented as the average ± standard deviation of the experimental values.
2.10. Evaluation of curcumin release in food stimulants
2.10.1. Release profiles.
A release kinetics assay was performed with two different food simulants (i.e., hydrophilic and lipophilic media), at room temperature (25 °C), to access their release behaviour under harsh storage conditions and opposite food character. The first test was conducted with 10% ethanol medium (hydrophilic food simulant) and the second one was carried out with 50% ethanol medium (lipophilic food simulant) according to the food simulants list in Table 1 of Annex III of Commission Regulation EU No 10/2011.19 LF-curcumin solutions were prepared in triplicate and, after separating the undissolved curcumin as described in section 2.2, 4 mL of each solution was placed into dialysis membranes with 10 kDa cut-off, which in turn were submerged in three glass reactors equipped with a water jacket, containing 50 mL of the selected media (according to the Annex III of Commission Regulation EU No 10/2011).19 Distilled water at 25 °C was pumped, with a heating pump-head, through all the water-jacketed reactors in order to maintain the temperature of the food simulant media. These experiments were also performed under magnetic agitation at 250 rpm. For both assays, samples were taken from the reactor media from 0 min until a stable released concentration value was achieved, and were spectrophotometrically analysed at 425 nm using a UV-Vis spectrophotometer (Synergy HT, Bio-Tek, Winooski, USA). At each sampling time, the same volume of the respective medium was placed in the release reactors as a method to avoid variation in the concentration of the released curcumin. All the measurements were performed in triplicate and the results are given as the average ± standard deviation of the experimental values.
Table 1 Effect of curcumin concentration on the size and polydispersity (PdI) of the LF nanohydrogel
| Curcumin (μg mL−1) |
10 |
20 |
40 |
60 |
80 |
| Data are presented as mean ± 95% confidence interval. a,b,c,d Means within the same line, labelled with different letters, are statistically different from each other (p < 0.05). |
| Size (nm) |
118.9 ± 0.9a |
115.2 ± 2.8a |
102.2 ± 2.8b |
109.1 ± 2.3c |
89.4 ± 2.2d |
| PdI |
0.15 ± 0.02a |
0.16 ± 0.02b |
0.17 ± 0.02c |
0.17 ± 0.01c |
0.2 ± 0.019c |
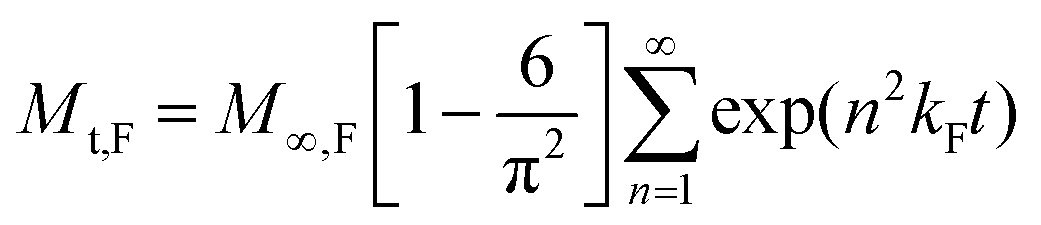
2.10.2. Mathematical modelling.
The curcumin release profile was evaluated using the linear superimposition model (LSM), a kinetic model that enables mathematical simulation accounting for both Fickian and Case II transport effects in hydrophilic matrices:17,20,21
Mt represents the total mass of compound released from the protein nanostructure, Mt,F and Mt,R represent the contributions of the Fickian and relaxation processes (Case II transport), respectively, at time t.
The Fickian diffusion process can be described as the ‘uniform sphere model’ through the following equation:22
where,
M∞,F is the equilibrium sorption amount released by Fickian diffusion in the unrelaxed polymer matrix and
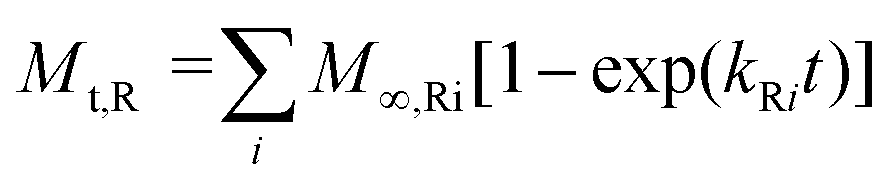
kF represents the Fickian diffusion rate constant. This model assumes that the Fickian contribution is driven by a gradient related to the invariant equilibrium concentration. The relaxation terms in the following equation (below) are independent of particle size and are related to the dissipation of swelling stress induced by entry of the penetrant.
22
M
∞,Ri represents the contributions of the relaxation processes for compound release and kRi is the relaxation rate constant at the ith polymer relaxation. Usually, there is only one main polymer relaxation that influences transport and thus the above equation can be simplified using i = 1.
Finally, the linear superimposition model can be simplified and described by the following equation:
where
X is related to the fraction of the compound released by Fickian transport. This equation was used as a function for the application of the linear superimposition model to the experimental results. This simulates the transport mechanisms involved in curcumin release through LF nanohydrogels.
11
2.11. Incorporation of nanohydrogels into a model food matrix
2.11.1. Preparation of gelatine incorporating the nanohydrogels.
Gelatine solutions were prepared as described in the packaging instructions, with some modifications. Briefly, 0.052 g of nanohydrogels (prepared as described in section 2.2, followed by freeze-drying) were added to 1 g of gelatine, followed by gentle mixing of both powders. Then, 10 mL of distilled water at 20 °C was added to the powder mixture and, after a gentle stirring, 40 mL of distilled water at 45 °C were finally added to the gelatine solution. In order to obtain a homogeneously dispersed gelatine, the solutions were placed in a water bath (open-system) at 45 °C, under magnetic stirring at 250 rpm, for 8 min. Gelatine control solutions were prepared in the same way as described above but without the addition of the nanohydrogels. The final solutions were dropped into regular flasks, protected from light and stored at 4 °C until the gelation process was complete.
2.11.2. Gelatine characterisation.
In order to obtain a qualitative analysis of nanohydrogels incorporated in the gelatine matrix, their fluorescence emissions were assessed in a spectrofluorometer (Horiba Scientific, USA) equipped with a standard cell holder. All sample preparation procedures used in the previous section were replicated for these fluorescence measurements. Then, samples (diluted 3×) were placed in a quartz cuvette with a path length of 1.0 cm and fluorescence emission spectra were obtained in the wavelength range between 330 and 650 nm, with a resolution of 1.17 nm, 1 accumulation and an integration time of 0.1 s. The excitation wavelengths were set at 280 nm and 425 nm for LF and curcumin, respectively. The resulting spectra were presented with the subtractions of background and control spectra in order to discount their contributions in the final emission fluorescence spectrum.
2.12. Statistical analysis
During this study, statistical analyses were performed for each set of experimental results. Statistical analyses of the data were carried out using Analysis of Variance (ANOVA) and Tukey's mean comparison test (p < 0.05), using Origin® Pro 8 software (Massachusetts, USA). The equation taken from the linear superimposition model was fitted to the data by non-linear regression using STATISTICA 10.0 software (Statsoft. Inc., USA). The Levenberg–Marquardt algorithm was applied using the least-squares function minimization. The quality of the regressions was evaluated based on the determination of the correlation coefficient, R2, the root mean square error (RMSE) and residuals visual inspection for randomness and normality. The precision of the estimated parameters was evaluated by the standardised halved width (SHW %), which was defined as the ratio between the 95% standard error (obtained from the software) and the estimated value.17
3. Results and discussion
3.1. Lactoferrin-curcumin encapsulation efficiency
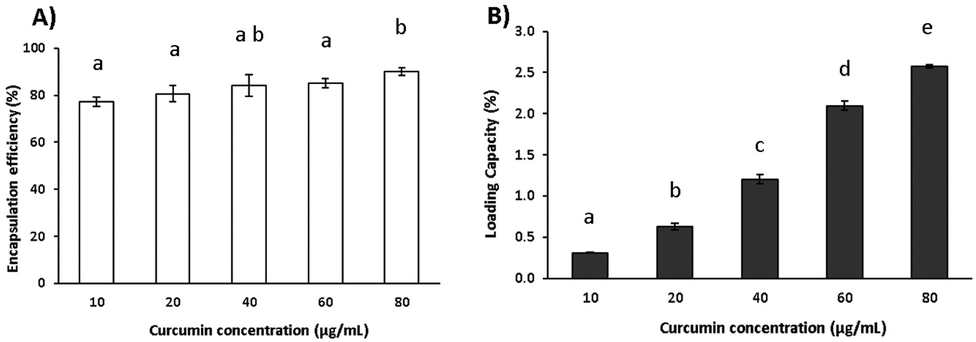
Lactoferrin (LF) nanohydrogels were able to encapsulate curcumin with an EE of 89.99 ± 1.09% and LC of 2.57 ± 0.02%, for curcumin at 80 μg mL−1 (as shown in Fig. 1). Above this concentration, the system can also encapsulate curcumin, but it was unstable since a curcumin precipitate was formed after 3 days of storage under refrigerated conditions (i.e., 4 °C). This may be explained by the fact that the loading capacity of LF nanohydrogels was exceeded for curcumin concentrations above 80 μg mL−1. Regarding the LC, it is possible to observe an increase in LC with curcumin concentration (Fig. 1B). This clearly shows that LF nanohydrogels are able to load curcumin with a maximum concentration of 80 μg mL−1. These results agree with those obtained for EE and thus, 80 μg mL−1 was selected as the optimal curcumin concentration for the following characterization and application methodologies. Encapsulation of curcumin into nanostructures revealed an increase of solubility in aqueous medium ≈180 times higher as compared with its solubility in free form (ca. 0.4 μg mL−1).23 It is also notable that curcumin presented higher solubility within the LF nanohydrogels as compared to other related aqueous systems described by other authors.23,24 Teng et al. (2012) reported the development of curcumin-loaded soy protein isolate nanoparticles with curcumin solubility around 30 μg mL−1.24 Additionally, a study carried out by Aditya et al. (2015), related to β-lactoglobulin-curcumin nanosuspensions, reported a maximum curcumin solubility of ca. 31 μg mL−1.23
 |
| | Fig. 1 Effect of curcumin concentration on the encapsulation efficiency (A) and loading capacity (B) of LF nanohydrogels. Data are presented as mean ± 95% confidence interval. Different letters indicate statistically significant differences between values (p < 0.05). | |
3.2. Hydrodynamic diameter, polydispersity index and ζ-potential
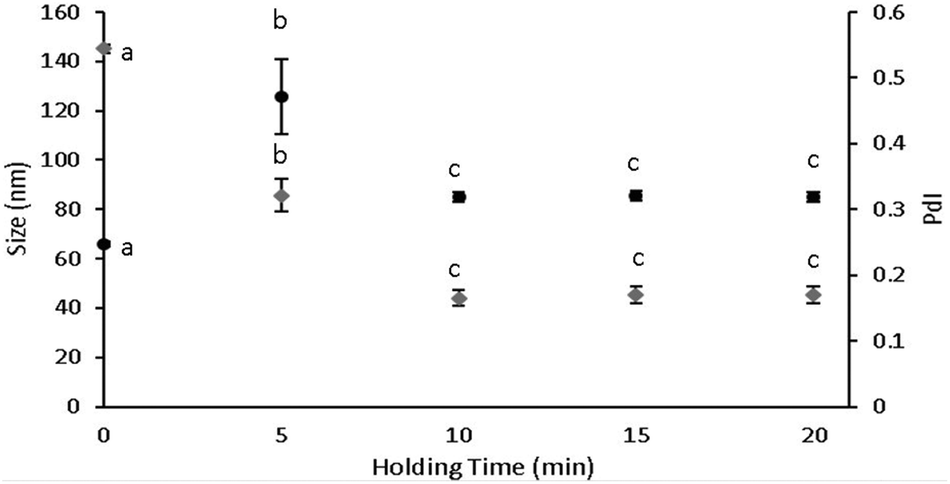
During DLS measurements, it was found that 75 °C and 10 min were the optimal temperature and heating time, respectively, for nanohydrogel formation (Fig. 2), with the desired size and PdI values of around 100 nm and 0.2, respectively. At this temperature and holding time, the nanohydrogels exhibited size, PdI and ζ-potential values of 84.9 ± 1.97 nm, 0.165 ± 0.012 and 23.4 ± 2.05 mV, respectively, thus corroborating the data found in previous research.10 In previous studies, 20 min was reported as the ideal heating time,9,10 thus meaning that a procedure optimization was performed in the present study, as shown in Fig. 2. With the achievement of such results, less time and energy are necessary for nanohydrogel preparation. The nanohydrogel ζ-potential values were between 21 and 25 mV at 10 min of heating time. These results are in agreement with other authors.10 Regarding DLS analysis of curcumin incorporation, the results (presented in Table 1) showed a decrease in size and an increase in PdI values as a function of increasing curcumin concentration. These results may suggest that there is a shrinking effect on the shape of the nanoparticles until they reach the same size of nanohydrogels without curcumin. Conversely, PdI values increased as a function of curcumin concentration, which may be related to the potential formation of LF-curcumin aggregates. This occurrence may be explained by the fact that curcumin molecules tend to aggregate in aqueous solutions, thus promoting the formation of clusters.25 Concerning ζ-potential values, no statistically significant differences were observed after curcumin association (results not shown). Freeze-dried nanohydrogels were also evaluated in terms of size and PdI, after dissolving both LF (control) and LF-curcumin powders in the aqueous media, as described in section 2.2. The resulting values for LF-curcumin solutions were 175.80 ± 56.09 nm and 0.245 ± 0.039 for size and PdI, respectively. Therefore, comparing the solutions before and after dehydration, the system increased in size and maintained homogeneity, indicating the occurrence of aggregation and/or the formation of curcumin clusters in this process, as suggested above. Regarding LF solution (control), size and PdI values were approximately 147.13 ± 4.74 nm and 0.422 ± 0.007, respectively. These results show that the freeze-drying process may have promoted protein aggregation. Moreover, PdI values from LF control solutions denote a substantial increase in solution heterogeneity, which may indicate the denaturation of LF proteins, since they are no longer able to form a homogeneously dispersed nanohydrogel. On the contrary, LF-curcumin solutions have responded differently to the freeze-drying process, showing acceptable size (in the nanometre scale) and PdI values (between 0.1 and 0.3).
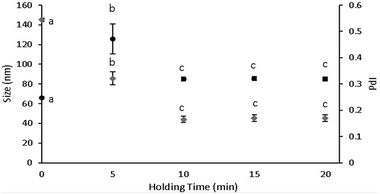 |
| | Fig. 2 Effect of heating time on size (●) and PdI ( ) of the LF nanohydrogel, where data are presented as mean ± 95% confidence interval. Different letters indicate statistically significant differences between values (p < 0.05). ) of the LF nanohydrogel, where data are presented as mean ± 95% confidence interval. Different letters indicate statistically significant differences between values (p < 0.05). | |
3.3. Evaluation of curcumin-ANS competition for LF hydrophobic sites
To evaluate the potential hydrophobic interactions between LF and curcumin, ANS probe fluorescence measurements were carried out for a range of curcumin concentrations between 10 μg mL−1 and 80 μg mL−1. Since curcumin has lipophilic character, it is expected that this compound may associate with LF hydrophobic residues rather than any other sites.26 As can be observed in Fig. 3, at lower curcumin concentration (i.e., 10 μg mL−1) ANS still fluoresced, while for higher concentrations (i.e., 20, 40 and 80 μg mL−1), the fluorescence intensity signal of ANS presented an abrupt loss, thus suggesting that curcumin occupied the majority of LF hydrophobic sites. These results revealed a curcumin-ANS competition for LF hydrophobic sites. It is notable that as the concentration of curcumin increased, the fluorescence intensity maxima of ANS red shifted; at the minimum concentration of curcumin, the ANS peak was already red shifted as compared to a control (presented in Fig. 3). Therefore, since ANS was added to the nanohydrogel solutions after curcumin association, these shift events may have occurred through two possible ways: the contribution of curcumin fluorescence to the maximum intensity, since curcumin is also excited at 370 nm (besides the subtraction of curcumin fluorescence emission data) and/or ANS molecules may bind through electrostatic interactions.26 These kinds of interactions are weaker than the hydrophobic ones, resulting in an energetically less favourable binding process. Protein and phenol interaction mechanisms have been recognized as hydrogen bonding, hydrophobic interactions, and pi–pi stacking.1,27 These findings corroborate our results regarding hydrophobic interactions between LF and curcumin.
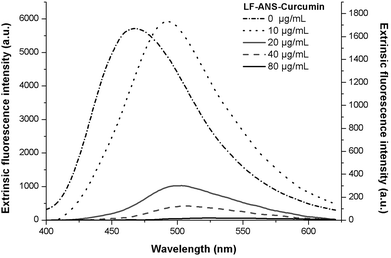 |
| | Fig. 3 Extrinsic fluorescence spectra of LF nanohydrogels on ANS emission, where Y corresponds to the control (without curcumin) and YY corresponds to the effect of increasing curcumin concentrations. | |
3.4. Evaluation of LF secondary structure
In the secondary structure of proteins, the α-helix configuration is usually characterized by a positive band at 190 nm, and two negative peaks at 208 and 220 nm.28 In the case of a β-sheet configuration, it presents a negative dichroic peak at 215 nm, which can be visualized in Fig. 4 for both native and nanohydrogel LF forms. The native LF form presented an ellipticity minimum near 210 nm (as shown in Fig. 4). These results suggest that native LF and LF nanohydrogels may adopt both α-helix and β-sheet configurations, as reported by other authors.29 The loss of CD signal magnitude (at 190 nm and between 210 and 235 nm) occurred from 0 min (LF in native form) to 10 min of heating time (LF nanohydrogel) and thus, it may indicate that both configurations became more covered as a result of protein aggregation during thermal treatment. These findings corroborate previous ones regarding nanohydrogel size and PdI values. Concerning curcumin incorporation, the CD spectra showed differences between LF nanohydrogels and LF-curcumin nanohydrogels for the positive band recorded at 190 nm, which can be related to a slight modification occurred in the α-helix configuration. Nevertheless, both configurations were still evidenced in the LF-curcumin CD spectrum, as well as in both controls. These results may indicate that curcumin association did not affect the LF secondary structure at a significant level, thus suggesting that curcumin did not interact with LF through its secondary structure binding sites. Regarding freeze-dried LF-curcumin and LF spectra, an increase in the signal magnitude near 190 nm was observed, evidencing the α-helix configuration. Furthermore, at 208 nm there was an evident increase in the signal magnitude of freeze-dried LF, suggesting that the α-helix configuration of the LF secondary structure may be more uncovered after lyophilization.
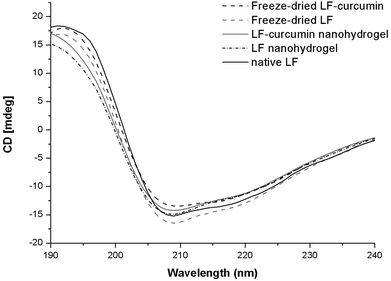 |
| | Fig. 4 CD spectra showing the effects of curcumin association with LF nanohydrogels and the freeze-drying process on LF, and LF-curcumin nanohydrogels on the LF secondary structure. | |
3.5. Evaluation of LF and curcumin fluorescence inhibition
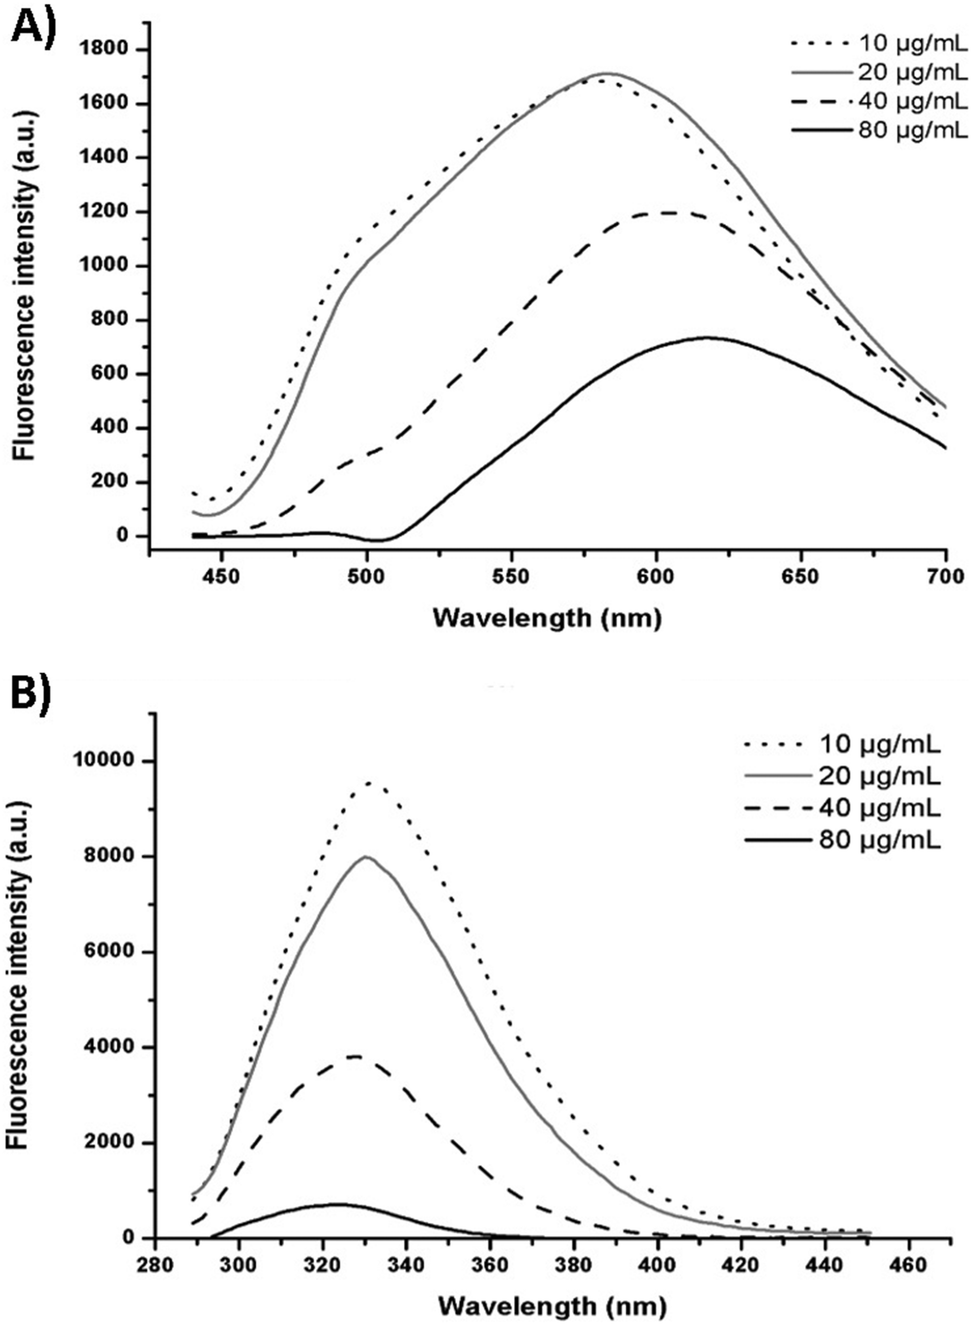
Quenching refers to the decrease in fluorescence intensity of a compound and it can occur by a variety of processes such as collisional quenching, ground-state complex formation, excited-state reactions, molecular rearrangements and energy transfer.15 Within the LF-curcumin interaction, a gradual decrease in the fluorescence intensity of LF was observed with increasing concentrations of curcumin (Fig. 5A). This may indicate that a quenching event occurred in this system, in which curcumin acted as the quencher as it was added to the LF nanohydrogel, thus resulting in a gradual decrease in LF fluorescence emission intensity. Additionally, a blue-shift in LF fluorescence spectra was observed as the curcumin concentration increased, indicating that tryptophan and tyrosine residues started to either experience a less polar environment or become more separated as a consequence of conformational changes. This last possibility results in a decrease in the energy transfer from tyrosine to tryptophan, which fluoresces at higher wavelengths (ca. 350 nm) than tyrosine (ca. 310 nm). This suggests that LF hydrophobic residues become buried due to curcumin association through hydrophobic interactions, which corroborates previous analyses. Nevertheless, the fluorescence emission of curcumin also suffered an inhibition (as presented in Fig. 5B), which can be explained by the following hypotheses: (i) since curcumin is associated with nanohydrogels, LF can act as a quencher in the case of binding to the aromatic rings of this compound, which are mainly responsible for its fluorescence emission;30 (ii) curcumin molecules are aggregating and consequently, clusters are formed, which is somehow an expected behaviour for curcumin in aqueous solutions;25 (iii) attenuation of the incident light by the fluorophore itself or other absorbing species. In addition, curcumin shifted to longer wavelengths (Fig. 5B) as a function of increasing concentrations and such features may be explained by the establishment of hydrogen bonds between curcumin and LF and due to the potential formation of curcumin aggregates.15,25
 |
| | Fig. 5 The effects of curcumin concentration (from 10 μg mL−1 to 80 μg mL−1) on the fluorescence emission spectra of LF-curcumin nanohydrogels when (A) excited at 280 nm (tryptophan and tyrosine excitation wavelength), and (B) excited at 425 nm (curcumin excitation wavelength). | |
3.6. Binding distance between LF and curcumin
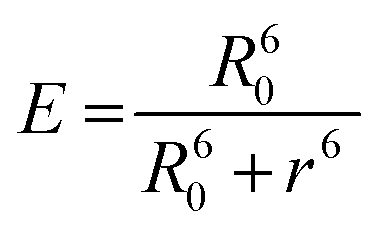
FRET analysis is a powerful approach to estimating the physical parameters related to biomolecules. The spectral overlap obtained between LF fluorescence and curcumin absorbance (as shown in Fig. 6) shows that LF tryptophan and tyrosine residues (donor fluorophores in the excited state) may transfer non-radiative energy to curcumin chromophores (acceptor ligands in the ground state). This information is a good starting point to confirm the occurrence of the FRET phenomenon, which can provide accurate structural information that is important for determining protein–ligand binding distances.31 FRET efficiency allows the determination of the binding distance r between the donor and acceptor. Therefore, calculations were made by resorting to the following equations:
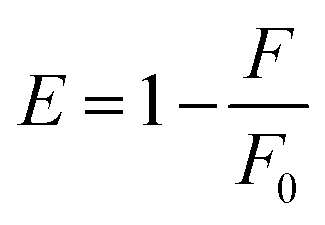
where E is the efficiency of energy transfer between the donor and the acceptor, R0 is the Förster distance (in Å), which represents the distance at which resonance energy transfer is 50% efficient, and r is the distance between the donor (LF) and the acceptor (curcumin).15,32F and F0 correspond to the fluorescence intensities of LF with and without curcumin, respectively. R0 can be calculated as follows:31
| R0 = 9.78 × 10³ (K2n−4ϕJ)1/6 |
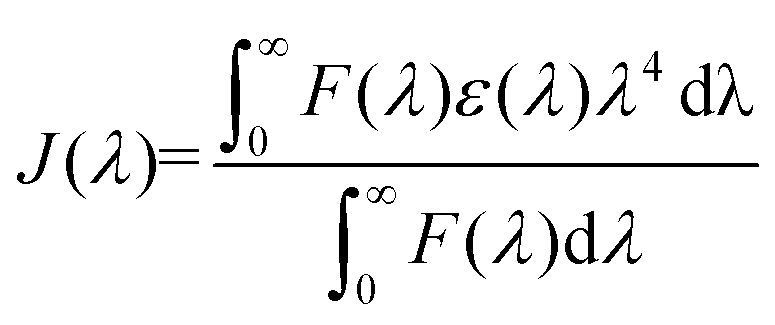
where K2 describes the relative orientation in space of the transition dipoles of the donor and acceptor, n is the refractive index of the solution, ϕ is the fluorescence quantum yield of the donor (LF), and the overlap integral J represents the degree of spectral overlap between the donor emission and the acceptor absorbance and can be calculated as follows:15,33
where F(λ) is the corrected fluorescence intensity of the donor (LF), ε(λ) is the molar absorption coefficient of the acceptor (curcumin), n was taken as 1.36, since the refractive index of biomolecules in solution ranges between 1.3 and 1.4, and ϕ = 0.118.34 There is an important criterion related to distance r and the FRET phenomenon, which needs to be clarified. Lakowicz reported that measurements of the distance r, are only reliable when r is between 0.5R0 and 2R0 and between 1.5 nm and 9 nm.15 This may be explained by the fact that E is strongly dependent on distance, as can be seen when analysing the first equation from this section. Under these experimental conditions, the distance corresponding to 50% energy transfer from LF (4.34 × 10⁻⁶ mol L−1) to curcumin (3.75 × 10⁻⁵ mol L−1) can be estimated. Therefore, it led to the determination of the r value, which corresponds to 1.91 nm, where R0 is equal to 1.99 nm. This result may be reliable since it fits the criteria mentioned above, thus allowing the calculation of parameters such as the binding constant, binding points and the number of binding sites between curcumin and LF.15,31
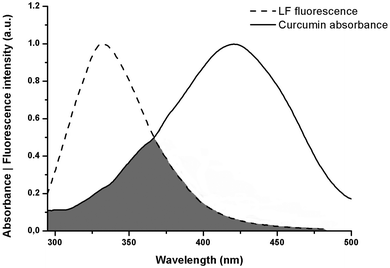 |
| | Fig. 6 Representation of the spectral overlap between LF fluorescence and curcumin absorbance. | |
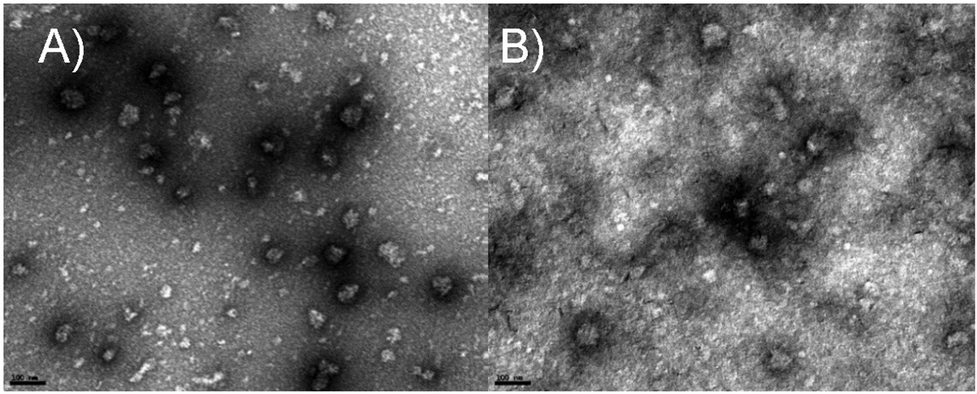
3.7. Morphology of nanohydrogels
Nanohydrogels were morphologically characterized and evaluated by TEM imaging (as shown in Fig. 7). The TEM images confirmed the size between 50 and 90 nm (as determined by DLS) and showed the spherical shape of the LF nanohydrogels before (Fig. 7A) and after (Fig. 7B) their association to curcumin at 80 μg mL−1. As can be observed in Fig. 7B, the appearance of blurry spots may be explained by an increase in protein denaturation, thus meaning that before curcumin incorporation (Fig. 7A), the nanohydrogels exhibited a higher homogeneity in comparison to the ones after it. This result agrees with PdI values previously discussed in section 3.2. In addition, on comparing both images, it was observed that the nanohydrogel size did not significantly change (p < 0.05), as was already seen in DLS analysis. Martins et al. (2016) showed TEM images of LF nanohydrogels of approximately 100 nm with spherical shape, which agrees with the results exhibited here for LF and LF-curcumin nanohydrogels, as shown in Fig. 7, thus corroborating the results from DLS analysis.9,10
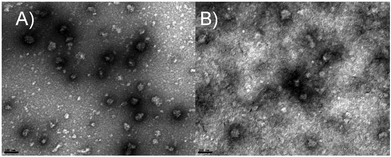 |
| | Fig. 7 Transmission electron (TEM) micrographs of (A) LF nanohydrogels and (B) LF-nanohydrogels associated with curcumin at 80 μg mL−1 (scale bar – 100 nm). | |
3.8. Nanohydrogels stability under storage conditions
LF-curcumin nanohydrogels had an orangish colour and were stable at 4 °C for 35 days, as proved by the absence of precipitate formation and signs of contamination. This result was also validated by ζ-potential values, which were relatively constant between ca. 16 and 21 mV during this period, demonstrating that orangish aspect proteins did not aggregate. In Fig. 8A it can be seen that the size and PdI values did not statistically differ (p < 0.05) for nanohydrogels with and without associated curcumin (results not shown). These results indicate that LF-curcumin nanohydrogels were well preserved under refrigerated storage conditions (i.e., 4 °C).
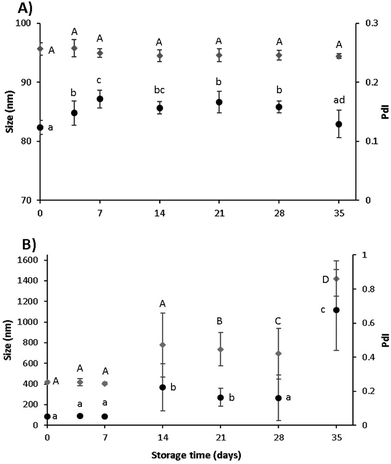 |
| | Fig. 8 Effect of storage time on size (●) and PdI ( ) of LF-curcumin nanohydrogels at (A) 4 °C and (B) 25 °C, over 35 days. Data are presented as mean ± 95% confidence interval. Different letters indicate statistically significant differences between values (p < 0.05). ) of LF-curcumin nanohydrogels at (A) 4 °C and (B) 25 °C, over 35 days. Data are presented as mean ± 95% confidence interval. Different letters indicate statistically significant differences between values (p < 0.05). | |
LF-curcumin nanohydrogels presented a loss in colour and curcumin precipitated at the bottom of each recipient after 14 days for solutions stored at 25 °C. DLS measurements also showed significant changes (p < 0.05) in terms of size and PdI values, thus evidencing the nanohydrogels instability under room temperature conditions (Fig. 8B). Such variability in size and PdI values may indicate that there was an increase in the denaturation degree of LF proteins, thus meaning that proteins can adopt different conformations and/or start to fragment, leading to the separation of curcumin from the LF nanohydrogels.35 This occurrence may explain the appearance of curcumin precipitates at the bottom. Additionally, zeta-potential analyses were conducted (data not shown) and the obtained values revealed a decreasing trend (19 to 13 mV). Compared to the initial samples (between day 0 and day 21), statistically significant differences were observed from day 21 onwards. Therefore, this tendency toward electrostatic repulsion may indicate protein aggregation, which can be correlated with the size and PdI values (as shown in Fig. 8B). These results may be of valuable interest for the selection of an appropriate food matrix for nanohydrogels incorporation.
3.9. Curcumin release kinetics in food simulants
3.9.1. Release profiles.
The incorporation of micro- and nanostructures into food matrices towards the controlled release of nutraceuticals requires a proper understanding of the mechanisms involved in this process. Therefore, a release kinetics assay was performed in order to simulate curcumin release through LF nanohydrogels into the food simulant media at 25 °C (simulating harsh environmental storage conditions). The release rates of curcumin from LF nanohydrogels proved to be higher in the lipophilic food simulant than in the hydrophilic simulant (Fig. 9). It was also observed that in the case of the hydrophilic food simulant, LF nanohydrogels could retain curcumin for more than 9 days, since only ca. 1.6 μg of curcumin was released during this period, reaching stabilization after ca. 4 h. On the second day of this experiment, it was noticed that there were no visual differences in the colour of the hydrophilic medium. This behaviour may be explained by the fact that this lipophilic compound presents a very low solubility in water. In the case of the lipophilic food simulant, ca. 16 μg of curcumin was released from LF nanohydrogels. The amount of curcumin released in this simulant was 10-fold higher as compared with the hydrophilic counterpart. In addition, the release stabilization occurred after ca. 7 h of experiment. In comparison, the release observed in both media points to a rapid stabilization occurring at the beginning of the experiment. This result may be explained by the possibility of curcumin being partially located on the surface of the LF nanohydrogels.11 These findings suggest what should be the most appropriate food matrix characteristic for this system for its application in functional foods. Moreover, as a measure to predict the physical mechanisms involved in curcumin release through the protein matrix, a mathematical model was applied to the experimental values after preliminary calculations.
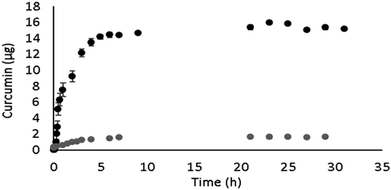 |
| | Fig. 9 Release kinetics of curcumin from LF nanohydrogels into food simulant systems: ( ) 10% ethanol (simulating a food system with hydrophilic nature) and (●) 50% ethanol (simulating a food system with hydrophilic nature). ) 10% ethanol (simulating a food system with hydrophilic nature) and (●) 50% ethanol (simulating a food system with hydrophilic nature). | |
As can be seen below (Fig. 10), a linear superimposition model (LSM) fitting progression was conducted in order to apply the most suitable mathematical modelling for curcumin release in both simulant media (ethanol 10% and 50%). Fig. 10 shows the application of two different mathematical models, which are intended to demonstrate the effect of Fick's diffusion model (Fig. 10A and C) and the LSM model (Fig. 10B and D). The graphs obtained are a combination of the observed and the predicted values. For both simulant media, R2 presented a good regression quality, indicating that the LSM curves fit adequately to the experimental data. Table 2 shows that the release mechanism in the hydrophilic simulant (10% ethanol) is mainly driven by Case II transport (polymer relaxation), since X < 0.5. Both relaxation and diffusion rate constants presented similar values, meaning that curcumin release occurred at the same rate for both Fick's diffusion and polymer relaxation, in 10% ethanol (kF ≈ kRi). The release of curcumin in the lipophilic simulant system (50% ethanol) suggests that the predominant mechanism is Case II transport, where X < 0.5.11 On the contrary, Fickian diffusion model curves did not fit adequately to the experimental data for both media, as can be seen in Fig. 9A and C. Regarding diffusion and relaxation rate constants, under these conditions, the respective data observed in Table 2 indicate that curcumin release occurred more rapidly by Fick's diffusion (kF > kRi).11 This behaviour may strengthen the hypothesis related to curcumin hydrophobic interactions, which was already discussed for the fluorescence analyses in the previous sections. Additionally, LF-curcumin solutions taken at the end of both release kinetics assays were analysed by DLS in order to assess their size and PdI values. In the release kinetics assay with 50% ethanol, the samples presented sizes and PdI values above 500 nm and 0.5, respectively (results not shown). This can be explained by the entry of the simulant medium through the membrane containing the LF-curcumin solution, which may have caused LF precipitation due to the high ethanol concentration. On the other hand, LF-curcumin samples taken from the release kinetics assay with 10% ethanol presented 89.53 nm and 0.303 for size and PdI values, respectively, showing good stability until the end of the experiment.
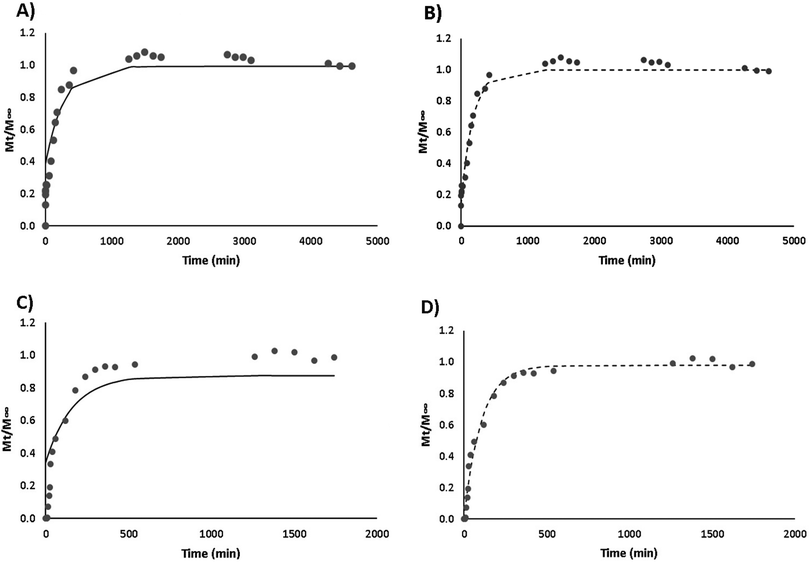 |
| | Fig. 10 Experimental data representation of curcumin release ( ) in 10% ethanol (hydrophilic simulant medium) (A) and (B) and 50% ethanol (lipophilic simulant medium) (C) and (D). Description of Fick's diffusion model (-) and linear superimposition model (- -) of curcumin release at 25 °C. ) in 10% ethanol (hydrophilic simulant medium) (A) and (B) and 50% ethanol (lipophilic simulant medium) (C) and (D). Description of Fick's diffusion model (-) and linear superimposition model (- -) of curcumin release at 25 °C. | |
Table 2 Results of fitting the LSM (i = 1) to experimental data of curcumin release profiles. Evaluation of the quality of the regression based on R2 and RMSE
| Food simulant |
T (°C) |
R
2
|
RMSE |
X
|
K
F (min−1) |
K
R (min−1) |
| RMSE – root mean square error; X – the fraction of compound released by Fickian transport; KF – Fickian diffusion rate constant and KR – relaxation ith rate constants. Standardised halved width (SHW %). |
| 10% ethanol |
25 |
0.978 |
0.079 |
0.365 (13.56%)a |
0.006 (15925.55%)a |
0.006 (5599.66%)a |
| 50% ethanol |
25 |
0.992 |
0.052 |
0.023 (478.92%)a |
23.844 (0%)a |
0.01 (4.62%)a |
3.9.2. Evaluation of nanohydrogel incorporation into a food matrix model.
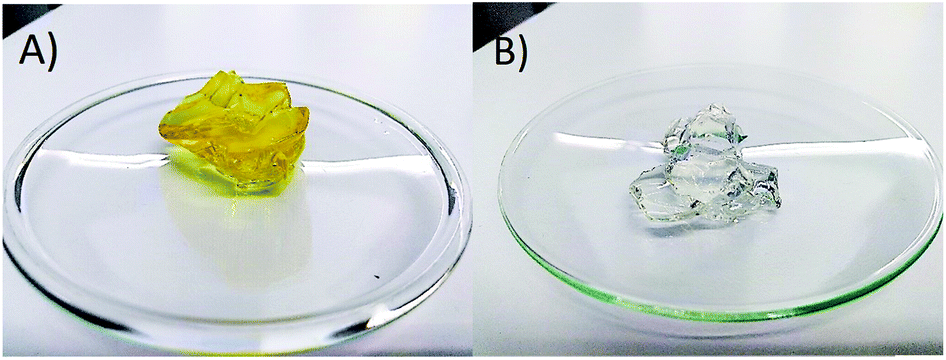
The nanohydrogels were incorporated into a gelatine matrix (used as a real food model) in order to evaluate the protein conformational changes when in contact with gelatine medium and to assess curcumin stability in such an application. Fig. 11 shows the visual aspect of gelatine incorporating LF-curcumin nanohydrogels (Fig. 11(A)) and without nanohydrogels as the control (Fig. 11(B)). After analysing these images, there are some considerations that should be highlighted as follows: (i) the change in colour revealed that curcumin acted as a colouring agent; (ii) the incorporation of nanohydrogels did not affect gelatine transparency, and (iii) the gelatine visual properties did not change after nanohydrogel incorporation. Gelatine samples were kept for up to 7 days, and no visual changes were noticed at the end of this period.
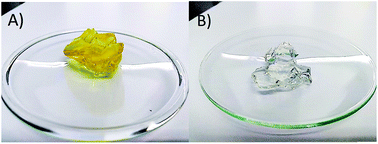 |
| | Fig. 11 Representative images of gelatine (A) containing and (B) without nanohydrogels. | |
3.9.3. Fluorescence measurements.
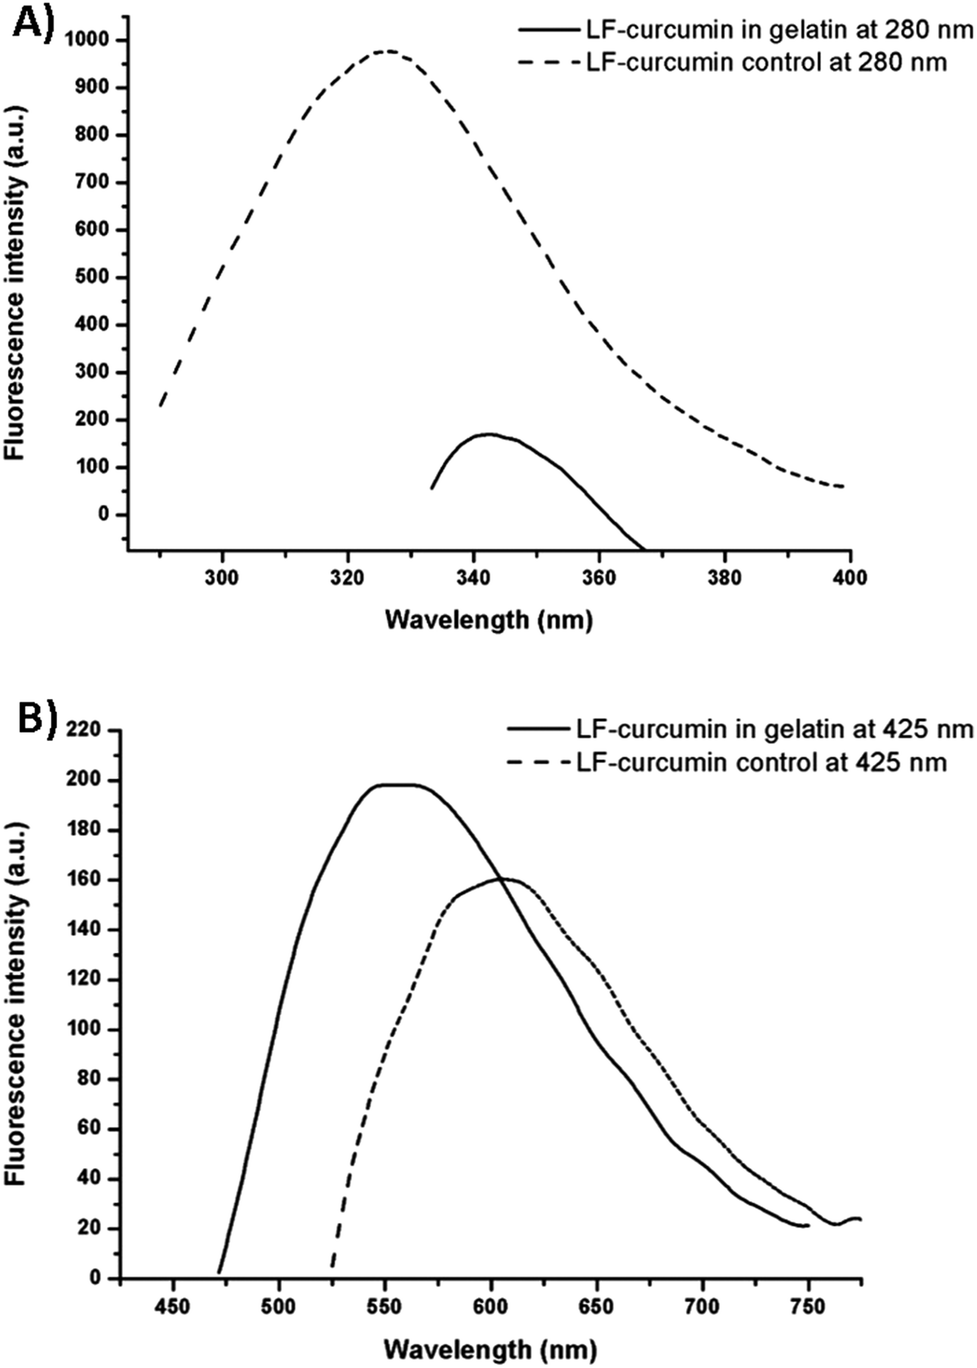
Fluorescence analysis can provide accurate information about protein conformational changes as a function of its behaviour when surrounded by environmental conditions with distinct polarities. Additionally, different environments for the bound ligand may cause spectral shifts or changes in quantum yield, which are usually reflected by binding phenomena. Regarding the fluorescence response of LF-curcumin nanohydrogels excited at 280 nm, there was a significant decrease in the fluorescence intensity maximum, as well as an evident red-shift (Fig. 12A). LF proteins presented an intensity maximum around 328 nm in aqueous solutions, while it shifted to 342 nm in the gelatine matrix, which may indicate a rearrangement of tryptophan and tyrosine residues to a more polar environment.15 It is also important to highlight that LF-curcumin nanohydrogels were incorporated into the gelatine matrix after the freeze-drying process, which may have provoked conformational changes in the LF structure.36,37 It was also possible that gelatine absorbed part of the LF fluorescence emission, which may explain the low fluorescence intensity observed for LF.15 On comparing the emission spectra of LF-curcumin nanohydrogels (exciting curcumin at 425 nm) incorporated in the gelatine matrix, with those exhibited by the control in ethanol at 7.5% (Fig. 12B), it was possible to visualize a red-shift of ca. 50 nm in the maximum fluorescence intensity. Another interesting finding was that curcumin presented a higher emission intensity maximum in the gelatine matrix when compared to the spectrum obtained from the aqueous solution (control). These deviations and intensity variations may be explained by curcumin's solvatochromic nature, i.e., depending on the solvent polarity, shift and intensity variations are expected in curcumin spectra.38 Since curcumin is considered a lipophilic compound, it is expected to have a lower affinity for polar solvents, which may be reflected in a decrease in its fluorescence signal. Additionally, since curcumin is strongly linked to certain LF hydrophobic sites, it is also expected that LF may be able to hold curcumin for longer periods, until the moment of its digestion, which may improve the controlled release of curcumin and consequently, its bioavailability. However, further studies are needed either to evaluate and determine the interactions between LF-curcumin nanohydrogels and gelatine matrices and to assess curcumin bioavailability.
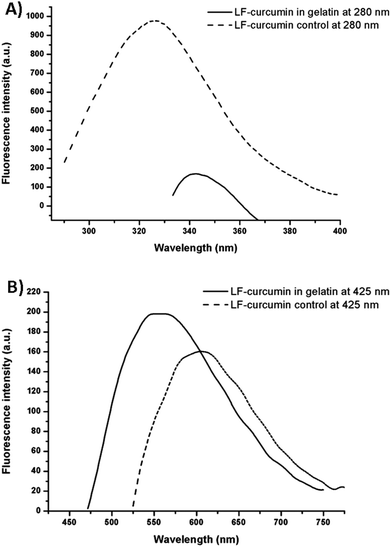 |
| | Fig. 12 The effect of the gelatine matrix on LF-curcumin nanohydrogel fluorescence spectra when compared to the control for (A) excitation at 280 nm, and (B) excitation at 425 nm. | |
4. Conclusions
LF nanohydrogels have the ability to encapsulate lipophilic nutraceuticals, such as curcumin, with remarkable encapsulation efficiency and loading capacity values, which make such nanohydrogels a promising candidate to serve as a vehicle for lipophilic nutraceutical-controlled release. Fluorescence measurements provided valuable structural information about LF-curcumin interactions, namely that curcumin binds to LF mainly through hydrophobic interactions, which resulted in a strong linkage. FRET analysis showed that the transference of energy between LF and curcumin is efficient and highly probable, which allowed the calculation of LF-curcumin binding distances. Therefore, structural information such as the number of binding sites, binding points and binding constant within the extent of this methodology can be achieved. It was also possible to verify that curcumin solubility in aqueous solution was highly improved by its interaction with the LF nanohydrogels. The nanohydrogel stability under storage conditions allowed us to conclude that this system can be suitably applied for longer periods of time in food products when stored under refrigerated conditions (4 °C) as compared to room temperature. Curcumin release profiles in food simulants suggested that hydrophilic food matrices are the most suitable for LF-curcumin nanohydrogels, since they are not able to trigger curcumin release from LF nanohydrogels to the food matrix medium. This finding is of great interest since it is expected that the LF structure may hold curcumin after the incorporation in gelatine, for example, until the moment of its ingestion. Furthermore, the results of the curcumin release kinetics through LF nanohydrogels have contributed to fundamental knowledge in terms of both LF and curcumin behaviour in food simulants, which, in turn, may represent valuable information towards its application in real food matrices. Finally, gelatine was proved at the laboratory scale to be a suitable food model for LF-curcumin nanohydrogel incorporation, and can potentially be applied in the field of functional foods.
Abbreviations
Conflicts of interest
There are no conflicts to declare.
Acknowledgements
Oscar Leandro Ramos gratefully acknowledge the Fundação para a Ciência e Tecnologia (FCT, Portugal) for their fellowships (SFRH/BPD/80766/2011). The authors would like to acknowledge to Rui Rodrigues from the Centre of Biological Engineering of University of Minho, for assistance in several analytical techniques. This study was supported by FCT under the scope of the strategic funding of UID/Multi/50016/2019 and UID/BIO/04469/2013 units and COMPETE 2020 (POCI-01-0145-FEDER-006684) and BioTecNorte operation (NORTE-01-0145-FEDER-000004) funded by the European Regional Development Fund under the scope of Norte 2020 – Programa Operacional Regional do Norte. This study was also supported by FCT under the scope of the Project RECI/BBB-EBI/0179/2012 (FCOMP-01-0124-FEDER-027462).
References
- Z. Teng, Y. Li and Q. Wang, Insight into Curcumin-Loaded β-Lactoglobulin Nanoparticles: Incorporation, Particle Disintegration, and Releasing Profiles, J. Agric. Food Chem., 2014, 62, 8837–8847 CrossRef CAS PubMed.
- M. A. Cerqueira, A. C. Pinheiro, H. D. Silva, P. E. Ramos, M. A. Azevedo, M. L. Flores-López, M. C. Rivera, A. I. Bourbon, Ó. L. Ramos and A. A. Vicente, Design of Bio-nanosystems for Oral Delivery of Functional Compounds, Food Eng. Rev., 2014, 6, 1–19 CrossRef CAS.
- L. de Souza Simões, D. A. Madalena, A. C. Pinheiro, J. A. Teixeira, A. A. Vicente and Ó. L. Ramos, Micro- and nano bio-based delivery systems for food applications: In vitro behavior, Adv. Colloid Interface Sci., 2017, 243, 23–45 CrossRef.
-
H.-S. Kwak, Overvies of Nano- and Microencapsulation for Foods, John Wiley & Sons, 2014, pp. 1–14 Search PubMed.
- O. L. Ramos, R. N. Pereira, R. Rodrigues, J. A. Teixeira, A. A. Vicente and F. X. Malcata, Physical effects upon whey protein aggregation for nano-coating production, Food Res. Int., 2014, 66, 344–355 CrossRef CAS.
- O. L. Ramos, R. N. Pereira, A. Martins, R. Rodrigues, J. A. Teixeira, L. Pastrana, F. X. Malcata, A. António, O. L. Ramos, R. N. Pereira, A. Martins, R. Rodrigues, C. Fuciños, J. A. Teixeira, L. Pastrana, F. X. Malcata and A. A. Vicente, Design of whey protein nanostructures for incorporation and release of nutraceutical compounds in food, Crit. Rev. Food Sci. Nutr., 2017, 57, 1377–1393 CrossRef CAS PubMed.
- B. Lönnerdal and S. lyer, Lactoferrin: Molecular Structure and Biological Function., Annu. Rev., 1995, 15, 93–110 Search PubMed.
- J. H. Brock, The physiology of lactoferrin, Biochem. Cell Biol., 2002, 80, 1–6 CrossRef CAS PubMed.
- C. Bengoechea, I. Peinado and D. J. McClements, Formation of protein nanoparticles by controlled heat treatment of lactoferrin: Factors affecting particle characteristics, Food Hydrocolloids, 2011, 25, 1354–1360 CrossRef CAS.
- J. T. Martins, S. F. Santos, A. I. Bourbon, A. C. Pinheiro, Á. González-Fernández, L. M. Pastrana, M. A. Cerqueira and A. A. Vicente, Lactoferrin-based nanoparticles as a vehicle for iron in food applications – Development and release profile, Food Res. Int., 2016, 90, 16–24 CrossRef CAS PubMed.
- A. I. Bourbon, M. A. Cerqueira and A. A. Vicente, Encapsulation and controlled release of bioactive compounds in lactoferrin-glycomacropeptide nanohydrogels: Curcumin and caffeine as model compounds, J. Food Eng., 2016, 180, 110–119 CrossRef CAS.
- R. M. Rodrigues, A. J. Martins, O. L. Ramos, F. X. Malcata, J. A. Teixeira, A. A. Vicente and R. N. Pereira, Influence of moderate electric fields on gelation of whey protein isolate, Food Hydrocolloids, 2015, 43, 329–339 CrossRef CAS.
- R. N. Pereira, R. M. Rodrigues, E. Altinok, Ó. L. Ramos, F. Xavier Malcata, P. Maresca, G. Ferrari, J. A. Teixeira and A. A. Vicente, Development of iron-rich whey protein hydrogels following application of ohmic heating – Effects of moderate electric fields, Food Res. Int., 2017, 99, 435–443 CrossRef CAS.
- R. F. Chen, Fluorescence Quantum Yields of Tryptophan and Tyrosine, Anal. Lett., 1967, 1, 35–42 CrossRef CAS.
-
J. R. Lakowicz, Principles of fluorescence spectroscopy, 3rd edn, Springer, 2006 Search PubMed.
- A. I. Bourbon, A. C. Pinheiro, M. G. Carneiro-da-Cunha, R. N. Pereira, M. A. Cerqueira and A. A. Vicente, Development and characterization of lactoferrin-GMP nanohydrogels: Evaluation of pH, ionic strength and temperature effect, Food Hydrocolloids, 2015, 48, 292–300 CrossRef CAS.
- A. C. Pinheiro, A. I. Bourbon, M. A. Cerqueira, É. Maricato, C. Nunes, M. A. Coimbra and A. A. Vicente, Chitosan/fucoidan multilayer nanocapsules as a vehicle for controlled release of bioactive compounds, Carbohydr. Polym., 2015, 115, 1–9 CrossRef CAS.
- D. A. Madalena, Ó. L. Ramos, R. N. Pereira, A. I. Bourbon, A. C. Pinheiro, F. X. Malcata, J. A. Teixeira and A. A. Vicente, In vitro digestion and stability assessment of β-lactoglobulin/riboflavin nanostructures, Food Hydrocolloids, 2016, 58, 89–97 CrossRef CAS.
- European Commission, 2011a, Regulation (EC) No. 10/2011 of 14 January 2011 on plastic materials and articles intended to come into contact with food, Off J Eur Union. L. 12:75.
- A. R. Berens and H. B. Hopfenberg, Induction and measurement of glassy-state relaxations by vapor sorption techniques, J. Polym. Sci., Polym. Phys. Ed., 1979, 17, 1757–1770 CrossRef CAS.
- M. C. Rivera, A. C. Pinheiro, A. I. Bourbon, M. A. Cerqueira and A. A. Vicente, Hollow chitosan/alginate nanocapsules for bioactive compound delivery, Int. J. Biol. Macromol., 2015, 79, 95–102 CrossRef CAS.
- A. Berens and H. Hopfenberg, Diffusion and relaxation in glassy polymer powders: 2. Separation of diffusion and relaxation parameters, Polymer, 1978, 19, 489–496 CrossRef CAS.
- N. P. Aditya, H. Yang, S. Kim and S. Ko, Fabrication of amorphous curcumin nanosuspensions using β-lactoglobulin to enhance solubility, stability, and bioavailability, Colloids Surf., B, 2015, 127, 114–121 CrossRef CAS.
- Z. Teng, Y. Luo and Q. Wang, Nanoparticles synthesized from soy protein: preparation, characterization, and application for nutraceutical encapsulation, J. Agric. Food Chem., 2012, 60, 2712–2720 CrossRef CAS.
- M. K. Hazra, S. Roy and B. Bagchi, Hydrophobic hydration driven self-assembly of curcumin in water: similarities to nucleation and growth under large metastability, and an analysis of water dynamics at heterogeneous surfaces, J. Chem. Phys., 2014, 141, 18C501 CrossRef PubMed.
- N. Stănciuc, I. Aprodu, G. Râpeanu, I. van der Plancken, G. Bahrim and M. Hendrickx, Analysis of the Thermally Induced Structural Changes of Bovine Lactoferrin, J. Agric. Food Chem., 2013, 61, 2234–2243 CrossRef PubMed.
- K. J. Siebert, N. V. Troukhanova and P. Y. Lynn, Nature of Polyphenol−Protein Interactions, J. Agric. Food Chem., 1996, 44, 80–85 CrossRef CAS.
- G. D. F. Furtado, R. Nuno, C. Pereira and A. A. Vicente, Cold gel-like emulsions of lactoferrin subjected to ohmic heating, Food Res. Int., 2018, 103, 371–379 CrossRef CAS PubMed.
- B. Wang, Y. P. Timilsena, E. Blanch and B. Adhikari, Characteristics of bovine lactoferrin powders produced through spray and freeze drying processes, Int. J. Biol. Macromol., 2017, 95, 985–994 CrossRef CAS.
- A. H. Sneharani, J. V. Karakkat, S. A. Singh and A. G. A. Rao, Interaction of curcumin with β-lactoglobulin-stability, spectroscopic analysis, and molecular modeling of the complex, J. Agric. Food Chem., 2010, 58, 11130–11139 CrossRef CAS PubMed.
- F. Diarrassouba, L. Liang, G. Remondetto and M. Subirade, Nanocomplex formation between riboflavin and β-lactoglobulin: Spectroscopic investigation and biological characterization, Food Res. Int., 2013, 52, 557–567 CrossRef CAS.
- E. Dufour, C. Genot and T. Haertlé, β-lactoglobulin binding properties during its folding changes studied by fluorescence spectroscopy, Biochim. Biophys. Acta, Protein Struct. Mol. Enzymol., 1994, 1205, 105–112 CrossRef CAS.
- X.-J. Guo, X.-D. Sun and S.-K. Xu, Spectroscopic investigation of the interaction between riboflavin and bovine serum albumin, J. Mol. Struct., 2009, 931, 55–59 CrossRef CAS.
- W. D. Horrocks and A. P. Snyder, Measurement of distance between fluorescent amino acid residues and metal ion binding sites. Quantitation of energy transfer between tryptophan and terbium(III) or europium(III) in thermolysin, Biochem. Biophys. Res. Commun., 1981, 100, 111–117 CrossRef CAS.
- S. M. H. Hosseini, Z. Emam-Djomeh, P. Sabatino and P. Van der Meeren, Nanocomplexes arising from protein-polysaccharide electrostatic interaction as a promising carrier for nutraceutical compounds, Food Hydrocolloids, 2015, 50, 16–26 CrossRef CAS.
- H. R. Costantino, L. Firouzabadian, C. Wu, K. G. Carrasquillo and K. Griebenow, Protein spray freeze drying. 2. Effect of formulation variables on particle size and stability, S. E. Zale and M. A. Tracy, J. Pharm. Sci., 2002, 91, 388–395 CrossRef CAS PubMed.
- S. D. Webb, S. L. Golledge, J. L. Cleland, J. F. Carpenter and T. W. Randolph, Surface adsorption of recombinant human interferon-γ in lyophilized and spray-lyophilized formulations, J. Pharm. Sci., 2002, 91, 1474–1487 CrossRef CAS PubMed.
- D. Patra and C. Barakat, Synchronous fluorescence spectroscopic study of solvatochromic curcumin dye, Spectrochim. Acta, Part A, 2011, 79, 1034–1041 CrossRef CAS PubMed.
|
| This journal is © The Royal Society of Chemistry 2020 |
Click here to see how this site uses Cookies. View our privacy policy here. 
 ab,
Ana I.
Bourbon
ab,
Ana I.
Bourbon

 ) of the LF nanohydrogel, where data are presented as mean ± 95% confidence interval. Different letters indicate statistically significant differences between values (p < 0.05).


 ) of LF-curcumin nanohydrogels at (A) 4 °C and (B) 25 °C, over 35 days. Data are presented as mean ± 95% confidence interval. Different letters indicate statistically significant differences between values (p < 0.05).
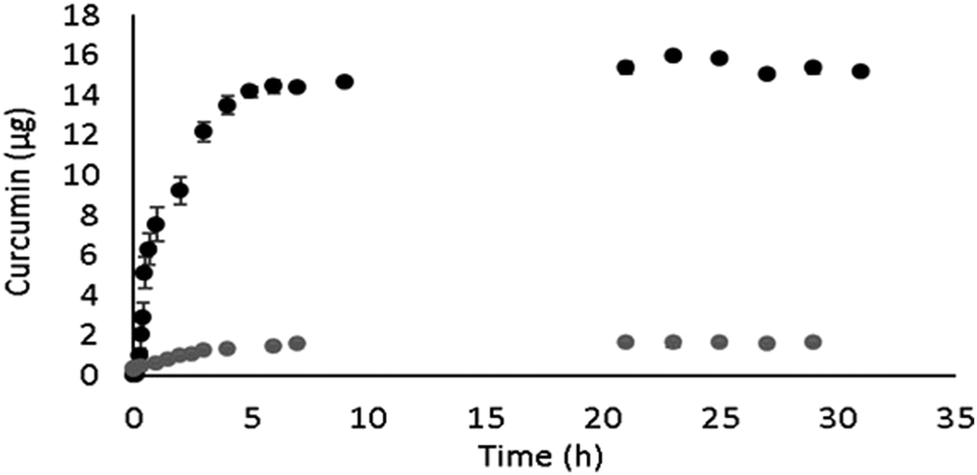
 ) 10% ethanol (simulating a food system with hydrophilic nature) and (●) 50% ethanol (simulating a food system with hydrophilic nature).
 ) in 10% ethanol (hydrophilic simulant medium) (A) and (B) and 50% ethanol (lipophilic simulant medium) (C) and (D). Description of Fick's diffusion model (-) and linear superimposition model (- -) of curcumin release at 25 °C.