Molecular imprinted polymers for the controlled uptake of sinapic acid from aqueous media†
Roya
Fathi Til
a,
Mohammad
Alizadeh-Khaledabad
*a,
Reza
Mohammadi
 b,
Sajad
Pirsa
a and
Lee D.
Wilson
 *c
*c
aDepartment of Food Science and Technology, Faculty of Agriculture, Urmia University, Urmia, West Azerbaijan, Iran. E-mail: malizadeh@outlook.com; m.alizadeh@urmia.ac.ir
bDepartment of Organic and Biochemistry, Faculty of Chemistry, University of Tabriz, Tabriz, East Azerbaijan, Iran
cDepartment of Chemistry, University of Saskatchewan, 110 Science Place – Room 165 Thorvaldson Building, Saskatoon, Saskatchewan S7N 5C9, Canada. E-mail: lee.wilson@usask.ca; Fax: +1-306-966-4730; Tel: +1-306-966-2961
First published on 30th December 2019
Abstract
Several unique molecularly imprinted polymers (MIPs) were synthesized via a precipitation polymerization technique using 4-vinylpyridine as a functional monomer and ethylene glycol dimethacrylate as a cross-linker for selective separation of sinapic acid from aqueous solution. Three sets of MIPs with different functional monomer![[thin space (1/6-em)]](https://www.rsc.org/images/entities/char_2009.gif) :
:![[thin space (1/6-em)]](https://www.rsc.org/images/entities/char_2009.gif) cross-linker molar ratios at 4
cross-linker molar ratios at 4![[thin space (1/6-em)]](https://www.rsc.org/images/entities/char_2009.gif) :
:![[thin space (1/6-em)]](https://www.rsc.org/images/entities/char_2009.gif) 20; 8
20; 8![[thin space (1/6-em)]](https://www.rsc.org/images/entities/char_2009.gif) :
:![[thin space (1/6-em)]](https://www.rsc.org/images/entities/char_2009.gif) 20 and 8
20 and 8![[thin space (1/6-em)]](https://www.rsc.org/images/entities/char_2009.gif) :
:![[thin space (1/6-em)]](https://www.rsc.org/images/entities/char_2009.gif) 32 were prepared along with the corresponding non-templated polymers (NIPs). The MIPs and NIPs were characterized by scanning electron microscopy, dynamic light scattering, N2 adsorption analysis, thermogravimetry, and FT-IR/solids 13C NMR spectroscopy. Batch rebinding and selectivity experiments were carried out to evaluate their adsorption performance, where the MIP prepared with a 4
32 were prepared along with the corresponding non-templated polymers (NIPs). The MIPs and NIPs were characterized by scanning electron microscopy, dynamic light scattering, N2 adsorption analysis, thermogravimetry, and FT-IR/solids 13C NMR spectroscopy. Batch rebinding and selectivity experiments were carried out to evaluate their adsorption performance, where the MIP prepared with a 4![[thin space (1/6-em)]](https://www.rsc.org/images/entities/char_2009.gif) :
:![[thin space (1/6-em)]](https://www.rsc.org/images/entities/char_2009.gif) 20 monomer
20 monomer![[thin space (1/6-em)]](https://www.rsc.org/images/entities/char_2009.gif) :
:![[thin space (1/6-em)]](https://www.rsc.org/images/entities/char_2009.gif) cross-linker mole ratio had significantly higher affinity toward sinapic acid. Notably, all MIPs displayed greater molecular recognition with sinapic acid relative to the NIPs. Therefore, MIPs prepared by this approach represent promising advanced materials for the pre-concentration, isolation and enrichment of sinapic acid from complex food matrices or controlled removal from agricultural waste streams.
cross-linker mole ratio had significantly higher affinity toward sinapic acid. Notably, all MIPs displayed greater molecular recognition with sinapic acid relative to the NIPs. Therefore, MIPs prepared by this approach represent promising advanced materials for the pre-concentration, isolation and enrichment of sinapic acid from complex food matrices or controlled removal from agricultural waste streams.
Introduction
Phenolics are considered as key constituents of the human diet because of their potential anti-oxidative, anti-cancerous, anti-allergenic, anti-inflammatory, anti-microbial and protective role against oxidative stress. The inhibitory effect of sinapic acid (SA) and its derivatives against tumorigenic colon cells and gastric carcinogenesis, cardiovascular diseases, stroke, some types of cancer, and neurodegenerative disorders (Alzheimer's and Parkinson's disease) have been well documented. Sinapic acid is an important bioactive phenolic compound found in citrus fruits such as lemons, various berry fruits, cereal grains, and spices. As well, SA is particularly abundant in Brassica vegetables (cabbage, kale, radish, white cabbage, turnip, leaf mustard, and broccoli) and oilseed crops that belong to the Brassicaceae family such as rapeseed/canola and camelina.1,2 SA has received much attention as an important natural phenolic compound due to its numerous pharmacological properties, therapeutic effects and health benefits that suggest its potential widespread use in food processing, pharmaceutical and cosmetic industries.1,3 The abundance of SA and its derivatives in some food and agricultural waste is exceedingly high, where its concentration in rapeseed seed cake (6390 to 18![[thin space (1/6-em)]](https://www.rsc.org/images/entities/char_2009.gif) 370 μg g−1) are found to depend on the oilseed variety and processing method. Clearly, these compounds remain in the press cake after the oil removal from seeds.1 Thus, the relative abundance in nature and potential extraction from low cost agri-food waste and effluent suggest that purification is economically viable. In the case of adsorption-based separation and purification of sinapic acid and other phenolic acids from crude extracts, various adsorbents such as activated carbons, polymeric resins, and mineral adsorbents that include siliceous materials, clay and natural zeolites.4 As well, polysaccharide-based adsorbents and membrane-filtration processes have been used, where4 much of these reported materials suffer from the non-selective adsorption of the target analyte, resulting in less efficient recovery during separations.
370 μg g−1) are found to depend on the oilseed variety and processing method. Clearly, these compounds remain in the press cake after the oil removal from seeds.1 Thus, the relative abundance in nature and potential extraction from low cost agri-food waste and effluent suggest that purification is economically viable. In the case of adsorption-based separation and purification of sinapic acid and other phenolic acids from crude extracts, various adsorbents such as activated carbons, polymeric resins, and mineral adsorbents that include siliceous materials, clay and natural zeolites.4 As well, polysaccharide-based adsorbents and membrane-filtration processes have been used, where4 much of these reported materials suffer from the non-selective adsorption of the target analyte, resulting in less efficient recovery during separations.
For separation of trace analytes in diverse matrices such as agricultural and food products, emerging novel technologies like molecular imprinted polymers (MIPs) are promising due to their lower cost, higher mechanical and chemical stability, specificity, selectivity and high affinity toward target chemical species.5 Briefly, an appropriate functional monomer is mixed with the template in a suitable inert solvent system to form a pre-polymerization complex via non-covalent forces. Upon polymerization in the presence of a cross-linker and a free radical initiator, the template is removed from the resultant polymer matrix to yield 3-D cavities and binding sites. The MIP binding sites are complementary to the shape, size, and functionality of the molecular template to aide in molecular recognition of the guest molecules that resemble the template structure.6–8
The precipitation technique as an alternative approach to conventional bulk polymerization involves facile preparation without the use of any surfactant or stabilizers,9 laborious crushing, grinding, and sieving of the polymer.10,11 So, uniform nano-sized homogenous spherical particles formed via precipitation polymerization may yield well-organized recognition sites, improved binding capacity and kinetics.12,13
MIPs prepared by traditional free radical polymerization techniques are mainly capable of recognition of the target molecules (including phenolic acids), in the organic or organic-rich phase.14–16 Accordingly, MIPs are reported to exhibit lower adsorption selectivity in the aqueous phase,17,18 which limit their agri-food, environmental and biological applications. MIPs obtained via bulk polymerization for recognition of sinapic acid similarly have low imprinting efficiency in pure water.19
Sinapic acid is poorly soluble in water but is more soluble in alkaline aqueous media. Sinapic acid like other hydroxycinnamic acids can be found in free form or as esters, conjugated to sugars, cell wall carbohydrates or organic acids. Sinapic acid can be liberated from a complex matrix by alkaline hydrolysis. This property can be manipulated for the separation and purification of SA from the alkaline extracts. However, the complicated nature of crude extracts presents challenges for efficient separation.1 The use of copolymer materials with templation may offer potentially selective and greater uptake of SA from complex mixtures. The corresponding MIPs have potential applications in analytical chemistry for identification, pre-concentration, quantification and large-scale separation of SA.
The aim of the present work relates to the synthesis of high efficiency water-compatible MIPs obtained via precipitation polymerization. The novelty of the present study is evidenced by the lack of available reports on the use of an effective water-based method for the separation of SA from aqueous media. This study reports a first example of the use of MIPs prepared by precipitation polymerization to target sinapic acid and its selective isolation from mixtures of structurally related systems.
The results herein overcome the interference effects of water on non-covalent imprinting noted for such types of MIPs.20,21
There are few reports of complementary characterization of MIPs in the solid state using 13C NMR spectroscopy. As well, the MIPs reported herein have potential application for the sustainable extraction of valuable phenolics using a low-cost adsorption-based method.
The materials characterization of the MIPs herein utilize scanning electron microscopy (SEM), dynamic light scattering (DLS), N2 adsorption analysis, thermogravimetric analysis (TGA) and characterization by FT-IR and solids 13C NMR spectroscopy. Adsorption experiments were carried out to analyze the effectiveness of MIPs and NIPs with SA by comparison of the adsorption properties in aqueous solution. Finally, selectivity of the most efficient MIP was evaluated against two structurally similar compounds, caffeic and p-coumaric acids. The applicability of MIP1 to extract sinapic acid from rapeseed press cake hydrolysate was also tested in batch mode.
Materials and methods
Chemicals
Acetonitrile and methanol of HPLC grade and acetic acid (ACS grade) certified were received from Fisher Scientific Co. (Edmonton, AB). Azodiisobutyronitrile (AIBN, 99%), ethylene glycol dimethacrylate (EGDMA, 98%), 4-vinylpyridine, sinapic acid (≥98%), caffeic acid (≥98%) and p-coumaric acid (≥98%) were purchased from Sigma-Aldrich Canada Co. (Oakville, ON). All chemicals were of the highest grade and used as received unless specified otherwise.Synthesis of polymers
Molecularly imprinted polymers and their corresponding non-imprinted materials were prepared at variable mole ratios of 4-VP and EGDMA via precipitation polymerization.6 Firstly, sinapic acid and 4-vinylpyridine were added to a mixture of acetonitrile/methanol (5![[thin space (1/6-em)]](https://www.rsc.org/images/entities/char_2009.gif) :
:![[thin space (1/6-em)]](https://www.rsc.org/images/entities/char_2009.gif) 1) and stirred for 30 min at 23 °C. Subsequently, EGDMA was added to the above mixture and stirred for 30 min at 23 °C. Finally, AIBN was added and the mixture was degassed under nitrogen for 5 minutes. The polymerization was carried out for 24 h at 65 °C in an oil bath. The resulting polymer mixture was dried at 23 °C, where the crude product was Soxhlet extracted for 48 h using a mixed solvent, methanol/acetic acid; 9
1) and stirred for 30 min at 23 °C. Subsequently, EGDMA was added to the above mixture and stirred for 30 min at 23 °C. Finally, AIBN was added and the mixture was degassed under nitrogen for 5 minutes. The polymerization was carried out for 24 h at 65 °C in an oil bath. The resulting polymer mixture was dried at 23 °C, where the crude product was Soxhlet extracted for 48 h using a mixed solvent, methanol/acetic acid; 9![[thin space (1/6-em)]](https://www.rsc.org/images/entities/char_2009.gif) :
:![[thin space (1/6-em)]](https://www.rsc.org/images/entities/char_2009.gif) 1. The products were washed with methanol three times to remove the residual acetic acid. Finally, the washed polymer products were oven dried at 50 °C for 24 h prior to analysis. The same procedure was used for preparation of the non-imprinted polymers (NIPs) without the use of a molecular template (sinapic acid; SA). It should be noted that the concentration of monomer(s) maintained at about 5% (w/v) relative to the total volume of solvent. The synthetic details concerning the various polymers for SA extraction are listed in Table 1 with the acronym designations (vide supra).
1. The products were washed with methanol three times to remove the residual acetic acid. Finally, the washed polymer products were oven dried at 50 °C for 24 h prior to analysis. The same procedure was used for preparation of the non-imprinted polymers (NIPs) without the use of a molecular template (sinapic acid; SA). It should be noted that the concentration of monomer(s) maintained at about 5% (w/v) relative to the total volume of solvent. The synthetic details concerning the various polymers for SA extraction are listed in Table 1 with the acronym designations (vide supra).
![[thin space (1/6-em)]](https://www.rsc.org/images/entities/char_2009.gif) :
:![[thin space (1/6-em)]](https://www.rsc.org/images/entities/char_2009.gif) cross-linker in the presence of templatea (MIPs) and without template (NIPs)
cross-linker in the presence of templatea (MIPs) and without template (NIPs)
| Copolymers | Molar ratio (4-VP![[thin space (1/6-em)]](https://www.rsc.org/images/entities/char_2009.gif) : :![[thin space (1/6-em)]](https://www.rsc.org/images/entities/char_2009.gif) EGDMA) EGDMA) |
Template (mmol) | 4-VP (mmol) | EGDMA (mmol) | AIBN (mmol) | MeCN![[thin space (1/6-em)]](https://www.rsc.org/images/entities/char_2009.gif) : :![[thin space (1/6-em)]](https://www.rsc.org/images/entities/char_2009.gif) MeOH (5 MeOH (5![[thin space (1/6-em)]](https://www.rsc.org/images/entities/char_2009.gif) : :![[thin space (1/6-em)]](https://www.rsc.org/images/entities/char_2009.gif) 1, v/v) 1, v/v) |
|---|---|---|---|---|---|---|
a The molar amount of 4-VP![[thin space (1/6-em)]](https://www.rsc.org/images/entities/char_2009.gif) : :![[thin space (1/6-em)]](https://www.rsc.org/images/entities/char_2009.gif) EGDMA are relative to 1 mole of template (sinapic acid) for all templated copolymers. EGDMA are relative to 1 mole of template (sinapic acid) for all templated copolymers.
|
||||||
| MIP1 | 4![[thin space (1/6-em)]](https://www.rsc.org/images/entities/char_2009.gif) : :![[thin space (1/6-em)]](https://www.rsc.org/images/entities/char_2009.gif) 20 20 |
0.125 | 0.5 | 2.5 | 0.09 | 10 |
| NIP1 | 4![[thin space (1/6-em)]](https://www.rsc.org/images/entities/char_2009.gif) : :![[thin space (1/6-em)]](https://www.rsc.org/images/entities/char_2009.gif) 20 20 |
— | 0.5 | 2.5 | 0.09 | 10 |
| MIP2 | 8![[thin space (1/6-em)]](https://www.rsc.org/images/entities/char_2009.gif) : :![[thin space (1/6-em)]](https://www.rsc.org/images/entities/char_2009.gif) 20 20 |
0.125 | 1 | 2.5 | 0.105 | 11 |
| NIP2 | 8![[thin space (1/6-em)]](https://www.rsc.org/images/entities/char_2009.gif) : :![[thin space (1/6-em)]](https://www.rsc.org/images/entities/char_2009.gif) 20 20 |
— | 1 | 2.5 | 0.105 | 11 |
| MIP3 | 8![[thin space (1/6-em)]](https://www.rsc.org/images/entities/char_2009.gif) : :![[thin space (1/6-em)]](https://www.rsc.org/images/entities/char_2009.gif) 32 32 |
0.125 | 1 | 4 | 0.15 | 15 |
| NIP3 | 8![[thin space (1/6-em)]](https://www.rsc.org/images/entities/char_2009.gif) : :![[thin space (1/6-em)]](https://www.rsc.org/images/entities/char_2009.gif) 32 32 |
— | 1 | 4 | 0.15 | 15 |
Characterization
![[thin space (1/6-em)]](https://www.rsc.org/images/entities/char_2009.gif) 000×).
000×).
![[thin space (1/6-em)]](https://www.rsc.org/images/entities/char_2009.gif) :
:![[thin space (1/6-em)]](https://www.rsc.org/images/entities/char_2009.gif) 10. After grinding with small mortar and pestle, the spectra were obtained in reflectance mode with a resolution of 4 cm−1 over the 400–4000 cm−1 spectral range at 23 °C.
10. After grinding with small mortar and pestle, the spectra were obtained in reflectance mode with a resolution of 4 cm−1 over the 400–4000 cm−1 spectral range at 23 °C.
 | (1) |
The Imprinting factor (IF) was determined as defined by eqn (2).
 | (2) |
 | (3) |
The selectivity coefficient (α) of MIP1 for sinapic acid was then calculated by eqn (4).
 | (4) |
The HPLC measurements were performed using a Knauer D-14163 Berlin HPLC instrument with pre-column equipped with a Knauer diode array detector (DAD). The analytical column was a Knauer 100-5 C18 column (250 × 4.6 mm, packing Eurospher Knauer, Berlin, Germany). The mobile phase was 0.2% phosphoric acid in water (Eluent A), methanol (Eluent B), acetonitrile (Eluent C). The gradient was 0 min, 96% A, 2% B and 2% C; 0–40 min, 50% A, 25% B and 25% C; 40–45 min, 40% A, 30% B and 30% C; 45–60 min, 50% B and 50% C. Finally, the eluent (%) returned to the initial values and held for 2 min. The flow rate was 1 mL min−1 throughout the analysis.
The most efficient MIPs such as MIP1 and the corresponding non-imprinted polymer (NIP1) was selected for extraction of sinapic acid from real samples. Then, 3 mL of extract was added to vials containing 30 mg of MIP1 and NIP1. The vials were shaken at 150 rpm for 24 h at room temperature. Finally, the samples were centrifuged at 4000 rpm for 15 min. The filtrates were analyzed by HPLC for determination of bound SA at 320 nm.
Results and discussion
An overview of the synthesis conditions of MIPs and NIPs are listed in Table 1 and illustrated by Scheme 1. The structural characterization of the copolymer materials is outlined in the following sections by various complementary methods, along with the binding properties of these materials with sinapic acid and two structural analogues (caffeic acid and p-coumaric acid).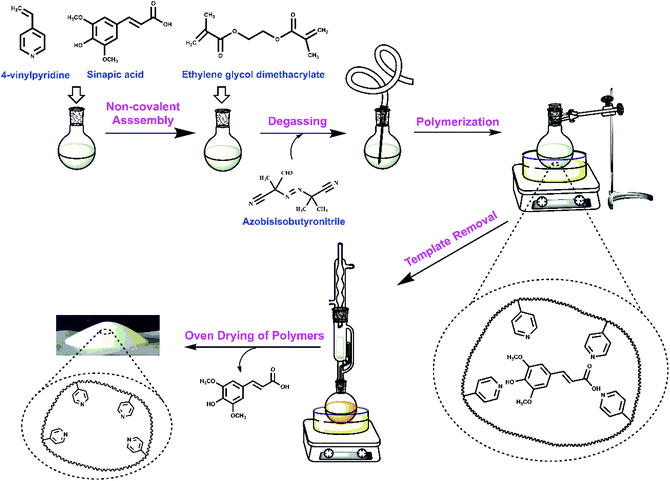 | ||
| Scheme 1 Schematic view of the preparation of molecularly imprinted polymers (MIPs) for sinapic acid (SA). | ||
The results for the SEM, IR/NMR spectroscopy, zeta-potential, gas adsorption, and adsorption-based binding assays were carried out at variable conditions, as described in further detail below. It is noteworthy that the washing step of the polymer is of critical importance since the incomplete removal of the template upon washing can be problematic. Ineffective template removal can interfere with purification and quantitative determination of the template species of interest during the adsorption process.25
SEM results
SEM image analysis can be used to evaluate polymer morphology due to imprinting effects and the role of co-monomer composition on the polymer structure, as reported elsewhere.26 As evidenced in Fig. 1, no significant differences in morphology and particle shape of NIPs and MIPs was observed among the various polymers. All polymers displayed an aggregated globular and pseudo-spherical particles of variable size. These polymer aggregates are porous particles with variable grain size.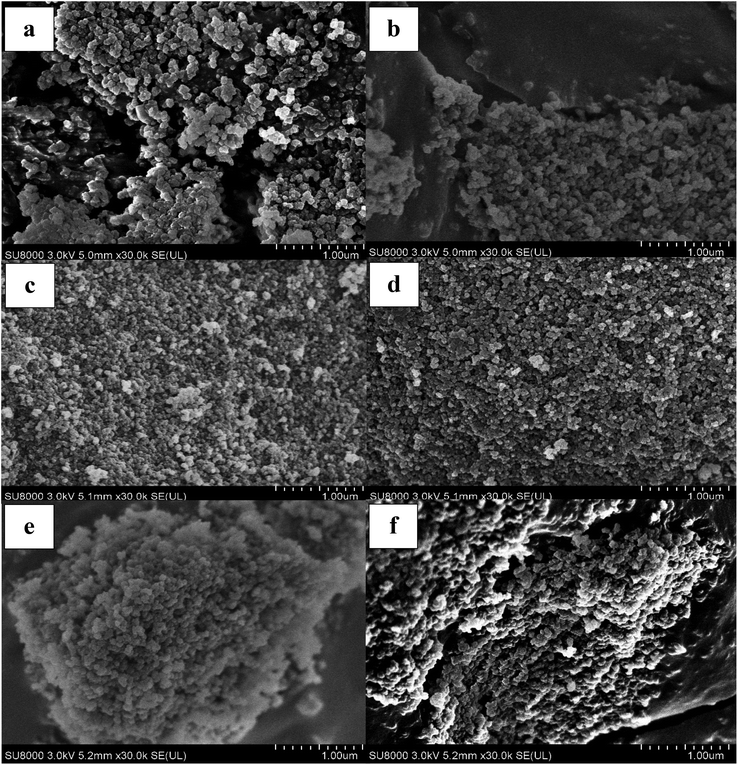 | ||
Fig. 1 SEM images (magnification: 30![[thin space (1/6-em)]](https://www.rsc.org/images/entities/char_2009.gif) 000× of various copolymer materials: NIP1 (a), MIP1 (b), NIP2 (c), MIP2 (d), NIP3 (e) and MIP3 (f). 000× of various copolymer materials: NIP1 (a), MIP1 (b), NIP2 (c), MIP2 (d), NIP3 (e) and MIP3 (f). | ||
Dynamic light scattering (DLS)
The hydrodynamic diameter of the polymer particles was estimated in Millipore water using a zeta-sizer. DLS-based size estimates are known to differ from the geometric diameter determined by SEM due to solvent effects. However, the DLS results may provide a better overall estimation of particle size by averaging across a larger sample size range than the SEM. The particle sizes of polymers were found to range from 142 nm to above 1 μm for all NIP and MIP samples (cf. Fig. S1 in the ESI†). This wide range of sizes may relate to aggregation of polymer particles.Gas adsorption analysis
The textural (accessible surface area and pore structure) properties of the MIPs and NIPs was evaluated from the solid–gas isotherm profiles using the Brunauer–Emmett–Teller (BET) model. The textural properties of the polymer materials by this approach from the nitrogen adsorption isotherms are listed in Table 2. Although the pore diameter of MIP1 (2.4 nm), MIP2 (2.5 nm) and MIP3 (2.1 nm) and their related NIPs have similar pore structure properties, large differences were noted in their accessible surface area estimates. The BET surface area of NIP1 (79.2 m2 g−1) was ca. 1.5 times greater than MIP1 (53.1 m2 g−1). The BET surface area of NIP2 (36.4 m2 g−1) was nearly four-fold greater than MIP2. The variable surface accessibility was relatively minor (<20%) for NIP3 (84.7 m2 g−1) and MIP3 (71.7 m2 g−1), in line with the aggregation properties and surface roughness features in the SEM results (cf.Fig. 1).| Polymers prepared | Surface area (m2 g−1) | Pore volume (cm3 g−1) | Pore diameter (nm) |
|---|---|---|---|
| NIP1 | 79.2 | 0.047 | 2.4 |
| MIP1 | 53.1 | 0.032 | 2.4 |
| NIP2 | 36.4 | 0.022 | 2.5 |
| MIP2 | 9.8 | 0.006 | 2.5 |
| NIP3 | 84.7 | 0.045 | 2.1 |
| MIP3 | 71.7 | 0.037 | 2.1 |
The accessible surface area and pore volume of MIPs were lower than that of non-templated counterparts, in general agreement with results from other studies.27,28 The molecular size of template and the monomer–template interactions likely play a key role in the textural properties of the polymers. The specific surface area obtained for NIP1 (79.2 m2 g−1) and MIP1 (53.1 m2 g−1) was greater in comparison to NIP2 (36.4 m2 g−1) and MIP2 (9.8 m2 g−1). At a constant level of cross-linker, a significant decrease in surface area was noted for NIPs and MIPs as the content of 4-VP increased. This can be explained by decreased cross-linking degree. An opposite trend was observed when the concentration of 4-VP remained constant and the composition of EGDMA increased. The estimated surface area for NIP3 (84.7 m2 g−1) and MIP3 (71.7 m2 g−1) was greater than that of NIP2 and MIP2, in accordance with the porous surface features due to the greater cross-linker content.
The N2 adsorption/desorption isotherms for the NIP and MIP copolymers are shown in Fig. 2. The isotherm uptake results for the templated and non-templated polymers reveal that the N2 adsorption/desorption isotherm adopt a type IV profile, in accordance with their mesoporous structural features.29 According to IUPAC classification, hysteresis loops observed for the NIP1, MIP1, NIP3 and MIP3 polymers are type H1 profiles. This suggests that the particles consist of agglomerates or highly ordered spherical materials with narrow distribution of cylindrical pores. As the monomer to cross-linker mole ratio increased for NIP2 and MIP2, the slope of the hysteresis loops were reduced. This trend is characteristic of adsorption–desorption processes caused by plate-like particles that form non-rigid aggregates or narrow slit-like pores, where the mesoporous framework has lower accessibility.30
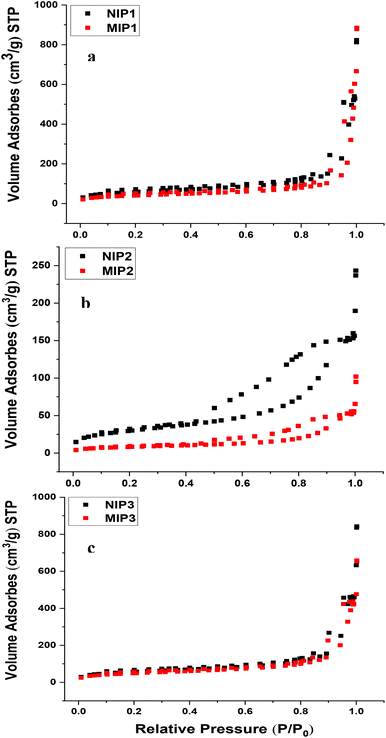 | ||
| Fig. 2 Nitrogen adsorption/desorption profiles of (a) NIP1 and MIP1, (b) NIP2 and MIP2, (c) NIP3 and MIP3. | ||
Thermogravimetric analysis (TGA)
In Fig. 3 and S2,† the TGA results for the NIP and MIP materials were used to evaluate the thermal stability profiles. The weight loss of the synthetic polymers are shown in Fig. S3 in the ESI.† The polymer materials remain thermally stable up to 240 °C, where decomposition occurs above 240 °C.31 The first weight loss event for the polymers occurs between 25–100 °C and relates to loss of water, solvent and other volatile components.31 A second event that is related to decomposition occurs for all polymers; NIPs, MIPs and un-washed MIPs (UW-MIPs) between 240 to 460 °C, in agreement with independent results reported in another study.32 By comparison, the first weight loss event for NIP1, MIP1 and UW-MIP1 was 2.4, 2.1 and 3%, respectively. The weight loss profiles of NIP1, MIP1 and UW-MIP1 at 460 °C was 88.4, 86.1 and 84.7%, respectively. A sharp weight loss for NIP1, MIP1 and UW-MIP1 was also observed at 408, 421 and 395 °C that can be attributed to pyridine decomposition33,34 since it degrades at higher temperature values.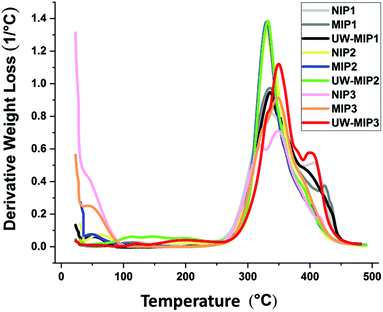 | ||
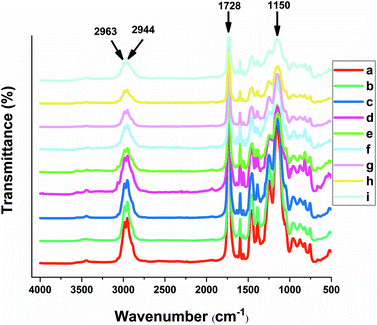
| Fig. 3 FT-IR spectra of the copolymers: a. NIP1, b. MIP1, c. UW-MIP1, d. NIP2, e. MIP2, f. UW-MIP2, g. NIP3, h. MIP3, i. UW-MIP3. | ||
For NIP2, MIP2, UW-MIP2 samples, the primary weight loss observed was 5.1, 4.5, and 8.5%, respectively. The degradation temperature for NIP2, MIP2 and UW-MIP2 occurred near 332 °C with weight loss of ca. 70, 69, and 77%, respectively. By comparison, the weight loss observed in 470 °C for NIP2, MIP2 and UW-MIP2 was ca. 85, 80 and 82%, respectively.
Slightly different trends are noted for the other group of polymers with greater cross-linker content (NIP3, MIP3 and UW-MIP3), where the weight losses were ca. 25, 14 and 4%, respectively. This can be attributed to differences in rigidity or greater hydrophobicity in the case of MIP3. Micropores or cavities of this type may have complex thermal profiles for loss of water, solvent residues, and unreacted monomers or cross-linkers. In the case of macromolecules such as cyclodextrins, the thermodynamic stability of water inside and outside the macrocyclic cavity was documented by Wilson & Verrall35 and in a recent review.36 The weight loss events for NIP3, MIP3 and UW-MIP3 are ca. 65, 74 and 88% and reflect decomposition at 470 °C. For this group of polymers, the decomposition event appears as a shoulder near 327–336 °C that may relate to greater levels of EGDMA in the polymer synthesis. Unwashed MIPs with entrapped template appear to have greater weight loss that can be attributed to degradation of bound or unbound template, and other volatile components.
FTIR characterization
The FTIR spectra shown in Fig. 4 confirm that the co-polymers were successfully formed for both the MIPs and NIPs, where the signatures at 1150 cm−1 were assigned to the C–O stretching of the symmetric and asymmetric bands of the cross-linker. The carbonyl group (C![[double bond, length as m-dash]](https://www.rsc.org/images/entities/char_e001.gif) O) stretching band (1728 cm−1) for all copolymers was observed that supports the presence of EGDMA.37 The characteristic C
O) stretching band (1728 cm−1) for all copolymers was observed that supports the presence of EGDMA.37 The characteristic C![[double bond, length as m-dash]](https://www.rsc.org/images/entities/char_e001.gif) C stretching vibrations and C
C stretching vibrations and C![[double bond, length as m-dash]](https://www.rsc.org/images/entities/char_e001.gif) N stretching vibration frequencies of the aromatic ring of 4-VP are evident at 1450 and 1600 cm−1, respectively. Aliphatic CH stretching bands of the cross-linker EGDMA can be clearly seen at 2944 and 2963 cm−1. The shoulder at 3055 cm−1 corresponds to CH stretching of the pyridine ring, while the band at 3440 cm−1 in all spectra relate to the O–H vibrational bands.38
N stretching vibration frequencies of the aromatic ring of 4-VP are evident at 1450 and 1600 cm−1, respectively. Aliphatic CH stretching bands of the cross-linker EGDMA can be clearly seen at 2944 and 2963 cm−1. The shoulder at 3055 cm−1 corresponds to CH stretching of the pyridine ring, while the band at 3440 cm−1 in all spectra relate to the O–H vibrational bands.38
All of the copolymers herein appear to have similar backbone structure due to the presence of similar functional groups. However, a sharper band at 1390 cm−1 and an accompanying shoulder in 3055 cm−1 corresponds to CH stretching for the aromatic ring of 4-VP that was similarly observed for NIP2, MIP2 and UW-MIP2. The increased CH stretching band likely relates to a greater amount of 4-VP for these copolymers.
The shoulder observed at 1516 cm−1 and the band at 1637 cm−1 for UW-MIP1, UW-MIP2 and UW-MIP3 can be attributed to C![[double bond, length as m-dash]](https://www.rsc.org/images/entities/char_e001.gif) C aromatic vibration of sinapic acid.
C aromatic vibration of sinapic acid.
Solid state 13C NMR spectroscopy
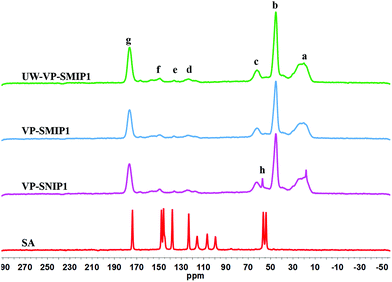
Solid state NMR is a useful technique to determine the chemical composition of insoluble polymers and interactions related to template–polymer complexes. New 13C NMR resonance lines, band broadening, and chemical shift variations can be helpful in identification of the polymer structure and the nature of such interactions.39 The chemical structure of MIP1, NIP1, un-washed MIP1 (UW-MIP1) and sinapic acid (SA) was further investigated by solids 13C NMR spectroscopy (Fig. 5). These polymers were selected for further NMR spectral analysis because MIP1 exhibited more favourable adsorption performance with sinapic acid among the MIPs prepared.The 13C solids NMR spectra for sinapic acid characterized by signatures at 174.2 (CO), 148.0 (C, benzene), 146.0 (C, benzene), 138.0 (CH, ethylene), 123.3 (C, aryl), 116.0 (C, aryl), 106.8 (CH, ethylene), 99.4 (2 CH, aryl), 56.8 (CH3) and 54.2 (CH3) ppm, in agreement with a previous study.40
The solids 13C NMR spectral results obtained for NIP1, MIP1 and UW-MIP1 reveal that the cross-linking agent and the functional monomer (4-VP) are incorporated into the polymer backbone structure. The NMR spectra of NIP1 and MIP1 were almost identical and indicate similar functional groups. The prominent NMR line at 176.4 ppm (g) can be attributed to the ester carbonyl (R–COO–R) of EGDMA. The lines at 62.0 (c), 45.3 (b) and 20.4 ppm (a) correspond to the R–CH2–O, R–CH2–R and R–CH3 of EGDMA, in agreement with previous reports.41–44 The low intensity peaks in 125–150 ppm (d–f) for NIP, MIP and UW-MIP shows the incorporation of 4-VP into the polymer structure. The signal at 150.0 ppm (f) can be attributed to the pyridyl N–C groups, in agreement with previous reports.44,45–47
Surprisingly, the spectra of the UW-MIP1 reveal an extra signal (h) corresponding to the bound template. The emergence of a signal likely corresponds to the CH3O group for UW-MIP, in accordance by its closer contact with the MIP binding sites. The enhancement of the template signals by the magnetization in MIPs or NIPs might reflect their close vicinity to the binding sites.41,42 According to previous studies, solids 13C CP/MAS NMR spectra of the MIPs did not show any signal corresponding to template even at high uptake of template most probably due to signal broadening due to longer relaxation times caused by reduced motion of the analyte adsorbed to the polymer.41
The upfield shift of CH3 was evident at 18.2 ppm in UW-MIP1 that may result from different conformational or disordering effects48 that provide structural information on the binding sites. In addition to the spatial arrangement of template, some other groups such as CH3 may assist in constructing cavities with selective recognition to the template of interest. This was verified by a previous study by Skogsberg et al. First, the 13C magnetization was carried out in a fixed contact time to calculate the cross-relaxation constant or contact time (TCH) for of MIP and NIP prepared with methacrylic acid and EGDMA. The distance between protons and 13C nuclei, and their mobility seem to affect TCH. A possible difference in contact time (TCH) for individual nuclei in identical materials (MIP and NIP) prior to and after incubation with two types of templates with NIP and MIPs was used to predict their mobility and microenvironment.
For the analyte to bind mainly to the high energy sites of the polymers, they used a very low concentration of analyte. Accordingly, the methyl group associated with EGDMA and the olefinic carbon of pendant double bonds and the carbonyl group related to methacrylic acid assumed to influence the morphological characteristics and pore system of MIPs that affect the recognition ability of MIPs. The effects can be explained by the presence of template in the MIP system and resulting geometric or configurational changes by template incorporation during polymer synthesis.41 In another study, the steric effect of chlorine atoms for successful positioning of 2,4-dichlorobenzoic acid in 2,4-dichlorophenoxyacetic acid templated polymer was proposed. It was also reported that a simple one-point binding assay is not sufficient for selective performance assay of MIPs.39
Moreover, the chemical environment of the neighboring molecules can be affected by the newly formed intermolecular interactions (hydrogen bonding, π–π interactions and van der Waals) result in downfield or upfield chemical shifts. The ring current contributions of the aromatic system contribute induced shifts of the aromatic protons. Nuclei located over the face (above) of the ring are shielded, and nuclei on the lateral periphery are deshielded. The aromatic nature of both the template and functional monomer may contribute to π–π stacking effects. The ring current effects may oppose the applied magnetic field that will affect the interaction of protons with this field, thereby leading to further upfield shifts.39,49,50 Besides, downfield chemical shifts signify hydrogen bonding that support such interactions in polymer blend systems. The results obtained with 13C solid state NMR spectroscopy provide evidence on the nature of interactions that are responsible for the binding selectivity observed herein for MIPs.
Binding experiments
For identifying the optimal monomer-cross-linker ratio, several types of MIPs and their corresponding NIPs were synthesized by varying the relative monomer to cross-linker ratios. Subsequently, binding experiments were studied at different initial concentrations of sinapic acid (0.05 to 2.5 mM) in aqueous solution at pH 10 to examine the relative adsorption capacity among the various polymers with SA.As indicated in Fig. 6, MIPs with incremental cross-linking (MIP1, MIP2 and MIP3) reveal significantly higher binding capacity toward SA than their non-templated polymer counterparts. Although MIPs and NIPs were composed of similar chemical composition, their rebinding capacity was notably lower. This relates to the formation of specific recognition sites during the imprinting process for MIPs. Sinapic acid bears –COOH and –OH groups that can form sufficiently strong hydrogen bonded adducts with 4-vinylpyridine as a rather weak base (pKa ∼ 5.6).51 In addition to hydrogen bonding, electrostatic interactions, dipole–dipole interactions and π–π interactions associated with the aromatic moieties of the polymer and phenolic acid accounts for the better recognition of 4-vinylpyridine co-polymers16,52 Increasing the initial concentration of SA resulted in higher adsorption capacity for all copolymers, especially for MIPs.
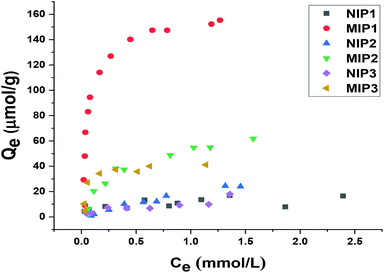 | ||
| Fig. 6 Experimental adsorption capacity of NIP1, MIP1, NIP2, MIP2, NIP3 and MIP3 toward sinapic acid. | ||
The adsorption capacity of MIP1 with SA was relatively high (ca. IF ∼ 5.7) among the various copolymers studied. Accordingly, the template![[thin space (1/6-em)]](https://www.rsc.org/images/entities/char_2009.gif) :
:![[thin space (1/6-em)]](https://www.rsc.org/images/entities/char_2009.gif) monomer
monomer![[thin space (1/6-em)]](https://www.rsc.org/images/entities/char_2009.gif) :
:![[thin space (1/6-em)]](https://www.rsc.org/images/entities/char_2009.gif) cross-linker ratio of 1
cross-linker ratio of 1![[thin space (1/6-em)]](https://www.rsc.org/images/entities/char_2009.gif) :
:![[thin space (1/6-em)]](https://www.rsc.org/images/entities/char_2009.gif) 4
4![[thin space (1/6-em)]](https://www.rsc.org/images/entities/char_2009.gif) :
:![[thin space (1/6-em)]](https://www.rsc.org/images/entities/char_2009.gif) 20 was found to be optimal in terms of the binding ability, in agreement with a previous report by Lu et al.37 By contrast, MIP2 adsorbed a lesser amount of SA as compared to MIP1. Increasing the functional monomer concentration while fixing the level of cross-linker resulted in a decreased specificity of recognition sites toward SA (IF ∼ 2.7). This may be due to an increase in the non-specific binding sites and self-association that result from excess monomer. Similarly, the binding ability of polymers declined as the ratio of cross-linker (mol%) increased from 20 to 32 at constant monomer content. The effect can be due to the structural variation of the polymers where they become either too rigid or flexible for efficient recognition at variable cross-linker content.53 The role of solvent effects on the cross-linked polymer resins was reviewed by Mohamed and Wilson,54 where the effects of solvent swelling on the textural properties of cyclodextrin-based polymers are known to modify the accessible surface area of the polymers.22 The active adsorption sites likely undergo a structural change as a result of greater cross-linking that render the imprinted sites less accessible to the template that result in a reduced binding capacity and selectivity (cf.Table 3).37
20 was found to be optimal in terms of the binding ability, in agreement with a previous report by Lu et al.37 By contrast, MIP2 adsorbed a lesser amount of SA as compared to MIP1. Increasing the functional monomer concentration while fixing the level of cross-linker resulted in a decreased specificity of recognition sites toward SA (IF ∼ 2.7). This may be due to an increase in the non-specific binding sites and self-association that result from excess monomer. Similarly, the binding ability of polymers declined as the ratio of cross-linker (mol%) increased from 20 to 32 at constant monomer content. The effect can be due to the structural variation of the polymers where they become either too rigid or flexible for efficient recognition at variable cross-linker content.53 The role of solvent effects on the cross-linked polymer resins was reviewed by Mohamed and Wilson,54 where the effects of solvent swelling on the textural properties of cyclodextrin-based polymers are known to modify the accessible surface area of the polymers.22 The active adsorption sites likely undergo a structural change as a result of greater cross-linking that render the imprinted sites less accessible to the template that result in a reduced binding capacity and selectivity (cf.Table 3).37
| Copolymers | Q m (μmol g−1) | K L (mM−1) | R 2 |
|---|---|---|---|
| NIP1 | 16.8 | 5.48 | 0.94 |
| MIP1 | 161 | 15.9 | 0.98 |
| NIP2 | 62.4 | 0.43 | 0.98 |
| MIP2 | 81.6 | 2.03 | 0.97 |
| NIP3 | 11.2 | 4.11 | 0.93 |
| MIP3 | 56.6 | 13.7 | 0.98 |
Hosny et al.,19 studied the binding performance of MIPs prepared via bulk polymerization for extraction of SA in mixed solvents containing methanol, water![[thin space (1/6-em)]](https://www.rsc.org/images/entities/char_2009.gif) :
:![[thin space (1/6-em)]](https://www.rsc.org/images/entities/char_2009.gif) acetonitrile (60
acetonitrile (60![[thin space (1/6-em)]](https://www.rsc.org/images/entities/char_2009.gif) :
:![[thin space (1/6-em)]](https://www.rsc.org/images/entities/char_2009.gif) 40 v/v and 80
40 v/v and 80![[thin space (1/6-em)]](https://www.rsc.org/images/entities/char_2009.gif) :
:![[thin space (1/6-em)]](https://www.rsc.org/images/entities/char_2009.gif) 20 v/v), methanol
20 v/v), methanol![[thin space (1/6-em)]](https://www.rsc.org/images/entities/char_2009.gif) :
:![[thin space (1/6-em)]](https://www.rsc.org/images/entities/char_2009.gif) water (60
water (60![[thin space (1/6-em)]](https://www.rsc.org/images/entities/char_2009.gif) :
:![[thin space (1/6-em)]](https://www.rsc.org/images/entities/char_2009.gif) 40 v/v) and pure water. However, according to the experimental adsorption capacity obtained for the optimized MIP and NIP in pure water (prepared with 4-VP and EGDMA), a lower selectivity (IF ∼ 1) with SA was observed.
40 v/v) and pure water. However, according to the experimental adsorption capacity obtained for the optimized MIP and NIP in pure water (prepared with 4-VP and EGDMA), a lower selectivity (IF ∼ 1) with SA was observed.
According to the selectivity results of real water samples, greater uptake yield for SA was obtained. However, the concentration of sinapic acid, caffeic acid, ferulic acid was different prior to the selectivity analysis, where different organic solvents were used for extraction of real samples.19
In Fig. 7, the adsorption isotherms for the polymer systems conform to the isotherm behavior described by the Langmuir model (eqn (5)). This model accounts for single monolayer profile with homogeneous adsorption of an adsorbate onto the active sites of the adsorbent.30
 | (5) |
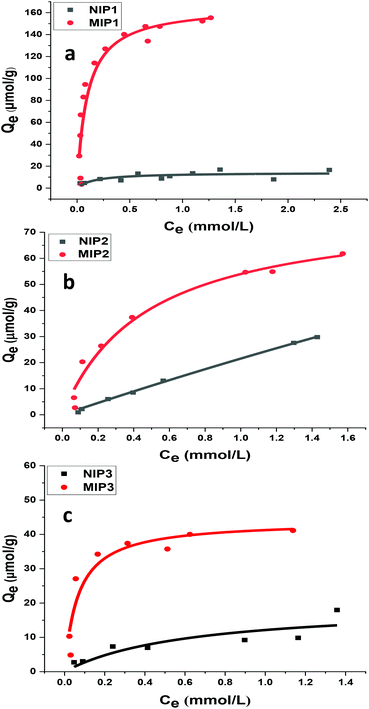 | ||
| Fig. 7 Adsorption isotherms for polymer–sinapic acid systems: (a) NIP1 and MIP1, (b) NIP2 and MIP2, and (c) NIP3 and MIP3, where the solid line corresponds to the best-fit to the Langmuir model. | ||
At equilibrium, Ce (mM) and Qe (μmol g−1) are the unbound (solution concentration) and amount of sinapic acid adsorbed onto the polymer solid adsorbent phase. Qm (μmol g−1) is the maximum monolayer adsorption capacity of sinapic acid of the polymer and KL is the Langmuir adsorption constant, where the isotherm parameters are listed in Table 3. The apparent difference in the rebinding of the template to MIPs and NIPs increased dramatically with greater initial concentration of SA, where greater values of Qe with MIPs are observed. The adsorptive uptake of SA with MIP1 was greatest among the MIPs, where the uptake was ca. two-fold greater than MIP2 and ca. three-fold greater than MIP3. By comparison, the NIPs (NIP1, NIP2 and NIP3) reveal a nearly linear non-specific adsorption trend for SA uptake. These results are in agreement with the absence of pre-organized recognition sites for SA that also provide an account for the inefficiency of the NIPs in rebinding experiments. The maximum adsorption capacity of MIP1 for sinapic acid was calculated to be 161 (μmol g−1). By comparison, Feng et al.,14 reported maximum equilibrium binding capacity (63.5 μmol g−1) for naringin by water compatible MIPs prepared by surface-initiated reverse atom-transfer radical polymerization on a support material. Liu et al.10 prepared MIPs prepared for selective extraction of p-hydroxybenzoic acid from water with a much lower binding capacity (11.8 μmol g−1). Tetracycline-based MIPs revealed a maximum uptake of 17.4 μmol g−1 for tetracycline from aqueous solutions in another study.55 Similar results (∼30 μmol g−1 at 25 °C) were reported by another group for targeting quercetin in aqueous solution.31
Selectivity study
The selectivity coefficient of MIP1 for SA was evaluated by comparing the distribution coefficient of sinapic acid with one of its structural analogues (Scheme 2), where the results are listed in Table 4. The recovery obtained for SA in the presence of both competitors was 95%. The distribution coefficient (Kd) calculated for each compound is listed: sinapic acid (1830), caffeic acid (376.8) and p-coumaric acid (184.8).| Template | K d | α | Recovery |
|---|---|---|---|
| Sinapic acid | 1830 | — | 95% |
| Caffeic acid | 376.8 | 4.85 | 79% |
| p-Coumaric acid | 184.8 | 9.90 | 65% |
This signifies that sinapic acid binds 4.85 times greater than caffeic acid and 9.90 times greater than coumaric acid with MIP1. Thus, MIP1 displayed the highest affinity towards SA, as compared with the related structural analogues in Scheme 2. Consequently, such MIPs could be used as a selective absorbent for SA, where lesser affinity is evidenced for structurally similar compounds. The results demonstrate the role of molecular imprinting for the generation of specific binding sites in MIPs for selective capture of molecular templates of interest.
In a study by Hosny et al.,19 SA imprinted polymers showed greater binding with ferulic acid as compared with caffeic acid. Since ferulic acid has more structural similarity to sinapic acid by the absence of one methoxy group at carbon 5, the MIP showed greater affinity for ferulic acid. The key difference between ferulic acid and caffeic acid is a methoxy group at carbon 3 of ferulic acid versus an hydroxyl group in caffeic acid at C-3. It can be inferred that the methoxy group plays a direct role in the alignment of analytes bound in cavities and impart selectivity of MIPs prepared using SA. Thus, orientation of the functional groups and spatial arrangement of binding sites favour complementary binding sites to the target analyte.
Application of MIPs in real samples
In order to evaluate the practical utility of MIPs in the extraction of SA from rapeseed waste, batch rebinding experiments were applied to MIP1 and NIP1 polymers. Studies on the analysis and identification of SA derivatives present in rapeseeds has mostly been carried out using methanol, ethanol, acetone, ethyl acetate or their aqueous-solutions. Herein, aqueous alkaline hydrolysis was selected for extraction of SA from rapeseed press cake. This extraction strategy was motivated mainly since alkaline treatment is primarily used in commercial processing of many plant-derived foods. Secondly, many phenolic compounds particularly the acid-form exist in a variety of conjugated and free forms which are liberated by alkaline hydrolysis. Thirdly, replacement of conventional organic solvents with green and environment-friendly solvents such as water could serve as a promising alternative for sustainable extraction.Fig. 8 shows a typical HPLC chromatogram of the phenolic acids in rapeseed waste extract before (a) and after (b) rebinding with MIP1, and after rebinding to NIP1 (c). It was not possible to compare the phenolic compounds of rapeseed waste extract results with those reported in the literature because of the diversity of starting biomass, extraction processes and variable analytic methods. MIP1 adsorbed 90% of SA (shown by arrows) present in rapeseed waste extract, where a reduction of other matrix interferences was also observed. As shown above, MIPs are capable of recognition of structurally related compounds along with the template. Meanwhile, NIP1 was not efficient in SA removal which supports the high imprinting efficiency of MIP1. Moreover, the emergence of some new chromatographic bands in the recovered fractions after the sorption process concurs with other studies. Unique species in the HPLC profile may result due to different composition and concentration effects after the sorption process. The enrichment of resveratrol and some other phenolic compounds was observed after application of MIPs to wine samples which were not present in the chromatogram of the original extract.56,57
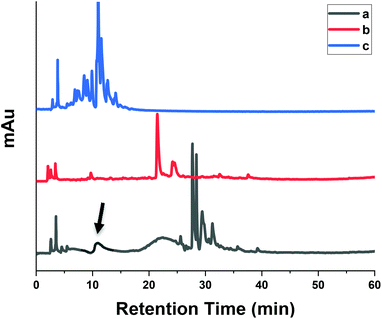 | ||
| Fig. 8 The HPLC chromatogram of the phenolic acids in rapeseed waste extract (a) before, (b) after rebinding to MIP1 and (c) after rebinding to NIP1. | ||
The results indicated the practical utility and sustainability of MIP1 for the selective recognition and extraction of SA from complex food matrices. Additionally, the optimization of rebinding conditions include the amount of polymer, real sample concentration and volume. As well, the development of a unique molecularly imprinted solid-phase extraction (MISPE) method that combines MIPs and SPE to augment the efficiency of MIPs by improved extraction and matrix elimination from complex food samples.
Conclusions
Molecularly imprinted (MIPs) and non-imprinted (NIPs) polymers were prepared via precipitation polymerization. The adsorbent materials were characterized by FT-IR spectral results that affirmed polymer formation, along with TGA results that reveal favourable thermal stability of the copolymers. The MIPs displayed unique molecular recognition toward sinapic acid relative to NIPs. According to the batch rebinding experiments, MIP1 (4-vinylpyridine![[thin space (1/6-em)]](https://www.rsc.org/images/entities/char_2009.gif) :
:![[thin space (1/6-em)]](https://www.rsc.org/images/entities/char_2009.gif) ethylene glycol dimethacrylate molar ratio of 1
ethylene glycol dimethacrylate molar ratio of 1![[thin space (1/6-em)]](https://www.rsc.org/images/entities/char_2009.gif) :
:![[thin space (1/6-em)]](https://www.rsc.org/images/entities/char_2009.gif) 4
4![[thin space (1/6-em)]](https://www.rsc.org/images/entities/char_2009.gif) :
:![[thin space (1/6-em)]](https://www.rsc.org/images/entities/char_2009.gif) 20) with sinapic acid demonstrated the highest molecular recognition among the MIPs, according to the extraction efficiency. By comparison, MIP2 and MIP3 also had greater affinity toward sinapic acid when compared with the corresponding NIPs. Notably, MIP1 exhibited optimal specificity and selectivity toward sinapic acid by its discrimination over structurally similar species. Based on the results obtained herein, MIPs have potential as versatile, efficient, and selective adsorbents for the pre-concentration of sinapic acid in food processing and agriculture-based applications.58,59 This includes pre-concentration prior to food analysis, isolation from agricultural or food waste and or producing value-added food products such as high quality canola protein isolates.
20) with sinapic acid demonstrated the highest molecular recognition among the MIPs, according to the extraction efficiency. By comparison, MIP2 and MIP3 also had greater affinity toward sinapic acid when compared with the corresponding NIPs. Notably, MIP1 exhibited optimal specificity and selectivity toward sinapic acid by its discrimination over structurally similar species. Based on the results obtained herein, MIPs have potential as versatile, efficient, and selective adsorbents for the pre-concentration of sinapic acid in food processing and agriculture-based applications.58,59 This includes pre-concentration prior to food analysis, isolation from agricultural or food waste and or producing value-added food products such as high quality canola protein isolates.
Conflicts of interest
The authors declare no conflict of interest.Acknowledgements
LDW acknowledges the support of the Government of Canada through the Natural Sciences and Engineering Research Council of Canada (NSERC; Discovery Grant RGPIN 2016-06197) and the University of Saskatchewan. RF acknowledges the support of Urmia University through the VRS program at the University of Saskatchewan to facilitate this collaborative research.References
- N. Nićiforović and H. Abramovič, Compr. Rev. Food Sci. Food Saf., 2014, 13, 34–51 CrossRef.
- L. Quinn, S. G. Gray, S. Meaney, S. Finn, O. Kenny and M. Hayes, Ir. J. Agric. Food Res., 2017, 56, 104–119 Search PubMed.
- A. S. Sinha, U. Khandavilli, E. O'Connor, B. J. Deadman, A. R. Maguire and S. E. Lawrence, CrystEngComm, 2015, 17, 4832–4841 RSC.
- M. L. Soto, A. Moure, H. Domínguez and J. C. Parajo, J. Food Eng., 2011, 105, 1–27 CrossRef.
- Z. Zhang, S. Xu, J. Li, H. Xiong, H. Peng and L. Chen, J. Agric. Food Chem., 2012, 60, 180–187 CrossRef PubMed.
- G. Pan, B. Zu, X. Guo, Y. Zhang, C. Li and H. Zhang, Polymer, 2009, 50, 2819–2825 CrossRef.
- H. Peng, S. Wang, Z. Zhang, H. Xiong, J. Li, L. Chen and Y. Li, J. Agric. Food Chem., 2012, 60, 1921–1928 CrossRef PubMed.
- P. Pataer, T. Muhammad, Y. Turahun, W. Yang, S. Aihebaier, M. Wubulikasimu and L. Chen, J. Sep. Sci., 2019, 42, 1634–1643 CrossRef PubMed.
- S. Xu, J. Li and L. Chen, Talanta, 2011, 85, 282–289 CrossRef PubMed.
- X. Liu, F. Wu, C. Au, Q. Tao, M. Pi and W. Zhang, J. Appl. Polym. Sci., 2018, 46984, DOI:10.1002/APP.46984.
- F. Ning, H. Peng, L. Dong, Z. Zhang, J. Li, L. Chen and H. Xiong, J. Agric. Food Chem., 2014, 62, 11138–11145 CrossRef PubMed.
- S. Pardeshi and S. K. Singh, RSC Adv., 2016, 6, 23525–23536, 10.1039/C6RA02784A.
- L. Chen, X. Wang, W. Lu, X. Wua and J. Lia, Chem. Soc. Rev., 2016, 45, 2137–2211 RSC.
- X. Feng, T. Wu, B. Yu, Y. Wang and S. Zhong, RSC Adv., 2017, 7, 28082 RSC.
- R. Suedee, V. Seechamnanturakit, B. Canyuk, C. Ovatlarnporn and G. P. Martin, J. Chromatogr., A, 2006, 1114, 239–249 CrossRef.
- C. Michailof, P. Manesiotis and C. Panayiotou, J. Chromatogr., A, 2008, 1182, 25–33 CrossRef.
- X. Wu, X. Wang, W. Lu, X. Wang, J. Li, H. You, H. Xiong and L. Chen, J. Chromatogr., A, 2016, 1435, 30–38 CrossRef.
- A. Ostovan, M. Ghaedi, M. Arabi, Q. Yang, J. Li and L. Chen, ACS Appl. Mater. Interfaces, 2018, 10, 4140–4150, DOI:10.10.1021/acsami.7b17500.
- H. Hosny, N. E. Gohary, E. Saad, H. Handoussa and R. M. E. Nashar, J. Sep. Sci., 2018, 41, 1164–1172 CrossRef.
- R. D. Crapnell, A. Hudson, C. W. Foster, K. Eersels, B. v. Grinsven, T. J. Cleij, C. E. Banks and M. Peeters, Sensors, 2019, 19, 1204 CrossRef.
- F. Duan, C. Chen, X. Zhao, Y. Yang, X. Liu and Y. Qin, Environ. Sci.: Nano, 2016, 3, 213–222 RSC.
- L. D. Wilson, M. H. Mohamed and J. V. Headley, J. Colloid Interface Sci., 2011, 375, 215–222 CrossRef.
- I. A. Udoetok, L. D. Wilson and J. V. Headley, Materials, 2016, 9, 645 CrossRef.
- K. Kraljic, D. Škevin, L. Barišic, M. Kovacevic, M. Obranovic and I. Jurcevic, Food Chem., 2015, 187, 236–242 CrossRef.
- G. Vasapollo, R. D. Sole, L. Mergola, M. R. Lazzoi, A. Scardino, S. Scorrano and G. Mele, Int. J. Mol. Sci., 2011, 12, 5908–5945 CrossRef.
- M. K. Danquah, R. C. Aruei and L. D. Wilson, J. Phys. Chem., 2018, 122, 4748–4757 CrossRef.
- J. Meng and X. Wang, J. Chem., 2019, 4783432, DOI:10.1155/2019/4783432.
- T. Esteves, R. Viveiros, J. Bandarra, W. Heggie, T. Casimiro and F. C. Ferreira, Sep. Purif. Technol., 2016, 163, 206–214 CrossRef.
- R. Lawrence and Y. Jiang, in Bio-aggregates Based Building Materials, ed. S. Amziane and F. Collet, Springer International Publishing, Netherlands, 2017, pp. 39–71 Search PubMed.
- S. Asman, S. Mohamad and N. M. Sarih, J. Appl. Polym. Sci., 2015, 42720, DOI:10.1002/APP.42720.
- V. Pakade, S. Lindahl, L. Chimuka and C. Turner, J. Chromatogr., A, 2012, 1230, 15–23 CrossRef CAS.
- S. Sadeghi and M. Jahani, Food Chem., 2013, 141, 1242–1251 CrossRef CAS.
- M. Grochowicz, J. Therm. Anal. Calorim., 2014, 118, 1603–1611 CrossRef CAS.
- A. Elmaci, J. Hacaloglu, C. Kayran, G. Sakellariou and N. Hadjichristidis, Polym. Degrad. Stab., 2009, 94, 2023–2027 CrossRef CAS.
- L. D. Wilson and R. E. Verrall, J. Phys. Chem. B, 1997, 101, 9270–9279 CrossRef CAS.
- F. Biedermann, W. M. Nau and H. J. Schneider, Angew. Chem., Int. Ed., 2014, 53, 11158–11171 CrossRef CAS.
- Y. Lu, Y. Zhu, Y. Zhang and K. Wang, J. Chem. Eng. Data, 2019, 64, 1045–1050, DOI:10.1021/acs.jced.8b00944.
- R. W. Kibechu, M. A. Mamo, T. A. M. Msagati, S. Sampath and B. B. Mambab, Phys. Chem. Earth, 2014, 76–78, 49–53 CrossRef.
- J. O'Mahony, A. Molinelli, K. Nolan, M. R. Smyth and B. Mizaikoff, Biosens. Bioelectron., 2005, 20, 1884–1893 CrossRef PubMed.
- R. Cai, S. D. Arntfielda and J. L. Charlton, J. Am. Oil Chem. Soc., 1999, 76, 433–441 CrossRef CAS.
- U. Skogsberg, C. Meyer, J. Rehbein, G. Fischer, S. Schauff, N. Welsch, K. Albert, A. J. Hall and B. Sellergren, Polymer, 2007, 48, 229–238 CrossRef CAS.
- J. Courtois, G. Fischer, S. Schauff, K. Albert and K. Irgum, Anal. Chem., 2006, 78, 580–584 CrossRef CAS.
- K. M. Annamma and B. Mathew, Mater. Sci. Appl., 2011, 2, 131–140 CAS.
- L. M. Madikizela, S. S. Zunngu, N. Y. Mlunguza, N. T. Tavengwa, P. S. Mdluli, L. Chimuka and L. Chimuka, Water SA, 2018, 44, 406 CrossRef CAS.
- J. Wang, M. K. Cheung and Y. Mi, Polymer, 2001, 42, 3087–3093 CrossRef CAS.
- S.-W. Kuo, P.-H. Tung and F.-C. Chang, Macromolecules, 2006, 39, 9388–9395 CrossRef CAS.
- J. Mao, X. Cao, D. C. Olk, W. Chu and K. Schmidt-Rohr, Prog. Nucl. Magn. Reson. Spectrosc., 2016, 100, 17–51, DOI:10.1016/j.pnmrs.2016.11.003.
- L. Boggioni, S. Losio and I. Tritto, Polymer, 2018, 10, 647 Search PubMed.
- J. Xu, C. He, K. C. Toh and X. Lu, Macromolecules, 2002, 35, 8846–8851 CrossRef CAS.
- C. Song, C. Lang, J. Kopycki, J. Hughes and J. Matysik, Front. Mol. Biosci., 2015, 2, 42, DOI:10.3389/fmolb.2015.00042.
- S.-K. Yoon, J.-C. Lee, S. Lee, S.-H. Choi, H.-J. Kim, H.-J. Park and H.-D. Kang, Anal. Sci. Technol., 2006, 19, 218–225 Search PubMed.
- A. S. S. Rodrigues, A. P. de Aguiar, M. R. M. P. de Aguiarb and L. C. de Santa Maria, J. Braz. Chem. Soc., 2007, 18, 431–436 CrossRef CAS.
- L. Ma, L. Tang, R.-S. Li, Y.-P. Huang and Z.-S. Liu, RSC Adv., 2013, 5, 84601–84609, 10.1039/C5RA16029D.
- M. H. Mohamed and L. D. Wilson, Nanomaterials, 2012, 2, 163–186 CrossRef CAS.
- M. Sánchez-Polo, I. V. Gala, J. J. López-Peñalver and J. Rivera-utrilla, Microporous Mesoporous Mater., 2015, 203, 32–40 CrossRef.
- C. Gomes, G. Sadoyan, R. C. S. Dias and M. R. P. F. N. Costa, Processes, 2017, 5, 72, DOI:10.3390/pr5040072.
- C. P. Gomes, R. C. S. Dias and M. R. P. F. N. Costa, Chromatographia, 2019, 82, 893–916 CrossRef CAS.
- Y. Yamini, M. Safari and M. Shamsayei, J. Pharm. Anal., 2018, 8, 250–257 CrossRef.
- R. Teixeira, S. Dopico-García, P. B. Andrade, P. Valentão, J. M. López-Vilariño, V. González-Rodríguez, C. Cela-Pérez and L. R. Silva, J. Food Sci. Technol., 2015, 52, 7735–7746 CrossRef CAS.
Footnote |
| † Electronic supplementary information (ESI) available: Further results related to particle size distribution of synthetized polymers; thermogravimetric analysis curves (weight loss) of synthetized polymers (PDF). See DOI: 10.1039/c9fo01598a |
| This journal is © The Royal Society of Chemistry 2020 |

