
Structurally different mixed linkage β-glucan supplements differentially increase secondary bile acid excretion in hypercholesterolaemic rat faeces†
Nunzia
Iaccarino
 ab,
Bekzod
Khakimov
a,
Mette Skau
Mikkelsen
a,
Tina Skau
Nielsen
c,
Morten Georg
Jensen
d,
Antonio
Randazzo
b and
Søren Balling
Engelsen
*a
ab,
Bekzod
Khakimov
a,
Mette Skau
Mikkelsen
a,
Tina Skau
Nielsen
c,
Morten Georg
Jensen
d,
Antonio
Randazzo
b and
Søren Balling
Engelsen
*a
aDepartment of Food Science, University of Copenhagen, Rolighedsvej 26, 1958 Frederiksberg C, Denmark. E-mail: se@food.ku.dk; Tel: +45 35 33 32 05
bDepartment of Pharmacy, University of Naples Federico II, Via D. Montesano 49, 80131 Naples, Italy
cDepartment of Animal Science, Aarhus University, Foulum, Denmark
dCarlsberg Research Laboratory, Carlsberg A/S, DK-1799 Copenhagen V, Denmark
First published on 6th December 2019
Abstract
Mixed linkage (1→3),(1→4)-β-D-glucan (BG) is a soluble fibre available from oat and barley grains that has been gaining interest due to its health-promoting role in cardiovascular diseases and its ability to modulate the glycaemic index which is beneficial for people with diabetes. This study investigates the effect of three purified barley BGs, with different molecular weight and block structure, on faecal bile acid excretion in hypercholesterolaemic rats. Wistar rats (48 male) were divided in four groups: Control group fed with the cellulose-rich diet (CON); Glucagel group fed with the commercial BG (GLU, 100 kDa), and rats fed with low molecular weight BG (LBG, 150 kDa) and medium molecular weight BG (MBG, 530 kDa). The bile acid profiles of rat faecal samples were measured using gas chromatography-mass spectrometry (GC-MS). A metabolite profiling approach led to the identification of 7 bile acids and 45 other compounds such as sterols, fatty acids and fatty alcohols. Subsequent application of ANOVA-simultaneous component analysis and Principal Component Analysis revealed that all three BG diets increased bile acid faecal excretion compared to the control group. The bile acid excretion was found to be different in all three BG diets and the MBG group showed a significantly higher level of faecal secondary bile acids, including deoxycholic acid, hyodeoxycholic acid, and lithocholic acid. We hypothesise that the hydrophobic surface of the secondary bile acids, which are known to cause colon cancer, has high affinity to the hydrophobic surfaces of cellulosic blocks of the BG. This in vivo study demonstrates that the molecular weight and/or block structures of BG modulate the excretion of secondary bile acids. This finding suggests that developing diets with designed BGs with an optimal molecular structure to trap carcinogenic bile acids can have a significant impact on counteracting cancer and other lifestyle associated diseases.
1. Introduction
Mixed linkage (1→3),(1→4)-β-D-glucan (BG) is a viscous and water soluble dietary fibre present in the oat or barley endosperm, which has been associated to beneficial health effects.1 In 1997, the Food and Drug Administration allowed a health claim stating that the consumption of oat products may reduce the risk of coronary heart disease for their cholesterol-lowering effect and in 2005 the claim was expanded to include also barley products.2 Indeed, in the last years, several studies have shown that the consumption of barley and oat products lowers plasma cholesterol in animal models,3–7 as well as in humans.8–15BG is a linear cell wall polysaccharide composed of glucose molecules that are joined by β-(1→4)-, and β-(1→3)-glycosidic bonds. The long chains of BG consist of repeating blocks having different degree of polymerization (DP), such as three (cellotriosyl or DP3) or four (cellotetraosyl or DP4) glucose units connected by β-(1→3)-linkages. The systematic but occasional occurrence of the β-(1→3) linkage breaks the linearity of the (cellulose) polymer, and creates a more bulky polymeric structure, which is water soluble and hinders the cellulosic alignment in microfibrils.16,17 The so-called DP3/DP4 ratio as well as the ratio of β-(1→3)/β-(1→4) linkages are two important functional parameters for BG's water solubility, which, in turn, are positively correlated with the viscosity. Viscosity and solubility, together with the dose and the molecular weight (MW), are fundamental for the BG's hypocholesterolaemic activity.18,19
The structural characteristics of BGs, e.g. DP3/DP4 and β-(1→3)/β-(1→4) ratios, are often not described in the literature which makes the comparison of BG studies challenging, sometimes resulting in inconsistent findings about their hypocholesterolaemic effects.19,20 To date, only a few in vivo studies have compared the effect of BG intake, with different MW, on the human and/or animal blood plasma cholesterol level. Most of these studies investigated oat and barley BGs with MW of 10–3000 kDa and 100–2500 kDa, respectively.21–23
Immerstrand et al. have tested a wide MW range (10 to 2348 kDa) of oat BGs, having different viscosities, for their blood plasma cholesterol-lowering effect in mice. The study concluded that all BG preparations reduced plasma cholesterol when compared with a cellulose-containing control diet, regardless of the molecular weight of BG.24 Another study, performed on hamsters, compared the hypocholesterolaemic effect of two BGs (175 kDa and 1000 kDa) and reported that the BG having higher MW had a stronger effect.6 Recently, Mikkelsen and co-authors investigated a smaller MW range (100 to 530 kDa) of pure BGs, extracted from a high-BG barley variety, for their effects on blood plasma lipids in hypercholesterolaemic rats.25 The study showed that, after 28 days of intervention, total and LDL cholesterol levels decreased in all rat groups. However, no significant difference among rats fed with the three different BGs was found, suggesting that MW of BG may not have an impact on plasma lipids. However, these results may also lead to the hypothesis that after only 28 days of intervention the effect of BG intake might be too small to be detected because of the efficient plasma homeostasis.14
It may also be possible that the effect of BGs intake could be observed at a different compartment of the living system. In particular, it is known that the intestinal reabsorption of bile acids (BAs) is reduced due to their high molecular affinity towards BGs that are present in the intestine1,26 (Fig. 1). This leads to an increased faecal BA excretion and, in order to compensate for this loss, both the endogenous cholesterol synthesis and de novo bile acid synthesis are promoted in the liver via 3-hydroxy-3-methylglutaryl-Coenzyme A (HMG-CoA) and 7α-hydroxylase (CYP7A1), respectively.1 Upregulation of de novo bile acid synthesis promotes removal of the LDL cholesterol from the blood, in order to be used as substrate for the bile acid synthesis.27
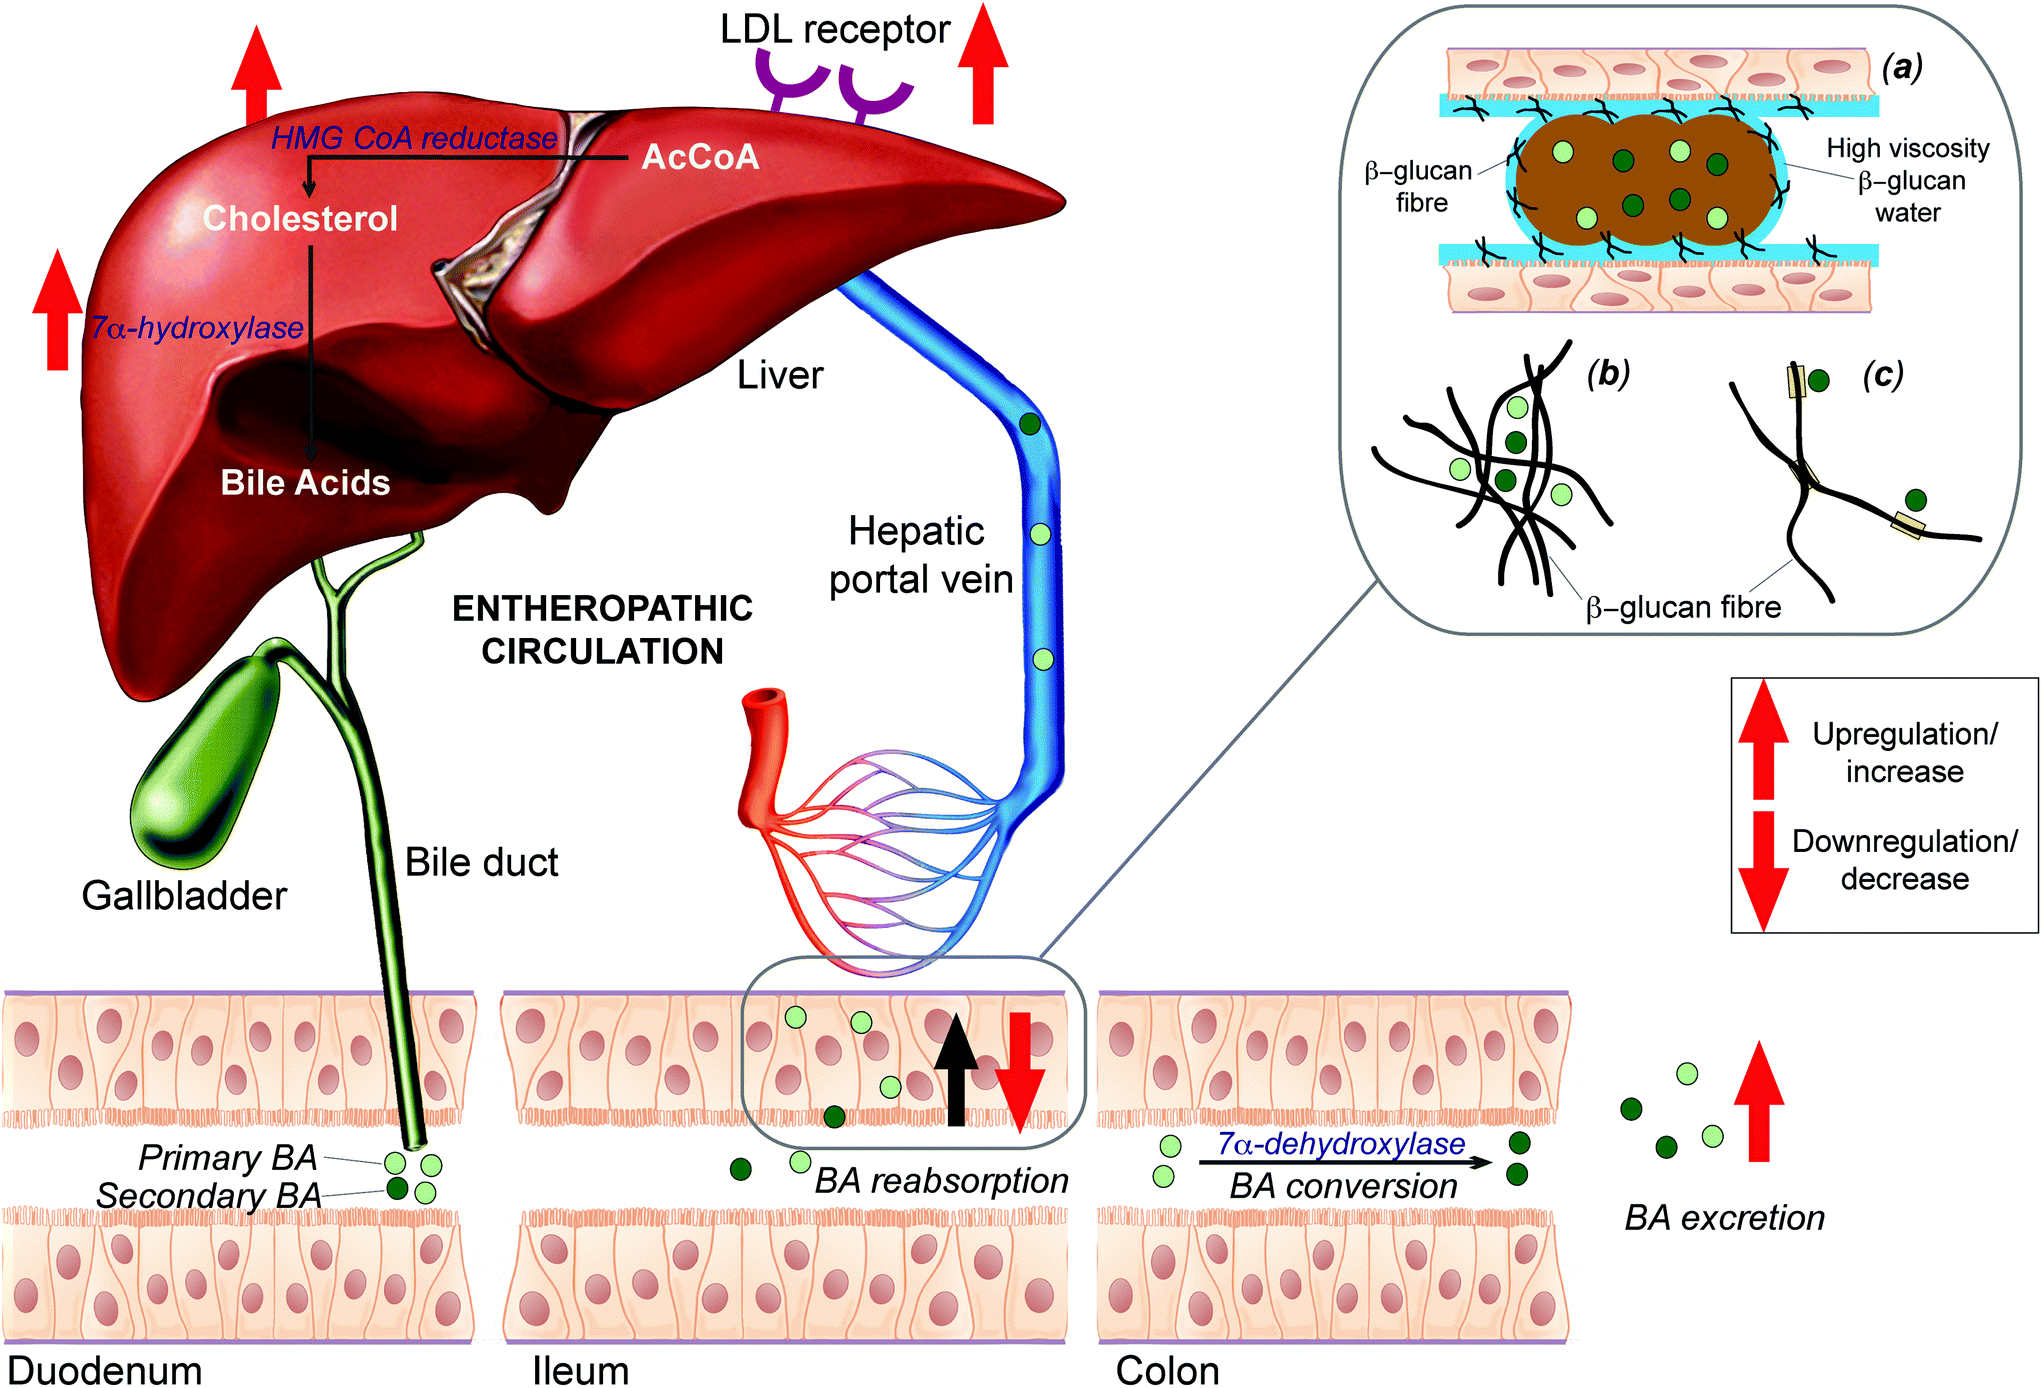 | ||
| Fig. 1 Simplified representation of the hypothesized hypocholesterolaemic mechanism of β-glucan fibres. Mixed linkage β-glucan decrease the (re)absorption of bile acids in the intestinal lumen, leading to an increased faecal output of these compounds. Three hypotheses could explain the preventing of BAs reabsorption: (a) BG fibres increase the viscosity of the water film around the “food-ball” hindering the BAs reabsorption (b) the trapping of bile acids in a net made of fibres (c) a hydrophobic interaction between the fibre and the bile acids trough the unused cellulosic junctions. In order to compensate for this loss, hepatic BAs synthesis is promoted thanks to the upregulation of the enzymes HMG-CoA and 7α-hydroxylase (CYP7A1). In this frame the receptors responsible for the uptake of the LDL cholesterol increase, thus providing the substrate for the bile acid synthesis. This process leads to decreased serum LDL cholesterol concentrations. After the synthesis, the BAs are excreted and stored in the gallbladder where they aggregate above a critical micellar concentration to form bile salts micelles. These are then secreted into the duodenum after meals in order to act as tensioactives and facilitate fat digestion. Once this action has been accomplished, BAs are largely reabsorbed (95%) in the ileum by an active transport mechanism, in order to be sent back to the liver via hepatic portal vein, generating the enterohepatic circulation. A small percentage (less than 5%) of BAs remain in the intestine and enters in the colon. Here the steroid nucleus of the primary bile acids (light green circles) undergoes to a 7α-dehydroxylation by anaerobic bacteria forming 7-deoxy bile acids (secondary BAs, dark green circles). Bile acid conjugation has not been represented here. | ||
Thus, it is important to monitor the bile acids excretion for understanding the effects of BGs in this biosynthesis network. The present study represents an extension to the work conducted by Mikkelsen and co-authors25 and aims at contributing to the structure–function relation of the β-glucans by employing a controlled and systematic approach to analyse the increased faecal BAs excretion after the BG intake using GC-MS metabolomics and advanced multivariate data analysis. To this end, a cellulose-enriched diet was used as negative control (CON); a commercially available β-glucan called Glucagel (100 kDa) was chosen as positive control and two pure BG extracts having low (LBG, 150 kDa) and medium (MBG, 530 kDa) molecular weight were tested on a hypercholesteraemic murine model.
2. Methods
2.1 BG preparation
LBG (150 kDa) and MBG (530 kDa), derived from a high-BG barley mutant, lys5f (Risø 13),28 were extracted and characterized according to Mikkelsen and co-authors.29 A commercial barley β-glucan (Glucagel™, DKSH Nordic A/S, Birkerød, Denmark) had similar MW (100 kDa) as LBG and was employed as positive control while cellulose represented the negative control in the animal study. Aiming at a supplementation level of 5%, BGs or cellulose were mixed with semisynthetic food formulated to mimic a Western-style diet.25 The physical–chemical characteristics of the BGs and composition of feed preparations are summarized in Table 1. More information about the origin and the characteristics of the BGs employed can be found in the paper by Mikkelsen and co-authors.25 The ratio of β-(1→3) to β-(1→4) linkages in the BG preparations was calculated from one-dimensional proton NMR spectra (ESI Fig. S1†) as described by Mikkelsen and co-authors.29| CON | GLU | LBG | MBG | |
|---|---|---|---|---|
| a Measurement of viscosity was performed with a StressTech rheometer (Reologica Instruments AB, Sweden) using a cup (26.0 mm) and bob (25.0 mm) geometry over a shear rate range of 1–100 s−1. Measurements were done at 37 °C and viscosities are reported at 30 s−1. b DP3/DP4, ratio between cellotriosyl and cellotetraosyl oligomer units in the β-glucan chain. c TDF, total dietary fibre. | ||||
| β-Glucan characteristics | ||||
| Molecular mass, kDa | 100 | 150 | 530 | |
| Viscosity, mPa sa | 4.3 | 5.9 | 39.9 | |
| β-1,3:β-1,4 linkage ratio (%) | 34.2![[thin space (1/6-em)]](https://www.rsc.org/images/entities/char_2009.gif) :65.8 :65.8 |
33.7:66.3 |
34.2:65.8 |
|
| DP3/DP4, molar ratiob | 3.2 | 3.8 | 3.8 | |
| Feed composition (% of DM) | ||||
| Cellulose | 5.3 | 0.0 | 0.0 | 0.0 |
| β-Glucan | 0.2 | 7.0 | 6.7 | 6.5 |
| TDFc | 8.2 | 9.1 | 8.6 | 9.3 |
| Protein (N × 6.25) | 22.7 | 22.9 | 22.5 | 23.2 |
| Starch | 25.6 | 24.2 | 26.2 | 22.0 |
| Fat | 23.6 | 24.0 | 23.9 | 23.8 |
2.2 An intervention study using hypercholesterolaemic rats
All experimental animal procedures were conducted according to Danish laws and regulations for the human care and use of animals in research (The Danish Ministry of Justice, Animal Testing Act, Consolidation Act no. 1306 of November 23, 2007) and performed under the license obtained from the Danish Animal Experimentation Inspectorate, Ministry of Food, Agriculture and Fisheries.A total of forty-eight 4-week-old male Wistar rats (Taconic Europe, Ry, Denmark) with an initial body weight of approximately 110 g were used for the experiment conducted in three batches of sixteen rats per batch (4 rats per dietary treatment/batch, in total 12 rats per diet). The rats were housed in 35 × 56 × 17 cm cages (4 rats per cage) at a constant temperature of 25 °C, relative humidity of 60% and a 12:12-hour light–dark cycle with no natural light on a standard rat chow (Altromin 1324, Brogaarden A/S, Gentofte, Denmark) ad libitum. For an overview of the experimental design see Fig. 2. After five days of acclimatization to the facility (day 0), blood was drawn from the tail vein of fifteen random rats. All rats were then fed the control diet (CON) with 2% cholesterol (ESI Table S1†) ad libitum for 21 days in order to become hypercholesterolemic. On day 21 tail blood from all animals was sampled and the establishment of the hypercholesterolaemy condition was evaluated. Indeed, the high-cholesterol diet resulted in an increase in total plasma cholesterol from 1.7 ± 0.04 to 4.0 ± 0.6 mmol L−1. From day 21 to 49, rats were assigned to one of the four experimental diets (control, CON; glucagel, GLU; low molecular weight BG, LBG; medium molecular weight BG, MBG), as reported in ESI Table S1†, according to their body weight (BW) to assure similar average BW and BW-variation in the groups. Feed intake per cage and body weight of individual rats were recorded once a week throughout the experiment. On day 39 rats were transferred to individual housing in metabolism cages in a set-up for separate collection of faeces as described by Eggum.30 After a 3-day habituation period with ad libitum feeding of the assigned experimental diet, the rats were given 20 g of feed per day for the following 4 days. During this period, feed residues were registered and faeces were collected quantitatively every second day for four days and stored at −20 °C until analysis. After a total of 7 days in the metabolic cages, rats were transferred back to group housing (2 rats per cage) receiving the same diet as in the balance period, until euthanasia two days later. No difference in feed intake, body weight gain, feed efficiency and final body weight was found among the dietary treatments.25
 | ||
| Fig. 2 Overview of the study design. A total of 48 male Wistar rats were used for the trial, conducted in triplicate (three batches of sixteen rats each). In each batch, rats were made hypercholesterolemic during the first 21 days of the study. After 21 days, they were divided in four groups fed a high fat diet differing for the type of fibre supplement (Cellulose, Glucagel, LBG and MBG) mixed into it. Faecal samples were collected during days 44–47. | ||
2.3 Bile acids extraction
The absolute faecal matter weight and dry matter of all 4 rat groups were measured and the data has been reported by Mikkelsen et al.25 50 mg of freeze-dried stool powder (±3 mg) were mixed with 1 mL of 96% ethanol containing 0.1 M sodium hydroxide. The mixture was vortexed for 1 minute and mixed at 1400 rpm for 1 hour at 85 °C using a ThermoMixer F2.0 (Eppendorf, Hørsholm, Denmark). After cooling at room temperature, the samples were centrifuged (13000g for 10 min), 0.5 mL clear supernatant was transferred to a 2 mL microcentrifuge tube and 1 mL of n-hexane was added. The mixture was vortexed for 1 min and 25 μL of the ethanolic fraction was transferred to a glass insert for the GC-MS analysis. Each sample was prepared in duplicate and resulted in a total of 96 samples.
2.4 GC-MS analysis
The final extract, 25 μL of the ethanolic fraction, was completely dried using a vacuum dryer, ScanVac (Labogene, Lynge, Denmark) operating at 1000 rpm at 40 °C for 4 hours. The glass inserts were then sealed with air tight magnetic lids into GC-MS vials and derivatized by addition of 30 μL trimethylsilyl cyanide (TMSCN).31 All steps involving sample derivatization and injection were automated using a MultiPurpose Sampler (MPS) (Gerstel, Mülheim, Germany). After the derivatization reagent addition, the sample was transferred into the agitator of the MPS and incubated at 40 °C for 40 min at 750 rpm. Immediately after derivatization, 1 μL of the derivatized sample was injected in a splitless mode. The spilt/splitless injection port was set to 320 °C. The septum purge flow and purge flow to split vent at 2.1 min after injection were set to 3 and 15 mL min−1, respectively. The GC-MS consisted of an Agilent 7890A GC and an Agilent 5975C series MSD (Agilent Technologies, Glostrup, Denmark). GC separation was performed on an Agilent HP-5MS column (30 m × 250 μm × 0.25μm) by using hydrogen carrier gas at a constant flow rate of 1.2 mL min−1. The GC oven temperature program was as follows: initial temperature 40 °C, equilibration time 2.0 min, heat up to 270 °C at the rate of 12 °C min−1, then heat at the rate of 6 °C min−1 until 310 °C and hold for 10 min. Mass spectra were recorded in the m/z range of 50–700 with a scanning frequency of 2.2 scans per s, and the MS detector was switched off during the first 22.0 min of the run since BAs eluted after this retention time. The transfer line, ion source and quadrupole temperatures were set to 290 °C, 230 °C and 150 °C, respectively. The mass spectrometer was tuned according to manufacturer's recommendation by using perfluorotributylamine (PFTBA). The MPS and GC-MS were controlled using the vendor software Maestro (Gerstel).In order to monitor data acquisition quality, a control sample (pooled faecal sample) and an alkane mixture standard sample (all even C10–C40 alkanes at 50 mg L−1 in hexane) were injected after every 16 samples. The pooled faecal sample was prepared by mixing together around 10 mg of each of the 48 faecal samples. Then, six aliquots of this mixture (around 50 mg each) were taken and extracted following the same protocol employed for the real samples.
All samples were randomized prior to GC-MS analysis. A blank sample containing only derivatization reagent was run prior to identify any reagent and/or GC column derived peaks.
2.5 PARAFAC2 and metabolite identification
The raw GC-MS profiles of the faecal extracts were processed using the PARAllel FACtor Analysis 2 (PARAFAC2)32,33 algorithm that allows the deconvolution of co-eluted, low signal to noise ratio and retention time shifted peaks. The GC-MS data was arranged in a three-way array (elution time × mass spectra × samples) and modelled by PARAFAC2. In order to reduce the complexity of the data, the chromatograms were manually divided into 33 intervals in the retention time dimension, allowing baseline separation between intervals. Each interval was then individually modelled using one to ten components and validated as previously described.34 Relative areas of resolved peaks, representing a unique peak, were extracted from validated models. The final data matrix was normalized using norm1 approach where each variable value is divided by the sum of all variables within the measured sample (row-wise operation).Resolved peaks were identified from their PARAFAC2 based deconvoluted mass spectra that were compared against the GC-MS library NIST11 (version 2.0, NIST, Maryland, USA), along with their retention indices (RIs). Identification was performed at three levels using Metabolomics Standard Initiatives35 (i) Level 1 if the peaks are confirmed using authentic standards, (ii) Level 2 when the peaks are identified based on their EI-MS ≥ 80 (%) and RI match (±30) and (iii) Level 3 when the peaks are identified based on their EI-MS ≥ 65 (%). The list of identified metabolites is reported in ESI Table S2.†
PARAFAC2 was performed using in-house scripts for MATLAB version R2015a (MathWorks Inc., Massachusetts, USA).
2.6 Data analysis
P values for all variables investigated in this study were calculated for diet and batch effects based on one-way Analysis of Variance (ANOVA) using the anova1 function. The multiple comparison test was also performed to determine which pairs of group means were significantly different. This was done using multcompare function. All P values were corrected for the false discovery rate (FDR) for multiple hypothesis testing using mafdr function. Anova1 and multcompare functions were available through a stats toolbox and mafdr was available through bioinfo toolbox of the Matlab version R2015a (MathWorks Inc., Massachusetts, USA).Principal Component Analysis (PCA)36 was employed for data exploration. ANOVA-simultaneous component analysis (ASCA)37 was used to partition the variation present in the GC-MS data according to the study design including two factors, diet (contains 4 levels: 4 different diets) and batch (contains 3 levels: 3 times performed intervention) and their two-factor interaction effect (Xdiet, Xbatch, Xbatch×diet and Xresiduals) (Fig. 3). The effect data matrices, Xdiet and Xbatch, obtained from ASCA modelling, were subsequently autoscaled and modelled using PCA. The PCA analyses were performed using the PLS toolbox version 7.8.1 (Eigenvector Research, Manson, USA) under MATLAB environment, version R2015a (MathWorks Inc., Massachusetts, USA) and ASCA was performed using in-house scripts.
 | ||
| Fig. 3 ASCA-based decomposition of the variation according to the two main effects, diet and batch and the two-factor interaction effect. Please note that two technical replicates have been prepared for each sample, thus accounting for 8 samples in each box. | ||
2.7 Chemical and reagents
Analytical scale ethanol (99.9%), n-hexane, NaOH, trimethylsilyl cyanide (TMSCN) (99.8%) and C10–C40 all-even alkane mixture and the bile acids standards were purchased from Sigma-Aldrich (USA). Water used throughout the study was purified using a Millipore Milli-Q lab water system (Merck Millipore Corporation, Merck KGaA, Darmstadt, Germany) equipped with a 0.22 μm filter membrane.3. Results
The deconvolution of the GC-MS data revealed a total of 52 peaks, each with a unique retention index and mass spectrum. Seven out of the 52 peaks were identified as bile acids at level 1, namely cholic acid (CA), deoxycholic acid (DCA), lithocholic acid (LCA), chenodeoxycholic acid (CDCA), α-muricholic acid (αMCA), hyodeoxycholic acid (HDCA), and tauro β-muricholic acid (TβMCA). Their relative concentrations are represented in Fig. 4. In addition, 26 peaks were identified as neutral sterols, fatty acids, fatty alcohols and disaccharides at level 2 (ESI Table S2†). Amongst the neutral sterols, cholesterol was detected at the highest concentration in most of the samples resulting in an overloaded peak, and accordingly it was removed from the further data analysis. A representative chromatogram of a pooled faecal sample is shown in ESI Fig. S2.† | ||
| Fig. 4 Bar plots and error bars show mean and standard deviations of relative concentrations of bile acids in the faecal samples calculated from all the samples (n = 96). The concentrations are expressed in arbitrary units (normalized peak areas). *Pair differences, P < 0.05. | ||
The final dataset, consisting of 96 samples (rows of the data matrix) and 52 compounds (columns of the data matrix), was explored using Principal Component Analysis, which showed a clear separation only between CON and three BG-treated groups, while the variation among the three BG supplements remained elusive. Indeed, the scores and loadings plots, reported in ESI Fig. S3,† clearly show that the control samples lie in the opposite side of the first principal component with respect to the BG-treated samples that are richer in bile acids. However, in order to get rid of the unwanted variation stemming from the fact that the samples were collected during three consecutive batches of experiments, a chemometric tool, called ASCA, was employed. This algorithm allowed us to partition the variation present in the original GC-MS data matrix by generating four new data matrices, each one containing the variation due to diet, batch, diet-batch interaction, and individual variability (Fig. 3). The ASCA results show, as expected, that the diet had the biggest effect and explain 20.8% of total variance. Although the batch effect was only 3%, it remained statistically significant implying that there was a small difference in the faecal bile acid profiles of the rats studied in the three different batches. The variation retained in the residual matrix E, accounts for the sum of total uncertainty derived from the individual differences between the rats, as well as from the experimental errors.
In order to investigate the diet effect-data matrix generated by ASCA (Xdiet) a PCA was performed. The obtained scores plot (Fig. 5A) enable a clear separation between the control group and the three BG-groups (LBG, MBG and GLU). The corresponding loadings plot (Fig. 5B) indicates that the presence of 6.5–7% of BG in the diets resulted in a higher BA excretion, as all BAs have positive loadings on PC1, which is in good agreement with previous studies.38,39 However, this model largely explains the difference between the control group and BG groups and was not able to identify differences between the three BG groups. Thus, in the next step, the CON group was removed from the analysis and a new PCA was computed on the ASCA separated diet-effect matrix (Fig. 5C and D). This analysis now reveals significant separation among the LBG, MBG and GLU groups, showing that the three different BGs have a different impact on the faecal bile acid profiles of rats. In the PC1 versus PC2 scores plot of the PCA model, the commercial BG (GLU) group lies in the middle of the LBG and MBG groups illustrating that the difference between LBG and MBG was greater than the difference between LBG and GLU or MBG and GLU. The corresponding loadings plot reveals that the secondary bile acids are the main variables contributing to the discrimination of the three BG groups. In particular, MBG rats seem to excrete the highest amounts of secondary bile acids in faeces including HDCA, DCA, and LCA. This was further confirmed by the PCA of Xdiet, computed including only LBG and MBG groups. The scores and loading plots, reported in ESI Fig. S5,† showed that, along with the secondary bile acids, two primary bile acids (αMCA and TβMCA) were higher in the MBG rats (right side of the plots) while a higher cholic acid concentration characterized the LBG group (left part of the plots).
 | ||
| Fig. 5 Scores (A) and loadings (B) plots derived from the PCA model, including all the studied groups, obtained by diet effect separated matrix using ASCA (Xdiet). Scores (C) and loadings (D) plots derived from the PCA model including only the BG-treated groups. | ||
In order to ensure that the data matrix containing the variation due to the batch effect (Xbatch) did not include relevant information about the different dietary treatments, a PCA was performed on this dataset (ESI Fig. S4†). As observed by the figure, the slight differences caused by the three batches were not correlated with the different dietary treatments nor the faecal bile acids. Indeed, PC1 versus PC2 scores and loadings plots showed a partial separation of rat faecal samples according to three different batches. It is worth noting that observed batch effect was weak, showing only some trends of discrimination. Moreover, none of the bile acids were important for the observed weak trends in the PCA model, whereas four unknown metabolites (metabolites #5, #10, #45 and #47 of Table S2†) and a fatty alcohol (metabolite #16 of Table S2†) contributed to the partial separation of batch 1 and 2 from batch 3.
The significance of the Xdiet×batch interaction term suggests a possible difference of the diet effect across the three batches. Since this interaction effect explained only a half of the variation explained by the main diet effect, and since the purpose of this study was directed towards an overall diet difference rather than within the three batches, this term was not further scrutinized.
A univariate data analysis (one-way ANOVA) allowed for the investigation of diet and batch effects for each individual metabolite. This approach is useful to reveal effects that may otherwise be masked in multivariate analysis due to the high number of uninformative variables and/or due to the challenges in estimating co-variances in multivariate data analysis.40 A total of 39 out of 52 variables were found to be statistically significant (p < 0.05) in ANOVA followed by multiple comparison tests for at least one pair of BG diets (ESI Table S2†). Interestingly 21 out of 39 statistically significant variables for the diet effect were also found to be important in separating BG rats in PCA scores plot (Fig. 5C). Likewise ASCA, one-way ANOVA performed on MBG and LBG showed that relative concentrations of LCA, DCA, αMCA and TβMCA were higher in faecal samples of MBG fed rats while LBG fed rats had higher level of CA. Among the bile acids, only DCA and HDCA turned out to be higher in relative concentrations in the GLU fed rats as compared to the LBG group. Similarly, the level of αMCA was higher in the GLU group compared to the MBG group. A total of 7 out of 52 variables were found to be statistically significant in one-way ANOVA for the batch effect. These variables were in agreement with those responsible for the slight separation of the three different batches in the PCA analysis of the Xbatch as showed in the scores and loadings plots of ESI Fig. S4.† Such compounds did not include any of identified primary or secondary BAs.
4. Discussion
Both in humans and animal models, the health benefits of BG dietary fibre intake from oat and barley have been associated with their ability to reduce the plasma total cholesterol level and the risk of cardiovascular diseases.26,41 Structural characteristics of BGs such as MW, DP3/DP4 block ratio and β-(1→3)/β-(1→4) linkages ratio determine the functional properties such as solubility and rheology,42 and are often not sufficiently investigated in the studies that focus on health promoting effects of BG.43Indeed, few studies have been conducted to assess the correlation between the MW of BGs and their hypocholesterolaemic effects.6,24,25 Wilson and co-authors6 had observed that the hypochelesterolaemic effect was not affected by the MW. Furthermore, the analysis of the faecal sterol content showed that both high and reduced MW BGs led to an increased amount of total neutral sterols in the faeces of the rats while the cholesterol was higher in the rats fed with the low molecular weight BG. More recently, Wang and co-authors found that high molecular weight barley BG (1349 kDa) can change the gut microbiota of moderately hypercholesterolaemic individuals while the low molecular weight barley BG (288 kDa) cannot.44 Using a similar type cross-over trial, Thandapilly and co-authors have also reported that the consumption of higher molecular weight barley BG consumption leads to an increased production of SCFA and excretion of neutral sterols and secondary bile acids compared to the others BG groups.45 Moreover, a recent human intervention study, has confirmed that the cholesterol lowering effect of BGs is associated with BAs excretion.45 However, due to the complexity of the BGs, MW range of 288–1349 kDa, and different kinds of foods matrices employed in the study, it remains elusive to understand how molecular structures of BGs impact on their cholesterol lowering effects through increased excretion of BAs.
However, in order to develop a potential nutraceutical BG product, it is fundamental to not employ BG characterized by a MW higher that 500 kDa. For this reason, we considered worthwhile to analyse the faecal BA content of samples collected during Mikkelsen et al. study.
Concerning the amount of BG supplement employed in this study was based on recommendation from previous studies.46,47 The main goal from this intervention was not to determine the optimal proportion of BG in a diet optimal to improve health, but rather to reveal insights into yet unknown mechanisms and roles of structurally different BGs in BAs metabolism.
Our intervention showed that the presence of 6.5–7% of BG in the diets of hypercholesterolaemic rats increases bile acid and neutral sterols excretion compared to the group fed with a diet containing no barley supplement. This allowed us to assume that the normal intestinal absorption of BA48 has been partly hindered by the BG, as already reported in the literature.38
Multivariate and univariate data analysis proved that the main difference between the LBG and MBG groups was due to the secondary bile acids, DCA, LCA, and HDCA, and primary bile acids, αMCA and TβMCA, that were excreted more in the MBG-fed rats. In contrast, higher faecal levels of CA and CDCA characterized the LBG group. These selective and differential excretions of BAs as a function of structurally different BG intake have never been shown in in vivo studies and our findings help to understand the underlying mechanisms.
Based on the previous study38 one may hypothesize that barley LBG hinders the microbial conversion from primary to secondary BAs in the colon leading to an accumulation of the primary BAs. In particular, it is known that a bacterial enzyme, called 7α-dehydroxylase, removes the OH group attached at position C-7 of the steroid nucleus. Generally, the bacteria that are able to perform this alteration belong to the genera Eubacterium and Clostridium.49 An alteration in the bacterial population, due to a special diet or a disease for example, can lead to an altered BAs. Mikkelsen et al.25 did find some alterations in the caecal microbiota of the rats receiving the BG diets compared to the CON group, but within BG treatment it was only the numbers of Bacteroides/Prevotella that was significantly affected by the MBG compared with the GLU diet. At least this suggests that our results cannot be ascribed to changes in Bifidobacterium or Lactobacillus and we are aware that a more detailed characterization of the microbial composition would have been preferred to establish a potential relationship with the present BA results.
Another hypothesis could be linked to the differential BA conversion (from primary to secondary bile acids) as a function of BG intake. It is well known that BG intake increases the SCFA production in the gut50 and SCFA are known to lower the pH in the caecum.51 Berggren et al.52 showed a negative relationship between the total SCFA concentration in the caecum of rats and pH. Indeed, the 7α-deyhydroxylase, responsible for the BAs transformation, is inhibited when the pH decreases,51 and thus the amount of secondary bile acids produced is reduced. Accordingly, one may assume that the production of SCFA, after the BGs intestinal fermentation process, plays a key role in the levels of BAs excreted in the faeces. Mikkelsen et al.25 reported an elevated amount of the total SCFAs in the caecum of the MBG fed rats. Thus, it would be reasonable to have less secondary bile acids in the faecal samples of the MBG-fed rats than compared with the GLU and CON groups. In contrast, the MBG-fed rats showed higher levels of secondary BAs. These results suggest that a differentiation in the BA excretion most probably is not related to the upregulated SCFA synthesis and decreased pH in the colon.
We speculate that differential and selective excretion of BAs due to the intake of structurally different BGs may be associated with a “selective” entrapment of the BAs in the colon. This entrapment may occur in three different ways as reported by Gunness and Gidley1 and shown in Fig. 1. The first one considers the formation of a viscous barrier upon the enterocytes (Fig. 1(a)). Indeed, when dietary fibres, such as BGs, are ingested, and partially fermented in the intestine, this leads to the formation of a low viscosity water layer that covers the thick layer of hydrophilic mucus.53 The mucus and the fibre aqueous compartments can combine to produce a more dense layer that reduces reabsorption of secondary bile acids. Since secondary bile acids are more hydrophobic thus have greater affinity to the viscous barrier generated by MBG than the primary BAs.54
The second mechanism which may take place is based on the formation of the BG fibres’ net that is able to entrap the bile acids (Fig. 1b). However, this mechanism does not explain differential excretion of primary and secondary bile acids.
The third hypothesis accounts for a specific binding or complexation between the BGs and the bile acids (Fig. 1(c)). In this hypothetical frame, the hydrophobic cellulose junction zones of the hydrocolloidal BG network could have a high affinity to small hydrophobic molecules in an otherwise hydrophilic environment. Previous studies have shown that the hydrophobic side of cellulose-trimers and tetramers can interact with π-electron systems of aromatic molecules55 and thus with the hydrophobic surface of the bile acids. According to this hypothesis, the interaction between BG and the secondary bile acids is favoured because of the minor steric hindrance for the hydrophobic interaction compared to the primary bile acids.
Secondary BAs have been widely investigated for their role in cancer,56,57 and they are among the most common hydrophobic compounds that tend to accumulate in the distal colon and increase the risk of cancer onset. In particular, lithocholic acid is considered as a rare example of toxic endobiotics58 while deoxycholic acid was found to cause tumours in mice already back in 1939.59 Therefore, the levels of secondary BAs should preferably be minimized and the transit time of gut contents lowered in order to reduce the risk of onset of the carcinogenic process. Indeed, two out of three hypothesized interaction modes (Fig. 1a and c) of BAs may certainly help in flushing out these potential harmful molecules along with the faecal matter, thus having potential health benefits for the colonic epithelium.
In summary, our findings demonstrate that medium (530 kDa) and low (150 kDa) MW BG as well as the commercially available Glucagel (100 kDa) increase faecal BAs excretion in hypercholesterolaemic rats. Interestingly, a modulation of the primary and secondary bile acid excretion was observed to be dependent on the molecular structure of the BGs employed.
Considering the growing interest in developing new nutraceutical BG products, results of this study may have a high impact in developing BG-enriched diets, with a particular focus on the molecular structure features. Since increased concentrations of secondary BAs have been related to the early symptoms of colon cancer,56 potentially BG enriched foods may become a part of a diet preventing cancer. Findings from this study lays a strong foundation for the further investigations on; (1) the mode of the interaction between BAs and BGs in the intestine that requires a preparation of BGs where factors such as MW and block structures of the polysaccharides will not be confounded, (2) the influence of BGs on modulating the gut microbiota.
Conflicts of interest
The authors have declared no conflict of interest.Author contributions
S.B.E. conceived and designed the research; M.S.M., M.G.J. and T.S.N. designed the in vivo rat experiment and prepared the BG; T.S.N. performed the in vivo rat experiment; N.I. and B.K. performed the GC-MS experiments and analysed the data; N.I., B.K., S.B.E., and A.R. wrote the manuscript. All authors read and approved the final manuscript.Acknowledgements
This work was supported by the University of Copenhagen through the strategic elite-research area “Metabolomics and bioactive compounds”.References
- P. Gunness and M. J. Gidley, Food Funct., 2010, 1, 149–155 RSC.
- Fed. Regist., 20067198, 29248–29250 Search PubMed.
- J.-L. Yang, Y.-H. Kim, H.-S. Lee, M.-S. Lee and Y. K. Moon, J. Nutr. Sci. Vitaminol., 2003, 49, 381–387 CrossRef CAS PubMed.
- S. Kalra and S. Jood, J. Cereal Sci., 2000, 31, 141–145 CrossRef CAS.
- L. T. Tong, K. Zhong, L. Liu, X. Zhou, J. Qiu and S. Zhou, Food Chem., 2015, 169, 344–349 CrossRef CAS PubMed.
- T. A. Wilson, R. J. Nicolosi, B. Delaney, K. Chadwell, V. Moolchandani, T. Kotyla, S. Ponduru, G.-H. Zheng, R. Hess, N. Knutson, L. Curry, L. Kolberg, M. Goulson and K. Ostergren, J. Nutr., 2004, 134, 2617–2622 CrossRef CAS PubMed.
- B. Delaney, R. J. Nicolosi, T. A. Wilson, T. Carlson, S. Frazer, G.-H. Zheng, R. Hess, K. Ostergren, J. Haworth and N. Knutson, J. Nutr., 2003, 133, 468–475 CrossRef PubMed.
- K. M. Behall, D. J. Scholfield and J. Hallfrisch, Am. J. Clin. Nutr., 2004, 80, 1185–1193 CrossRef CAS PubMed.
- K. M. Behall, D. J. Scholfield and J. Hallfrisch, J. Am. Coll. Nutr., 2004, 23, 55–62 CrossRef CAS PubMed.
- J. M. Keenan, M. Goulson, T. Shamliyan, N. Knutson, L. Kolberg and L. Curry, Br. J. Nutr., 2007, 97, 1162–1168 CrossRef CAS PubMed.
- J. Li, T. Kaneko, L.-Q. Qin, J. Wang and Y. Wang, Nutrition, 2003, 19, 926–929 CrossRef CAS PubMed.
- M. Rondanelli, A. Opizzi, F. Monteferrario, C. Klersy, R. Cazzola and B. Cestaro, Eur. J. Clin. Nutr., 2011, 65, 864–871 CrossRef CAS PubMed.
- C. Shimizu, M. Kihara, S. Aoe, S. Araki, K. Ito, K. Hayashi, J. Watari, Y. Sakata and S. Ikegami, Plant Foods Hum. Nutr., 2008, 63, 21–25 CrossRef CAS PubMed.
- M. S. Mikkelsen, F. Savorani, M. A. Rasmussen, B. M. Jespersen, M. Kristensen and S. B. Engelsen, Food Res. Int., 2014, 63, 210–217 CrossRef CAS.
- J. T. Braaten, P. J. Wood, F. W. Scott, M. S. Wolynetz, M. K. Lowe, P. Bradley-White and M. W. Collins, Eur. J. Clin. Nutr., 1994, 48, 465–474 CAS.
- A. Lazaridou, C. Biliaderis, M. Micha-Screttas and B. Steele, Food Hydrocolloids, 2004, 18, 837–855 CrossRef CAS.
- N. J. Christensen, P. I. Hansen, F. H. Larsen, T. Folkerman, M. S. Motawia and S. B. Engelsen, Carbohydr. Res., 2010, 345, 474–486 CrossRef CAS PubMed.
- A. Lazaridou and C. G. Biliaderis, J. Cereal Sci., 2007, 46, 101–118 CrossRef CAS.
- P. J. Wood, J. Cereal Sci., 2007, 46, 230–238 CrossRef CAS.
- P. J. Wood, Trends Food Sci. Technol., 2004, 15, 313–320 CrossRef CAS.
- A. Lazaridou, C. G. Biliaderis, M. Micha-Screttas and B. R. Steele, Food Hydrocolloids, 2004, 18, 837–855 CrossRef CAS.
- H. Vaikousi, C. G. Biliaderis and M. S. Izydorczyk, J. Cereal Sci., 2004, 39, 119–137 CrossRef CAS.
- P. J. Wood, J. Weisz and B. A. Blackwell, Cereal Chem., 1991, 68, 31–39 CAS.
- T. Immerstrand, K. E. Andersson, C. Wange, A. Rascon, P. Hellstrand, M. Nyman, S. W. Cui, B. Bergenståhl, C. Trägårdh and R. Oste, Br. J. Nutr., 2010, 104, 364–373 CrossRef CAS PubMed.
- M. S. Mikkelsen, M. G. Jensen and T. S. Nielsen, Food Funct., 2017, 8, 4723–4732 RSC.
- E. Theuwissen and R. P. Mensink, Physiol. Behav., 2008, 94, 285–292 CrossRef CAS PubMed.
- J. Shepherd, C. J. Packard, S. Bicker, T. D. V. Lawrie and H. G. Morgan, N. Engl. J. Med., 1980, 302, 1219–1222 CrossRef CAS PubMed.
- H. Doll, in Seed Proteins: Biochemistry, Genetics, Nutritive Value, ed. W. Gottschalk and H. P. Müller, Springer Netherlands, Dordrecht, 1983, pp. 207–223 Search PubMed.
- M. S. Mikkelsen, B. M. Jespersen, F. H. Larsen, A. Blennow and S. B. Engelsen, Food Chem., 2013, 136, 130–138 CrossRef CAS PubMed.
- B. O. Eggum, A study of certain factors influencing protein utilization in rats and pigs, Copenhagen, 1973 Search PubMed.
- B. Khakimov, M. S. Motawia, S. Bak and S. B. Engelsen, Anal. Bioanal. Chem., 2013, 405, 9193–9205 CrossRef CAS PubMed.
- R. Bro, R. Bro, C. A. Andersson, C. A. Andersson, H. A. L. Kiers and H. A. L. Kiers, J. Chemom., 1999, 13, 295–309 CrossRef CAS.
- R. A. Harshman, UCLA Work. Pap. Phonetics, 1972, 22, 30–44 Search PubMed.
- B. Khakimov, J. M. Amigo, S. Bak and S. B. Engelsen, J. Chromatogr. A, 2012, 1266, 84–94 CrossRef CAS PubMed.
- L. W. Sumner, A. Amberg, D. Barrett, M. H. Beale, R. Beger, C. A. Daykin, T. W.-M. Fan, O. Fiehn, R. Goodacre, J. L. Griffin, T. Hankemeier, N. Hardy, J. Harnly, R. Higashi, J. Kopka, A. N. Lane, J. C. Lindon, P. Marriott, A. W. Nicholls, M. D. Reily, J. J. Thaden and M. R. Viant, Metabolomics, 2007, 3, 211–221 CrossRef CAS PubMed.
- H. Hotelling, J. Educ. Psychol., 1933, 24, 417–441 CrossRef.
- A. K. Smilde, J. J. Jansen, H. C. J. Hoefsloot, R.-J. A. N. Lamers, J. van der Greef and M. E. Timmerman, Bioinformatics, 2005, 21, 3043–3048 CrossRef CAS PubMed.
- G. Dongowski, M. Huth, E. Gebhardt and W. Flamme, J. Nutr., 2002, 132, 3704–3714 CrossRef CAS PubMed.
- L. Ellegård and H. Andersson, Eur. J. Clin. Nutr., 2007, 61, 938–945 CrossRef PubMed.
- E. Saccenti, H. C. J. Hoefsloot, A. K. Smilde, J. A. Westerhuis and M. M. W. B. Hendriks, Metabolomics, 2014, 10, 361–374 CrossRef CAS.
- A. Skendi, C. G. Biliaderis, A. Lazaridou and M. S. Izydorczyk, J. Cereal Sci., 2003, 38, 15–31 CrossRef CAS.
- M. S. Izydorczyk and J. E. Dexter, Food Res. Int., 2008, 41, 850–868 CrossRef CAS.
- H. V. T. Ho, J. L. Sievenpiper, A. Zurbau, S. B. Mejia, E. Jovanovski, F. Au-Yeung, A. L. Jenkins and V. Vuksan, Eur. J. Clin. Nutr., 2016, 1–7 Search PubMed.
- Y. Wang, N. P. Ames, H. M. Tun, S. M. Tosh, P. J. Jones and E. Khafipour, Front. Microbiol., 2016, 7, 1–15 CAS.
- S. J. Thandapilly, S. P. Ndou, Y. Wang, C. M. Nyachoti and N. P. Ames, Food Funct., 2018, 9, 3092–3096 RSC.
- H. N. Lærke, A. S. Meyer, K. V. Kaack and T. Larsen, Nutr. Res., 2007, 27, 152–160 CrossRef.
- K. E. Bach Knudsen, H. Jørgensen and N. Canibe, Br. J. Nutr., 2000, 84, 449–458 CrossRef CAS.
- A. F. Hofmann, News Physiol. Sci., 1999, 14, 24–29 CAS.
- J. M. Ridlon, D.-J. Kang and P. B. Hylemon, J. Lipid Res., 2006, 47, 241–259 CrossRef CAS PubMed.
- P. Gunness, B. M. Flanagan and M. J. Gidley, J. Cereal Sci., 2010, 52, 444–449 CrossRef CAS.
- I. Van Munster, Scand. J. Gastroenterol. Search PubMed.
- A. M. Berggren, I. M. E. Björck, E. M. G. L. Nyman and B. O. Eggum, J. Sci. Food Agric., 1993, 63, 397–406 CrossRef CAS.
- M. F. Chaplin, Proc. Nutr. Soc., 2003, 62, 223–227 CrossRef CAS PubMed.
- C. M. Payne, C. Bernstein, K. Dvorak and H. Bernstein, Clin. Exp. Gastroenterol., 2008, 1, 19–47 CrossRef CAS PubMed.
- H. T. Simonsen, M. S. Nielsen, N. J. Christensen, U. Christensen, T. V. La Cour, M. S. Motawia, B. P. M. Jespersen, S. B. Engelsen and B. L. Møller, J. Agric. Food Chem., 2009, 57, 2056–2064 CrossRef CAS PubMed.
- H. Ajouz, D. Mukherji and A. Shamseddine, World J. Surg. Oncol., 2014, 12, 164 CrossRef PubMed.
- C. Bernstein, H. Holubec, A. K. Bhattacharyya, H. Nguyen, C. M. Payne, B. Zaitlin and H. Bernstein, Arch. Toxicol., 2011, 85, 863–871 CrossRef CAS PubMed.
- A. F. Hofmann, Drug Metab. Rev., 2004, 36, 703–722 CrossRef CAS PubMed.
- J. W. Cook, E. L. Kennaway and N. M. Kennaway, Nature, 1940, 145, 627–627 CrossRef CAS.
Footnote |
| † Electronic supplementary information (ESI) available. See DOI: 10.1039/c8fo02507j |
| This journal is © The Royal Society of Chemistry 2020 |