
 Open Access Article
 This Open Access Article is licensed under a Creative Commons Attribution-Non Commercial 3.0 Unported Licence
Interaction of silver nanoparticles with antioxidant enzymes†
Wei
Liu
 *,
Isabelle
Worms
and
Vera I.
Slaveykova
*,
Isabelle
Worms
and
Vera I.
Slaveykova
Faculty of Sciences, Earth and Environment Sciences, Department F.-A. Forel for Environmental and Aquatic Sciences, University of Geneva, Uni Carl Vogt, 66 Blvd Carl-Vogt, CH 1211 Geneva, Switzerland. E-mail: wei.liu@unige.ch
First published on 19th March 2020
Abstract
Oxidative stress is accepted as a key mechanism of silver nanoparticle (AgNP) toxicity in living organisms. Therefore, mechanistic studies related to the impact of AgNPs on the structure and function of antioxidant enzymes at the molecular level are essential for a comprehensive evaluation of their toxicity. By using a combination of spectroscopic, imaging and fractionation techniques, we explored the interactions between citrate-coated AgNPs (20 nm) and two key antioxidant enzymes: catalase (CAT) and superoxide dismutase (SOD). Both enzymes interacted with AgNPs by forming surface complexes. Only CAT was able to promote AgNP dissolution, without the impact of the released Ag ions on its heme cofactor. Instead, our results suggest that the formation of the AgNP–CAT complex induced conformation changes in the CAT, which resulted in an impairment of its enzymatic activity together with Ag(I) adsorption. By contrast, the formation of the AgNP–SOD complex has only a marginal influence on the protein conformation and has no impact on its metallic cofactors, and thus its enzymatic activity. Overall, the results showed that the changes in the protein conformation and the dissolution of AgNPs depended on the protein structure and could result in different degrees of enzymatic activity modulation.
Environmental significanceExcessive production of reactive oxygen species in cells by direct interaction with particles and/or dissolved species is currently accepted as one of the main mechanisms of cellular toxicity of engineered nanoparticles. Therefore, studies related to the impact of silver nanoparticles (AgNPs) on the structure and function of antioxidant enzymes at the molecular level are crucial for a comprehensive evaluation of their toxicity. This study suggests that the conformation changes of two key antioxidant enzymes, catalase and superoxide dismutase, and the dissolution of AgNPs depended on the protein structure and could result in different degrees of enzymatic activity modulation. This research provides a basis to understand how the functional properties of the key antioxidant enzymes may affect the stability of nanoparticles in a biological context and give insights into the role of these enzymes in the mechanism of NP-induced redox stress in vivo. |
Introduction
Given the widespread use of silver nanoparticles (AgNPs), risk assessment of these nanoparticles is of great importance. Numerous studies have demonstrated the potency of AgNPs to induce deleterious biological and cellular effects.1 The toxicity of AgNPs was shown to be a result of an interplay of the particle uptake, dissolution and induction of oxidative stress.2 Indeed, excessive production of reactive oxygen species (ROS) in cells by direct interaction with particles and/or dissolved species is currently accepted as one of the main mechanisms of cellular toxicity of engineered nanoparticles.1,3–5ROS have many signaling and information functions; however, excessive ROS can collapse the antioxidant defense system, leading to the damage of DNAs, lipids and proteins.5,6 Antioxidant enzymes have been recognized as important modulators in AgNP induced oxidative stress. Two of them, catalase (CAT) and superoxide dismutase (SOD), are prominent for maintaining the level of ROS in organisms and are used as bioindicators of increased ROS production.7 Previous research demonstrated that AgNPs induce oxidative stress by altering the activity of both enzymes in in vivo and in vitro assays. For example, the activities of SOD and CAT were upregulated when Drosophila melanogaster was exposed to 10 nm AgNPs in vivo.8 Exposure to AgNPs resulted in inhibition9,10 or activation11,12 of SOD and CAT activities in different aquatic organisms. Studies on the aquatic plant Spirodela polyrhiza reported that the activity of SOD displayed a dose-dependent increase, but the activity of CAT was not affected by exposure to AgNPs (6 and 20 nm).13 It is currently accepted that the alteration of the enzyme activity might be due to either regulation of genes or to direct surface interaction of the enzymes with AgNPs.1 In the latter case, the underlying molecular mechanisms, and how the interaction of AgNPs with CAT or SOD can possibly be responsible for redox state disruption, are not fully elucidated.14
The molecular mechanisms of the interaction between enzymes and nanoparticles were also explored in a number of in vitro studies.15–19 For example, TiO2NPs directly bound to SOD from rat erythrocytes, and altered its secondary structure.15 TiO2NPs interacted with bovine liver catalase via electrostatic and hydrogen bonding forces and this decreased its enzymatic activity.16 The binding of SiO2NPs to CAT led to changes in its tertiary structure and stimulated its activity.18 A recent report on red blood cells showed that AgNPs interacted with CAT or SOD and promoted the activities of the two proteins.19
Our previous work demonstrated that the stability of AgNPs can be affected by the structure of proteins, leading to different degrees of dissolution.20 In addition, we have shown that Ag(I) released from AgNPs can substitute the metallic cofactor of ceruloplasmin, leading to a decrease in its ferroxidase activity.20 The link between AgNP stability and enzymatic activity was also reported in other studies.21–23 Motivated by these outputs, we focused on CAT and SOD due to their differences in the tertiary structure, tetramer vs. dimer, and the nature of their native metallic cofactors. CAT is a globular protein of 250 kDa comprised of 4 subunits, and each monomer contains an Fe-heme center.24 SOD has a molecular weight of 32.5 kDa and is composed of two subunits. Each monomer has one intrachain disulfide and one free sulfhydryl, one Cu atom and one Zn atom.24 Thus, the overall goal of the present study is to better understand the mechanisms involved in enzymatic activity changes of CAT and SOD induced by AgNPs, taking into account: (i) the impact of the proteins on AgNP stability and (ii) the protein conformation changes and metallic cofactor stability in the presence of AgNPs.
Experimental
Silver nanoparticles and proteins
BioPure, 20 nm citrate-coated spherical AgNPs, provided at 1.01 mg Ag per mL (2 × 10¹³ NP per mL) in 2 mM citrate was purchased from Nanocomposix Eu. CAT from bovine liver (EC 1.11.1.6) and SOD from bovine erythrocytes (EC 1.15.1.1) in lyophilized forms and silver nitrate (AgNO3) were purchased from Sigma-Aldrich. The concentration of CAT was determined after resuspension in 10 mM HEPES (4-(2-hydroxyethyl)-1-piperazineethanesulfonic acid) buffer using its absorbance at 280 nm, with ε = 246![[thin space (1/6-em)]](https://www.rsc.org/images/entities/char_2009.gif) 000 cm−1 M−1.25 The concentration of the SOD solution was determined by measuring the Cu and Zn contents of the protein suspension in 10 mM HEPES (pH = 7.0) using an inductively coupled plasma spectrometer (Agilent, 7700x ICP-MS).
000 cm−1 M−1.25 The concentration of the SOD solution was determined by measuring the Cu and Zn contents of the protein suspension in 10 mM HEPES (pH = 7.0) using an inductively coupled plasma spectrometer (Agilent, 7700x ICP-MS).
Preparation of AgNP suspensions and AgNP–protein mixtures
The preparation and the storage conditions of AgNP suspensions were presented in detail in our previous study.20 Briefly, a mixture of 10 mM HEPES and 2 mM sodium citrate buffer (pH 7.4), denoted HEPES–citrate, was selected for maintaining both the stability and the monodispersity of AgNPs.26 The AgNP suspensions were vortexed for 45 s before use. The incubation of AgNPs with proteins (200 μL) was performed in the dark under controlled mixing at 300 rpm and a temperature of 25 °C (Comfort® Thermomixer, Eppendorf), in 1.5 mL polypropylene tubes.Polydispersity and hydrodynamic diameter determination by dynamic light scattering (DLS)
DLS was used to determine the Z-average hydrodynamic diameters, distributions and polydispersity of the AgNP suspensions in the absence and presence of proteins using a NanoZS (Malvern Instruments Inc., UK). For the AgNP–CAT interaction study experiments, the concentrations were 20 μM and 2 μM, respectively. For the AgNP–SOD interaction studies, the concentrations were 20 μM and 5 μM, respectively.UV-visible spectroscopy
UV-visible absorbance spectra were recorded with a PerkinElmer UV/visible spectrophotometer Lambda 365 at room temperature. The surface plasmon resonance (SPR) peak of the AgNPs was observed from 200 to 800 nm. The interactions of AgNP–protein were studied in mixtures containing 20 μM AgNPs with 2 μM CAT and 5 μM SOD, respectively.Asymmetric flow field-flow fractionation system linked to a diode array detector and inductively coupled plasma mass spectrometer
Changes in the hydrodynamic size distribution of the proteins and AgNPs and the quantification of the different metallic species (protein metallic contents and AgNPs) were measured with an asymmetrical flow field-flow fractionation system (AF4, AF2000 Focus, Postnova Analytics, Landsberg, Germany) coupled on-line to a diode array detector (DAD, Postnova Analytics) and an inductively coupled plasma mass spectrometer (ICP-MS, Agilent, 7700x, Basel, Switzerland). Details on the set-up and the procedures are provided in the ESI.† Hydrodynamic diameters (dh) were evaluated using external calibration of the retention time (tr) obtained with the DAD at maximum peak absorbance of the individual injections of SOD and CAT and of two ultra-uniforms gold nanoparticles (UUGNPs, Nanocomposix UE), for which the hydrodynamic diameters were obtained from the literature (dhSOD = 5.2 nm;27dhCAT = 13 nm (ref. 28)) or the certificates of analysis given by the manufacturer (dhUUGNPs10 = 19 nm and dhUUGNPs30 = 39 nm). The hydrodynamic diameters were directly related to retention time (tr) by a linear relationship (dh = 3.9 × tr − 0.26; r2 = 0.99).Metal signals in counts per second were transformed into parts per billion using external calibration in spectrum mode of the ICP-MS, and retention times were converted to retention volume. Then, the quantification of each metallic species was carried out by peak integration after baseline correction using OriginPro®2019 software (OriginLab©, see Fig. S1†). The percentage of dissolved Ag was determined by subtraction of the quantities of remaining Ag from total silver injected.
Fluorescence spectroscopy
Fluorescence spectroscopy measurements were performed on a spectrofluorometer (PerkinElmer Model F-4500) equipped with a 150 W xenon lamp and a slit width of 5 nm. A 1 cm quartz cell was used for these studies. The fluorescence spectra of CAT and SOD treated with AgNPs or AgNO3 were recorded directly after mixing in the range from 280 to 400 nm upon excitation at 280 nm. The fluorescence intensities (I) were determined at the λemmax emission, and the results were compared with the initial fluorescence intensity of the individual proteins (I0). The data were plotted using the Stern–Volmer representation: I0/I = ƒ[NPs].Circular dichroism (CD) analysis
CD spectra were recorded on a J-810 spectropolarimeter (Jasco® France, Lisses) equipped with a thermostatically controlled cell holder. An average of three scans at far UV from 200 to 440 nm were recorded at 25 °C using a 1 mm cell. The CAT and SOD concentrations were kept constant at 1 and 9 μM, respectively. The AgNP concentrations were varied from 1 to 36 μM. The AgNO3 concentrations corresponding with the dissolved fraction of AgNPs were determined by AF4–ICP-MS. The resulting CD spectra were corrected with the corresponding controls, normalized on the basis of the protein concentration and expressed in Δε (M−1 cm−1).Transmission electron microscopy (TEM)
The size and morphology of the AgNP suspension and AgNP–protein systems were studied at several time points by TEM (FEI Tecnai™ G2 Sphera, FEI Company, USA) operating at 200 kV. For the AgNP system, a carbon coated copper grid was immersed into the solution for 10 s and then dried at room temperature. The different series of images were analysed by using the ImageJ software (Media Cybernetics, Bethesda, MD, USA) to estimate the size distributions of AgNPs.Enzyme activity assay
The CAT activity was measured by using an Amplex® red catalase assay kit (Molecular Probes Inc.). An Amplex Red (AR) reagent is a colorless substrate that reacts with H2O2 with a 1:1 stoichiometry in the presence of horseradish peroxidase (HRP) to produce highly fluorescent resorufin (excitation/emission maxima ∼λ = 540/590 nm).29 Therefore, since the catalase activity increased, the signal from the AR product decreased. The formation of resorufin was followed for up to 24 h.
SOD activity was determined using a sensitive SOD assay kit (Invitrogen; Thermo Fisher Scientific, Inc.) that utilizes the product of water-soluble formazan dye upon reduction with superoxide anion SOD with absorbance at 450 nm according to the manufacturer's instructions. The fluorescence or absorbance of the samples was measured in a 96-well microplate reader with a total volume of 100 μL (Synergy H1, Biotek®, USA) using the Gen5 software.
Results and discussion
Evidence for AgNP–protein interactions
The SPR changes of AgNPs is a well-known sensitive indicator of the binding reaction with biomolecules.20,30,31 The changes in the SPR band characteristics of AgNPs upon interaction with the two proteins were thus monitored at two different time points t0 (t0 refers to the shortest time enabling a measurement just after the mixing) and 24 h. AgNP spectra had a characteristic and intense SPR band at 398 nm (Fig. 1). Addition of CAT resulted in a decrease of the AgNP SPR peak absorbance and a shift of the wavelength corresponding to the peak maximum from 395 nm to 405 nm, reflecting the formation of AgNP–CAT complexes (Fig. 1A). After 24 h, the intensity of the SPR peak absorbance of AgNPs further decreased from 0.40 to 0.22 a.u. suggesting CAT-induced AgNP dissolution. The SPR band evolved differently when the AgNPs were mixed with SOD (Fig. 1B), since the band at 398 nm shifted towards 405 nm and remained constant after 24 h with only a slight SPR peak height decrease.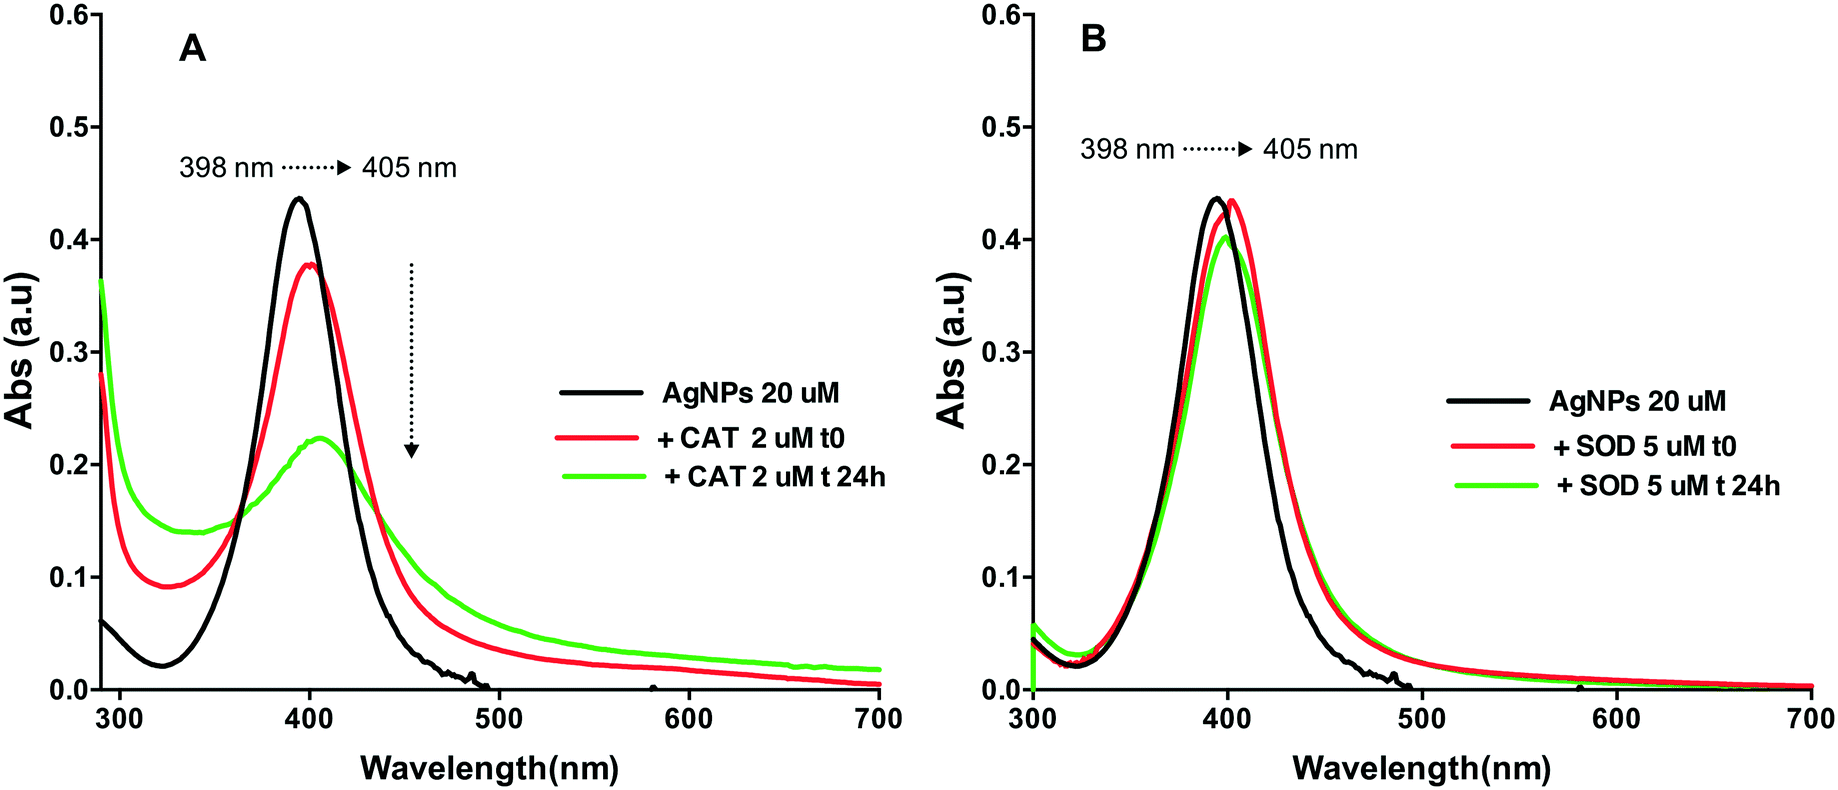 | ||
| Fig. 1 UV-visible spectra of AgNPs with and without proteins, versus time. A: 20 μM AgNPs (black) and AgNP–CAT mixture (2 μM CAT) at t0 (red) and 24 h (green); B: 20 μM AgNPs (black) and AgNP–SOD mixture (5 μM SOD) at t0 (red) and 24 h (green). | ||
DLS measurements showed that the AgNP suspensions in HEPES–citrate buffer were monodispersed with an average hydrodynamic diameter (dh) of 24 nm (Fig. 2). The average hydrodynamic diameters of CAT and SOD were 10 ± 1 nm and 5 ± 0.5 nm, respectively. When AgNPs were mixed with CAT, species with dh = 43 ± 5 nm were formed, showing the formation of AgNP–CAT complexes. With a longer incubation time, the dh of the AgNP–CAT mixture shifted to lower values (dh = 33 ± 4 nm) with a decrease of volume percentage from 15% to 10%. Mixing SOD and AgNPs resulted in the formation of AgNP–SOD complexes with a hydrodynamic size of 29 ± 3 nm. After 24 h, the hydrodynamic diameter distribution remained unchanged, demonstrating the stability of the AgNP–SOD complexes. Overall, DLS and SPR measurements revealed that AgNPs interacted with both the proteins and formed AgNP–protein complexes. However, these complexes evolved differently during 24 h, probably because of the interplay between the possible dissolution for AgNP–CAT versus the stabilisation of the AgNP–SOD complexes.
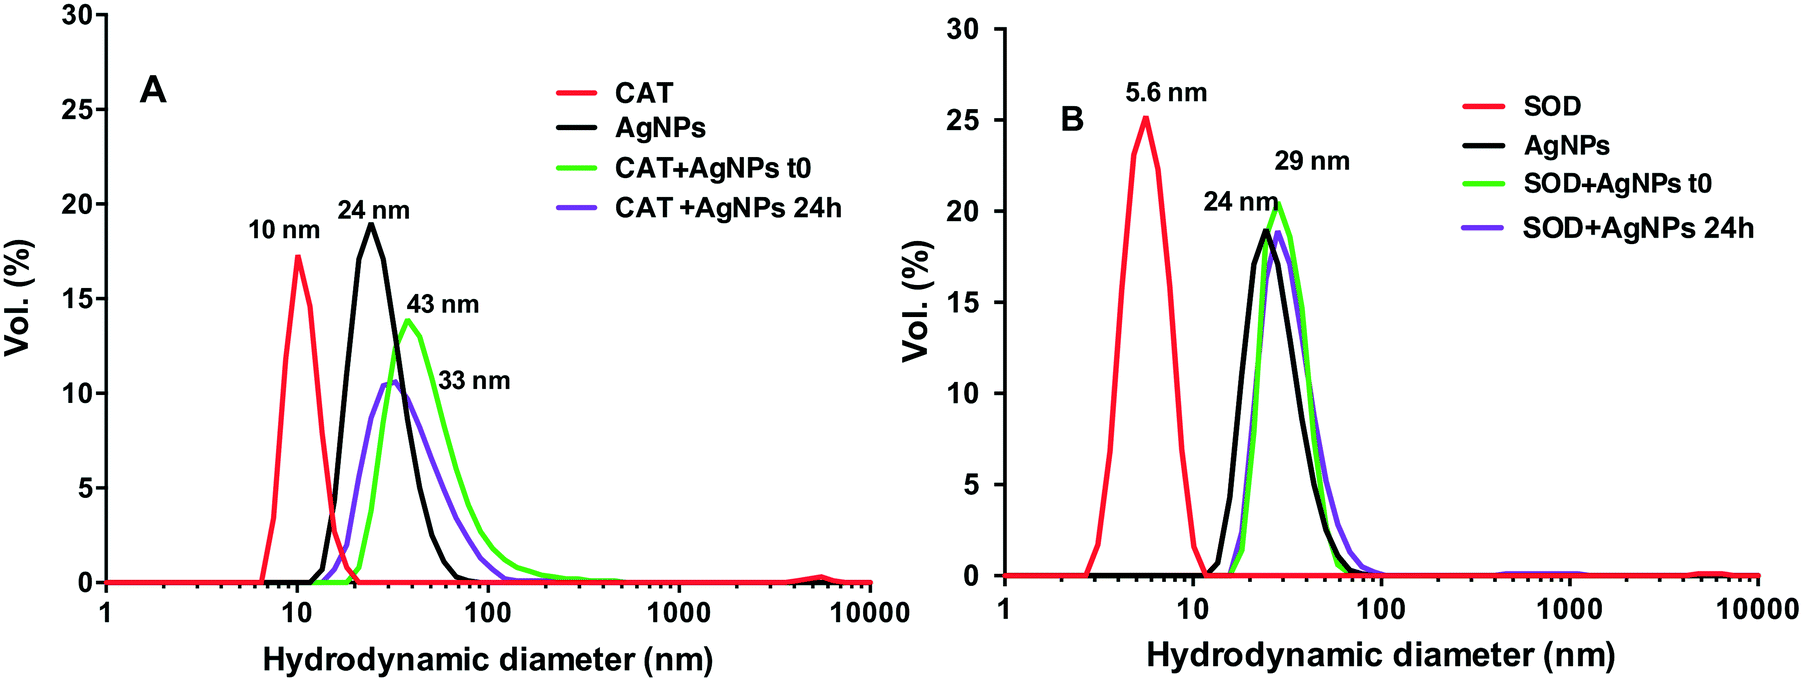 | ||
| Fig. 2 Hydrodynamic diameter distribution (in % volume) in various suspensions; AgNPs (black), proteins (red) and AgNP–protein mixtures at different time-points, t0 (green), and 24 h (purple). (A): 20 μM AgNPs and/or 2 μM CAT; (B): 20 μM AgNPs and/or 5 μM SOD. | ||
To further highlight the changes in the primary size of the AgNPs and in the nature of the formed AgNP–protein complexes, the AgNP–protein mixtures were analysed by TEM. TEM images of the AgNPs in the absence of proteins showed similar size distributions at t0 and 24 h, with average primary diameters of 20.5 ± 4 nm and 19.5 ± 4 nm, respectively (Fig. 3). In contrast, the TEM images of the mixture of AgNPs and the proteins evolved differently over 24 h. No noticeable modification of their primary size was observed for CAT and SOD at the beginning of the interaction (t0) (Fig. 3D and G). After 24 h, TEM analysis of the AgNP–CAT mixture (Fig. 3E) revealed that some of the particles had their average diameter reduced (11.5 ± 3 nm), including some particles below 5 nm. The size decrease of the AgNPs and the shift of the size distribution towards lower values in the presence of CAT probably resulted from the nanoparticle dissolution, leading to the release of Ag(I). Moreover, the wider size distribution of the AgNPs (from 2 to 21 nm) after 24 h indicated that the dissolution of NPs in the presence of CAT was heterogeneous. As observed from the TEM pictures, the AgNPs appeared with a bright halo that can be assimilated to the formation of a shell-like homogenous corona made of CAT around AgNPs (Fig. 3E). This structure seems sufficiently stable to be able to dissolve the AgNP core, leading to residual smaller sized particles. In the mixture of AgNPs and SOD (Fig. 3G–I), the histogram distributions overlapped with time reflecting the stability of the AgNPs even in the presence of SOD. These observations are in agreement with the DLS and SPR results (Fig. 1 and 2), indicating that CAT promoted AgNP dissolution, whereas SOD interacted with the AgNPs without affecting their colloidal stability.
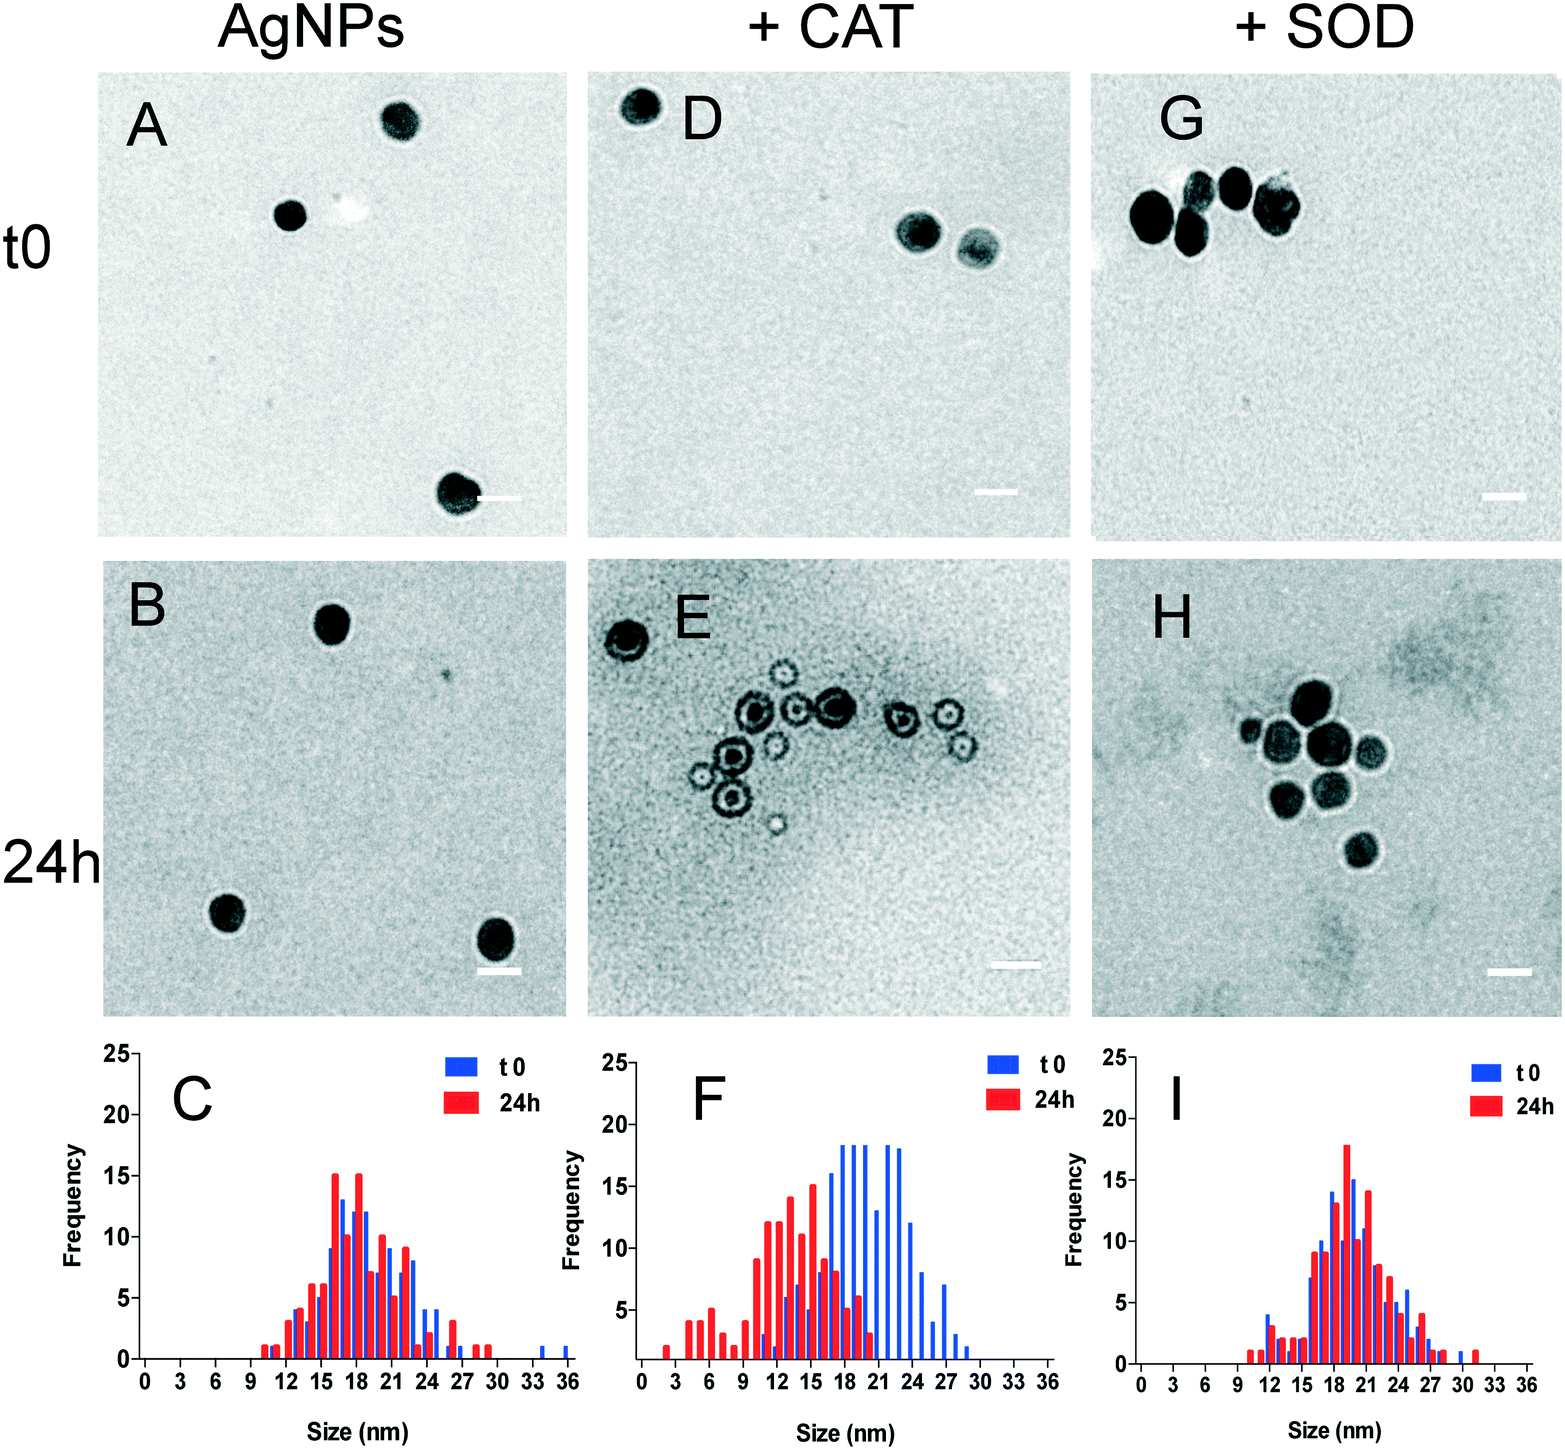 | ||
| Fig. 3 TEM images of 20 μM AgNPs in various suspensions and at different time points (t0 or 24 h) (A and B) and (C): size distribution analysis of the TEM images of the samples presented in (A and B); 20 μM AgNPs and 2 μM CAT (D and E) and (F): size distribution analysis of the images of the samples presented in (D and E); 20 μM AgNPs and 5 μM SOD (G and H) and (I): size distribution analysis of the images of the samples presented in (G and H). For each condition, at least 100 particles were counted. The white bar shows the distance of 20 nm. | ||
Species-specific metallic content
The fractogram of the mixture containing AgNPs and CAT for 2 hours (Fig. 4A) showed two size-populations, the first one has a hydrodynamic diameter of 10.5 nm, corresponding to CAT and the second one having a hydrodynamic diameter of 57 nm that could correspond to the AgNP–CAT complexes. Similarly, two populations, having average hydrodynamic diameters of 6 nm and 35 nm that could correspond to SOD and AgNP–SOD complexes, respectively, were observed in the mixture of AgNPs and SOD (Fig. 4B). These observations are further confirmed by the co-elution of the main peaks obtained for silver by ICP-MS at a diameter of 53 nm in the case of the CAT mixture (Fig. 4C) and 30 nm for SOD (Fig. 4D). In addition, the co-elution of the iron ICP-MS signals at 11.5 nm for CAT (Fig. 4E) and that of the Cu and Zn signals at 6 nm for SOD (Fig. 4F) with DAD signals were obtained. | ||
| Fig. 4 Hydrodynamic diameter distributions of AgNP–CAT and AgNP–SOD complexes obtained by AF4–DAD–ICP-MS. DAD signals are tuned at λ = 405 nm for CAT and AgNP (A), λ = 220 nm for SOD and λ = 405 nm for AgNPs (B). AF4–ICP-MS silver signals (C and D), iron signals (E), and copper and zinc signals (F) for various suspensions; proteins (red) and AgNP–protein mixtures at different time-points, t = 2 h (green) and 24 h (purple). (A, C and E): 5 μM CAT with or without 35 μM AgNPs; (B, D and F): 6.5 μM SOD with or without 20 μM AgNPs. | ||
The recovery of silver, expressed as a ratio of the total amount of injected Ag to the Ag measured after elution by AF4–ICP-MS after 2 h of incubation with CAT, was 95%. A percentage of 72% of the total Ag could be attributed to the AgNPs, while the presence of other Ag species with hydrodynamic diameters of below <25 nm accounted for 13% of the total Ag amount, meaning that 28% of the AgNPs had dissolved (Fig. S1A†). After 24 h of incubation, a rather broad and a polydisperse size distribution of Ag-containing species was observed with a noticeable decrease in the recovery (57%) and with a shift in the size distribution to a smaller size (dh = 50 nm) of the AgNP–CAT complexes (Fig. 4C), and co-eluted with the DAD signal at λ = 405 nm (dh = 53 nm, Fig. 4A), meaning that 43% of the AgNPs were dissolved (Fig. S1B†). These results agreed well with the results of DLS, showing a decrease in the hydrodynamic size of the AgNPs after 24 h of incubation, together with a decrease in the effective diameters of the AgNP–CAT complexes and a rather high proportion of components around 6 nm as observed using TEM. The polydispersity of the AgNP size observed was certainly due to the difference in the dissolution rate between small and large nanoparticles within the population.32
It remained unclear, however, what could be the behaviour of the CAT–shell revealed by TEM after the nearly complete dissolution of the AgNP cores. The UV-visible spectra (Fig. S2†) obtained for the species with dh = 10.5 nm clearly indicated the presence of CAT, with a marked Soret transition band characteristic of the heme cofactor that does not change in intensity while in contact with the AgNPs for 24 h. This is in close agreement with the iron content of the soluble catalase (11.5 nm) that remained relatively homogeneous during the experiments. These results suggested that the heme cofactors were well-stabilized within the protein structure.
For the species of 53 nm, the characteristic SPR band of the AgNPs was present (Fig. S2†) but for those of 25 nm, only the absorption band at 280 nm was present, indicating the presence of proteins. It could be suggested that core–shell AgNPs–CAT of small size or aggregated CAT, for whom either the SPR or the Soret adsorption intensity were below the detection limit of the DAD, were present and able to account for a non-negligible proportion of Ag (12%). The recovery of Ag after 24 h of incubation was 75%, also suggesting the formation of lower than 1 kDa species, likely present as citrate complexes.
When the AgNPs were mixed with SOD, the recovery of Ag was 85% and the AgNP–SOD complexes accounted for 78% of the total amount of injected silver. These values did not change with incubation time, and no differences in size distribution based on SPR or in Ag elution fractograms for the AgNP–SOD complexes were observable (Fig. 4B and D). In addition, our results showed that the metallic stoichiometry of the protein was Cu2Zn2–SOD and remained unchanged within the time of the experiments in the presence or the absence of AgNPs.
Overall, our results show that both CAT and SOD formed a stable and homogenous corona around AgNPs, leading to well-suspended Ag species. The promotion of AgNP dissolution by CAT was confirmed by the decreased Ag recovery and the increased polydispersity of the Ag species over time. However, no effect of AgNP dissolution was observed on the heme cofactor inside the CAT and in the case of SOD, no metallic exchange in the active site of the enzyme was observed. Recent studies revealed that electronic transfer from the surface of AgNPs to dissolved Fe(III) leads to the production of reduced Fe(II) and the oxidative dissolution of the nanoparticles.33 It could be suggested that, while adsorbed at the nanoparticle surface, CAT is oriented in a favourable manner that allowed electronic transfer to the heme cofactor from silver atoms on the surface, leading to AgNP dissolution. In the case of copper protein, the redox interaction between AgNPs and Cu(II) cofactors have been previously reported.23 It could be suggested that, while SOD is adsorbed at the AgNP surface, its active site was not in a favourable position for electronic transfer to occur.
Effect of AgNPs on enzyme conformations
UV CD spectroscopy measurements were thus performed to gain a better understanding of the influence of AgNPs on possible conformational changes of CAT and SOD. The far-UV spectra of CAT show two main negative bands at about 209 nm and 220 nm, which are characteristic of the α-helical secondary structure of proteins.34 In the presence of AgNPs, the intensity of these bands increased over time of interaction (Fig. 5A). The contents of the four secondary structures of CAT are listed in Table S1.† They suggest that the secondary structure of CAT was changed. These results highlighted the fact that AgNP–CAT interactions exist and modify the secondary structural elements of CAT.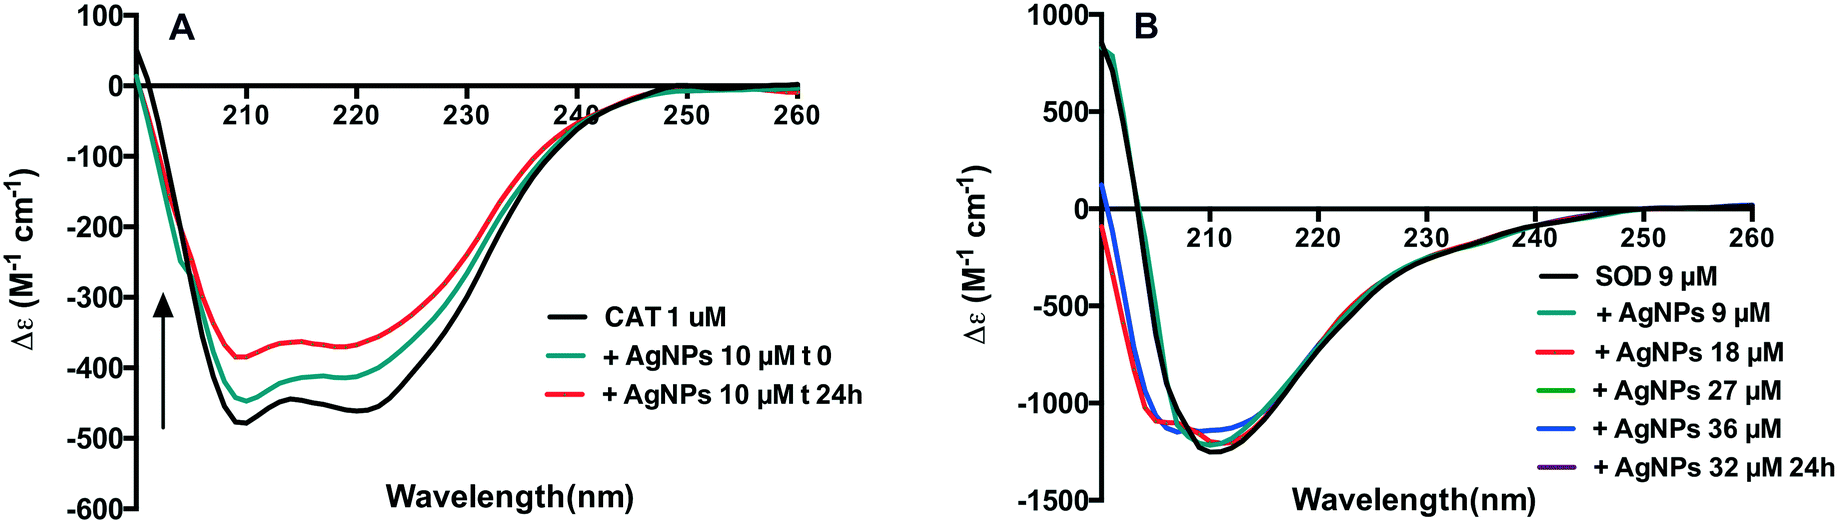 | ||
| Fig. 5 CD spectral evolutions of CAT (A) and SOD (B) expressed in δε (M−1 cm−1) after contact with different concentrations of AgNPs. The concentration of the CAT was fixed at 1 μM with 10 μM AgNPs at the beginning and 24 h incubation. The SOD was fixed at 9 μM with an increase of the AgNPs concentration from 9 to 36 μM. | ||
The secondary molecular structure of SOD is mainly composed of β-sheets,35 with the minimum signal intensity at 211 nm. This pattern was conserved upon addition of AgNPs at different ratios of SOD to AgNPs (Fig. 5B) even after 24 h incubation (data not shown). However, upon exposure to 18 to 36 μM AgNPs, the appearance of negative signals at ∼207 nm indicates that the helical conformation may be weakly populated. The analysis of the secondary structures of SOD showed that the content of α-helix decreased and the content of β-helix increased in this concentration range (Table S1†). These results indicated that AgNPs led to slight changes in the SOD secondary structure.
Fluorescence spectroscopy is typically used as a sensitive method to determine the interaction modes between a protein and ligand, including accessibility and quenching mechanism of fluorophores.36 The effect of AgNPs on the fluorescence spectra of both proteins was explored (Fig. 6). CAT has four polypeptide chains, containing twenty Tyr and six Trp residues.37 Since Trp and Tyr residues in a protein are common fluorophores, their intrinsic fluorescence emission could give information to evaluate the binding interactions and the changes in the tertiary structure of CAT induced by AgNPs. In addition, the changes of the maximum fluorescence emission peak depended on the exposed environment of Trp and Tyr residues in CAT.34 Upon the gradual addition of AgNPs, the fluorescence emission of CAT was quenched as presented by the progressive reduction of the fluorescence intensity at 333 nm and a red shift from 333 to 335 nm (Fig. 6A). This result indicates that CAT could bind to the surface of AgNPs and this phenomenon alter the tertiary structure of CAT.16 The red shift could indicate that CAT unfolded and that the fluorophores were exposed to the aqueous phase.38 To gain a better understanding of the quenching mechanism, fluorescence intensity data were analysed according to the standard Stern–Volmer equation. The quenching data are presented as insets in Fig. 6A and are characterized by two linear regions with different slopes. The first one was attributed to the specific interaction leading to predominant static quenching and in this process, the AgNP–CAT complex was formed and prevented the fluorescence emission, while the second slope could be due to the dynamic quenching and/or light scattering promoted by the AgNPs.39 The AgNP binding process induced the CAT conformation changes, as it was suggested by CD spectroscopy.
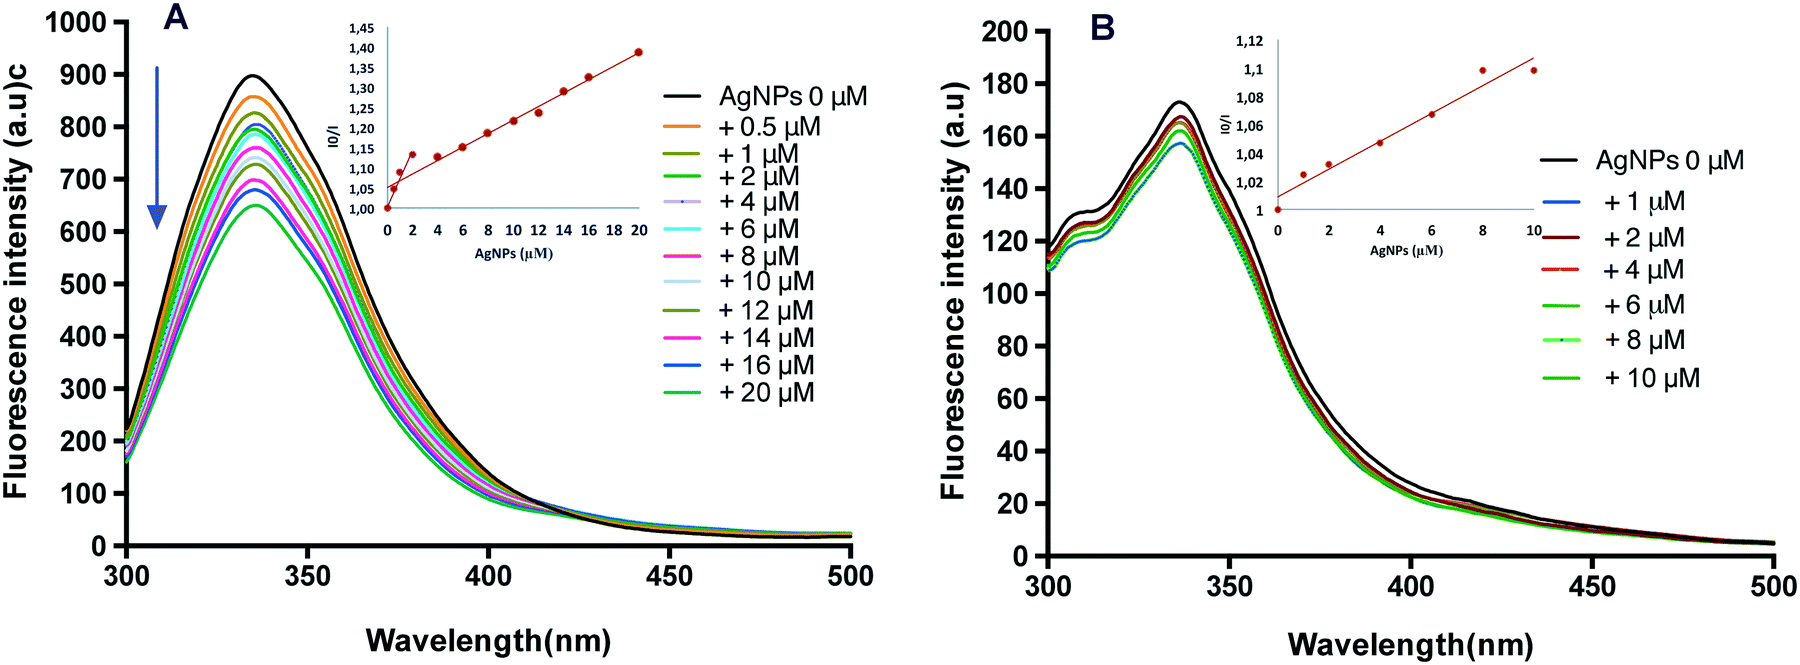 | ||
| Fig. 6 Evolutions of fluorescence spectra of CAT (A) and SOD (B) with increasing concentration of AgNPs. The concentration of the CAT and SOD was fixed at 2 μM and the emission spectrum of the AgNPs alone was negligible at an excitation wavelength of 280 nm. Inserts: I0/I varied linearly over NP addition, and could be expressed as 1 + kSV [NPs], where kSV is the Stern–Volmer constant. | ||
The fluorescence intensity of SOD decreased slightly upon addition of AgNPs and did not change when the AgNP concentration was above 8 μM, as illustrated in Fig. 6B. The fluorescence of SOD was gently quenched by AgNP addition. The SOD contains a single tyrosine residue (no tryptophan) per subunit40 and in the native state of SOD, fluorophores must be located far away from the binding position. Moreover, the standard Stern–Volmer plot (inset in Fig. 6B) showed a straight line, indicating that the quenching was dominated by static quenching. This result suggests that complexes are formed between SOD and AgNPs, but the tertiary structure of the enzyme was only marginally affected by this interaction.
These results led to the conclusion that complexes are formed between the AgNPs and enzymes, and the AgNP binding process causes conformational changes in CAT and SOD, as suggested by UV-vis absorption and CD spectroscopy, and resulted in the accessibility of initially shielded fluorescent residues for AgNPs. The structural changes in the enzymes can lead to a loss of their biological function because there is a significant correlation between folding and functional specificity.41
Influence of AgNPs on enzyme activities
AgNPs considerably inhibited the enzymatic activity of CAT (Fig. 7A) with 17% reduction in comparison with free CAT during 3 h incubation. A significant time effect was observed with a decrease of the activity of CAT to 60.8 ± 3.3% from the initial level after 24 h. The above observation is consistent with the existing literature showing that CAT activity decreases after interacting with TiO2NPs,16 magnetic nanoparticles,42 or AuNPs.43,44 Indeed, changes in the CAT structure could be responsible for the initial changes in the activity we observed. However, they contrast with the findings that the activity of CAT was unchanged44 or increased in AgNP treatments.19,45 It is worth noting that under our working conditions (excess of protein over AgNPs), the majority of CAT molecules were not bound to the AgNPs (free CAT) and were shown to bind to Ag(I), as evidenced by AF4–ICP-MS.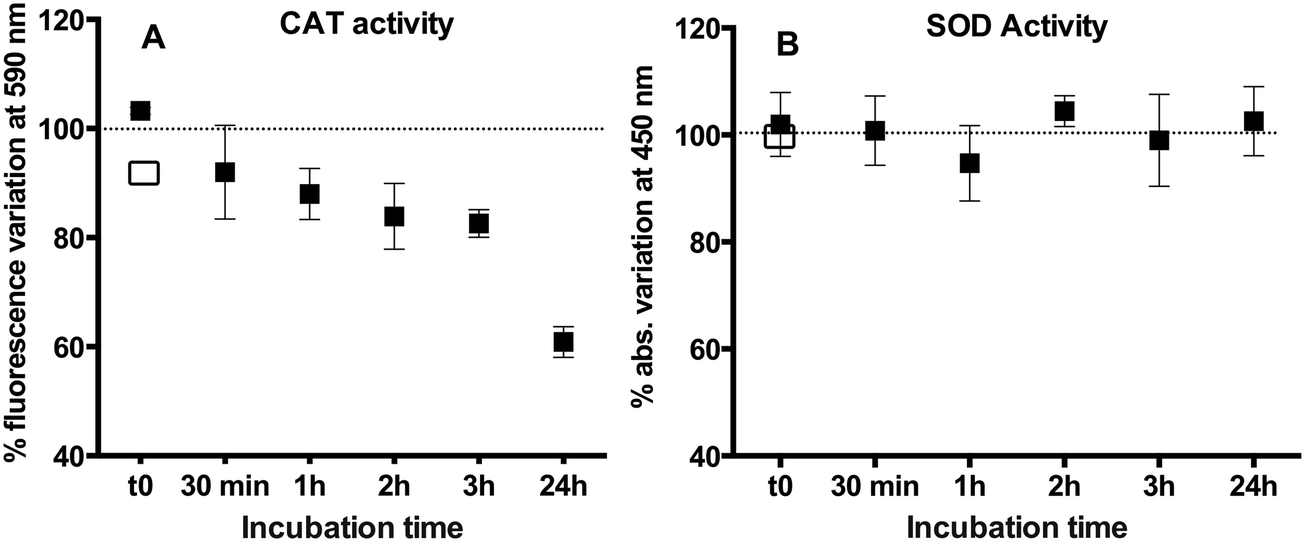 | ||
| Fig. 7 Changes in the activity of CAT (A) and SOD (B) in the presence of AgNPs over 24 h of incubation. The concentration of the CAT and SOD was fixed at 1 μM and the AgNP concentration was fixed at 10 μM. The activity was normalized to the activity of the free enzyme signal (dotted line). Weak instantaneous inhibition of the CAT activity by AgNO3 at 4.3 μM (□). No activity modification could be detected with SOD at this AgNO3 concentration. | ||
CAT is composed of four identical subunits, which work together to perform its biological function in organisms. In order to reach the active center of CAT, H2O2 needs to diffuse inside a narrow channel made of 14 amino acids, exposing Asp-127 and Gln-167 at its entry, at the surface of the protein. Inside this channel, H2O2 is accompanied by both His-74 and Asn-147 nearby the active center where Arg-353 together with the heme cofactor reduced it to H2O.34,46 The decrease in the activity of CAT could also be explained by the interaction of Ag(I) ions released by AgNPs and amino acid residues within this narrow channel,47 impeding the approach of H2O2 to the active center and decreasing the soluble CAT activity.17,48 Moreover, dissolved Ag(I) ions interacting with Trp in the channel could quench the fluorescence of CAT and induce a microenvironmental change around Trp residues, which is in agreement with our results (Fig. 6A).
To explore whether the changes observed in the CAT structure and activity were primarily due to AgNPs or dissolved Ag(I), the impact of 2.8 μM and 4.3 μM AgNO3 was determined. These concentrations corresponded to the percentages of dissolved Ag(I) in 35 μM AgNP suspension at 2 h (28%) and 24 h (43%) of interaction with 5 μM CAT (Fig. S1†). The CD spectrum of the CAT mixtures with two concentrations of AgNO3 revealed only small changes in the CAT secondary structure (Fig. S3 and Table S1†). Similarly, as evidenced by the fluorescence spectra of CAT recorded in the presence of AgNO3, Ag(I) has only a minor influence (Fig. S4†). These results clearly point out that the fraction of dissolved Ag(I) in the AgNP suspension has a minor effect on the CAT structure and that the observed structure alterations are primarily due to the surface interaction with AgNPs. These observations were also consistent with the very weak decrease in the enzymatic activity of CAT (4–6%, Fig. 7A) observed in the presence of AgNO3.
In contrast to the CAT results, the AgNPs did not affect the SOD activity (Fig. 7B). This observation was coherent with the existing literature showing that the SOD activity was not affected by similar size AgNPs19 or different size AgNPs on the activity of recombinant SOD14 and the SOD in seeds of rice Oryza sativa.49 The lack of AgNP effects on the SOD activity could be related with the enzyme structure. The two subunits of SOD were reported to be tightly joined by hydrophobic and electrostatic forces. The active site Cu(II) of SOD is located at the bottom of a conical narrow cavity on the outside of β-barrel between two surface loops.50 Cu(II) is partly exposed while Zn(II) is completely buried within the protein.35 At the active site, zinc provides a strong positive charge at the bottom of the cavity and a weak negative potential surrounding the enzyme. Even if AgNP dissolution would have occurred, it will be difficult for the positively charged Ag(I) to diffuse into the active center through the negatively charged surface.51 A possible explanation for the observed non-significant changes in the enzyme structure and enzymatic activity is that the proteins bind around the AgNP surface without disturbing the AgNP colloidal stability.
Conclusions
Using a combination of multiple spectral, imaging and fractionation techniques, it was possible to prove the molecular mechanisms underlying the enzyme protein–AgNP interactions. The obtained results indicate that both enzymes CAT and SOD interacted with AgNPs and formed complexes. The interaction between CAT and the AgNP surface is strong enough to promote conformational changes in the enzyme. CAT formed a shell corona around the dissolving AgNP core, leading to a broad size distribution of colloidal Ag species. The released Ag(I) together with AgNPs could inhibit its enzymatic activity, even if the dissolved Ag ions have no impact on the CAT heme site. By contrast, AgNP–SOD complex formation only slightly affected the protein conformation and had no impact on the enzymatic activity or AgNP dissolution. This research provides a basis to understand how the functional properties of key antioxidant enzymes may affect the stability of nanoparticles and vice versa and how the nanoparticles could affect the enzymes' reactivity. Financial support was provided by the University of Geneva.Conflicts of interest
There are no conflicts to declare.Acknowledgements
Financial support was provided by the University of Geneva.References
- S. J. Cameron, F. Hosseinian and W. G. Willmore, A Current Overview of the Biological and Cellular Effects of Nanosilver, Int. J. Mol. Sci., 2018, 19, 1–40 CrossRef PubMed.
- A. Ivask, K. Juganson, O. Bondarenko, M. Mortimer, V. Aruoja and K. Kasemets, et al. Mechanisms of toxic action of Ag, ZnO and CuO nanoparticles to selected ecotoxicological test organisms and mammalian cells in vitro: a comparative review, Nanotoxicology, 2014, 8(Suppl 1), 57–71 CrossRef CAS PubMed.
- N. von Moos and V. I. Slaveykova, Oxidative stress induced by inorganic nanoparticles in bacteria and aquatic microalgae–state of the art and knowledge gaps, Nanotoxicology, 2014, 8(6), 605–630 CrossRef CAS PubMed.
- M. Marchioni, P.-H. Jouneau, M. Chevallet, I. Michaud-Soret and A. Deniaud, Silver nanoparticle fate in mammals: Bridging in vitro and in vivo studies, Coord. Chem. Rev., 2018, 364, 118–136 CrossRef CAS.
- N. Duran, M. Duran, M. B. de Jesus, A. B. Seabra, W. J. Favaro and G. Nakazato, Silver nanoparticles: A new view on mechanistic aspects on antimicrobial activity, Nanomedicine, 2016, 12(3), 789–799 CrossRef CAS PubMed.
- D. He, J. J. Dorantes-Aranda and T. D. Waite, Silver Nanoparticle - Algae Interactions: Oxidative Dissolution, Reactive Oxygen Species Generation and Synergistic Toxic Effects, Environ. Sci. Technol., 2012, 46(16), 8731–8738 CrossRef CAS PubMed.
- M. Akter, M. T. Sikder, M. M. Rahman, A. Ullah, K. F. B. Hossain and S. Banik, et al. A systematic review on silver nanoparticles-induced cytotoxicity: Physicochemical properties and perspectives, J. Adv. Res., 2018, 9, 1–16 CrossRef CAS PubMed.
- M. Ahamed, R. Posgai, T. J. Gorey, M. Nielsen, S. M. Hussain and J. J. Rowe, Silver nanoparticles induced heat shock protein 70, oxidative stress and apoptosis in Drosophila melanogaster, Toxicol. Appl. Pharmacol., 2010, 242(3), 263–269 CrossRef CAS PubMed.
- R. C. Valerio-Garcia, A. L. Carbajal-Hernandez, E. B. Martinez-Ruiz, V. H. Jarquin-Diaz, C. Haro-Perez and F. Martinez-Jeronimo, Exposure to silver nanoparticles produces oxidative stress and affects macromolecular and metabolic biomarkers in the goodeid fish Chapalichthys pardalis, Sci. Total Environ., 2017, 583, 308–318 CrossRef CAS PubMed.
- Z. Huang, K. He, Z. Song, G. Zeng, A. Chen and L. Yuan, et al. Antioxidative response of Phanerochaete chrysosporium against silver nanoparticle-induced toxicity and its potential mechanism, Chemosphere, 2018, 211, 573–583 CrossRef CAS PubMed.
- P.-E. Buffet, J.-F. Pan, L. Poirier, C. Amiard-Triquet, J.-C. Amiard and P. Gaudin, et al. Biochemical and behavioural responses of the endobenthic bivalve Scrobicularia plana to silver nanoparticles in seawater and microalgal food, Ecotoxicol. Environ. Saf., 2013, 89, 117–124 CrossRef CAS PubMed.
- D. Ali, P. G. Yadav, S. Kumar, H. Ali, S. Alarifi and A. H. Harrath, Sensitivity of freshwater pulmonate snail Lymnaea luteola L., to silver nanoparticles, Chemosphere, 2014, 104, 134–140 CrossRef CAS PubMed.
- H. S. Jiang, X. N. Qiu, G. B. Li, W. Li and L. Y. Yin, Silver nanoparticles induced accumulation of reactive oxygen species and alteration of antioxidant systems in the aquatic plant Spirodela polyrhiza, Environ. Toxicol. Chem., 2014, 33(6), 1398–1405 CrossRef CAS PubMed.
- A. M. Pudlarz, K. Ranoszek-Soliwoda, E. Czechowska, E. Tomaszewska, G. Celichowski and J. Grobelny, et al. A Study of the Activity of Recombinant Mn-Superoxide Dismutase in the Presence of Gold and Silver Nanoparticles, Appl. Biochem. Biotechnol., 2019, 187(4), 1551–1568 CrossRef CAS PubMed.
- L. Ma, Y. Ze, J. Liu, H. Liu, C. Liu and Z. Li, et al. Direct evidence for interaction between nano-anatase and superoxide dismutase from rat erythrocytes, Spectrochim. Acta, Part A, 2009, 73(2), 330–335 CrossRef PubMed.
- H. M. Zhang, J. Cao, B. P. Tang and Y. Q. Wang, Effect of TiO(2) nanoparticles on the structure and activity of catalase, Chem.-Biol. Interact., 2014, 219, 168–174 CrossRef CAS PubMed.
- B. Yang, F. Hao, J. Li, D. Chen and R. Liu, Binding of chrysoidine to catalase, spectroscopy, isothermal titration calorimetry and molecular docking studies, J. Photochem. Photobiol., B, 2013, 128, 35–42 CrossRef CAS PubMed.
- Y. Wang and H. Zhang, Comprehensive studies on the nature of interaction between catalase and SiO2 nanoparticle, Mater. Res. Bull., 2014, 60, 51–56 CrossRef CAS.
- W. Fang, Z. Chi, W. Li, X. Zhang and Q. Zhang, Comparative study on the toxic mechanisms of medical nanosilver and silver ions on the antioxidant system of erythrocytes, from the aspects of antioxidant enzyme activities and molecular interaction mechanisms, J. Nanobiotechnol., 2019, 17(1), 66 CrossRef PubMed.
- W. Liu, I. A. M. Worms, N. Herlin-Boime, D. Truffier-Boutry, I. Michaud-Soret and E. Mintz, et al. Interaction of silver nanoparticles with metallothionein and ceruloplasmin, impact on metal substitution by Ag(i), corona formation and enzymatic activity, Nanoscale, 2017, 9(19), 6581–6594 RSC.
- A. Käkinen, F. Ding, P. Chen, M. Mortimer, A. Kahru and P. C. Ke, Interaction of firefly luciferase and silver nanoparticles and its impact on enzyme activity, Nanotechnology, 2013, 24(34), 345101 CrossRef PubMed.
- A. J. Martinolich, G. Park, M. Y. Nakamoto, R. E. Gate and K. E. Wheeler, Structural and functional effects of Cu metalloprotein-driven silver nanoparticle dissolution, Environ. Sci. Technol., 2012, 46(11), 6355–6362 CrossRef CAS PubMed.
- D. N. Freitas, A. J. Martinolich, Z. N. Amaris and K. E. Wheeler, Beyond the passive interactions at the nano-bio interface, evidence of Cu metalloprotein-driven oxidative dissolution of silver nanoparticles, J. Nanobiotechnol., 2016, 14(1), 7 CrossRef PubMed.
- I. Schomburg, A. Chang and D. Schomburg, BRENDA, enzyme data and metabolic information, Nucleic Acids Res., 2002, 30(1), 47–49 CrossRef CAS PubMed.
- Y. Wu, Study on the interaction between salicylic acid and catalase by spectroscopic methods, J. Pharm. Biomed. Anal., 2007, 44(3), 796–801 CrossRef CAS PubMed.
- J. M. Gorham, A. B. Rohlfing, K. A. Lippa, R. I. MacCuspie, A. Hemmati and R. D. Holbrook, Storage Wars, how citrate-capped silver nanoparticle suspensions are affected by not-so-trivial decisions, J. Nanopart. Res., 2014, 16, 1–14 CrossRef.
- N. L. Klyachko, D. S. Manickam, A. M. Brynskikh, S. V. Uglanova, S. Li and S. M. Higginbotham, et al. Cross-linked antioxidant nanozymes for improved delivery to CNS, Nanomedicine, 2012, 8(1), 119–129 CrossRef CAS PubMed.
- G. Yohannes, S. K. Wiedmer, E. K. Tuominen, P. K. Kinnunen and M.-L. Riekkola, Cytochrome c–dimyristoylphosphatidylglycerol interactions studied by asymmetrical flow field-flow fractionation, Anal. Bioanal. Chem., 2004, 380(5–6), 757–766 CrossRef CAS PubMed.
- J. Mohanty, J. S. Jaffe, E. S. Schulman and D. G. Raible, A highly sensitive fluorescent micro-assay of H2O2 release from activated human leukocytes using a dihydroxyphenoxazine derivative, J. Immunol. Methods, 1997, 202(2), 133–141 CrossRef CAS PubMed.
- V. Banerjee and K. Das, Interaction of silver nanoparticles with proteins, a characteristic protein concentration dependent profile of SPR signal, Colloids Surf., B, 2013, 111, 71–79 CrossRef CAS PubMed.
- K. Siriwardana, A. Wang, M. Gadogbe, W. E. Collier, N. C. Fitzkee and D. Zhang, Studying the effects of cysteine residues on protein interactions with silver nanoparticles, J. Phys. Chem. C, 2015, 119(5), 2910–2916 CrossRef CAS PubMed.
- M. Marchioni, T. Gallon, I. Worms, P. H. Jouneau, C. Lebrun and G. Veronesi, et al. Insights into polythiol-assisted AgNP dissolution induced by bio-relevant molecules, Environ. Sci.: Nano, 2018, 5(8), 1911–1920 RSC.
- X. Y. Bi and P. Westerhoff, Ferric reducing reactivity assay with theoretical kinetic modeling uncovers electron transfer schemes of metallic-nanoparticle-mediated redox in water solutions, Environ. Sci.: Nano, 2019, 6(6), 1791–1798 RSC.
- P. Chelikani, I. Fita and P. C. Loewen, Diversity of structures and properties among catalases, Cell. Mol. Life Sci., 2004, 61(2), 192–208 CrossRef CAS PubMed.
- J. A. Tainer, E. D. Getzoff, J. S. Richardson and D. C. Richardson, Structure and mechanism of copper, zinc superoxide dismutase, Nature, 1983, 306(5940), 284–287 CrossRef CAS PubMed.
- R. Huang, R. P. Carney, K. Ikuma, F. Stellacci and B. L. Lau, Effects of surface compositional and structural heterogeneity on nanoparticle–protein interactions, different protein configurations, ACS Nano, 2014, 8(6), 5402–5412 CrossRef CAS PubMed.
- E. William, T. Nobuo and G. R. Michael, Crystalline bovine liver catalase, J. Mol. Biol., 1975, 103(4), 799–801 Search PubMed.
- A. Mallick, B. Haldar and N. Chattopadhyay, Spectroscopic investigation on the interaction of ICT probe 3-acetyl-4-oxo-6, 7-dihydro-12H indolo-[2, 3-a] quinolizine with serum albumins, J. Phys. Chem. B, 2005, 109(30), 14683–14690 CrossRef CAS PubMed.
- E. Blatt, R. C. Chatelier and W. H. Sawyer, Effects of quenching mechanism and type of quencher association on stern-volmer plots in compartmentalized systems, Biophys. J., 1986, 50(2), 349–356 CrossRef CAS PubMed.
- S. T. Ferreira, L. Stella and E. Gratton, Conformational dynamics of bovine Cu, Zn superoxide dismutase revealed by time-resolved fluorescence spectroscopy of the single tyrosine residue, Biophys. J., 1994, 66(4), 1185–1196 CrossRef CAS PubMed.
- K. A. Dill and J. MacCallum, The protein-folding problem, 50 years on, Science, 2012, 338(6110), 1042–1046 CrossRef CAS PubMed.
- Y. I. Dogac and M. Teke, Immobilization of bovine catalase onto magnetic nanoparticles, Prep. Biochem. Biotechnol., 2013, 43(8), 750–765 CrossRef CAS PubMed.
- E. Czechowska, K. Ranoszek-Soliwoda, E. Tomaszewska, A. Pudlarz, G. Celichowski and D. Gralak-Zwolenik, et al. Comparison of the antioxidant activity of catalase immobilized on gold nanoparticles via specific and non-specific adsorption, Colloids Surf., B, 2018, 171, 707–714 CrossRef CAS PubMed.
- A. M. Pudlarz, E. Czechowska, K. Ranoszek-Soliwoda, E. Tomaszewska, G. Celichowski and J. Grobelny, et al. Immobilization of Recombinant Human Catalase on Gold and Silver Nanoparticles, Appl. Biochem. Biotechnol., 2018, 185, 717–735 CrossRef CAS PubMed.
- B. Zhang, W. Zhai, R. Liu, Z. Yu, H. Shen and X. Hu, Evaluation on the Toxic Effects of NanoAg to Catalase, J. Nanosci. Nanotechnol., 2015, 15, 1473–1479 CrossRef CAS PubMed.
- Z. Cao, R. Liu and B. Yang, Potential toxicity of sarafloxacin to catalase, spectroscopic, ITC and molecular docking descriptions, Spectrochim. Acta, Part A, 2013, 115, 457–463 CrossRef CAS PubMed.
- T. J. Reid, M. Murthy, A. Sicignano, N. Tanaka, W. Musick and M. Rossmann, Structure and heme environment of beef liver catalase at 2.5 A resolution, Proc. Natl. Acad. Sci. U. S. A., 1981, 78(8), 4767–4771 CrossRef CAS PubMed.
- C. D. Putnam, A. S. Arvai, Y. Bourne and J. A. Tainer, Active and inhibited human catalase structures, ligand and NADPH binding and catalytic mechanism, J. Mol. Biol., 2000, 296(1), 295–309 CrossRef CAS PubMed.
- S. D. Gupta, A. Agarwal and S. Pradhan, Phytostimulatory effect of silver nanoparticles (AgNPs) on rice seedling growth, an insight from antioxidative enzyme activities and gene expression patterns, Ecotoxicol. Environ. Saf., 2018, 161, 624–633 CrossRef CAS PubMed.
- M. Ferraroni, W. R. Rypniewski, B. Bruni, P. Orioli and S. Mangani, Crystallographic determination of reduced bovine superoxide dismutase at pH 5.0 and of anion binding to its active site, J. Biol. Inorg. Chem., 1998, 3(4), 411–422 CrossRef CAS.
- I. Klapper, R. Hagstrom, R. Fine, K. Sharp and B. Honig, Focusing of electric fields in the active site of Cu-Zn superoxide dismutase, Effects of ionic strength and amino-acid modification, Proteins: Struct., Funct., Genet., 1986, 1(1), 47–59 CrossRef CAS PubMed.
Footnote |
| † Electronic supplementary information (ESI) available. See DOI: 10.1039/c9en01284b |
| This journal is © The Royal Society of Chemistry 2020 |