
Nanoplastics as a potential environmental health factor: effects of polystyrene nanoparticles on human intestinal epithelial Caco-2 cells
Constanza
Cortés†
a,
Josefa
Domenech†
a,
Marcela
Salazar
a,
Susana
Pastor
ab,
Ricard
Marcos
 *ab and
Alba
Hernández
*ab
*ab and
Alba
Hernández
*ab
aGroup of Mutagenesis, Department of Genetics and Microbiology, Faculty of Biosciences, Universitat Autònoma de Barcelona, Edifici C, Campus de Bellaterra, 08193 Cerdanyola del Vallès, Barcelona, Spain. E-mail: ricard.marcos@uab.es; alba.hernandez@uab.es
bConsortium for Biomedical Research in Epidemiology and Public Health (CIBERESP), Carlos III Institute of Health, Madrid, Spain
First published on 5th December 2019
Abstract
The ubiquitous and increasing presence of micro-/nanoplastics (MNPLs) in our environment demands an urgent hazard assessment, in order to determine the potential risk they pose to human beings. Given the scarce information found in the literature regarding MNPL's effects over human cells, the aim of our work is to evaluate MNPL's ability to penetrate the cells, and their potential toxic/genotoxic effects. To this aim, we used polystyrene MNPLs, as they are a widespread model of synthetic polymer, using nanoparticles with (y-nPS) or without (nPS) a fluorescent label. The human colon adenocarcinoma Caco-2 cell line was used as the cellular target, as ingestion is one of the main entry routes of MNPLs. Different endpoints were analyzed as indicators of nanotoxicity, including cytotoxicity, ROS increase, genotoxicity, DNA oxidative damage and increase in the expression of stress-related genes.
Environmental significanceThe increased presence of plastics in our environment, as waste after use, is of great ecological concern. Nevertheless, in addition to the visible part of this environmental contamination, plastics degrade to micro and nanosizes (MNPLs) forming a non-visible source of environmental pollutants. At these sizes, MNPLs can be easily taken in by organisms, including humans, supposing a potential health concern. Assuming that ingestion is the most real route of exposure to MNPLs we have used human intestinal Caco-2 cells as a model to evaluate a wide set of potential toxic/genotoxic biomarkers after exposure to polystyrene nanoplastics (nPS). At this point, it is important to emphasize the relevance of the genotoxicity studies, and the scarce number of studies focusing on this biomarker. Interestingly, although nPS are easily uptaken by Caco-2 cells, the observed toxic/genotoxic effects can be classified as slight. |
Background
Plastic pollutants are considered a major environmental problem due to their volume and persistence. In the environment, plastics suffer constant degradation, leading to their transformation into micro- and nanoplastics (MNPLs).1,2 MNPLs resulting from the degradation of larger sizes are named secondary MNPLs, in contrast to those initially designed at micro/nano sizes, which are mainly used in personal care products, such as exfoliating agents in creams.3 Independent of their original production size, all types of MNPLs finally are present in different environmental biological matrices and, consequently, humans are certainly exposed to them. The MNPLs' size range makes it easy for them to cross the organisms' barriers, producing potentially undesirable health effects. Although concern for the presence of environmental MNPLs was initially focused on water (mainly marine) contamination, their presence has been proven to be ubiquitous, and they are also found in other ecosystems' matrices, such as the air of big cities.4Depending on their intended use, plastics are mainly composed of different types of synthetic polymers such as polyethylene, polypropylene, and polystyrene, among others. Consequently, the different components also constitute the most frequently detected MNPLs in the environment.5 However, other chemical compounds like phthalates and bisphenol analogues are added during the production of plastics, according to the proposed use, to obtain the desired properties.6 In addition, MNPLs can also act as carriers by interacting with different types of organic pollutants such as organochlorine pesticides, polychlorinated biphenyls, and polyaromatic hydrocarbons, among others.7
According to the increased presence of MNPLs in our environment, the assessment of the potential health risk for humans demands an urgent response.8,9 Although a relevant amount of information regarding the biological effects of MNPLs on in vivo ecotoxicological models exists,10 the low number of studies that use human cells to evaluate the potential health effects of MNPLs is alarming. Thus, new studies using different human cell models as targets, and evaluating different biological endpoints are needed.
Ingestion is considered the most important exposure route of MNPLs for humans, due to the consumption of marine organisms or their derivatives.11 Nevertheless, the presence of MNPLs has also been detected in other food matrices at equivalent levels; for example, the observed levels of MNPLs in mussels are similar to those found in beer.12 According to these data, the use of human intestinal cells as a cell-model target seems appropriate. The Caco-2 cell line is a human colon epithelial cell line used as an in vitro model of the human intestinal epithelium in many toxicological studies, included those evaluating nanomaterials.13 Using this cell line, we have determined the ability of polystyrene nanoplastics to be uptaken, while also evaluating the induction of potentially toxic and genotoxic effects.
Material and methods
Polystyrene nanoparticle dispersion and characterization
Commercial polystyrene particles (PS) were obtained from Spherotech (Chicago, USA). Two types of PS were used, normal and fluorescent PS. Normal PS (nPS, PP-008-10) had a nominal size ranging from 0.05 to 0.1 μm and were used in all the experiments. Fluorescent yellow PS (y-nPS, FP-00552-2) had a nominal size ranging from 0.04 to 0.09 μm and were used in the experiments to analyze cellular uptake. Polystyrene dispersions were diluted to 100 μg mL−1 in distilled water or DMEM, and further characterized by transmission electron microscopy (TEM) on a JEOL JEM-1400 instrument (JEOL LTD, Tokyo, Japan). Additionally, both the hydrodynamic size and the Z-potential parameters were evaluated using dynamic light scattering (DLS) and laser Doppler velocimetry (LDV) methodologies with a Malvern Zetasizer Nano ZS zen3600 device (Malvern, UK).Cell culture and reagents
The Caco-2 cell line was kindly provided by Dr. Isabella Angelis (Istituto Superiore di Sanità, Italy). This human colorectal adenocarcinoma-derived cell line was maintained in Dulbecco's modified Eagle's high glucose medium (DMEM) without sodium pyruvate (Biowest, France), supplemented with 10% fetal bovine serum (FBS), 1% non-essential amino acids (NEAA) (Biowest, France) and 2.5 μg mL−1 Plasmocin™ (Invivo Gen, San Diego, CA). Cells were grown at 37 °C in a humidified atmosphere of 5% CO2 and 95% air. For cell culture maintenance, cells were routinely subcultured twice a week at 80% confluence treating them with 1% trypsin–EDTA (Biowest, France).Polystyrene treatments
To study the different PS-induced biological effects, Caco-2 cells were exposed to different concentrations of nPS, or y-nPS diluted in cell culture medium, supplemented as previously stated. To proceed, 150![[thin space (1/6-em)]](https://www.rsc.org/images/entities/char_2009.gif) 000 cells were seeded in 12-well plates and grown for 24/48 h. Next, the medium was removed and replaced by 1 mL of the selected nPS concentration for an exposure time of 24/48 h.
000 cells were seeded in 12-well plates and grown for 24/48 h. Next, the medium was removed and replaced by 1 mL of the selected nPS concentration for an exposure time of 24/48 h.
Cell viability assay
A preliminary cell viability study was carried out using the Beckman counter method to select the doses of nPS to be used in the following experiments. Briefly, Caco-2 cells were exposed to nPS for 24 and 48 h at 0, 25, 50, 100, 125, 150, 175 and 200 μg mL−1. After the exposure time, cells were washed with PBS 1X twice and incubated at 37 °C for 5 min with trypsin–EDTA 1%. The detached cells were then resuspended in 2% FBS diluted in PBS, diluted 1:100 in ISOTON and counted with a ZTM Series coulter-counter (Beckman Coulter Inc., CA). The obtained percentage values constitute an average of the number of cells counted for each treatment, compared to the average of the untreated control cultures.
Intake assessment by flow cytometry
The quantification of nPS intake was initially analyzed by flow cytometry. Cells were exposed to increasing concentrations of y-nPS and incubated for 24 h. After the incubation time, cells were washed, resuspended in 300 μL of PBS, and the fluorescence emission was evaluated using a FACSCalibur with excitation/emission spectra of 488/585 nm, respectively. For each concentration, a total of 10000 cells were scored. The experiment was carried out thrice and experimental triplicates were analyzed for each concentration.
Detection of cellular uptake of PS by using confocal microscopy
To assess the intra- or extracellular localization of nPS, laser confocal microscopy was used to detect fluorescently-labelled nPS (y-nPS). After the exposure to y-nPS, Caco-2 cells were stained for 15 min at room temperature with a 1:500 dilution of Hoechst 33342 (ThermoFisher Scientific, USA) to stain the nuclei, and a 1:500 dilution of Cellmask™ Deep Red plasma (Life Technologies, USA) to stain the cell membrane. Both fluorophores were diluted in DMEM cell culture medium. After staining, cells were washed twice with DMEM. Images of each sample were acquired using a Leica TCS SP5 confocal microscope and processed with Huygens essential 4.40p6 software (Scientific Volume Imaging, Netherlands). Finally, images were analyzed with Fiji software.
Detection of cellular uptake of PS by using transmission electron microscopy (TEM)
After exposure, cells were washed with PBS, detached with trypsin, pelleted, and fixed in 2.5% (v/v) glutaraldehyde (EM grade, Merck, Darmstadt, Germany) and 2% (w/v) paraformaldehyde (EMS, Hatfield, PA) in 0.1 M cacodylate buffer (PB, Sigma-Aldrich, Steinheim, Germany), pH 7.4 and processed following conventional procedures, as previously described.14 Samples were first post-fixed with osmium, dehydrated in acetone, later embedded in Epon, and finally polymerized at 60 °C and cut with an ultramicrotome. Ultrathin sections were placed in copper grids and contrasted with uranyl acetate and Reynolds lead citrate solutions and observed using a JEOL 1400 (JEOL LTD, Tokyo, Japan) transmission electron microscope equipped with a CCD GATAN ES1000W Erlangshen camera.Production of intracellular ROS
The production of intracellular ROS was measured using the dichloro-dihydro-fluorescein diacetate (DCFH-DA) method. After the exposure to different concentrations of nPS of Caco-2 cells, the treatments were removed and cells were washed twice with PBS 1X. Subsequently, cells were incubated with 20 μM DCFH-DA in serum-free DMEM for 1 h at 37 °C. Fluorescence was measured at 490–535 nm (excitation–emission spectrum) with a fluorimeter (Victor III, Perkin Elmer, USA). As a positive control, cells were treated with 100 mM H2O2 for 1 h.Production of mitochondrial ROS
The formation of mitochondrial ROS was measured using the MitoSox™ Red Mitochondrial Superoxide Indicator (ThermoFisher Scientific, USA). Cells were washed thrice with PBS 1X after exposure, and incubated in the dark at 37 °C for 10 min with 94 μM of Mitosox™. After incubation, the samples were washed three times with PBS 1X, trypsinized, and resuspended to a final concentration of 1 × 10⁶ cells per mL. Via-Probe™ Red Nucleic Acid Stain (BD Biosciences, USA) was added to a final dilution of 1:200 to stain living cells, and the fluorescence emission of both dyes was evaluated using a FACSCanto. Mitosox™ emission was analyzed with an excitation/emission of 488/585 nm filter and Via-Probe™ with an excitation/emission of 633/660 nm. Incubation with 94 μM antimycin (Sigma-Aldrich, Saint Louis, MI, USA) for 1 h was used as a positive control for ROS production. For each concentration, 20000 cells were scored.
Mitochondrial membrane potential assay
The destabilization of the mitochondrial membrane was assessed using the MitoProbe™ TMRM assay kit (ThermoFisher Scientific, USA). After the cells were exposed to the different concentrations of nPS, they were washed thrice with PBS 1X, trypsinized, and counted. The cells were then precipitated and resuspended in PBS 1X at a concentration of 1 × 10⁶ cells per mL. TMRM was then added at 1:100 and incubated for 30 min at 37 °C in the dark. After the incubation time, Via-Probe™ Red Nucleic Acid Stain (BD Biosciences, USA) was added to a final dilution of 1:200 to stain living cells, and the fluorescence emission was evaluated using a FACSCanto. TMRM emission was analyzed with an excitation/emission of 488/585 nm and Via-Probe™ with an excitation/emission of 633/660 nm. Carbonyl cyanide m-chlorophenyl hydrazone (50 μM, CCCP) (supplied with the kit) was used as a positive control for membrane destabilization. For each concentration, 20000 cells were scored.
The comet assay
Genotoxic (DNA breaks) and oxidative DNA damage (ODD) in Caco-2 cells were evaluated using the alkaline comet assay complemented with the use of the formamidopyrimidine DNA glycosylase (FPG) enzyme. Briefly, nPS-exposed and control Caco-2 cells were washed twice with PBS 1X, detached with trypsin–EDTA 1%, incubated at 37 °C for 5 min, and centrifuged at 1800 rpm for 8 min. Cells were resuspended in PBS 1X to obtain 1 × 10⁶ cells per mL. The cell suspension was mixed 1:10 with 0.75% low melting point agarose a 37 °C, dropped on GelBond® films (GBFs) (Life Sciences, Lithuania) in triplicates, and lysed in cold lysis buffer overnight at 4 °C. Then, GBFs were gently washed twice with enzyme buffer for 5 min and 50 min, respectively, at 4 °C. After that, GBFs were incubated with enzyme buffer with or without the FPG enzyme at a 1:25000 dilution for 30 min at 37 °C, followed by a washing step with the electrophoresis buffer for 5 min and incubated in electrophoresis buffer to allow DNA unwinding and expression of alkali-labile sites, for 35 min at 4 °C. Subsequently, the electrophoresis step was carried out at 20 V and 300 mA at 4 °C. GBFs were washed twice with cold PBS 1X for 5 and 10 min, respectively, and cells were fixed in absolute ethanol for at least 1 h, and then air-dried overnight at room temperature. Cells were stained with 1:10000 SYBR Gold in TE buffer for 20 min at room temperature. GBFs were mounted and visualized using an epifluorescence microscope (Olympus BX50) at 20× magnification. DNA damage was quantified with the Komet 5.5 image analysis system (Kinetic Imaging Ltd, Liverpool, UK) as the percentage of DNA in the tail. One hundred randomly-selected comet images were analyzed per sample. Two different samples were analyzed for each condition in each one of the two experiments performed. 200 μM MMS (Sigma-Aldrich, Germany) and 5 mM KBrO3 (Sigma-Aldrich, Germany) were used as positive controls for general genotoxic and oxidative genotoxic damage, respectively.
The flow cytometry micronucleus (FCMN) assay
The FCMN assay was carried out as previously described,15 but introducing several modifications. Briefly, after the standard seeding procedure, cells were incubated for 48 h with the selected nPS concentrations in experimental duplicates. Untreated cells with cell culture medium were used as the negative control, and MMC, 0.4 μg mL−1 was included as the positive control. After the exposure time, the culture medium was removed, cells were rinsed twice with PBS 1X, collected after trypsinization in FC tubes, and centrifuged at 800 rpm for 8 min. The supernatant was then removed leaving 50 μL where the cells were gently resuspended by tapping the FC tubes. 125 μL of 0.125 mg mL−1 ethidium monoazide bromide (EMA) (Life Technologies, CA, USA) diluted in PBS 1X with 2% heat-inactivated FBS was added to each tube as a nucleic acid dye, and samples were left submerged 2 cm deep in ice for 20 min under a light source (60 W light bulb) to induce cell photoactivation. After photoactivation, samples were diluted with ice-cold PBS 1X with 2% heat-inactivated FBS and centrifuged while protected from light with aluminum foil. The supernatant was then removed, and 250 μL of lysis-solution-1 (0.584 mg mL−1 NaCl, 1 mg mL−1 sodium citrate, 0.3 μL mL−1 detergent IGEPAL, 1 mg mL−1 RNase A, and 0.2 μM SYTOX Green prepared in deionized water) was slowly added to each sample while briefly vortexing the tubes at medium speed, and left at room temperature for 1 h. Finally, 250 μL of lysis-solution-2 (85.6 mg mL−1 sucrose, 15 mg mL−1 citric acid, and 0.2 μM SYTOX Green prepared in deionized water) was added and kept at room temperature for an additional 30 min, before FC analysis using a FACSCanto (Becton Dickinson) cytometer. For each concentration, a total 20000 cells were scored and the number of MN was recorded. The frequency of MN was calculated by dividing the number of events in the “MN region” by those from the “nucleus region”, and multiplying this number by 1000.
Analysis of gene expression by real-time RT-PCR
Real-time RT-PCR was used to detect changes in the expression of ROS scavenger genes [Heme-oxygenase 1 (HO1), Superoxide dismutase 2 (SOD2), and Glutathione S-transferase P (GSTP1)], Heat Shock Protein 70 (HSP70), and inflammatory response genes [Interleukin 1β (IL-1β) and Interleukin 8 (IL-8)]. After nPS exposure, Caco-2 cells' total RNA was extracted using TRI Reagent® (Sigma-Aldrich, Germany) following the manufacturer's instructions. Residual DNA contamination was eliminated by treating the samples with RNase-free DNase I (Turbo DNA-free kit; Invitrogen, USA). cDNA was obtained from 100 ng μL−1 total RNA by retrotranscription with the High Capacity RNA-to-cDNA kit (Applied Biosystems, USA). To determine the relative expression of the genes, the obtained cDNA was analyzed by real-time PCR on a LightCycler-480 (Roche, Basel, Switzerland). The β-actin gene was used as the housekeeping control. The primers' sequences are indicated in Table 2, and the reaction conditions are shown in Table 3.Statistical analysis
All data resulted from the average of two independent experiments, including duplicates of each one of them, unless stated otherwise. Data were analyzed using GraphPad Prism 7 software, and statistical analysis was performed using one-way ANOVA with Dunnett's post-test unless stated otherwise. Statistical significance was defined as *P ≤ 0.05, **P ≤ 0.01, ***P ≤ 0.001.Results
Polystyrene nanoparticle dispersion and characterization
TEM was used to determine the morphology and size of the supplied nanomaterials. As shown in Fig. 1, PS nanomaterials are composed of round-shaped particles of about 50 nm in diameter when diluted both in distilled H2O and in DMEM.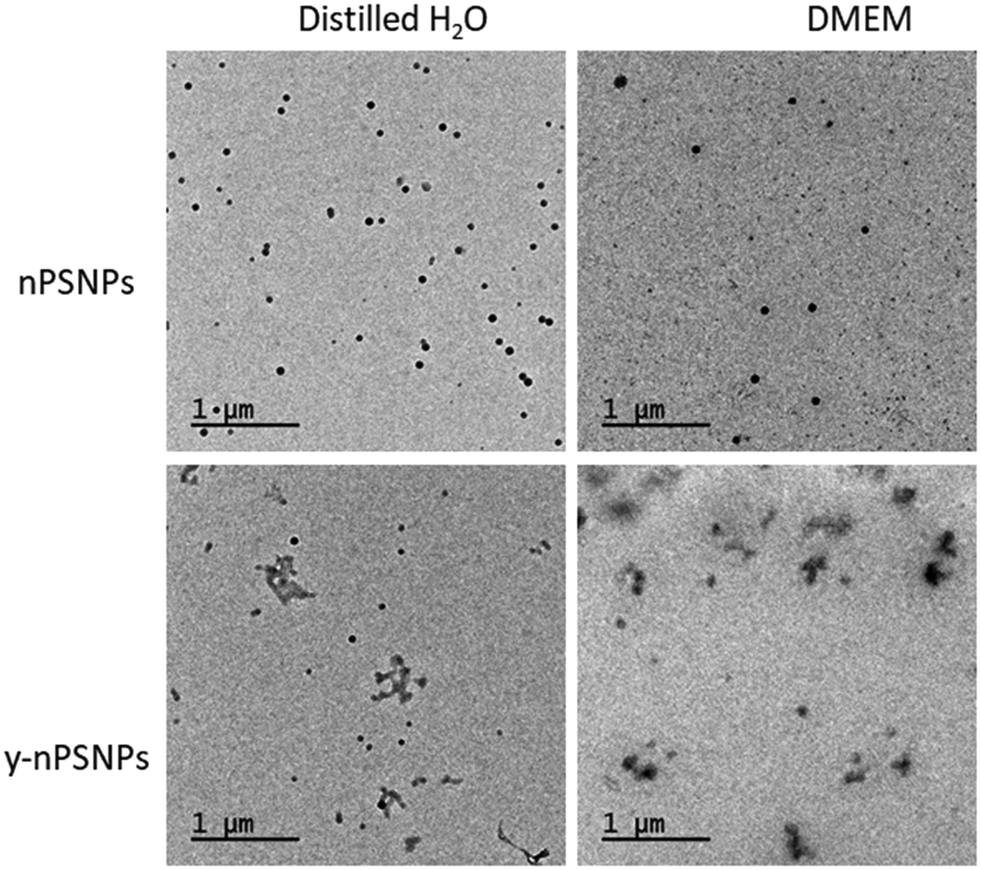 | ||
| Fig. 1 Characterization of PS nanomaterials by TEM. TEM images of 100 μg mL−1 nPS and y-nPS dispersions in distilled H2O and in DMEM. | ||
Table 1 shows the acquired data of the different parameters measured. While measurements taken from the TEM images were consistent with the nominal size range for both of the nPS particles, sizes were significantly larger when the hydrodynamic radius was measured by DLS, especially for those samples diluted in DMEM. Interestingly, dispersion values show differences depending on the solvent used, as the Z-potential shows that dispersions in distilled H2O are moderately stable while particles diluted in DMEM were prone to aggregation. This correlates with that observed by TEM.
| Dispersant | nPS | y-nPS | ||
|---|---|---|---|---|
| Distilled H2O | DMEM | Distilled H2O | DMEM | |
| Size (nm) (TEM) | 52.99 ± 14.68 | 48.59 ± 16.38 | 44.19 ± 28.54 | 55.21 ± 12.76 |
| Size (nm) (DLS) | 86.33 ± 10.20 | 158.28 ± 10.85 | 112.87 ± 3.11 | 377.52 ± 43.05 |
| PdI (DLS) | 0.10 ± 0.09 | 0.44 ± 0.09 | 0.35 ± 0.02 | 0.60 ± 0.06 |
| Z-potential (mV) (DLV) | −36.00 ± 7.88 | −9.31 ± 0.67 | −45.97 ± 3.84 | −9.80 ± 0.33 |
| Mobility (μm cm V−1 s−1) (DLV) | −2.29 ± 0.10 | −0.71 ± 0.05 | −3.76 ± 0.38 | −0.74 ± 0.03 |
| Gene | Forward | Reverse |
|---|---|---|
| HO1 | 5′-TCCGATGGGTCCTTACACTC-3′ | 5′-AAGGAAGCCAGCCAAGAGA-3′ |
| SOD2 | 5′-GGCCTACGTGAACAACCTGA-3′ | 5′-GAGCCTTGGACACCAACAGA-3′ |
| GSTP1 | 5′-CCAATACCATCCTGCGTCAC-3′ | 5′-CAGCAAGTCCAGCAGGTTGT-3′ |
| HSP70 | 5′-TGATCAACGACGGAGACAAG-3′ | 5′-TCCTTCATCTTGGTCAGCAC-3′ |
| IL-1β | 5′-CAGAAGTACCTGAGCTCGCC-3′ | 5′-AGATTCGTAGCTGGATGCCG-3′ |
| IL-8 | 5′-GACCACACTGCGCCAACAC-3′ | 5′-CTTCTCCACAACCCTCTGCAC-3′ |
| β-actin | 5′-GCATGGAGTCCTGTGGCATC-3′ | 5′-CCACACGGAGTACTTGCGCT-3′ |
| Program name | Temperature (°C) | Time | Acquisition mode | Cycles |
|---|---|---|---|---|
| Pre-incubation | 95 | 5 min | None | 1 |
| Amplification | 95 | 10 s | None | 45 |
| 61 | 15 s | None | ||
| 72 | 25 s | None | ||
| 78 | 5 s | Single | ||
| Melting | 95 | 5 s | None | 1 |
| 65 | 1 min | None | ||
| 97 | Continuous | |||
| Cooling | 40 | 10 s | None | 1 |
Cytotoxicity assessment
To determine the cytotoxic concentration range of nPS on Caco-2 cells, cultures were exposed for 24 and 48 h to a wide range of concentrations, spanning from 0 to 200 μg mL−1. As shown in Fig. 2, nPS do not seem to exert any type of cytotoxicity at least until the concentration of 150 μg mL−1. The highest tested dose (200 μg mL−1) was able to induce a mild cytotoxic effect, both at 24 and 48 h, reaching relative survival values of 80%. As our interest was to study the effect of non-cytotoxic doses, we used 100 μg mL−1 as the highest dose in the following experiments.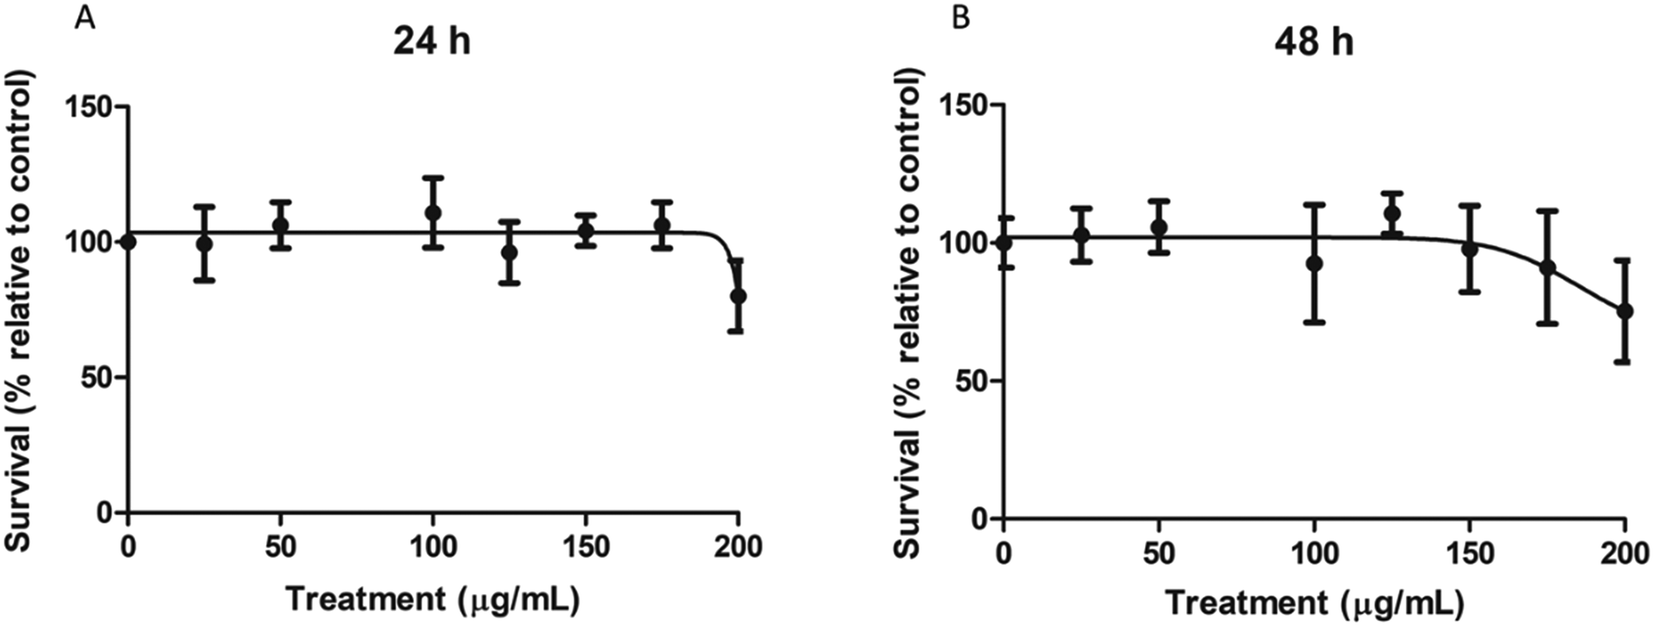 | ||
| Fig. 2 Relative survival of Caco-2 cells after 24 (A) and 48 (B) h of exposure to nPS at concentrations ranging from 0 to 200 μg mL−1. Data are represented as the percentage of counted cells relative to the untreated control ± SEM. | ||
Intake assessment by flow cytometry
To ascertain whether PS nanoparticles were being uptaken by the Caco-2 cells, the fluorescence of each cell was assessed by flow cytometry after y-nPS exposure for 24 h. As shown in Fig. 3A, significant differences in the number of fluorescent-positive cells were observed starting at 25 μg mL−1, where they reached 59% of the examined population. The percentage of cells that uptook the y-nPS continued to increase in a concentration-dependent manner, reaching 86% of the analyzed cells at the highest concentration tested.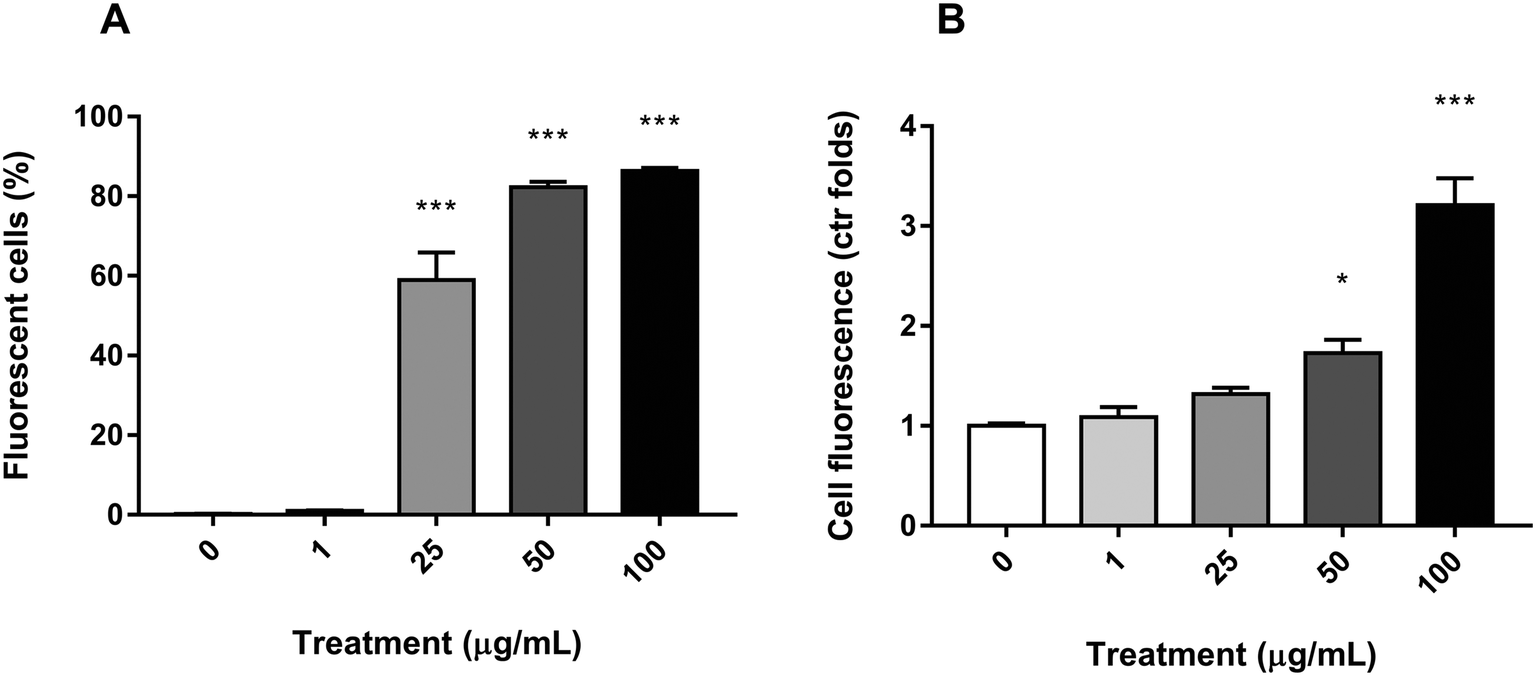 | ||
| Fig. 3 y-nPS intake by Caco-2 cells after 24 h exposure. (A) Percentage of fluorescent-positive cells over the total cell population. (B) Mean fluorescence emission of fluorescent-positive cells. Graphs represent the mean of two different experiments performed in triplicates. Data were analyzed by one-way ANOVA. ***P < 0.001, compared to the untreated control. | ||
The flow cytometry assay was also used to assess the amount of uptaken y-nPS in a semi-quantitative manner by comparing the emitted fluorescence with the unexposed control. Our results showed that, for the two lowest concentrations, there were no significant differences with the untreated samples, even though we could observe a concentration-dependent increase in fluorescence emission (Fig. 3B). At 50 μg mL−1, however, the results showed a significant 72% increase in the fluorescence emission, and this difference was more than three times higher in the samples exposed to 100 μg mL−1.
Taken together, our results show that y-nPS are easily uptaken by Caco-2 cells in a concentration-dependent manner (Mann–Kendall trend test, P ≤ 0.001).
Cellular uptake detection by confocal microscopy
The fluorescence properties of y-nPS were also used to localize these nanoparticles inside Caco-2 cells by confocal microscopy. As shown in Fig. 4, y-nPS were found inside the cells at all of the assayed concentrations. In addition, y-nPS were also detected inside the cell nuclei, independent of the concentration tested. Accordingly, y-nPS particles were not only able to enter the cells, but also reached the nucleus even at the lowest concentration of 1 μg mL−1, as observed in sequential slides of the nucleus. Images show that the uptake of y-nPS in Caco-2 cells occurred in a concentration-dependent manner, as we found a greater accumulation within the cells at higher exposure concentrations.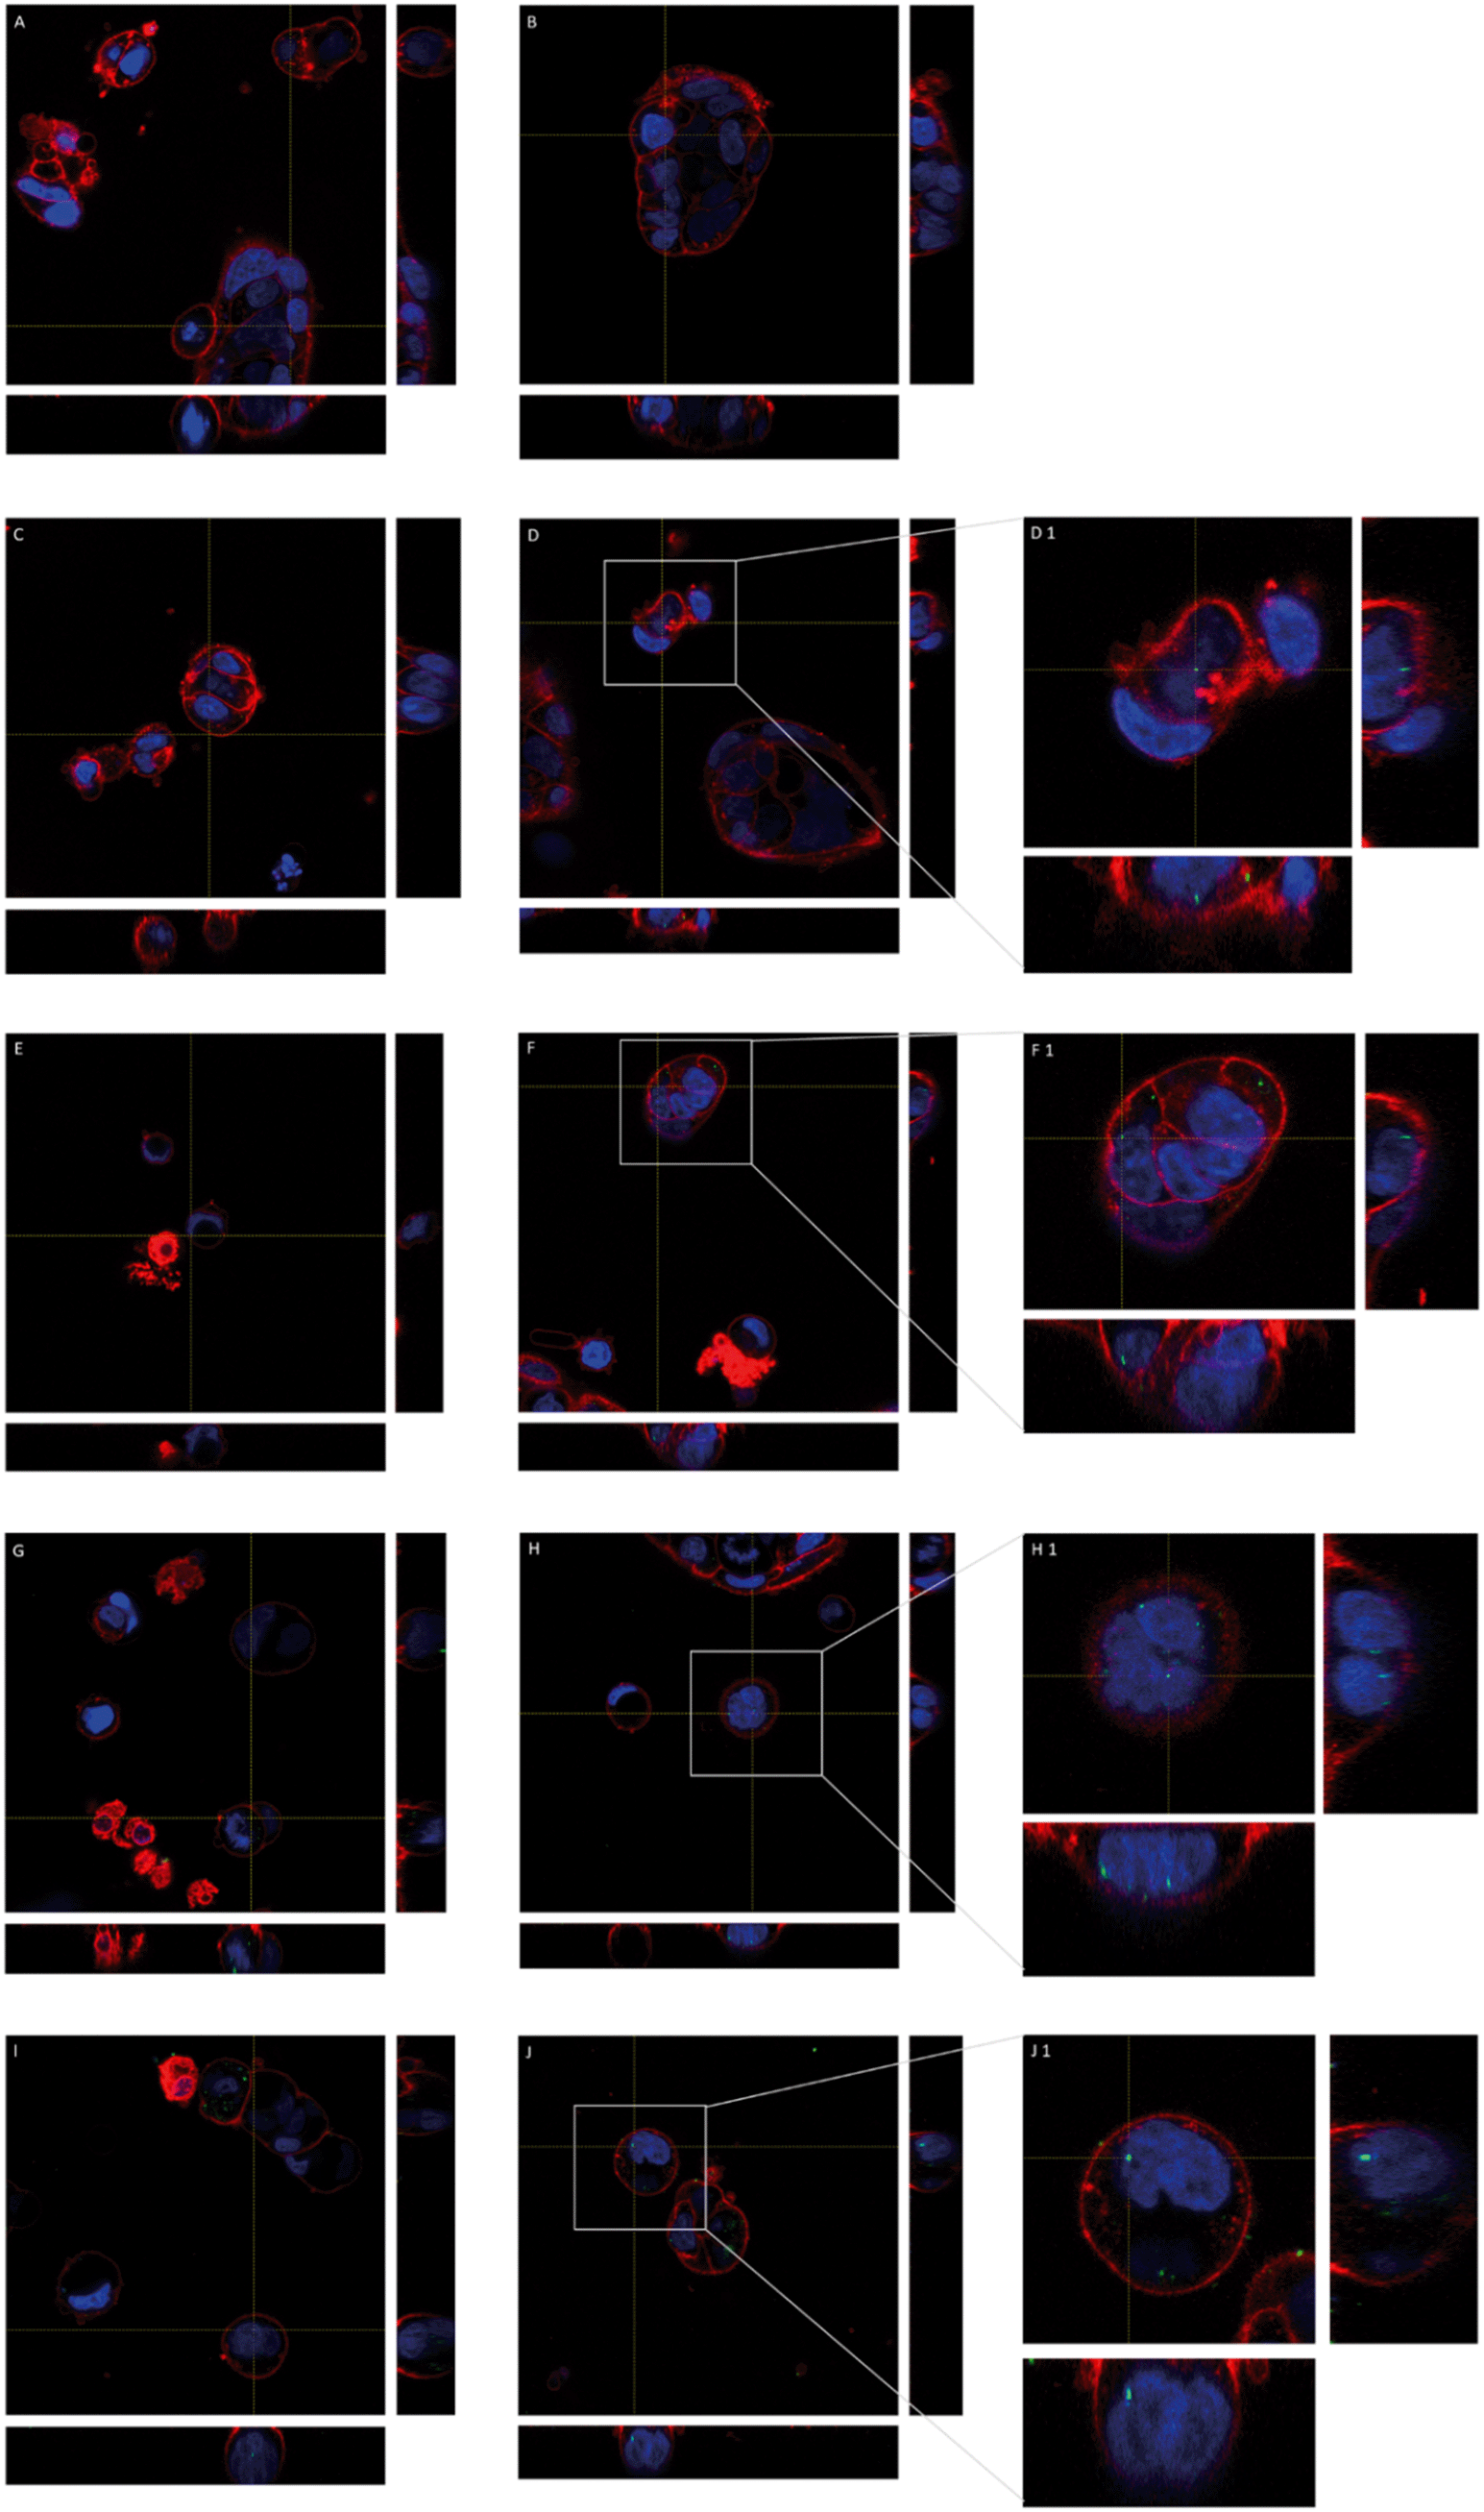 | ||
| Fig. 4 Three-dimensional images of the undifferentiated Caco-2 cells taken with confocal microscopy after exposure to y-nPS lasting for 24 h. Nuclei (in blue) were stained with Hoechst and cell membranes (in red) were stained with CellMask. Nanoparticles are shown in green. Yellow lines point out the plane from where the orthogonal views are projected. Images A and B correspond to unexposed barriers while C and D, E and F, G and H, and I and J correspond to barriers exposed to 1, 25, 50 and 100 μg mL−1 y-nPS, respectively. Images D1, F1, H1 and J1 show a zoomed area of images D, F, H and J, respectively, as indicated by grey squares. | ||
Cellular uptake detection by using TEM
In addition to the previous uptake studies using the fluorescent y-nPS, the uptake of nPS was assessed by TEM. As observed in Fig. 5, noticeable amounts of nPS were detected inside the Caco-2 cells at all the concentrations tested. The cells' morphology in the untreated control presented a well-organized nucleus and nucleolus, mitochondria with regular cristae and regular cellular membranes. However, nPS-exposed cells showed some structural differences even at the lowest concentration. At 1 μg mL−1, nPS induced the appearance of dark, electron-dense structures in the perinuclear region (yellow arrows), which are also visible at higher exposure concentrations. Higher concentrations increased the accumulation of electron-dense vacuoles and lysosomes in the cytoplasm (green arrows), which show a very distinct particulate nature at 25 μg mL−1. The two highest concentrations also seem to induce the swelling of mitochondrial cristae (violet arrows), as these organelles show empty spaces in their inner membranes.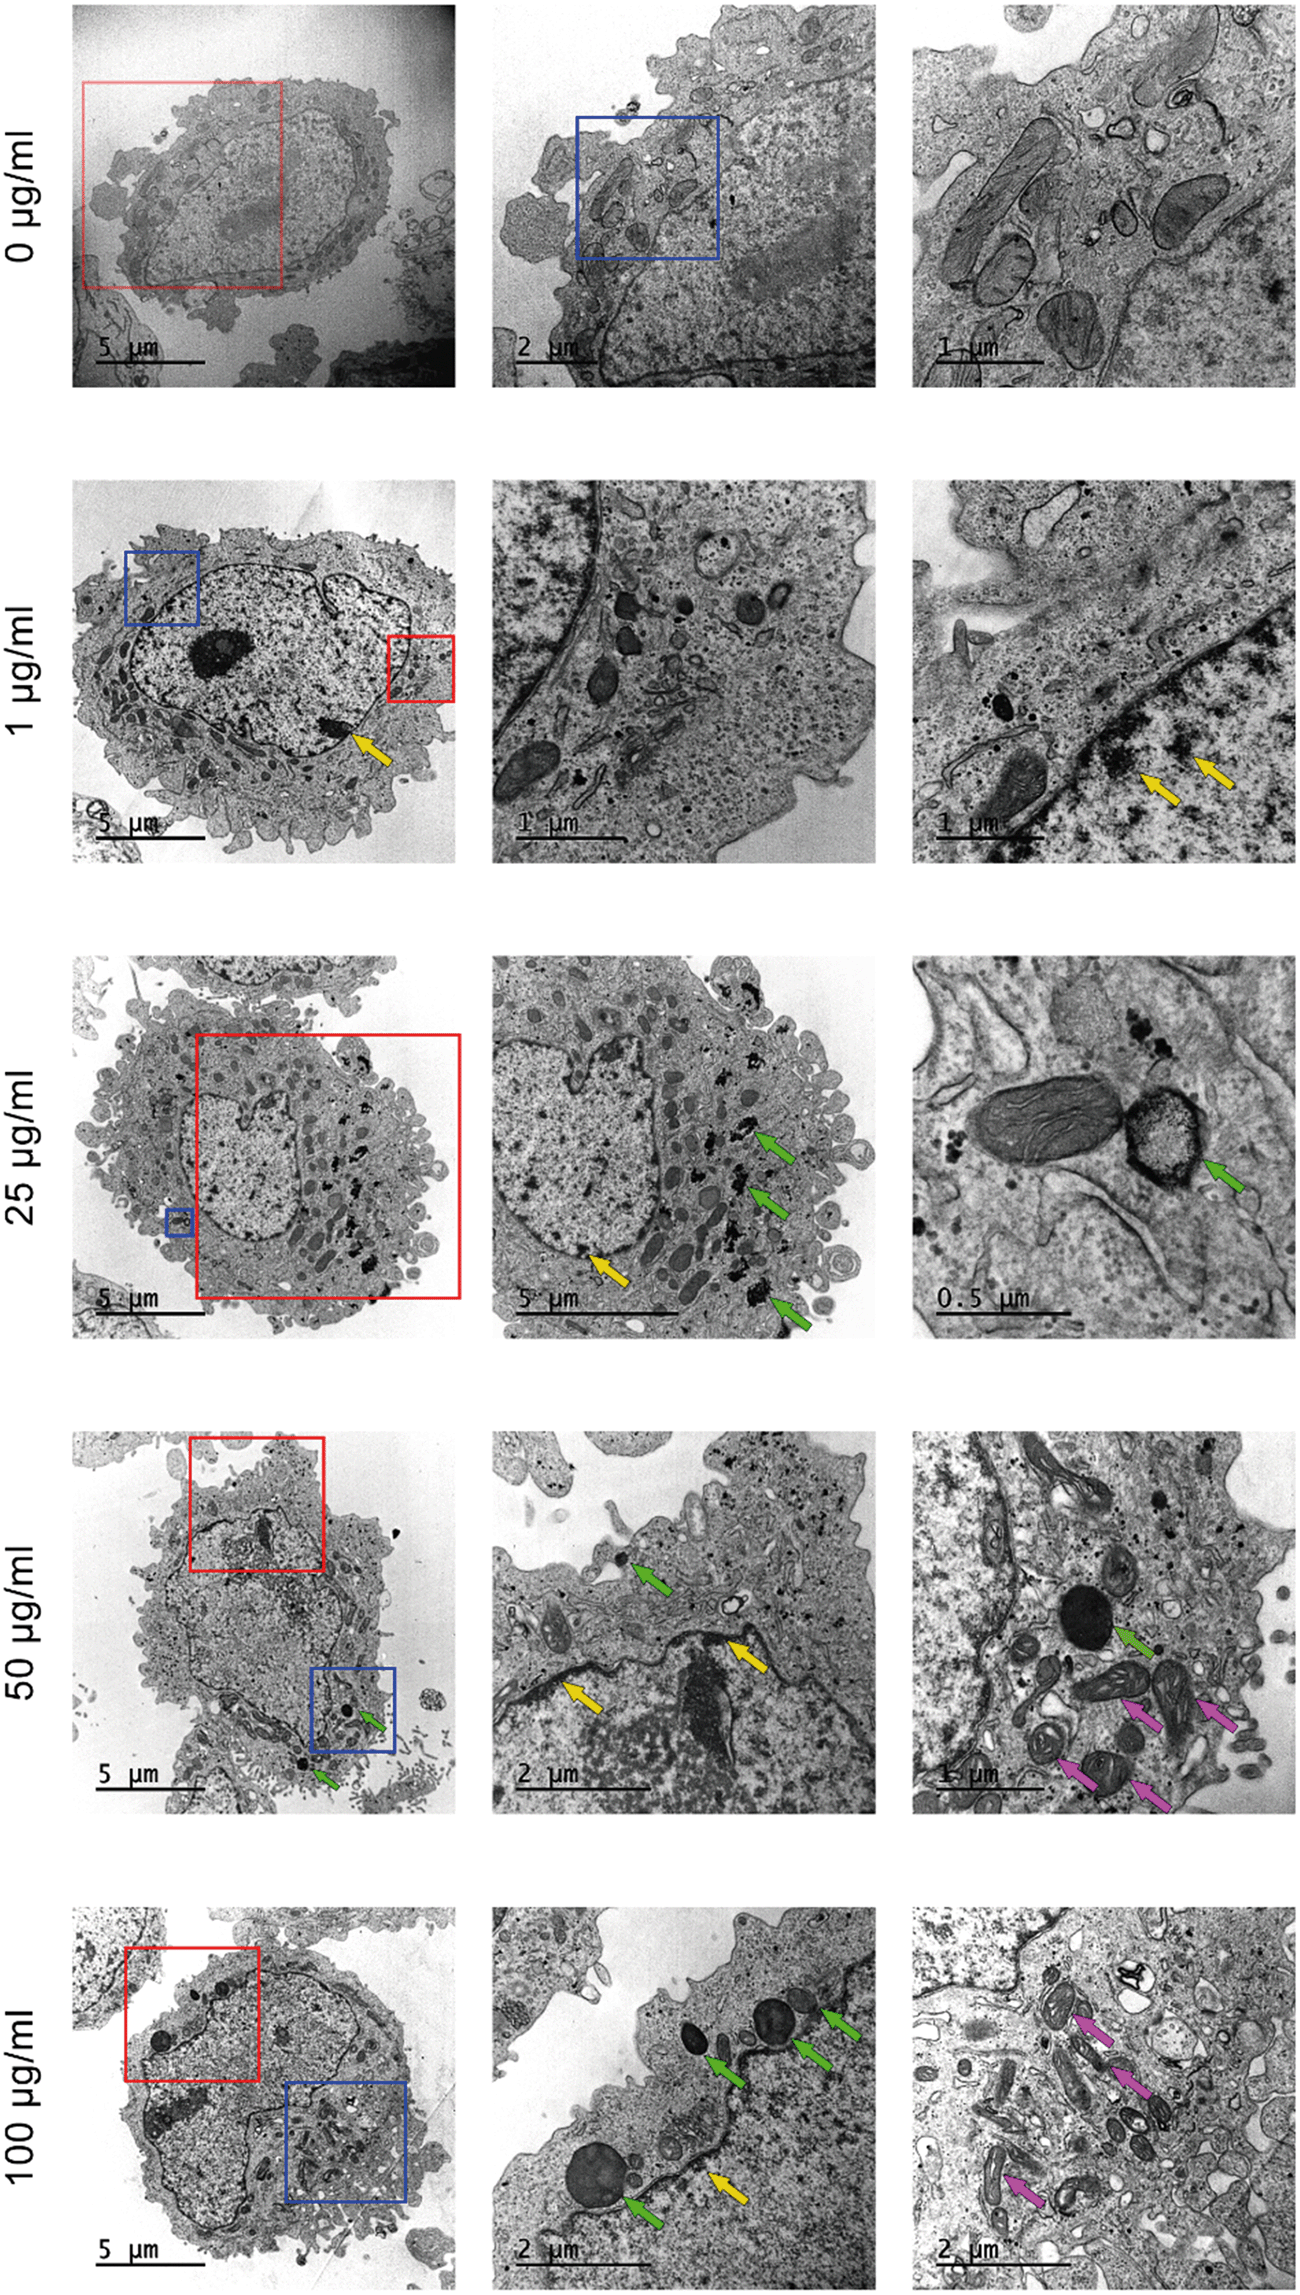 | ||
| Fig. 5 Transmission electron microscopy images of Caco-2 cells after 24 h exposure to increasing concentrations of nPS. The micrographs on the left column were taken at 8000× and show the whole cell, while the second and third columns show higher magnifications of the same cell enclosed in the red and blue squares, respectively. Dark, electron-dense structures in the perinuclear region (yellow arrows) accumulate in vacuoles and lysosomes (green arrows). High concentrations induce the swelling of mitochondrial cristae (violet arrows). | ||
Summarizing, our results demonstrate that nPS uptake induces some subcellular responses that increase in a dose-dependent manner.
Mitochondrial stress assessment
To assess whether the mitochondrial swelling observed in the TEM images could reflect impairment in their function, we analyzed the function of these organelles using two different methods. On the one hand, the stability of the mitochondrial membrane potential was assessed with the MitoProbe™ assay, while the MitoSox™ assay was used to evaluate the production of mitochondrial ROS. As shown in Fig. 6A the mitochondrial membrane potential tends to significantly increase in the samples exposed to nPS after 24 h. In spite of that, the levels of mitochondrial ROS did not change after these exposures (Fig. 6B), even though our positive control (antimycin A) showed a significant increase in the fluorescence emission.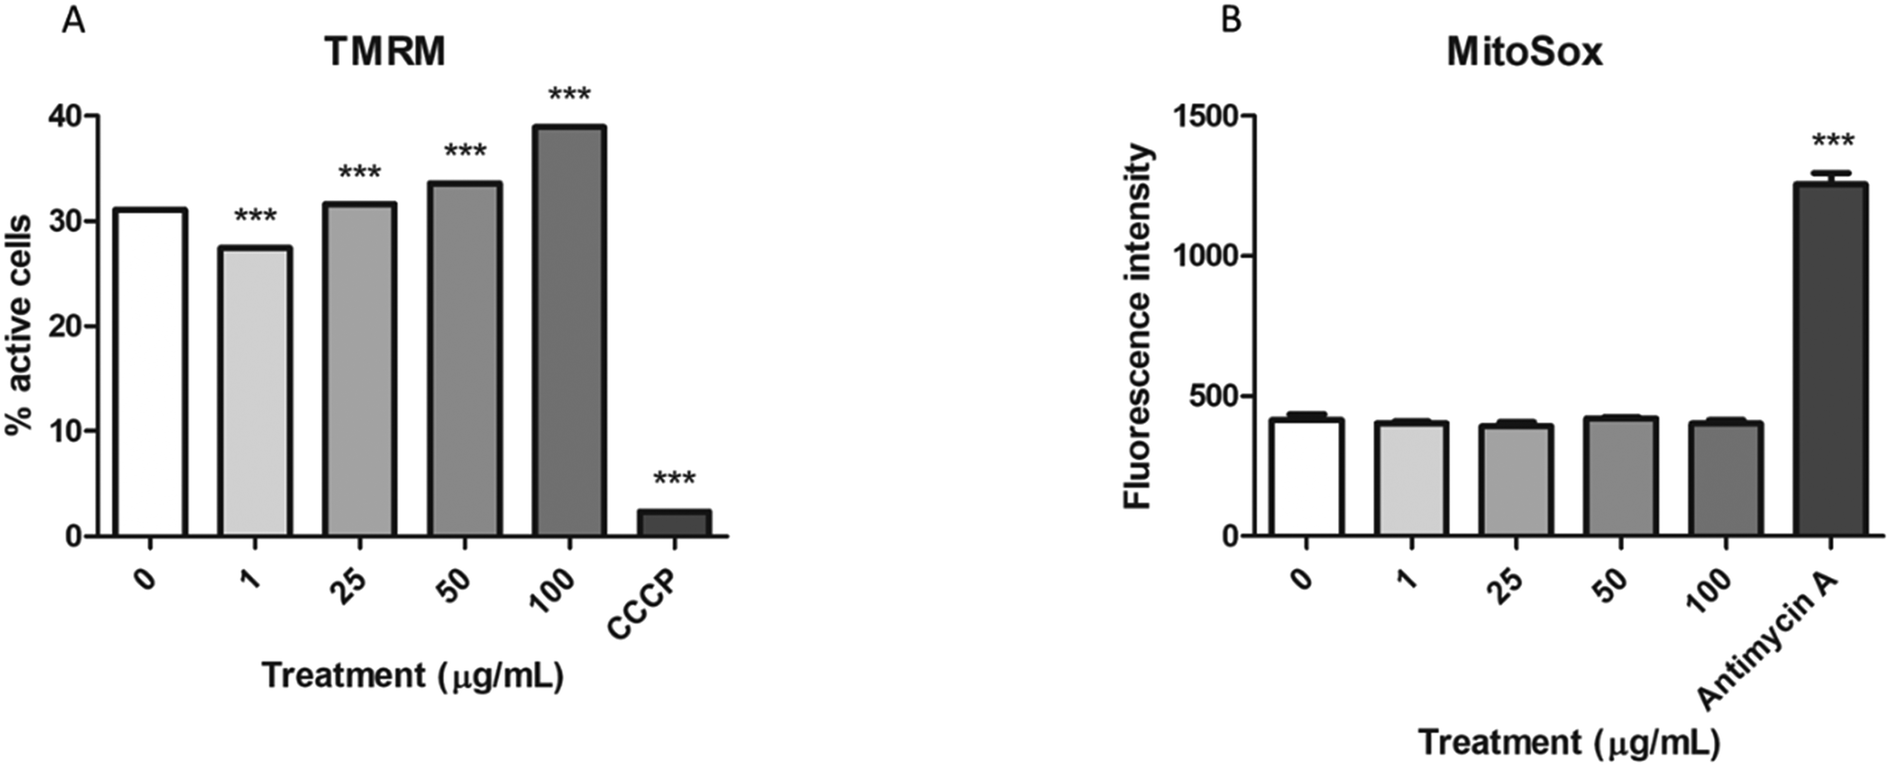 | ||
| Fig. 6 Changes in mitochondrial metabolism in response to nPS exposure. A) Measurements of the mitochondrial membrane potential after the exposure of Caco-2 cells to 0–100 μg mL−1 of nPS for 24 h. Carbonyl cyanide m-chlorophenyl hydrazone (50 μM, CCCP) was used as a positive control for membrane destabilization. The mitochondrial membrane potential is represented as the percentage of active cells, and data are analysed by the chi-squared test. B) Production of mitochondrial ROS after the exposure of Caco-2 cells to 0–100 μg mL−1 of nPS for 24 h. ROS formation is represented as the mean fluorescence intensity ± SEM. Antimycin A (94 μM) was used as a positive control. | ||
Production of intracellular ROS
The DCFH-DA assay was used to measure the levels of intracellular ROS in the Caco-2 cells after the exposure to nPS, and ROS production was extrapolated from the fluorescence intensity relative to the negative control. As shown in Fig. 7, the H2O2-exposed cells used as a positive control showed a significant increase in ROS levels. However, no significant ROS production was detected after the exposure of Caco-2 cells to any of the assayed concentrations of nPS. According to these results, nPS do not seem to produce oxidative stress on the human colorectal Caco-2 cells, under our experimental conditions.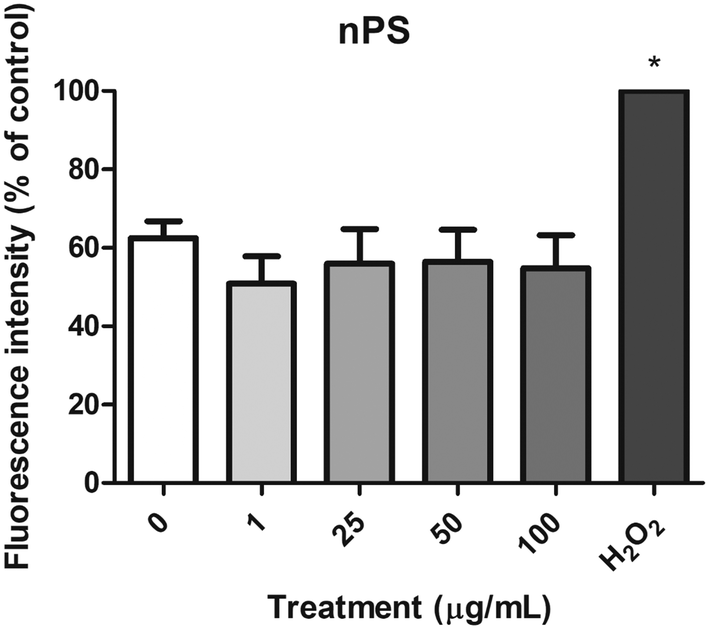 | ||
| Fig. 7 Relative ROS production in undifferentiated Caco-2 cells treated with 0–100 μg mL−1 nPS for 24 h using the DCFH-DA assay. H2O2 was used as a positive control. Data are represented as mean ± SEM and analyzed by one-way ANOVA with Dunnett's post-test (*P < 0.05). | ||
Genotoxic and oxidative DNA damage
The alkaline comet assay, complemented with the FPG enzyme, was used to assess the induction of both genotoxic and oxidative DNA damage after the exposure of Caco-2 cells to nPS.As shown in Fig. 8A, the percentage of DNA in the tail of Caco-2 cells exposed to nPS was not significantly higher than those observed in untreated cells. The 200 μM MMS positive control showed a high increase in the levels of DNA damage, supporting the suitability of the assay. On the other hand, the modified version of the comet assay using the FPG enzyme showed a slight direct dose–response tendency to increase the ODD, although this tendency does not reach statistical significance (Fig. 8B). Similar to that reported for the genotoxic damage, 5 mM KBrO3 (positive control) produced a significant increase in the ODD.
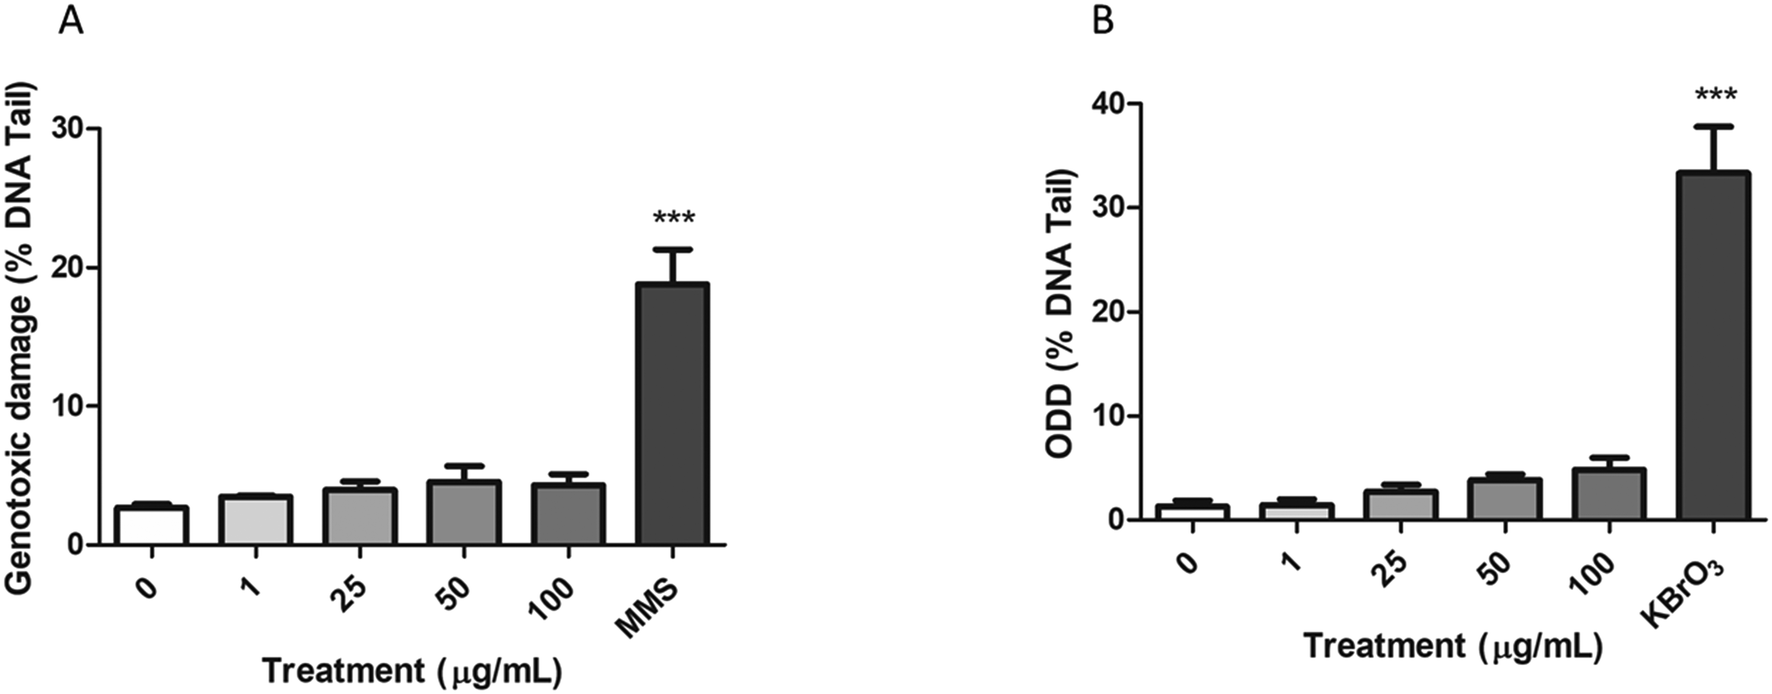 | ||
| Fig. 8 A. Genotoxic damage observed by the comet assay after 24 h of nPS exposure. 200 μM MMS was used as a positive control. B. Oxidative DNA damage (ODD) was detected using the FPG enzyme. 5 mM KBrO3 was used as a positive control. Data are represented as mean ± SEM and analyzed by one-way ANOVA with Dunnett's post-test (***P < 0.001; *P < 0.05). | ||
Chromosome damage (micronucleus induction)
The FCMN assay was used to measure the ability of nPS to induce chromosome breaks and/or chromosome loss. The obtained results for the four concentrations tested are shown in Fig. 9. Data demonstrate that nPS exposure was not able to induce significant increases in the frequency of micronuclei on the exposed Caco-2 cells. In contrast, cells treated with the MMC positive control showed a significant increase in the frequency of micronuclei, indicating the suitability of the assay to assess the chromosomal damage.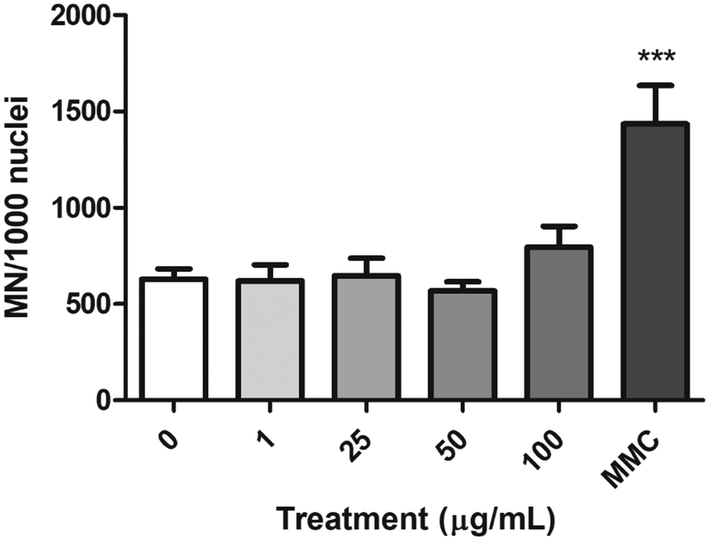 | ||
| Fig. 9 Chromosome damage, as detected using the micronuclei (MN) test, in undifferentiated Caco-2 cells treated with 0–100 μg mL−1 nPS for 48 h. Results are indicated as the frequency of micronuclei in 1000 cell's nuclei. 0.4 μg mL−1 MMC was used as a positive control. Data are represented as mean ± SEM and analyzed by one-way ANOVA with Dunnett's post-test (***P < 0.001). | ||
Analysis of gene expression by real-time RT-PCR
Real-time RT-PCR was used to assess the changes in the expression of different genes associated with different pathways of cellular stress. The effects of 24 h (A) and 48 h (B) are indicated in Fig. 10. As observed, from the ROS-related genes (HO1, SOD2, and GSTP1) only HO1 expression show significant changes after the exposure to nPS for both exposure times. On the other hand, although we could not find significant changes in the expression levels of the HSP70 gene, an indicator of general stress induction, after exposure for 24 h, effects attained statistical significance when exposure was extended to 48 h. Finally, the expression of two inflammatory-response genes was analyzed. As observed in the figure, although neither the expression of IL-1β nor that of IL-8 showed significant changes after the exposure to nPS, effects were more marked in the exposure for 48 h when compared to the untreated control.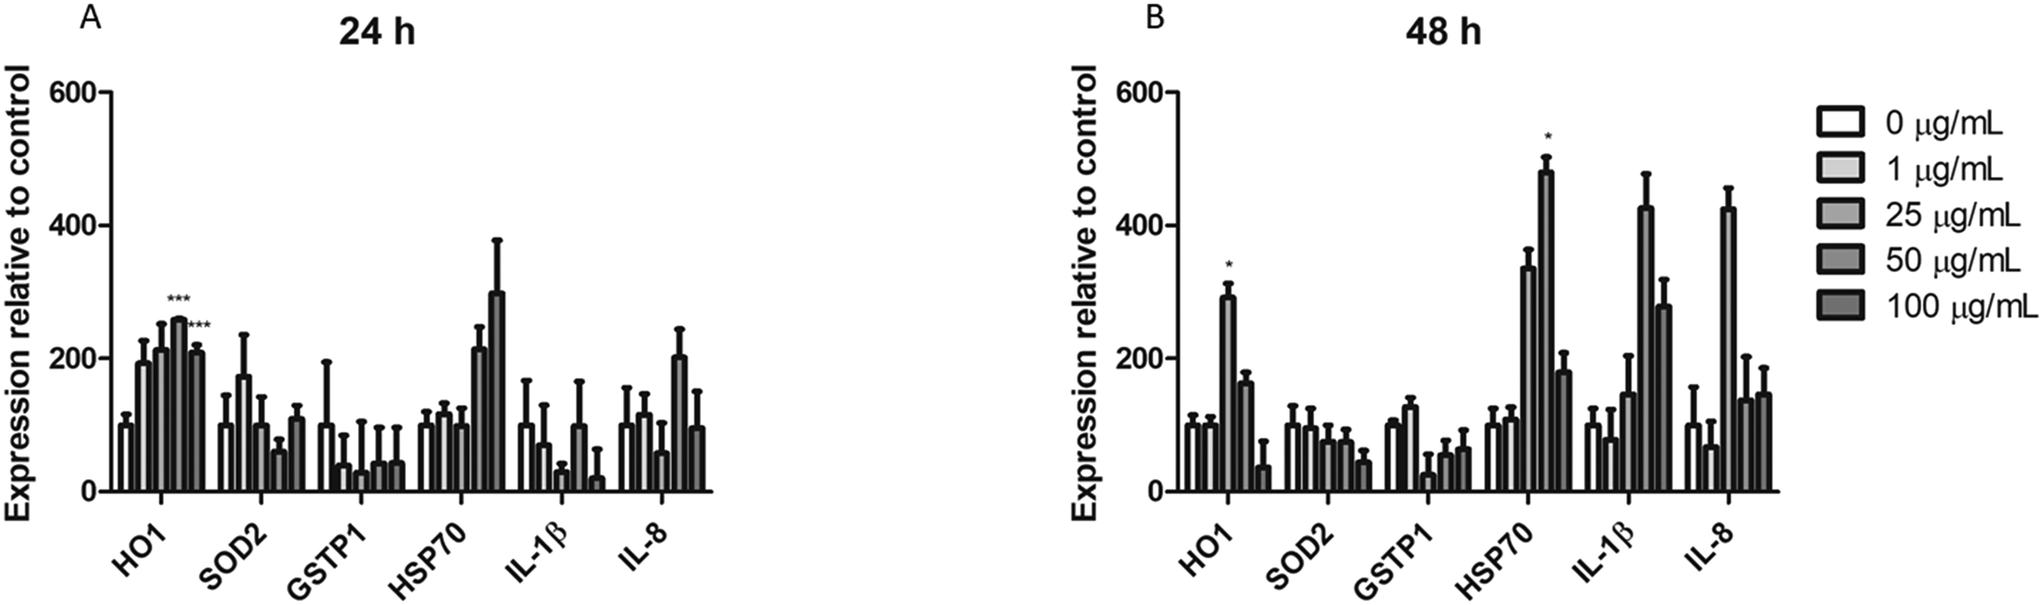 | ||
| Fig. 10 Relative mRNA expression analysis by real-time RT-PCR. Undifferentiated Caco-2 cells were exposed to 0–100 μg mL−1 nPS for 24 (A) and 48 (B) h and the expression of HO1, SOD2, GSTP1, HSP70, IL-1β and IL-8 was analyzed. Data are represented as mean ± SEM and analyzed by Student's t-test (***P < 0.001, *P < 0.005). | ||
Discussion
Polymers represent one of the most important sources of environmental pollution. In addition to the visible part of this environmental contamination, plastics degrade to micro and nano sizes (MNPLs) forming non-visible environmental pollutants. At these sizes, their physicochemical characteristics, as well as their biological impacts, can be different from those induced in their bulk forms. Humans can be exposed to MNPLs through the food chain or through other routes such as air or tap water.16,17 Independent of the exposure route, MNPLs could represent a real health risk for humans.8,18With this exposure scenario, more information is required to evaluate the potential hazard of MNPLs on human health. Surprisingly, the number of studies using human cells to evaluate the biological effects associated with MNPL exposure is very scarce. Although many different human cell lines can be used to determine the adverse effects of MNPLs, cells representing potential exposure targets should be the first option. Taking into account that ingestion is assumed to be an important route of exposure to MNPLs, the use of intestinal cells represents a sound choice. Among these potential target cells, the Caco-2 cell line emerges. This cell line is commonly used in in vitro studies to assess the toxicity of nanomaterials in intestinal cells.19–21 A review of the studies evaluating the potential detrimental effects of MNPLs in Caco-2 cells reveals that only five studies have been reported until now, but using different approaches.22–26 All of them tested PS as a model of MNPLs and used differentiated Caco-2 cells, with the exception of two studies that, as in our study, used undifferentiated cells.25,26 Toxicity, uptake, and translocation were the main assessed targets, but so far the potential genotoxicity of nPS has not been evaluated. It must be pointed out that genotoxicity, is a very important toxicological endpoint, mainly because it can be used as a surrogate biomarker of carcinogenesis, and other genetic-associated pathologies.27 Additionally, genotoxicity data have become a regulatory requirement for all new chemical substances, as the carcinogenicity and inherited effects of the new compounds are considered as major public health concerns. Accordingly, the genotoxicity studies reported in this work can be considered a piece of relevant information in the evaluation of the health risk associated with MNPL exposure.
Under our experimental conditions, nPS do not to exert significant toxic effects on our cell model, independent of the exposure time (24 or 48 h). This agrees with other recent studies carried out with undifferentiated Caco-2 cells, where no toxic effects were observed. These studies used the release of the cytosolic enzyme lactate dehydrogenase as the cytotoxic endpoint after 100 μg mL−1 nPS exposure up to 72 h,25 or up to 30 μg mL−1 in exposure lasting for 96 h.26 Consequently, we conclude that nPS are non-cytotoxic to undifferentiated Caco-2 cells. It should be noted that the use of –NH2-functionalized PS showed concentration-dependent cytotoxicity, but not –COOH-functionalized PS.25 Furthermore, the lack of PS cytotoxic effects has also been observed in other cell lines, such as the brain (T98G) and the epithelial (HeLa) human cell lines.28 In spite of this low cytotoxicity of PS, changes in the levels of expression of the HSP70 gene, used as a general indicator of stress induction,29 were observed mainly in exposure for 48 h. In the same direction, the changes observed in the levels of expression of genes involved in the inflammatory response (mainly for IL-1β 48 h after exposure) support a slight induction of cellular stress. Immune responses especially inflammatory responses play a key role in the regulation of mechanisms of normal tissue toxicity.30
In spite of the absence of toxicity, nPS are clearly internalized in a concentration-dependent manner, as shown by using three different methodological approaches. The use of fluorescent y-nPS allowed us to demonstrate by flow cytometry that the percentage of cells uptaking y-nPS, as well as the amount of internalized y-nPS per cell, increases in a concentration-dependent manner. This methodological approach was also used by Magrì et al. with similar results.26 Interestingly, our results indicate that after 24 h of exposure more than 80% of the cells have internalized y-nPS.
Confocal microscopy is considered a very good method to detect the cellular uptake and the cell distribution of nanomaterials.31 Using this approach, we have confirmed the internalization of y-nPS in Caco-2 cells. These results agree with previous studies that used the same methodology to show that the uptake rate is indirectly related to size,22 and that aggregates of y-nPS are collected in endosomes or lysosomes.22,26 Interestingly, our confocal images demonstrate the internalization of y-nPS in the cell nucleus. This internalization was confirmed by analyzing the sequential slides covering all the nucleus volume. To confirm the uptake of non-fluorescent PS by Caco-2 cells, we used TEM. Our results show that non-fluorescent nPS also internalize into the cells. As observed in the TEM images, nPS exposure induces the appearance of electrodense vesicles in the cytoplasm as well as the formation of electrodense regions in the nuclear membrane, although the presence of nPS in these structures could not be confirmed by the TEM images. Interestingly, we also observed ultrastructural changes at the mitochondrial level in the TEM images caused by nPS exposure. These types of anomalies are similar to those reported in human Beas-2B cells exposed to cationic-PS nanoparticles, where swelling of this organelle and disappearance of its cristae were reported. Although other authors could not detect dose-dependency (they only use one dose), they detected a direct exposure time association.32 The effects on mitochondria as a result of PS exposure have also been observed recently after in vivo exposure of zebrafish embryos, where this type of mitochondrial damage was reported in both retina and brain tissues.33 Further experiments to demonstrate alterations in the mitochondrial metabolism showed that, although the levels of mitochondrial superoxide production were not increased, a significant increase of the mitochondrial membrane potential was observed. Increases in mitochondrial membrane potential have been associated with mitochondrial permeability transition pore regulation, which serves as a resistance mechanism for stress-induced mitochondrial apoptosis.34
Once the uptake is confirmed, it is important to assess if there are potential biological effects. Among the different biological endpoints, the induction of intracellular oxidative stress is the usual candidate. Different studies point out the induction of oxidative stress in cultured cells after PS exposure, by directly detecting the generation of superoxide ions,28 or indirectly by explaining the observed induction of apoptosis.22 In addition, in vivo induction has also been reported in aquatic organisms such as Mytilus galloprovincialis, where the total oxidized status increased in the digestive glands, and the esterase activity increased in the gills.35 Furthermore, the observed changes in the levels of glutathione reductase and catalase were considered as indicative of oxidative stress induction in Artemia salina.36 In spite of these positive reports, we were unable to demonstrate the induction of oxidative stress in our study using the fluorimetric DCFH-DA assay. It should be emphasized that the DCFH-DA has a wide ROS spectrum, reacting with H2O2, ONOO−, lipid hydroperoxides and, to a lesser extent, with superoxide. The DCFH-DA goes into the cytoplasm being deacetylated by a nonspecific esterase and is further oxidized in the presence of ROS to the green fluorescent product 2′,7′-dichlorofluorescein (DCF).37 Interestingly, our negative results perfectly match with those obtained in Caco-2 cells using the same assay.26 Thus, the potential ability of PS to induce ROS should be further evaluated using other methodological approaches. The clear positive induction of ROS observed in our study, when the H2O2 positive control was used, supports the suitability of the assay to evaluate the oxidative stress status of Caco-2 cells. We have confirmed this absence of oxidative stress analyzing the changes in the expression levels of SOD2, and GSTP1 genes related to ROS The lack of significant changes in the expression of such genes would confirm the low or absence of oxidative stress induction associated with PS exposure. Nonetheless, the behavior of the HO1 gene, for both 24 and 48 h exposure times, is especially interesting, as it correlates to both the mRNA and protein level increase in response to oxidative stress conditions.38 This could mean that even though an increase in ROS levels was not directly detected, some underlying stress-response processes are occurring as response to PS exposure. This is supported by an increase of both general stress markers, HO1 and HSP70.
Genotoxicity should also be a relevant endpoint assessed when evaluating the adverse effects caused by MNPL exposure. Surprisingly, only five studies have been reported using this biomarker. Four of them used in vivo data in aquatic organisms,35,39–41 and the fifth used human lymphocytes, but without reporting experimental data.36 Three of the above studies used the comet assay and reported positive induction of DNA damage in the hemocytes of mussels,35,39 or clams.40 This reported positive induction does not match with our results in Caco-2 cells. The weak genotoxic potential of nPS observed in our study is corroborated by the use of the FPG enzyme to try to identify specific oxidative damage affecting DNA bases. Thus, although a weak concentration-dependent tendency to increase the levels of oxidatively-damaged DNA was observed, these effects do not reach statistical significance. In spite of the many advantages of the comet assay, including its high sensitivity, the assay is sometimes criticized for the tendency to produce false positive results. This has been mainly discussed for nanomaterials where their presence in the head, or in the tail of the comet, can interfere with the scoring.42 This has been confirmed for PS. In this case, removal of the PS (and other nanomaterials) from the cytoplasm was effective in eliminating the genotoxicity overestimation. The comparison of the standard comet method and the FPG modification clearly demonstrated a reduction in the levels of DNA damage when PS and other nanomaterials were removed from the cytoplasm.43
To have a more strict view of the real genotoxic potential of PS, the use of complementary genotoxicity tests can be helpful. In our case, we have chosen the micronucleus (MN) test due to the strong consistency between the comet and micronucleus assays for a range of different nanomaterials.42 Even though the two tests measure different endpoints, both can be trusted in assessing the genotoxicity of nanomaterials and could constitute a minimum battery of tests measuring genotoxicity of MNPLs. Regarding the use of the MN assay to detect the genotoxic potential of MNPLs, only two studies have been reported, and both give negative results. In mussels, exposure to PS resulted in negative MN induction in their hemocytes.39 Similar results were reported in zebra mussels, where the exposure to PS did not induce an increase in the MN frequency in their hemocytes.41 According to these results and our data, we can confirm the absence of chromosome damage induction after PS exposure. It should be noted that increased MN frequencies in humans are associated with increased cancer risk, providing suggestive evidence that this biomarker could have a predictive value.44
Summarizing, we can conclude that, although human intestinal Caco-2 cells are able to uptake and internalize a relevant amount of PS, the related biological effects detected were not statistically significant. Thus, neither toxic effects nor the induction of intracellular presence of ROS were observed in the range of 1–100 μg mL−1. Furthermore, the inclusion of two complementary genotoxicity assays, the comet assay (measuring mainly DNA breaks) and the MN (measuring chromosome breaks and/or chromosome loss), confirm that nPS exposure is not able to induce significant effects on DNA integrity.
Author contributions
CC, RM and AH planned the experiments. JD, CC, MS and SP carried out the experimental part. CC and JD analysed the data, carried out the statistical analysis, and prepared the tables/figures. CC, JD, AH and RM wrote the final manuscript.Conflicts of interest
The authors declare that there is no conflict of interest.Acknowledgements
J. Domenech was supported by a Predoctoral Fellowship (PIF) from the Universitat Autònoma de Barcelona. We thank Dr. Victor Puntes' group (Inorganic Nanoparticles Group, ICN2) for providing the protocol to characterize PS nanoparticles.References
- S. Lambert and M. Wagner, Formation of microscopic particles during the degradation of different polymers, Chemosphere, 2016, 161, 510–517 CrossRef CAS PubMed.
- C. Ioakeimidis, K. N. Fotopoulou, H. K. Karapanagioti, M. Geraga, C. Zeri, E. Papathanassiou, F. Galgani and G. Papatheodorou, The degradation potential of PET bottles in the marine environment: An ATR-FTIR based approach, Sci. Rep., 2016, 6, 23501 CrossRef CAS PubMed.
- B. Silva, A. S. Bastos, C. I. L. Justino, J. P. da Costa, A. C. Duarte and T. A. P. Rocha-Santos, Microplastics in the environment: Challenges in analytical chemistry -A review, Anal. Chim. Acta, 2018, 1017, 1–19 CrossRef PubMed.
- C. Prata, Airborne microplastics: Consequences to human health?, Environ. Pollut., 2018, 234, 115–126 CrossRef PubMed.
- V. Hidalgo-Ruz, L. Gutow, R. C. Thompson and M. Thiel, Microplastics in the marine environment: a review of the methods used for identification and quantification, Environ. Sci. Technol., 2012, 46(6), 3060–3075 CrossRef CAS PubMed.
- S. Lambert, C. Sinclair and A. Boxall, Occurrence, degradation, and effect of polymer-based materials in the environment, Rev. Environ. Contam. Toxicol., 2014, 227, 1–53 CrossRef CAS PubMed.
- H. Lee, W. J. Shim and J. H. Kwon, Sorption capacity of plastic debris for hydrophobic organic chemicals, Sci. Total Environ., 2014, 470-471, 1545–1552 CrossRef CAS PubMed.
- S. L. Wright and F. J. Kelly, Plastic and human health: A micro issue?, Environ. Sci. Technol., 2017, 51(12), 6634–6647 CrossRef CAS PubMed.
- S. Rist, B. Carney Almroth, N. B. Hartmann and T. M. Karlsson, A critical perspective on early communications concerning human health aspects of microplastics, Sci. Total Environ., 2018, 626, 720–726 CrossRef CAS PubMed.
- S. Anbumani and P. Kakkar, Ecotoxicological effects of microplastics on biota: a review, Environ. Sci. Pollut. Res., 2018, 25(15), 14373–14396 CrossRef CAS PubMed.
- Y. Chae and Y. J. An, Effects of micro- and nanoplastics on aquatic ecosystems: Current research trends and perspectives, Mar. Pollut. Bull., 2017, 124(2), 624–632X CrossRef CAS PubMed.
- H. Bouwmeester, P. C. Hollman and R. J. Peters, Potential health impact of environmentally released micro- and nanoplastics in the human food production chain: experiences from Nanotoxicology, Environ. Sci. Technol., 2015, 49(15), 8932–8947 CrossRef CAS PubMed.
- X. Mao, T. H. Nguyen, M. Lin and A. Mustapha, Engineered nanoparticles as potential food contaminants and their toxicity to Caco-2 cells, J. Food Sci., 2016, 81(8), T2107–T2113 CrossRef CAS PubMed.
- B. Annangi, J. Bach, G. Vales, L. Rubio, R. Marcos and A. Hernández, Long-term exposures to low doses of cobalt nanoparticles induce cell transformation enhanced by oxidative damage, Nanotoxicology, 2015, 9(2), 138–147 CrossRef CAS PubMed.
- S. L. Avlasevich, S. M. Bryce, S. E. Cairns and S. D. Dertinger, In vitro micronucleus scoring by flow cytometry: differential staining of micronuclei versus apoptotic and necrotic chromatin enhances assay reliability, Environ. Mol. Mutagen., 2006, 47(1), 56–66 CrossRef CAS PubMed.
- R. H. Waring, R. M. Harris and S. C. Mitchell, Plastic contamination of the food chain: A threat to human health?, Maturitas, 2018, 115, 64–68 CrossRef CAS PubMed.
- M. Pivokonsky, L. Cermakova, K. Novotna, P. Peer, T. Cajthaml and V. Janda, Occurrence of microplastics in raw and treated drinking water, Sci. Total Environ., 2018, 643, 1644–1651 CrossRef CAS PubMed.
- R. Lehner, C. Weder, A. Petri-Fink and B. Rothen-Rutishauser, Emergence of nanoplastic in the environment and possible impact on human health, Environ. Sci. Technol., 2019, 53(4), 1748–1765 CrossRef CAS PubMed.
- K. Gerloff, C. Albrecht, A. W. Boots, I. Förster and R. P. F. Schins, Cytotoxicity and oxidative DNA damage by nanoparticles in human intestinal Caco-2 cells, Nanotoxicology, 2009, 3(4), 355–364 CrossRef CAS.
- A. Tarantini, R. Lanceleur, A. Mourot, M. T. Lavault, G. Casterou, G. Jarry, K. Hogeveen and V. Fessard, Toxicity, genotoxicity and proinflammatory effects of amorphous nanosilica in the human intestinal Caco-2 cell line, Toxicol. In Vitro, 2015, 29(2), 398–407 CrossRef CAS PubMed.
- M. van der Zande, A. K. Undas, E. Kramer, M. P. Monopoli, R. J. Peters, D. Garry, E. C. Antunes Fernandes, P. J. Hendriksen, H. J. P. Marvin, A. A. Peijnenburg and H. Bouwmeester, Different responses of Caco-2 and MCF-7 cells to silver nanoparticles are based on highly similar mechanisms of action, Nanotoxicology, 2016, 10(10), 1431–1441 CrossRef CAS PubMed.
- A. Thubagere and B. M. Reinhard, Nanoparticle-induced apoptosis propagates through hydrogen-peroxide-mediated bystander killing: insights from a human intestinal epithelium in vitro model, ACS Nano, 2010, 4(7), 3611–3622 CrossRef CAS PubMed.
- G. J. Mahler, M. B. Esch, E. Tako, T. L. Southard, S. D. Archer, R. P. Glahn and M. L. Shuler, Oral exposure to polystyrene nanoparticles affects iron absorption, Nat. Nanotechnol., 2012, 7(4), 264–271 CrossRef CAS PubMed.
- A. P. Walczak, E. Kramer, P. J. Hendriksen, P. Tromp, J. P. Helsper, M. van der Zande, I. M. Rietjens and H. Bouwmeester, Translocation of differently sized and charged polystyrene nanoparticles in in vitro intestinal cell models of increasing complexity, Nanotoxicology, 2015, 9(4), 453–461 CrossRef CAS PubMed.
- I. Inkielewicz-Stepniak, L. Tajber, G. Behan, H. Zhang, M. W. Radomski, C. Medina and M. J. Santos-Martinez, The role of mucin in the toxicological impact of polystyrene nanoparticles, Materials, 2018, 11(5), 724 CrossRef PubMed.
- D. Magrì, P. Sánchez-Moreno, G. Caputo, F. Gatto, M. Veronesi, G. Bardi, T. Catelani, D. Guarnieri, A. Athanassiou, P. P. Pompa and D. Fragouli, Laser ablation as a versatile tool to mimic polyethylene terephthalate nanoplastic pollutants: characterization and toxicology assessment, ACS Nano, 2018, 12(8), 7690–7700 CrossRef PubMed.
- S. P. Jackson and J. Bartek, The DNA-damage response in human biology and disease, Nature, 2009, 461, 1071–1078 CrossRef CAS PubMed.
- G. F. Schirinzi, I. Pérez-Pomeda, J. Sanchís, C. Rossini, M. Farré and D. Barceló, Cytotoxic effects of commonly used nanomaterials and microplastics on cerebral and epithelial human cells, Environ. Res., 2017, 159, 579–587 CrossRef CAS PubMed.
- M. Gualtieri, P. Mantecca, F. Cetta and M. Camatini, Organic compounds in tire particle induce reactive oxygen species and heat-shock proteins in the human alveolar cell line A549, Environ. Int., 2008, 34(4), 437–442 CrossRef CAS PubMed.
- M. Najafi, E. Motevaseli, A. Shirazi, G. GerailyG, A. Rezaeyan, F. Norouzi, S. Rezapoor and H. Abdollahi, Mechanisms of inflammatory responses to radiation and normal tissues toxicity: clinical implications, Int. J. Radiat. Biol., 2018, 94(4), 335–356 CrossRef CAS PubMed.
- A. García-Rodríguez, L. Vila, A. Hernández and R. Marcos, Exploring the usefulness of the complex in vitro intestinal epithelial model Caco-2/HT29/Raji-B in nanotoxicology, Food Chem. Toxicol., 2018, 113, 162–170 CrossRef PubMed.
- T. Xia, M. Kovochich, M. Liong, J. I. Zink and A. E. Nel, Cationic polystyrene nanosphere toxicity depends on cell-specific endocytic and mitochondrial injury pathways, ACS Nano, 2008, 2, 85–96 CrossRef CAS PubMed.
- W. S. Lee, H. J. Cho, E. Kim, Y. H. Huh, H. J. Kim, B. Kim, T. Kang, J. S. Lee and J. Jeong, Bioaccumulation of polystyrene nanoplastics and their effect on the toxicity of Au ions in zebrafish embryos, Nanoscale, 2019, 11, 3173–3185 RSC.
- S. B. Song, S. Y. Jang, H. T. Kang, B. Wei, U. W. Jeoun, G. S. Yoon and E. S. Hwang, Modulation of mitochondrial membrane potential and ROS generation by nicotinamide in a manner independent of SIRT1 and mitophagy, Mol. Cells, 2017, 40(7), 503–514 CAS.
- I. Brandts, M. Teles, A. P. Gonçalves, A. Barreto, L. Franco-Martinez, A. Tvarijonaviciute, M. A. Martins, A. M. V. M. Soares, L. Tort and M. Oliveira, Effects of nanoplastics on Mytilus galloprovincialis after individual and combined exposure with carbamazepine, Sci. Total Environ., 2018, 643, 775–784 CrossRef CAS PubMed.
- P. Mishra, S. Vinayagam, K. Duraisamy, S. R. Patil, J. Godbole, A. Mohan, A. Mukherjee and N. Chandrasekaran, Distinctive impact of polystyrene nano-spherules as an emergent pollutant toward the environment, Environ. Sci. Pollut. Res., 2019, 26(2), 1537–1547 CrossRef CAS PubMed.
- L. Rubio, R. Marcos and A. Hernández, Nanoceria acts as antioxidant in tumoral and transformed cells, Chem.-Biol. Interact., 2018, 291, 7–15 CrossRef CAS PubMed.
- A. Loboda, M. Damulewicz, E. Pyza, A. Jozkowicz and J. Dulak, Role of Nrf2/HO-1 system in development, oxidative stress response and diseases: an evolutionarily conserved mechanism, Cell. Mol. Life Sci., 2016, 73(17), 3221–3247 CrossRef CAS PubMed.
- C. G. Avio, S. Gorbi, M. Milan, M. Benedetti, D. Fattorini, G. d'Errico, M. Pauletto, L. Bargelloni and F. Regoli, Pollutants bioavailability and toxicological risk from microplastics to marine mussels, Environ. Pollut., 2015, 198, 211–222 CrossRef CAS PubMed.
- F. Ribeiro, A. R. Garcia, B. P. Pereira, M. Fonseca, N. C. Mestre, T. G. Fonseca, L. M. Ilharco and M. J. Bebianno, Microplastics effects in Scrobicularia plana, Mar. Pollut. Bull., 2017, 122(1–2), 379–391 CrossRef CAS PubMed.
- S. Magni, F. Gagné, C. André, C. Della Torre, J. Auclair, H. Hanana, C. C. Parenti, F. Bonasoro and A. Binelli, Evaluation of uptake and chronic toxicity of virgin polystyrene microbeads in freshwater zebra mussel Dreissena polymorpha (Mollusca: Bivalvia), Sci. Total Environ., 2018, 631–632, 778–788 CrossRef CAS PubMed.
- H. L. Karlsson, S. Di Bucchianico, A. R. Collins and M. Dusinska, Can the comet assay be used reliably to detect nanoparticle-induced genotoxicity?, Environ. Mol. Mutagen., 2015, 56(2), 82–96 CrossRef CAS PubMed.
- D. Ferraro, U. Anselmi-Tamburini, I. G. Tredici, V. Ricci and P. Sommi, Overestimation of nanoparticles-induced DNA damage determined by the comet assay, Nanotoxicology, 2016, 10(7), 861–970 CrossRef CAS PubMed.
- S. Bonassi, R. El-Zein, C. Bolognesi and M. Fenech, Micronuclei frequency in peripheral blood lymphocytes and cancer risk: evidence from human studies, Mutagenesis, 2011, 26(1), 93–100 CrossRef CAS PubMed.
Footnote |
| † Both authors contributed equally to this work. |
| This journal is © The Royal Society of Chemistry 2020 |