
 Open Access Article
 This Open Access Article is licensed under a
 Creative Commons Attribution 3.0 Unported Licence
Multimodal X-ray microanalysis of a UFeO4: evidence for the environmental stability of ternary U(V) oxides from depleted uranium munitions testing†
Daniel E.
Crean
a,
Martin C.
Stennett
 a,
Francis R.
Livens
b,
Daniel
Grolimund
c,
Camelia N.
Borca
c and
Neil C.
Hyatt
*a
a,
Francis R.
Livens
b,
Daniel
Grolimund
c,
Camelia N.
Borca
c and
Neil C.
Hyatt
*a
aImmobilisation Science Laboratory, Department of Materials Science and Engineering, The University of Sheffield, UK. E-mail: n.c.hyatt@sheffield.ac.uk
bCentre for Radiochemistry Research, Department of Chemistry, The University of Manchester, UK
cSwiss Light Source, Paul Scherrer Institute, Villigen, Switzerland
First published on 29th June 2020
Abstract
An environmentally aged radioactive particle of UFeO4 recovered from soil contaminated with munitions depleted uranium (DU) was characterised by microbeam synchrotron X-ray analysis. Imaging of uranium speciation by spatially resolved X-ray diffraction (μ-XRD) and X-ray absorption spectroscopy (μ-XAS) was used to localise UFeO4 in the particle, which was coincident with a distribution of U(V). The U oxidation state was confirmed using X-ray Absorption Near Edge Structure (μ-XANES) spectroscopy as +4.9 ± 0.15. Le-Bail fitting of the particle powder XRD pattern confirmed the presence of UFeO4 and a minor alteration product identified as chernikovite (H3O)(UO2)(PO4)·3H2O. Refined unit cell parameters for UFeO4 were in good agreement with previously published values. Uranium–oxygen interatomic distances in the first co-ordination sphere were determined by fitting of Extended X-ray Absorption Fine Structure (μ-EXAFS) spectroscopy. The average first shell U–O distance was 2.148 ± 0.012 Å, corresponding to a U valence of +4.96 ± 0.13 using bond valence sum analysis. Using bond distances from the published structure of UFeO4, U and Fe bond valence sums were calculated as +5.00 and +2.83 respectively, supporting the spectroscopic analysis and confirming the presence of a U(V)/Fe(III) pair. Overall this investigation provides important evidence for the stability of U(V) ternary oxides, in oxic, variably moist surface environment conditions for at least 25 years.
Environmental significanceThe long term environmental behaviour and health risk posed by depleted uranium particles depends critically on uranium speciation, which is of importance in managing and remediating contaminated land. In particular, oxic and variably moist surface conditions are expected to promote oxidation and dissolution of U(V) phases to form U(VI) species. Here, we demonstrate the long term (>25 year) stability of UFeO4, under such conditions, formed by testing of depleted uranium munitions, using multi-modal X-ray microanalysis. The broader significance of this study provides evidence for the environmental stability of U(V) phases of relevance to environmental contamination by radioactive particles from nuclear fuel cycle and other activities. |
1 Introduction
Radioactive and hot particles are introduced into the environment by a number of civil and military nuclear events, including nuclear power plant (NPP) accidents, effluent discharges from nuclear fuel reprocessing, nuclear weapons testing and acts of war.1 In order to understand the long term environmental behaviour and health risk posed by these particles, information on physicochemical characteristics is required such as morphology, radionuclide inventory and major element speciation. These data can also provide information on the formation and origin of radioactive and hot particles.2In this study, information on the chemical speciation of U in a particle containing the ternary oxide UFeO4 is established by multi-modal synchrotron X-ray microscopy. Ternary compounds in the U–Fe–O system are of interest in the interaction of uranium wastes with iron oxides3 and as a component of corium in severe nuclear power plant accidents.4,5 Iron is ubiquitous in structural components of nuclear reactor systems, and in particular, some modern nuclear reactor designs employ hematite as a sacrificial barrier in core catcher systems.6 Compounds of Fe and U have also been previously described as minority phases in some hot particles.7
In the U–Fe–O system two ternary oxides are known, UFeO4 and UFe2O6, the latter suggested to be stable only at high pressure.3,8–11 UFeO4 crystallises in an orthorhombic system with space group Pbcn,8,10,11 and a similarly structured ternary oxide in the U–Cr–O ternary system (UCrO4) has also been synthesised and characterised.11–13 The oxidation state of uranium in these compounds was first inferred as U(V) by measurement of a small magnetic moment on the U atom,12,14 and more recently verified by X-ray Absorption Spectroscopy and X-ray Photoelectron Spectroscopy, with supporting evidence from DFT calculations.11,15 Pentavalent uranium disproportionates to U(IV) and U(VI) in aqueous systems, and as such is rarely found in geologic materials.16 However, many compounds of U(V) have been characterised, including some rare examples of naturally occurring U(V) minerals, of which wyartite (CaU5+(UO2)2(CO3)O4(OH)(H2O)7) was the first to be identified.17 The most common co-ordination environment for U(V) is pentagonal bipyramidal,18 although some structures containing U(V) in 8-fold19 and distorted octahedral environments are reported.16 The U sites in UFeO4 and UCrO4 are octahedral with differing extents of distortion.8,10–12
The high X-ray photon flux and small spot size achievable with modern microfocus synchrotron X-ray beamlines allows the use of localised X-ray absorption spectroscopy (XAS) techniques to probe the oxidation state and chemical environment of elements in radioactive and hot particles, which may not be amenable to regular preparation or characterisation methods.20,21 The particle in this study was recovered from soils contaminated as a result of depleted uranium munitions test firing.22 The use of these techniques offers a direct measure of the uranium oxidation state to demonstrate the presence of U(V) in UFeO4, and provides evidence on the environmental behaviour of this compound. Coupled with refinement of micro X-ray diffraction data, and elemental analysis by microfocus X-ray fluorescence spectroscopy (μ-XRF), these techniques provide an integrated methodology for detailed chemical characterisation of radioactive and hot particles of a scale commensurate with, or greater, than the X-ray footprint.
2 Experimental
2.1 Particle collection
Particles containing DU were sampled from the UK Ministry of Defence Eskmeals firing range, Cumbria, UK in November 2010 and separated using autoradiography and sample splitting.23 Details of the soil sampling, preparation, and a comprehensive SEM imaging study of the uranium particulate morphology and composition, were published previously.22,24 The particle of UFeO4 selected for this study was from DU contaminated soil that has been exposed to the environment for at least 25 years and is representative of particulates of this phase which occur as a minor fraction of the U-bearing particulates in these soils. The UFeO4 particles were identified from co-location of Fe Kα and U Lα emission in μ-XRF maps and were not obviously identifiable by morphology in our previous SEM analysis,22,24 demonstrating the advantage of using high brilliance synchrotron radiation for wide area μ-XRF analysis to select particles of interest.2.2 Synchrotron X-ray micro-analysis
Particles were mounted on Kapton tape (area ∼ 1.3 cm2) for microfocus X-ray characterisation experiments performed at the microXAS (X05LA) beamline at the Swiss Light Source.20 The source spot size was 2 μm (v) x 5 μm (h), and the samples were mounted on an x–y–z stage at 25° to the incident beam to allow localisation of different areas of interest in the beam. All data were collected at ambient conditions. UFeO4 particles appeared relatively abundant in this specimen, with 2 of the 10 particles selected for analysis conclusively identified as UFeO4 (the others being uranium oxides or secondary alteration products previously described22,24), with a similar abundance in other specimens. Here we report a detailed characterisation of a representative UFeO4 particle.X-ray fluorescence (μ-XRF) spectra were collected using a silicon drift detector (KETEK instruments) placed at 90° to the incident beam. 2D X-ray diffraction (XRD) patterns were recorded using a PILATUS 100K Hybrid Photon Counting (HPC) pixel array detector25 mounted 46 mm behind the sample with a tungsten beamstop in place. The μ-XRD setup was calibrated with respect to a silicon standard (NIST 640c), and the angular resolution was approximately 0.1° 2θ. Incident photon energy for μ-XRF and μ-XRD was 17.500 keV (λ = 0.70849 Å).
2.3 Micro-XANES and micro-EXAFS
X-ray absorption near edge structure (μ-XANES) spectroscopy was performed in fluorescence mode across an energy range of 16.900 to 17.500 keV. Energy calibration was performed with respect to the K edge of yttrium foil (17.038 keV). μ-XANES spectra of uranium reference compounds of different oxidation state were recorded to aid interpretation, including UO2 (U4+), U0.5Y0.5Ti2O6 (U5+),19,21 U3O8 (U5.33+)26 and UO3 (U6+). Reference compounds were prepared as 3 mm diameter pellets of ceramic powders distributed in polyethylene glycol (PEG). The edge shift from U4+ to U6+ standards was 3.2 eV and the energy resolution across the edge region was 0.1 eV, resulting in an oxidation state uncertainty of approximately 3%. Oxidation states were estimated by a calibration line established for a linear relationship of oxidation state and chemical shift, using the reference compounds (see Fig. S1†).Extended X-ray absorption fine structure (μ-EXAFS) spectroscopy was performed in fluorescence mode at the uranium L3 edge. Data were collected across an energy range of 16.900 keV to 18.000 keV. Raw XAS data were processed using the program Athena27 to remove the absorption edge background. EXAFS data were self-absorption corrected with an idealised composition of only UFeO4 using the Troger algorithm implemented in Athena.27,28 Theoretical backscattering path phase and amplitude functions were calculated using FEFF 6 and fit to the data using the Artemis/IFEFFIT software package.27,29 Fits were performed to Fourier transformed R-space data with k-weights of 1, 2 and 3 to reduce parameter correlation.
2.4 Chemical imaging
Rastering of a sample in the X-ray microbeam allows for maps of spatially resolved chemical information to be constructed. Elemental distributions were mapped by monitoring regions of the XRF spectrum corresponding to emission lines of interest whilst the sample was moved in the beam. Phase distributions were similarly mapped by monitoring the intensity of Bragg reflections corresponding to phases of interest, using the software XRDUA.30The spatial distribution of uranium oxidation state was determined using a μ-XAS mapping approach.22,31,32 Maps of absorption co-efficient were constructed by μ-XRF mapping divided by incident intensity (I0) at two energies in the U L3 XANES region (17.168 keV and 17.850 keV), normalised with respect to post-edge energy (17.500 keV). The estimated oxidation state was calculated from the per-pixel absorption coefficient with reference to a linear calibration relationship derived from uranium standard spectra (see Fig. S2†). Maps of oxidation state at both energies showed good agreement and were averaged. It should be noted that both the average local structure of the absorber element and oxidation state determine the normalised absorption at each pixel, and, therefore, this approach affords a map of chemical speciation contrast. Nevertheless, by choosing the excitation energies with due care, and with validation using an independent technique, is possible to construct chemical speciation maps dominated by oxidation state contrast. Our choice of excitation energies is based on an earlier investigation, in which optimisation allowed differentiation of U3O7 and U3O8 by chemical speciation mapping, verified by μ-XRD.22
3 Results and discussion
3.1 Synchrotron X-ray chemical imaging
X-ray chemical imaging was used to probe the spatial distribution uranium species in a set of DU particles recovered from contaminated soil on a UK firing range.22 Areas containing uranium were localised using XRF mapping (Fig. 1a), and the distribution of U species analysed by oxidation state and XRD mapping (Fig. 1c and d). In this study, a particle containing UFeO4 was characterised after first being localised and identified by this chemical imaging approach. | ||
| Fig. 1 U and Fe X-ray fluorescence (a and b), uranium redox (c) and crystalline uranium phase (d) chemical imaging of a DU particle containing UFeO4. | ||
Fig. 1d shows an approximately circular domain of UFeO4 (∼10 μm), with a similar shaped region of elevated fluorescence intensity observed in both uranium and iron elemental maps (Fig. 1a and b). These distributions suggest a spherical particle, which is a common morphology for residues formed from the firing of DU munitions against hard targets, due to the low melting point of metallic uranium.23 Such particles have been observed previously in soils from this site, comprising primarily U3O8 and U4O7; a comprehensive account is given by Crean et al. and Sajih et al.23,24Meta-ankoleite, a uranyl phosphate hydrate (K(UO2)(PO4)·3H2O), and isostructural chernikovite ((H3O)(UO2)(PO4)·3H2O), are also present as widespread alteration products formed from partial weathering of DU particles in the soil.22 Mapping of uranium oxidation state provides information on U speciation in the sample. Areas of U(VI) correspond well to the distribution of meta-ankoleite/chernikovite in the sample, whereas the central region has a reduced composition which correlates well with the distribution of UFeO4. The oxidation state varies in the range 5.2–5.4 in this central domain, consistent with the presence of pentavalent U in UFeO4 as suggested by Bacmann et al. and evidenced by Guo et al.11,14 In Fig. 1b, Fe Kα emission was also observed, over a wide area, adjacent to the UFeO4 particle. μ-XRD analysis of this area produced only diffuse scatter, implying the presence of an Fe rich non-crystalline mineral phase.
3.2 Microfocus X-ray diffraction and X-ray fluorescence spectroscopy
Fig. 2 shows powder diffraction data extracted from the DU particle in the centre of Fig. 1a; the pattern was obtained by summing per-pixel XRD data over the UFeO4 particle area (∼10 μm). These data show that the main phase present in this particle is UFeO4, with a minor contribution from the co-associated uranyl secondary alteration phase, which was initially modelled as meta-ankoleite,33 although further analysis described below suggested this phase is actually the iso-structural chernikovite (H3O)(UO2)(PO4)·3H2O.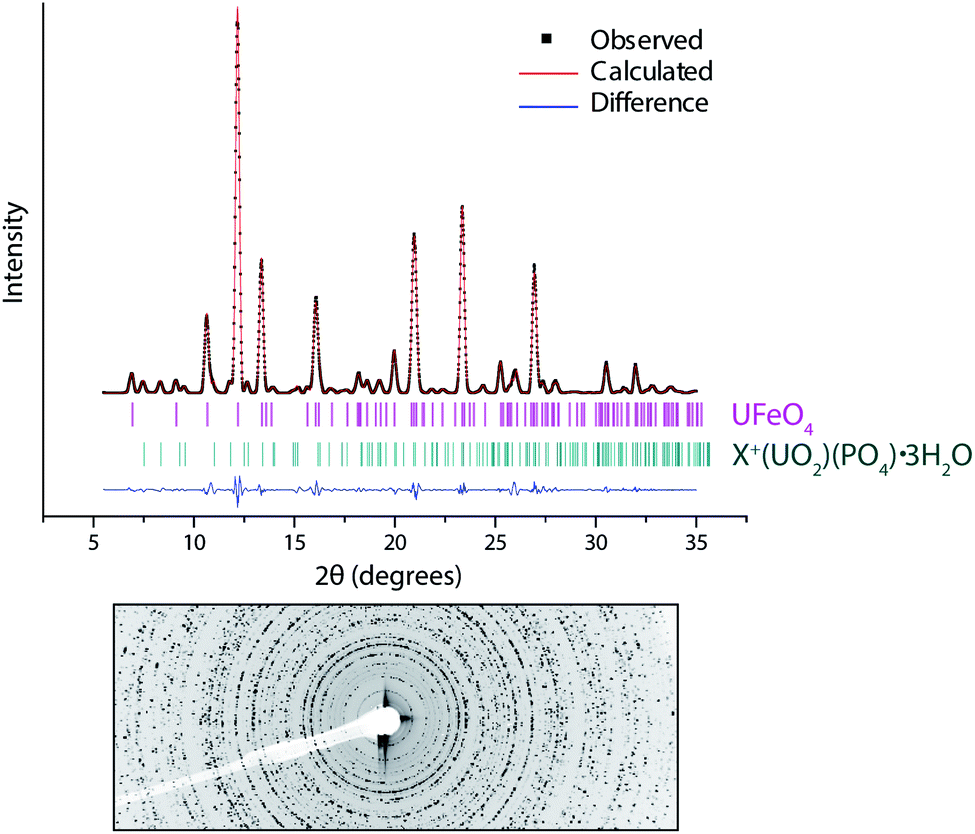 | ||
| Fig. 2 Le Bail fit (solid line) to X-ray powder diffraction data (points) from a DU particle, with difference profile below (lower solid line). Tick marks show allowed reflections for UFeO4 and meta-ankoleite (K(UO2)(PO4)·3H2O). The raw 2-D pattern shows incomplete rings due to low numbers of randomly oriented crystallites, which prevents a full analysis of the crystal structure. | ||
U–Fe phases are thought to be produced by high temperature interactions (T ∼ 3000 °C (ref. 34)) which arise on impact of DU munitions with steels in armour plate. Laves phases such as UFe2 have been observed in DU residues,6 and UFeO4 can form as a minority high temperature oxidation product of this phase.35 In this particle however, the lack of other UFe2 oxidation products (such as UO2 or FeO35) suggests that UFeO4 may form as a primary species. The presence of a UFeO4 particle in these soils shows that this phase can persist in oxic, variably moist surface environment conditions, which may be expected to promote oxidation and dissolution of U(V) phases to U(VI) species.
Quantitative analysis of powder diffraction data was performed using a Le Bail intensity extraction method.36 A low number of randomly oriented crystallites in the particle was evident as ‘spots’ rather than full rings in the 2D diffraction pattern (Fig. 2). Although the angular position of reflections is unaffected, this limits a full structural analysis (e.g. by Rietveld refinement) as the intensity of reflections in the pattern are distorted. This has been previously noted as a problem in the refinement of μ-XRD data.37
The Le Bail method removes the link between the model structure and peak intensities, and allows unit cell parameters to be refined without a structural model, independent of preferred orientation effects. However for low symmetry systems this approach may incorrectly resolve closely spaced peaks, as intensities are not constrained by a structural model.38 To overcome this, the results of Le Bail fitting are recommended to be compared with results from fitting to a structural model, even if this is imperfect.38 In this study good agreement between Le-Bail refined unit cell parameters (Table 1) and a limited Rietveld analysis (data not shown) was observed.
| Fraction (wt%) | a (Å) | b (Å) | c (Å) | Volume (Å3) | ||
|---|---|---|---|---|---|---|
| Phase 1 | ||||||
| UFeO4 | Refined | 95.91(4) | 4.8930(5) | 11.9065(8) | 5.1086(5) | 297.62(5) |
| UFeO4 | Bacmann et al.7 | — | 4.888 | 11.937 | 5.11 | 298.15 |
| Read et al.8 | 4.8844(2) | 11.9328(5) | 5.1070(2) | 297.66(2) | ||
| Guo et al.11 | 4.8858(1) | 11.9288(2) | 5.1072(1) | 297.65(1) | ||
![[thin space (1/6-em)]](https://www.rsc.org/images/entities/char_2009.gif) |
||||||
| Phase 2 | ||||||
| Meta-ankoleite | Refined | 4.10(5) | 7.0265(6) | 7.0265(6) | 18.0275(4) | 890.06(14) |
| Meta-ankoleite | Fitch et al.33 | — | 6.993 | 6.993 | 17.7839 | 869.87 |
| Chernikovite | Ross39 | — | 7.020 | 7.020 | 18.086 | 891.29 |
The pattern was adequately described (χ2 = 6.48, Rwp = 13.7%, Rp = 6.43%) with contributions from UFeO4 as the majority phase (95.9 wt%) with a minority presence of a secondary phase (4.1 wt%) modelled initially as meta-ankoleite. The good agreement of the refined and published unit cell values for UFeO4 (ref. 7, 8 and 11) gives quantitative identification of this species in the particle, and allows correlation of our XAS data with the published structure.
Refined unit cell parameters (Table 1) for the secondary phase show good agreement with the structure of chernikovite (H3O)(UO2)(PO4)·3H2O,39 which is isostructural with meta-ankoleite. These minerals have layered uranyl and phosphate polyhedral chains, with interlayers of water and cations of different size, which allows discrimination based on the unit cell size. Uranyl-phosphate-hydrate phases have been identified in other particles from this sample site at the Eskmeals range, linked to corrosion of DU oxide particles over extended periods of time in a waste disposal pit for contaminated timbers.22 The co-location of minor amounts of chernikovite in this particle may suggest weathering of the UFeO4 phase. However, the majority of the remaining particle is still composed of UFeO4, and the particle size is consistent with primary unaltered uranium oxide particles observed at this site,22,24 indicating an extent of longer term environmental stability over at least 25 years of exposure to the surface environment.
Due to the structural similarity between UFeO4 and UCrO4, qualitative XRF spectroscopy was performed to confirm the identity of the primary U species. Fig. 3 shows that the particle is composed mainly of U and Fe, with only trace levels of Cr present. This result compares well with the refined unit cell parameters which are in good agreement with the presence of UFeO4 only. To distinguish between chernikovite and meta-ankoleite, energy dispersive XRF spectroscopy is not useful as interference with U M emissions (U Mβ = 3339.8 eV) prevents confirmation of the presence of K (K Kα = 3313.8 eV) in the sample, and secondary phase identification relies on refined unit cell parameters only.
 | ||
| Fig. 3 Qualitative XRF spectrum of the particle from Fig. 1 in which maximum counts for U Lα1 (4.8 × 10⁵) and Fe Kα1 (5.2 × 10⁴) compared to Cr Kα1 (6.3 × 10²) indicate that the U ternary oxide phase is UFeO4 rather than UCrO4. The excitation energy was 17.500 keV. | ||
3.3 X-ray absorption spectroscopy
 | ||
| Fig. 4 U LIII XANES spectrum of a UFeO4 particle (sample) plotted with spectra of reference compounds UO2, U0.5Y0.5Ti2O6 and UO3, indicating the average U oxidation state is close to U(V) in the sample. | ||
Although damped by self-absorption, near edge structure suggests a U chemical environment distinct from that observed in UO2 and UO3 (Fig. 4). In particular, the multiple scattering resonance at an energy 10–15 eV greater than the white line observed in the UO3 spectrum, related to multiple scattering of the linear uranyl U(V/VI) structural unit (O![[double bond, length as m-dash]](https://www.rsc.org/images/entities/char_e001.gif) UO+/2+), was not observed in the sample spectrum.40 The strongest post-edge oscillation occurs at a similar energy (17230 eV) to that of the non-uranyl U(V) standard, and agrees well with other published XANES spectra of U(V) compounds and that recently published for UFeO4.11,16,21,35,41 The use of XANES spectroscopy provides further direct evidence for the presence of U(V) in UFeO4, supporting the recent XAS and XPS studies of Guo et al.,11 and earlier inferences of Bacmann et al.14
UO+/2+), was not observed in the sample spectrum.40 The strongest post-edge oscillation occurs at a similar energy (17230 eV) to that of the non-uranyl U(V) standard, and agrees well with other published XANES spectra of U(V) compounds and that recently published for UFeO4.11,16,21,35,41 The use of XANES spectroscopy provides further direct evidence for the presence of U(V) in UFeO4, supporting the recent XAS and XPS studies of Guo et al.,11 and earlier inferences of Bacmann et al.14
XAS mapping (Fig. 1c) provides a more rapid method than XANES analysis to determine the spatial variation in oxidation state. Good agreement between the oxidation state determined by XANES (+4.90 ± 0.15) and XAS redox mapping (particle average +5.20 ± 0.15) provides indication that U oxidation state throughout the particle is pentavalent. XAS mapping also reveals that the U(V) oxidation state is homogenous in the particle (Fig. 1c), and agrees well with the distribution of UFeO4 determined by XRD phase mapping (Fig. 1d). Due to the co-associated chernikovite phase, incorporating the uranyl species, XPS could not be applied to reliably infer the U oxidation state in the particle.
Fig. 5 shows the k2-weighted EXAFS spectra and fits for k- and R-space from the UFeO4 particle, with the fit detailed in Table 2. The intensity in R-space is consistent with the published structure of UFeO4, with an intense and broad second peak arising from a number of scatterers in a complex second shell. Although the published structure of UFeO4 indicates U in a distorted octahedral co-ordination, the R-space resolution offered by μ-EXAFS (ΔR = 0.262 Å) analysis shows this as a single intense peak at 1.55 Å (Fig. 5), corresponding to an average U–O distance of ∼2.15 Å with phase correction. This shell was fitted using backscattering phase and amplitude terms calculated for the middle path length (R0 = 2.155 Å), with the path degeneracy (N) fixed at 6 instead of 2. The EXAFS path length for this shell was refined to 2.148 ± 0.012 Å (Table 1), representing an average of the U–O distances in the distorted first shell geometry. This is agrees well with the mean crystallographic (Rc) U–O distance calculated from the published crystallographic structures of UFeO4 (Rc = 2.148 and 2.168 Å),8,10 and that from a recent EXAFS investigation (R = 2.148 Å).11
 | ||
| Fig. 5 Uranium LIII edge EXAFS spectra from a UFeO4 particle. Left – background subtracted k2-weighted EXAFS spectrum. Right – Fourier transform magnitude (k2 weighted). | ||
| Shell | Path | N | R (Å) | σ 2 (Å2) | Global parameters | |
|---|---|---|---|---|---|---|
| a Co-ordination number increased from crystallographic value to account for averaging of multiple indistinguishable paths. b S 0 2 fixed to 0.95. c Average σ2 fit for all second shell paths. | ||||||
| 1 | O 2.1 | 6a | 2.148(14) | 0.0031(11) | ΔE0 (eV) | 2.1(1.3) |
| S 0 2 | 0.95 | |||||
| 2 | Fe 1.1 | 1 | 3.274(16) | 0.0036(16)c | ||
| 2 | O 1.2 | 2 | 3.288(16) | 0.0036(16)c | G.O.F. | |
| 2 | O 2.3 | 2 | 3.667(18) | 0.0036(16)c | Red χ2 | 6.72 |
| 2 | Fe 1.3 | 6 | 3.735(19) | 0.0036(16)c | R (%) | 1.45 |
The second co-ordination shell in UFeO4 is apparent as a broad peak in the μ-EXAFS data in the region 2.5–3.7 Å. The crystal structure shows this is expected to comprise 2 distinct O subshells and 3 Fe subshells. However, the close spatial relation of these paths and the limited number of available independent data points (Nidp = 9.53) mean it is not possible to resolve individual EXAFS parameters (σ2, ΔR) for these paths. For the second shell paths in Table 2, changes in path length were described with a single scaling factor multiplied by the path length, and a single mean squared path length variation (σ2) was used. This two parameter model for the second shell allows a reasonable fit to the data and extraction of useful chemical information from the first shell, in particular the average U–O distance as discussed above. This value can be used to confirm the oxidation state of U in UFeO4 by bond valence sum analysis.
We also considered the possibility that the U environment in UFeO4 could be an average of U(V) as a result of plausible combinations of U(IV) and U(VI) environments. This involved modelling the EXAFS data using two U cores, initially configured as equal ratios of U(IV) and U(VI) in octahedral co-ordination to fit the first shell of the |FT k2χ(k)|. The UIVO6 environment was modelled with 6 × dU–O = 2.281 Å and σ2 = 0.003 Å2, based on the environment in UTi2O6.44 The UVIO6 environment was modelled as: non-uranyl U(VI), with 6 × dU–O = 2.07 Å and σ2 = 0.003 Å2; or uranyl U(VI) with 2 × dU–Oyl = 1.798 Å, 4 × dU–O = 2.275 Å and σ2 = 0.003 Å2 (using the mean distances for such environments determined from a comprehensive literature survey and analysis45). When the proportions of the environments and path lengths were refined, the models converged to mean path lengths of ∼2.13 Å, implying a single U environment. To develop further insight, we computed the k2χ(k) and |FT k2χ(k)| of plausible combinations of U(IV) and U(VI), using our initial models with FEFF 6 in the Artemis/IFEFFIT software package.27,29 We compared the component and resultant calculations with that for the single U(V) environment determined in Table 2. The results of this analysis show that plausible bounding combinations of U(IV) and U(VI), charge compensated by Fe(III) and/or Fe(II), are unable to accurately approximate a single U(V) environment (Fig. S3†). Thus we conclude that UFeO4 incorporates U(V) in octahedral co-ordination, rather than a combination of U(IV) and U(VI) charge compensated by Fe(III) and/or Fe(II).
where Rij is the measured bond length, R0 is a reference bond length for unity valence and B is a constant. Values for R0 (2.051 Å) and B (0.57) were used from Burns et al.,18 derived specifically for distinguishing valences of uranium. Using these parameters bond valence sums for well characterised pentavalent uranium compounds fall in the range of 4.82–5.26.18 In UFeO4, the EXAFS refined bond length is 2.148 ± 0.012 Å, corresponding to a U valence of 4.96 ± 0.13. This is in close agreement with the value determined by XANES analysis (4.90 ± 0.15), consistent with U in the U(V) oxidation state.

Bond valence sum analysis may also be applied to bond distances calculated from the published crystal structures,8,10 which yield a bond valence sum of 5.0, which is in excellent agreement with the oxidation state of U determined by XANES and EXAFS for this particle. A corresponding Fe valence may also be calculated using the published crystal structures – as the oxidation state of uranium has been determined as U(V), bond valence parameters for Fe(III)–O bonding were used (R0 = 1.759 Å, B = 0.37),38 yielding an average Fe bond valence sum in UFeO4 of 2.83 for the structures of Bacmann et al. and Read et al.,8,10 in agreement with the analysis of 57Fe Mossbauer data by Guo et al.11 These analyses give further confirmation that the cation pair in UFeO4 is U(V)/Fe(III).
4 Conclusions
The presence of ternary U oxides in DU particles is indicative of intense interaction temperatures during impact, and the absence of other Fe and U oxide species in this particle suggests a primary formation mechanism for UFeO4. Importantly, the occurrence of UFeO4 in environmentally aged demonstrates the medium term (>25 year) stability of this phase in the surface environment, which may not be expected for species containing U(V) in oxic, variably moist conditions. Studies of the UO2–Fe2O3–ZrO2 ternary phase diagram, under conditions relevant to severe nuclear power plant accidents, and Fukushima Daiichi in particular, demonstrate the formation of UFeO4.47,48 The evidence presented here for the long term environmental stability of UFeO4, may therefore be of considerable importance in predicting the evolution of hot fuel particles in the environment.The oxidation state of uranium in UFeO4 was determined as U(V) by microfocus synchrotron chemical imaging, μ-XANES and μ-EXAFS spectroscopies. Unit cell parameters of UFeO4 were refined by Le Bail fitting of powder XRD data, revealing values consistent with the structure of UFeO4 determined by Bacmann et al. and Read et al.8,10 This structure was used as an input to calculate EXAFS path amplitudes and phase shifts, which were found to fit well to the data, and agree well with the results of the recent EXAFS study of Guo et al.11 Bond valence analysis of the EXAFS refined U–O bond and of the U and Fe sites in the original structure suggests a U(V)/Fe(III) couple, and confirms early studies of UFeO4 in which U(V) was inferred,12,14 and more recent U L3 XAS and XPS studies.11
This study demonstrates the utility of microbeam X-ray experiments to extract chemical information from challenging samples by a range of complementary analyses, which may be of interest in characterisation of secondary minerals, alteration products and other materials for which bulk samples are not available for conventional characterisation regimes. This approach is particularly suitable for radioactive and hot particles as it non-destructive, thereby preserving the limited sample for other complementary analyses and allowing safe containment of the material.
Conflicts of interest
There are no conflicts to declare.Acknowledgements
UKRI EPSRC is thanked for funding via a studentship for DEC through the Nuclear FiRST DTC (EP/G037140/1) and part support under grant references EP/P013600/1 and EP/S020659/1. T. Geer (QinetiQ) and C. Toque (DSTL) are thanked for assistance with site access and soil sampling. Part of this work was performed at the Swiss Light Source, Paul Scherrer Institute, Villigen, Switzerland, and access was funded through the ACTINET-I3 Integrated Infrastructure Initiative project. P. Heath (University of Sheffield) is thanked for assistance with data collection at SLS. N. C. H. is grateful to the Royal Academy of Engineering and Nuclear Decommissioning Authority for funding. We are grateful to the four anonymous reviewers for their helpful reviews and feedback to improve the manuscript.References
-
B. Salbu, Radioactive Particles Released from Different Nuclear Sources, in Radioactive Particles in the Environment, ed. D. H. Oughton and V. Kashparov, Springer Netherlands, 2009, pp. 3–13 Search PubMed
.
- B. Salbu, Source-related Characteristics of Radioactive Particles: A Review, Radiat. Prot. Dosim., 2000, 92, 49–54 CrossRef CAS
-
P. Nerikar, H. J. Seifert, P. Perrot, Iron - Oxygen - Uranium - Iron Systems: Phase Diagrams, Crystallographic and Thermodynamic Data, in Selected Systems from Fe-N-V to Fe-Ti-Zr, ed. G. Effenberg, Springer, 2009 Search PubMed
- V. I. Almjashev, M. Barrachin, S. V. Bechta, D. Bottomley, S. A. Vitol, V. V. Gusarov, F. Defoort, E. V. Krushinov, D. B. Lopukh, A. V. Lysenko, A. P. Martynov, L. P. Mezentseva, A. Miassoedov, Y. B. Petrov, M. Fischer, V. B. Khabensky and S. Hellmann, Ternary eutectics in the systems FeO-UO2-ZrO2 and Fe2O3-U3O8-ZrO2, Radiochemistry, 2011, 53, 13–18 CrossRef CAS
- D. Akiyama, H. Akiyama, A. Uehara, A. Kirishima and N. Sato, Phase analysis of uranium oxides after reaction with stainless steel components and ZrO2 at high temperature by XRD, XAFS, and SEM/EDX, J. Nucl. Mater., 2019, 520, 27–33 CrossRef CAS
- Y. Petrov, Y. Udalov, J. Subrt, S. Bakardjieva, P. Sazavsky, M. Kiselova, P. Selucky, P. Bezdicka, C. Journeau and P. Piluso, Phase equilibria during crystallization of melts in the uranium oxide-iron oxide system in air, Glass Phys. Chem., 2009, 35, 298–307 CrossRef CAS
- O. C. Lind, B. Salbu, L. Skipperud, K. Janssens, J. Jaroszewicz and W. De Nolf, Solid state speciation and potential bioavailability of depleted uranium particles from Kosovo and Kuwait, J. Environ. Radioact., 2009, 100, 301–307 CrossRef CAS PubMed
- M. Bacmann and E. F. Bertaut, Structure du nouveau composé UFeO4, Bull. Soc. Fr. Mineral. Cristallogr., 1967, 90, 257–258 CAS
- A. Collomb, J. J. Capponi, M. Gondrand and J. C. Joubert, Synthèse de quelques oxydes mixtes de type A6+B23+O6 en milieu hydrothermal sous très haute pression, J. Solid State Chem., 1978, 23, 315–319 CrossRef CAS
- C. M. Read, M. D. Smith and H. C. zur Loye, Single crystal growth and structural characterization of ternary transition-metal uranium oxides: MnUO4, FeUO4, and NiU2O6, Solid State Sci., 2014, 37, 136–143 CrossRef CAS
- X. Guo, E. Tiferet, L. Qi, J. M. Solomon, A. Lanzirotti, M. Newville, M. H. Engelhard, R. K. Kukkadapu, D. Wu, E. S. Ilton, M. Asta, S. R. Sutton, H. Xua and A. Navrotsky, U(V) in metal uranates: a combined experimental and theoretical study of MgUO4, CrUO4, and FeUO4, Dalton Trans., 2016, 45, 4622–4632 RSC
- M. Bacmann, E. F. Bertaut and G. Bassi, Paramètres atomiques et structure magnétique de UCrO4, Bull. Soc. Fr. Mineral. Cristallogr., 1965, 88, 214–218 CAS
- M. W. D. Cooper, D. J. Gregg, Y. Zhang, G. J. Thorogood, G. R. Lumpkin, R. W. Grimes and S. C. Middleburgh, Formation of (Cr,Al)UO4 from doped UO2 and its influence on partition of soluble fission products, J. Nucl. Mater., 2013, 443, 236–241 CrossRef CAS
- M. Bacmann, E. F. Bertaut, A. Blaise, R. Chevalier and G. Roult, Magnetic structures and properties of UFeO4, J. Appl. Phys., 1969, 40, 1131–1132 CrossRef CAS
- B. Ao, Atom-Resolved Chemical States in the Multivalent U-TM-O (TM: Ti, V, Cr, Mn, Fe, Ni, Nb, Mo, W) Ternary Oxides from First-Principles, J. Phys. Chem. C, 2019, 123, 29609–29622 CrossRef CAS
- J. A. Fortner, A. J. Kropf, R. J. Finch, A. J. Bakel, M. C. Hash and D. B. Chamberlain, Crystal chemistry of uranium(V) and plutonium(IV) in a titanate ceramic for disposition of surplus fissile material, J. Nucl. Mater., 2002, 304, 56–62 CrossRef CAS
- P. C. Burns and R. J. Finch, Wyartite: Crystallographic evidence for the first pentavalent-uranium mineral, Am. Mineral., 1999, 84, 1456–1460 CrossRef CAS
- P. C. Burns, R. C. Ewing and F. C. Hawthorne, The crystal chemistry of hexavalent uranium; polyhedron geometries, bond-valence parameters, and polymerization of polyhedra, Can. Mineral., 1997, 35, 1551–1570 CAS
- M. James, M. L. Carter and J. N. Watson, The synthesis, crystal chemistry and structures of Y-doped brannerite (U1−xYxTi2O6) and thorutite (Th1−xYxTi2O6−δ) phases, J. Solid State Chem., 2003, 174, 329–333 CrossRef CAS
-
C. N. Borca, D. Grolimund, M. Willimann, B. Meyer, K. Jefimovs, J. Vila-Comamala and C. David, The microXAS beamline at the Swiss Light source: towards nano-scale imaging, in 9th International Conference on X-Ray Microscopy, ed. C. David, F. Nolting, C. Quitmann, M. Stampanoni and F. Pfeiffer, 2009 Search PubMed
- C. L. Corkhill, D. E. Crean, D. J. Bailey, C. Makepeace, M. C. Stennett, R. Tappero, D. Grolimund and N. C. Hyatt, Multi-scale investigation of uranium attenuation by arsenic at an abandoned uranium mine, South Terras, Mater. Degrad., 2017, 1, 19 CrossRef
- D. E. Crean, F. R. Livens, M. C. Stennett, D. Grolimnd, C. N. Borca and N. C. Hyatt, Micro-analytical Imaging of Depleted Uranium Speciation in Munitions Residues, Environ. Sci. Technol., 2014, 48, 1467–1474 CrossRef CAS PubMed
- M. Sajih, F. R. Livens, R. Alvarez and M. Morgan, Physicochemical characterisation of depleted uranium (DU) particles at a UK firing test range, Sci. Total Environ., 2010, 408, 5990–5996 CrossRef CAS PubMed
- D. E. Crean, F. R. Livens, M. Sajih, M. C. Stennett, D. Grolimund, C. N. Borca and N. C. Hyatt, Remediation of soils contaminated with particulate depleted uranium by multi stage chemical extraction, J. Hazard. Mater., 2013, 263, 382–390 CrossRef CAS PubMed
- T. Taguchi, C. Broennimann and E. F. Eikenberry, Next generation X-ray detectors for in-house XRD, Powder Diffr., 2008, 23, 101–105 CrossRef CAS
- M. Magnuson, S. M. Butorin, L. Werme, J. Nordgren, K. E. Ivanov, J. H. Guo and D. K. Shuh, Uranium oxides investigated by X-ray absorption and emission spectroscopies, Appl. Surf. Sci., 2006, 252, 5615–5618 CrossRef CAS
- B. Ravel and M. Newville, ATHENA, ARTEMIS, HEPHAESTUS: data analysis for X-ray absorption spectroscopy using IFEFFIT, J. Synchrotron Radiat., 2005, 12, 537–541 CrossRef CAS PubMed
- L. Tröger, D. Arvanitis, K. Baberschke, H. Michaelis, U. Grimm and E. Zschech, Full correction of the self-absorption in soft-fluorescence extended X-ray-absorption fine structure, Phys. Rev. B: Condens. Matter Mater. Phys., 1992, 46, 3283–3289 CrossRef PubMed
- M. Newville, IFEFFIT: interactive XAFS analysis and FEFF fitting, J. Synchrotron Radiat., 2001, 8, 322–324 CrossRef CAS PubMed
- W. De Nolf and K. Janssens, Micro X-ray diffraction and fluorescence tomography for the study of multilayered automotive paints, Surf. Interface Anal., 2010, 42, 411–418 CrossRef CAS
- E. Curti, D. Grolimund and C. N. Borca, A micro-XAS/XRF and thermodynamic study of CeIII/IV speciation after long-term aqueous alteration of simulated nuclear waste glass: Relevance for predicting Pu behavior?, Appl. Geochem., 2012, 27, 56–63 CrossRef CAS
- D. Grolimund, M. Senn, M. Trottmann, M. Janousch, I. Bonhoure, A. M. Scheidegger and M. Marcus, Shedding new light on historical metal samples using micro-focused synchrotron X-ray fluorescence and spectroscopy, Spectrochim. Acta, Part B, 2004, 59, 1627–1635 CrossRef
- A. N. Fitch and M. Cole, The structure of KUO2PO4·3D2O refined from neutron and synchrotron-radiation powder diffraction data, Mater. Res. Bull., 1991, 26, 407–414 CrossRef CAS
- K. M. Krupka, M. A. Parkhurst, K. Gold, B. W. Arey, E. D. Jenson and R. A. Guilmette, Physicochemical characterization of Capstone depleted uranium, aerosols III: morphologic and chemical oxide analysis, Health Phys., 2009, 96, 276–291 CrossRef CAS PubMed
- O. Bonino, O. Dugne, C. Merlet, E. Gat, P. Holliger and M. Lahaye, Study of surface modification of uranium and UFe2 by various surface analysis techniques, J. Nucl. Mater., 2001, 294, 305–314 CrossRef CAS
- A. Le Bail, H. Duroy and J. L. Fourquet,
Ab initio structure determination of LiSbWO6 by X-ray powder diffraction, Mater. Res. Bull., 1988, 23, 447–452 CrossRef CAS
- C. Meneghini, M. C. Dalconi, S. Nuzzo, S. Mobilio and R. H. Wenk, Rietveld Refinement on X-Ray Diffraction Patterns of Bioapatite in Human Fetal Bones, Biophys. J., 2003, 84, 2021–2029 CrossRef CAS
- V. K. Peterson, Lattice parameter measurement using Le Bail versus structural (Rietveld) refinement: A caution for complex, low symmetry systems, Powder Diffr., 2005, 20, 14–17 CrossRef CAS
- V. Ross, Studies of uranium minerals. 21. Synthetic hydrogen-autunite, Am. Mineral., 1955, 40, 917–919 CAS
- E. A. Hudson, J. J. Rehr and J. J. Bucher, Multiple-scattering calculations of the uranium L3-edge X-ray-absorption near-edge structure, Phys. Rev. B: Condens. Matter Mater. Phys., 1995, 52, 13815–13826 CrossRef CAS PubMed
- F. Farges, C. W. Ponader, G. Calas and G. E. Brown, Structural environments of incompatible elements in silicate glass melt systems.2. UIV, UV, and UVI, Geochim. Cosmochim. Acta, 1992, 56, 4205–4220 CrossRef CAS
- D. R. Frohlich, S. Amayri, J. Drebert, D. Grolimund, J. Huth, U. Kaplan, J. Krause and T. Reich, Speciation of Np(V) uptake by Opalinus Clay using synchrotron microbeam techniques, Anal. Bioanal. Chem., 2012, 404, 2151–2162 CrossRef PubMed
-
S. Kelly, D. Hesterberg and B. Ravel, Analysis of soils and minerals using X-ray absorption spectroscopy, Methods of soil analysis, Part 5, 2008, pp. 387–463 Search PubMed
- J. T. Szymanski and J. D. Scott, A crystal structure refinement of synthetic brannerite UTi2O6 and its bearing on rate of alkaline-carbonate leaching of brannerite in ore, Can. Mineral., 1982, 20, 271–280 CAS
- O. C. Gagne, Bond-length distributions for ions bonded to oxygen: results for the lanthanides and actinides and discussion of the f-block contraction, Acta Crystallogr., Sect. B: Struct. Sci., Cryst. Eng. Mater., 2018, 74, 49–62 CrossRef CAS
- I. D. Brown and D. Altermatt, Bond-valence parameters obtained from a systematic analysis of the Inorganic Crystal Structure Database, Acta Crystallogr., Sect. B: Struct. Sci., 1985, 41, 244–247 CrossRef
- V. I. Almjashev, M. Barrachin, S. V. Bechta, D. Bottomley, S. A. Vitol, V. V. Gusarov, F. Defoort, E. V. Krushinov, D. B. Lopukh, A. V. Lysenko, A. P. Martynov, L. P. Mezentseva, A. Miassoedov, Yu. B. Petrov, M. Fischer, V. B. Khabensky and S. Hellmann, Ternary Eutectics in the Systems FeO–UO2–ZrO2 and Fe2O3–U3O8–ZrO2, Radiochemistry, 2011, 53, 13–18 CrossRef CAS
- D. Akiyama, H. Akiyama, A. Uehara, A. Kirishima and N. Sato, Phase analysis of uranium oxides after reaction with stainless steel components and ZrO2 at high temperature by XRD, XAFS, and SEM/EDX, J. Nucl. Mater., 2019, 520, 27–33 CrossRef CAS
Footnote |
| † Electronic supplementary information (ESI) available. See DOI: 10.1039/d0em00243g |
| This journal is © The Royal Society of Chemistry 2020 |