 Open Access Article
Creative Commons Attribution 3.0 Unported Licence
What is needed to deliver carbon-neutral heat using hydrogen and CCS?†
Nixon
Sunny
 ab,
Niall
Mac Dowell
 *ac and
Nilay
Shah
*ab
aCentre for Process Systems Engineering, Imperial College London, Exhibition Road, London, SW7 2AZ, UK. E-mail: niall@imperial.ac.uk; n.shah@imperial.ac.uk
bDepartment of Chemical Engineering, Imperial College London, Exhibition Road, London, SW7 2AZ, UK
cCentre for Environmental Policy, Imperial College London, Exhibition Road, London, SW7 1NA, UK
First published on 22nd September 2020
Abstract
In comparison with the power sector, large scale decarbonisation of heat has received relatively little attention at the infrastructural scale despite its importance in the global CO2 emissions landscape. In this study we focus on the regional transition of a heating sector from natural gas-based infrastructure to H2 using mathematical optimisation. A discrete spatio-temporal description of the geographical region of Great Britain was used in addition to a detailed description of all network elements for illustrating the key factors in the design of nation-wide H2 and CO2 infrastructure. We have found that the synergistic deployment of H2 production technologies such as autothermal reforming of methane, and biomass gasification with CO2 abatement technologies such as carbon capture and storage (CCS) are critical in achieving cost-effective decarbonisation. We show that both large scale underground H2 storage and water electrolysis provide resilience and flexibility to the heating system, competing on cost and deployment rates. The optimal regions for siting H2 production infrastructure are characterised by proximity to: (1) underground H2 storage, (2) high demands for H2, (3) geological storage for CO2. Furthermore, cost-effective transitions based on a methane reforming pathway may necessitate regional expansions in the supply of natural gas with profound implications for security of supply in nations that are already highly reliant, potentially creating an infrastructure lock-in during the near term. We found that the total system cost, comprising both investment and operational elements, is mostly influenced by the natural gas price, followed by biomass price and CapEx of underground caverns. Under a hybrid Regulated Asset Base (RAB) commercial framework, with private enterprises delivering production infrastructure, the total cost of heat supply over the infrastructure lifetime is estimated as 5.2–8.6 pence per kW h. Due to the higher cost relative to natural gas, a Contract for Difference payment between £20 per MW h and £53 per MW h will be necessary for H2-derived heat to be competitive in the market.
Broader contextDecarbonising the heating sector in the global economy presents infrastructural and social challenges, especially for those nations that are reliant on natural gas for heat provision. Fuel poverty is a major issue that affects a significant portion of people in the developed world, with the lack of affordable heat being a key determinant of excess winter deaths. It is imperative that access to affordable heat is increased during the transition towards net-zero greenhouse gas emissions. In this context, there is growing evidence to indicate that the co-deployment of H2 and CO2 infrastructure may facilitate a sustainable energy transition from the incumbent natural gas infrastructure to a carbon-neutral future. Yet, there is little understanding of the requirements of the transition (i.e., investment locations, extent of financial support, and rates of deployment) to support this ambition. Moreover, the impact of geographical considerations related to resource and storage availability on the economic feasibility of technology investments are poorly understood. In this study, we present a systematic assessment of the regional conversion of the natural gas supply chain to H2, accounting for all the processing elements within both H2 and CO2-integrated value chains. We compare the overall primary energy consumption of the designed system relative to the incumbent infrastructure to identify regional implications for resource use. Key questions that are addressed in this work include: (a) what is the required scale of technology deployment?, (b) what are the regional factors that determine optimal investment locations?, (c) what is the cost of heat supply using H2 and what is necessary for it to be affordable? |
1 Introduction
1.1 Challenges and knowledge gaps
A growing need for climate change mitigation has led to the establishment of ambitious legislation by advanced economies, such as the United Kingdom (UK), France, and Norway to an economy-wide transition to net-zero greenhouse gas emissions by 2050.1 In this context, progress in the decarbonisation of the heating sector has lagged significantly behind the electricity sector2 and requires concerted attention. Heating and cooling related consumption accounts for half of the primary energy consumption in the European Union (EU).3 At present, natural gas is used to supply nearly half of the EU heat demand with national shares as high as 80% in the Netherlands and the UK.4,5 Growing energy demands, coupled with unique geological conditions (access to low-cost gas production and underground storage), are likely to have cemented the establishment of natural gas networks in such regions.6–10 In this context, a H2-based heating supply may provide an attractive opportunity for “low-carbon” infrastructural transitions in these regions due to its ability to reutilise the existing gas infrastructure whilst providing consumers with affordable heat using familiar technologies.There is an ongoing debate on the optimal set of technologies for the deployment of “low-carbon” H2 in order to supply the near term demand. Globally, methane and coal-based technologies currently dominate the dedicated H2 production capacity (approximately 70 Mt year−1) with shares of 76% (used in Middle East, EU, Russia, United States, etc.) and 23% (mainly used within the People's Republic of China) respectively.15 The remaining 1% is produced via water electrolysis (WE). There is great uncertainty as to the value offered by alternative production technologies for the generation of H2 in a CO2-neutral environment. As discussed in Appendix A.2, there are a wide variety of commercially available technology options for the production of H2. Fig. 1 illustrates that at the time of writing, heating pathways relying on H2 from existing fuels without carbon capture and storage (CCS) are untenable in the long-term as they are more CO2-intensive than the direct combustion of natural gas. The future deployment potential of WE at scale will be dependent on achieving net-zero CO2 emissions from the power sector. Importantly, WE has a lower CO2 footprint compared to autothermal reforming (ATR) with CCS only when the CO2 intensity of the power supply is less than 10 g kW h−1. Negative emissions technologies (NETs) such as biomass gasification or biomass combined heat & power (CHP) with CCS may have an important role due to their unique ability to supply heat whilst removing CO2 from the atmosphere. Overall, the deployment potential of any technology is likely to be influenced by its CO2 intensity, feedstock prices and its availability. Hence, they must be incorporated in planning to identify the most relevant technology choices in a CO2-neutral environment.
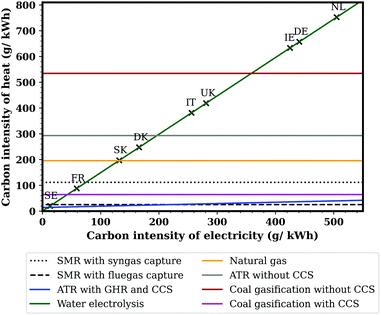 | ||
| Fig. 1 CO2 intensity of heat provision for various technologies, excluding the generation of greenhouse gas emissions during material extraction, construction, transportation, and decommissioning. A boiler conversion efficiency of 94%11 and a natural gas CO2 intensity of 184 g kW h−1 (ref. 12) are assumed for the feedstock. Due to the fact that ATRs with gas heating reforming (GHR) and CCS are net importers of power, their overall CO2 intensity has a weak dependency on the electricity grid. Coal gasification assumes a bituminous coal feed with an energy content of 8.4 kW h kgHHV−1 and an achievable CO2 capture rate of 88% when relevant.13 Markers represent the CO2 intensity of heat achievable through WE if the indicated nations use their electricity grid as the power supply, based on 2016 estimates from the European Environment Agency.14 Country names are as follows: Sweden (SE), France (FR), Slovakia (SK), Denmark (DK), Italy (IT), United Kingdom (UK), Ireland (IE), Germany (DE), Netherlands (NL). | ||
1.2 Existing literature
One of the earliest attempts at devising a robust mathematical model of a H2 supply chain (HSC) network was achieved by Van Den Heever and Grossmann in 2003.16 Their work considered a set of pre-defined nodes representing production facilities with inter-connecting pipelines and customers, with emphasis on the planning and scheduling of the network. However, this methodology failed to account for the deployment of new infrastructure. This gap was addressed in 2006, when Almansoori and Shah presented general frameworks for HSC design and operation.17–19 A large number of studies have further explored the design of HSCs in various geographical contexts for an extensive array of applications.20–34To the best of the authors' knowledge, Moreno-Benito et al.33 is the only study that has considered spatially-explicit, simultaneous development of both H2 and CO2 value chains to support the decarbonisation of the transportation system. Similarly, little attention has been paid to the development of HSCs for the decarbonisation of heat as an energy vector with only a single publication by Samsatli and Samsatli to the authors' knowledge.35 They studied the role of renewable H2 and electrification in decarbonising heat and found that complete electrification is preferable in the absence of large scale H2 storage. However, the potential for H2 to replace the existing heat demand from natural gas and achieve CO2-neutrality needs further investigation. Furthermore, the role of methane-based technologies with CCS and NETs remain critically unexplored.
Moreno-Benito et al.33 conclude that steam methane reforming (SMR) with CCS is the most economical production technology as CO2 emissions are minimised. However, the benefits of advanced reforming technologies to a CO2-neutral environment is unclear. They also indicate the importance of WE as a low-carbon generation technology, which is unlikely to be relevant for net-zero CO2 emissions without drastic reductions in the electricity grid CO2 intensity towards CO2-neutrality. Furthermore, the effect of natural gas grid CO2 intensity and the availability of negative emissions on the optimal technology selection, and total costs associated with decarbonisation, remains an open question.
A substantial proportion of research addressing the design of HSCs has focused on H2 as the sole energy vector capable of supplying consumer demands (i.e., H2 for supplying transportation demands). This is evidenced in publications such as Johnson et al.,36 De-Leon Almaraz et al.,37 Nunes et al.31 amongst many others. It must be noted that earlier attempts at modelling HSCs were aimed at analysing the design of HSCs rather than define its role in a diverse energy mix. Such approaches are often restrictive in their ability to consider transitions from incumbent infrastructure as there are no descriptions of existing fuels and infrastructure.
In general, infrastructures are spatially constituted and therefore, influenced by regional factors. At the time of writing, to the best of the authors' knowledge, no studies have sought to model a spatially explicit transition from the incumbent infrastructure to a decarbonised future for the heating sector. The development of structured decarbonisation trajectories, which incorporate strategic regional opportunities, can reduce the cost of heat infrastructure. Thus, optimal regions for low-carbon investment must be identified to aid gas-reliant nations to plan for a decarbonised future.
1.3 Contributions from this study
This contribution provides economic and environmental assessments of the conversion of a natural gas-based heating supply system to H2. To this end, a mathematical programming approach was utilised to study the long-term potential for H2 and CCS technologies using the geographical region of Great Britain (GB) as an instantiated case study. The authors intend to provide a comprehensive view of a H2-based heating system as a structured basis for comparison with alternative future visions on decarbonisation of heat. In addition, this study decomposes the design complexities and identifies a set of reducible engineering considerations that favour the use of a H2 network within a geographical context for broader relevance. In particular, the robustness of H2-based solutions and their dependencies on existing natural gas/electricity grid infrastructure, resource prices and NETs are studied.The mixed integer linear programming (MILP) framework presented in this paper is based on the Resource Technology Network (RTN) framework and combines all components of both H2 and CO2 value chains into a single decision-making framework, where the optimal choices of production, transportation and storage technologies are determined on a regional basis to support the transition into a low-carbon H2 network. The mathematical model contains explicit definitions of primary resources such as natural gas, electricity and biomass. This is accompanied with a description of production technologies such as biomass gasification and methane reforming with CCS along with the water electrolysis process. Geological storage of H2 in underground caverns and CO2 in offshore basins are described. The heating demand segment in this study includes domestic and non-domestic users that are connected to the existing gas network.
The remainder of this paper is structured as follows. Section 2 describes the spatio-temporal characteristics of heat demand, and the key methodological relations between model variables are summarised in Section 3. Section 4 presents the role of different technologies in achieving cost-effective CO2 mitigation and their implications for storage and resource use. Section 5 details infrastructure deployment analyses and identifies regional dependencies that greatly influence the nature of the transition into a H2 supply. Section 6 evaluates the total cost of the various infrastructure components and exposes key factors that determine the economic viability of the designed system. Section 7 synthesises the findings from the earlier sections for relevance to regions that rely on gas-based heating.
2 Spatio-temporal description of demand
2.1 Demand modelling
In general, the demand for heating can be decomposed into two components: (a) a domestic heating component, which is characterised by significant temporal variation, and; (b) a non-domestic heating‡ component which is assumed to be time invariant across the annual time horizon. The input data used to describe the spatial distribution of heating demand was obtained from the Department for Business, Energy & Industrial Strategy (BEIS)38 within Her Majesty's Government (HMG); it presents meter records of natural gas consumption for domestic and non-domestic users in GB. Approximately 38 TW h (7%) of natural gas consumption was not attributable to any location due to reasons such as insufficient meter readings, non-disclosure of consumption data, etc. Natural gas is assumed to be used wholly for heating purposes within the domestic context. In contrast, non-domestic natural gas consumption is not limited to heating as some users may use natural gas as feedstock. However, the reported data is used to generate the total non-domestic heating demand, as a conservative estimate. The authors note that this data does not represent total GB heating demands as approximately 15% of buildings are not connected to the gas network and use alternative forms of heating.Rosenow et al.39 estimates a cost-effective, energy efficiency improvement of 18% in existing buildings in the UK by 2035, without the inclusion of technologies such as heat pumps or heat networks. The UK population is expected to increase from 66 million to 77 million by 2050 according to the Office for National Statistics.40 Assuming a proportional increase in heating consumption with population growth, a 17% increase in total demand may be apparent by 2050. Overall, the total heat consumption is assumed constant at present values over each year in the planning horizon mainly due to long-term projection uncertainties and since the aforementioned effects balance each other.
2.2 Regional clusters
Fig. 2 illustrates the spatial variations in GB's annual natural gas consumption for both domestic and non-domestic heat provision. Of the total, 63% is consumed by the domestic sector, with the balance accounted for by the non-domestic sector. This data is further categorised into heating demand density bands in Table 1. Almost 70% of the nation's total heating related consumption arises from only 7% of its total area. A distinctive feature of the heating system is that regional demand is clustered in line with population density and industrial activity. This means that decarbonising the top 5 regional clusters would mitigate 60% of total nation-wide heat emissions.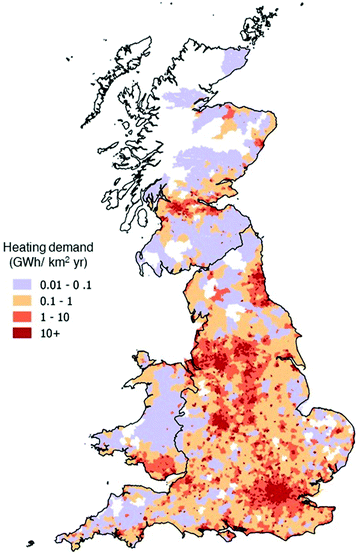 | ||
| Fig. 2 Spatial distribution of heating demand densities in the geographical region of Great Britain. | ||
| Heating demand density (GW h km−2 year−1) | Area (km2) | Share of the total area (%) | Total demand (GW h) | Share of the total heat demand (%) |
|---|---|---|---|---|
| 0–0.1 | 61![[thin space (1/6-em)]](https://www.rsc.org/images/entities/char_2009.gif) 800 800 |
33 | 1![[thin space (1/6-em)]](https://www.rsc.org/images/entities/char_2009.gif) 900 900 |
0.5 |
| 0.1–1 | 76![[thin space (1/6-em)]](https://www.rsc.org/images/entities/char_2009.gif) 100 100 |
41 | 29![[thin space (1/6-em)]](https://www.rsc.org/images/entities/char_2009.gif) 300 300 |
6.5 |
| 1–10 | 35![[thin space (1/6-em)]](https://www.rsc.org/images/entities/char_2009.gif) 400 400 |
19 | 110![[thin space (1/6-em)]](https://www.rsc.org/images/entities/char_2009.gif) 000 000 |
24 |
| 10+ | 12![[thin space (1/6-em)]](https://www.rsc.org/images/entities/char_2009.gif) 600 600 |
7 | 315![[thin space (1/6-em)]](https://www.rsc.org/images/entities/char_2009.gif) 000 000 |
69 |
2.3 Temporal variability
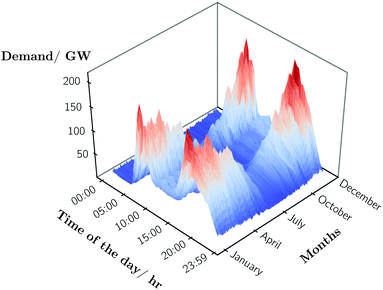
The temporal variation in the domestic heating demand profile over an annual time horizon is described in Fig. 3. This dataset was obtained from Sansom.41 These time-based variations were scaled appropriately to merge with the spatial consumption data to form annual consumption estimates. Sansom estimates the load factor of heat demand in GB to be almost a quarter of that of the electricity demand41 (i.e., a four-fold increase in variability relative to electricity). This highlights the need for infrastructure that is highly responsive to load variations.3 Methodology
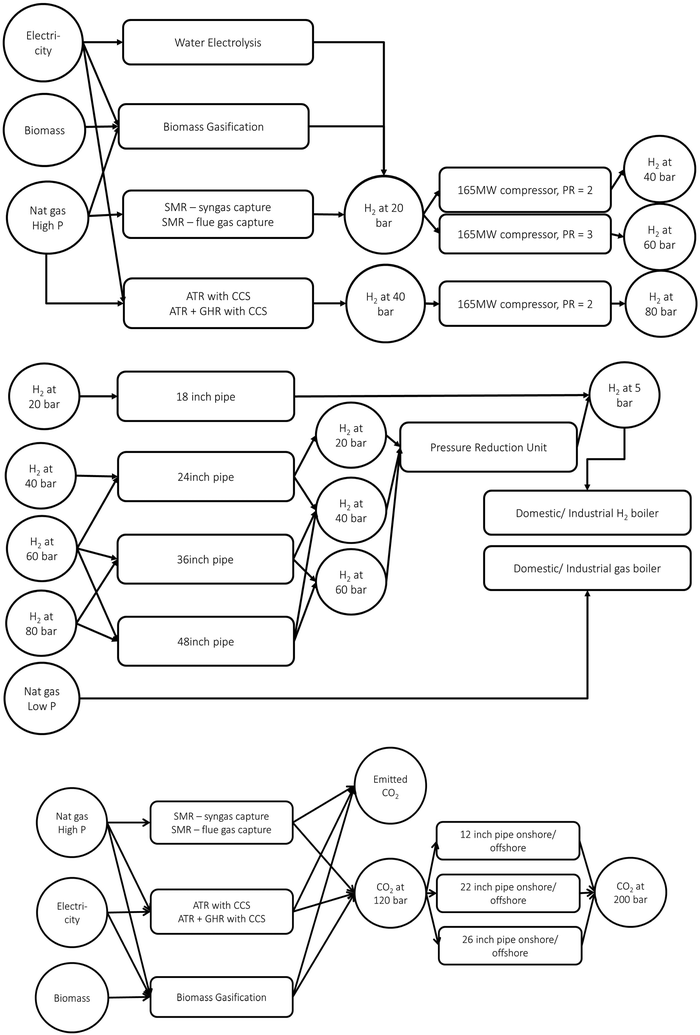
The RTN modelling framework, used in this study, was originally developed by Pantelides.57 Key characteristics of this decision-making framework are its ability to explicitly model spatio-temporal variations in addition to resources and technologies. This framework has been extensively used by a number of investigators, including Zhang and Sargent,58 Schilling and Pantelides,59,60 Dimitriaidis et al.,61 Castro et al.,62–64 and recently by Samsatli et al.65A detailed summary of the technologies for H2 and CO2 value chains are presented in Appendix A. Further methodological innovations are described in detail in Section S2 of the ESI.† A diagrammatic representation of the analytical superstructure is depicted in Fig. 4. The key technology options within the model formulation are summarised in Tables 2–4. End-use technologies are not analysed as the study is framed to evaluate the conversion of the natural gas supply to H2. Dorrington et al.66 has indicated that boiler manufacturers have the capacity to scale up the production of H2-fired appliances in line with the UK heating appliance demand. Furthermore, the cost of domestic H2 boilers are assumed to be comparable to natural gas boilers, at the production scales that are required by this study.11 Additionally, Dodds et al.67 discusses the various developments in fuel cell technology for the provision of heat. As such, consumers are likely to purchase end-use appliances depending on their preferences and needs.
| Technology type | Plant size (MW HHV) | CapEx (£ per kW) | Efficiency (% HHV) | CO2 intensity of H2 (g per kW per h) |
|---|---|---|---|---|
| SMR with syngas capture42–44 | 1000 | 320 | 73 | 105 |
| SMR with fluegas capture11,42,43 | 1000 | 480 | 70 | 23.8 |
| ATR with CCS11,13 | 1000 | 510 | 78 | 15 |
| ATR with GHR and CCS11,13 | 1000 | 490 | 83 | 13 |
| Water electrolysis15,45,46 | 100 | 880 | 72 | 1.4 × CIelectricity |
| Biomass gasification with CCS11,47–49 | 200 | 1100 | 40 | −420 |
| Technology type | Maximum flow rate (kg s−1) | CapEx (£k per km) | Assumed losses (%/km) |
|---|---|---|---|
| H2 pipeline – 18 inch | 7.1 | 87011 | 0.00550 |
| H2 pipeline – 24 inch | 30 | 126011 | 0.00550 |
| H2 pipeline – 36 inch | 105 | 202011 | 0.00550 |
| H2 pipeline – 48 inch | 220 | 279011 | 0.00550 |
| Onshore CO2 pipeline – 12 inch | 88 | 60011 | 0.00251 |
| Onshore CO2 pipeline – 26 inch | 350 | 130011 | 0.00251 |
| Offshore CO2 pipeline – 12 inch | 88 | 78011 | 0.00251 |
| Offshore CO2 pipeline – 26 inch | 350 | 150011 | 0.00251 |
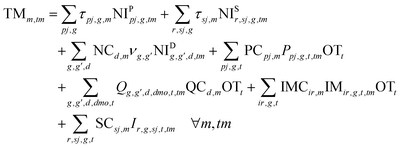
3.1 Key model constraints
 | (1) |
| Ppj,g,t,tm ≤ NPp,j,g,tmNPCpj ∀pj, g, t, tm | (2) |
| NPpj,g,tm = NPpj,g,tm−1 + NIPpj,g,tm ∀pj, g, tm | (3) |
 | (4) |
 | (5) |
 | (6) |
3.2 Sensitivity analysis methods
The effects of uncertain model input parameters on the characteristics of the designed systems are studied using global sensitivity analysis (GSA) methods. Their usage has been argued by Keirstead and Shah68 following the methodology outlined in Saltelli et al.69 and has been implemented by Pye et al.70 to solve similar design problems. In this paper, GSA is used in conjunction with the optimal design solution to determine the impact of 4 model input parameters: gas, electricity, biomass prices, and cavern costs, on the TAC of the designed system.All four uncertain parameters are assumed to be uniformly distributed in the uncertainty space owing to a lack of reliable data to support the future distribution of parameter values. The resulting design solution is subjected to Monte Carlo simulations with a sample size of 10![[thin space (1/6-em)]](https://www.rsc.org/images/entities/char_2009.gif) 000 simulations where the TAC from each simulation of the model is dependent on the parameter values that are generated at random from their respective probability distributions. Upon identifying relevant correlations, a multivariate linear regression model is developed using Ordinary Least Squares (OLS) regression to compare the relative importance of input parameters through measures such as the standardised regression coefficients. During this process, the regression model is assessed for its statistical significance, to ensure generality of findings and broader relevance. An elaborate description of the key statistical parameters that are used for assessing model and parameter fits can be found in Section S2 of the ESI.†
000 simulations where the TAC from each simulation of the model is dependent on the parameter values that are generated at random from their respective probability distributions. Upon identifying relevant correlations, a multivariate linear regression model is developed using Ordinary Least Squares (OLS) regression to compare the relative importance of input parameters through measures such as the standardised regression coefficients. During this process, the regression model is assessed for its statistical significance, to ensure generality of findings and broader relevance. An elaborate description of the key statistical parameters that are used for assessing model and parameter fits can be found in Section S2 of the ESI.†
3.3 Modelling environment
The mathematical model is implemented and simulated in General Algebraic Modeling System (GAMS) version 25.0.3.71 Data processing for visualisation and analysis is conducted using Python version 2.7.72 The geographical data is curated using the open-source Geographic Information System (GIS) tool: QGIS.734 Technology and resource needs in a low-carbon heat supply
The analyses presented in this section identifies the role of different H2 production technologies in delivering varying levels of emissions reductions in the heating sector. Systemic trade-offs between technological options and storage are discussed in detail.4.1 Which H2 production technologies to deploy?
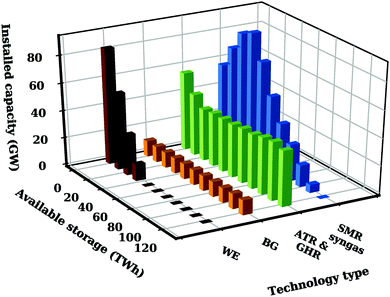
Fig. 5 illustrates the total installed capacity of production technologies at varying levels of CO2 reduction. Each distinct scenario and its corresponding design optimisation was computed at a CO2 reduction interval of 10%, ranging from 0% (complete inaction) to 100% (complete decarbonisation). The assumptions used to generate the outputs are summarised in Section S1 of the ESI† in addition to the key assumption that GB's cavern storage resources are usable. Similarly to previous contributions,74,75 methane reforming pathways dominate the supply mix in all scenarios. This finding is in accordance with previous studies.74,75 Owing to its superior energy efficiency and reduced costs of CO2 avoidance, ATRs with GHR and CCS is the dominant technology choice under all emissions scenarios investigated.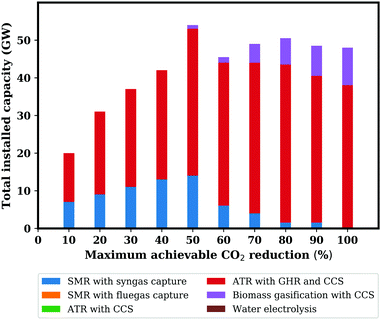 | ||
| Fig. 5 The optimal mix of technologies deployed in distinct designs show the extent to which the decarbonisation targets influence the nature of the overall design capacity. | ||
Note the lack of deployment of technologies such as SMRs with fluegas capture, ATRs without GHR and the WE process. A comparison between the two ATR configurations on key performance metrics such as energy efficiency and levelised costs of H2 production, render the configuration without GHR as unfavourable. Although SMRs with fluegas capture have lower CapEx requirements than its ATR counterparts, this advantage is outweighed by a lower degree of economical CO2 capture. This effect is compounded by benefits arising from higher output pressures that are achievable in ATRs as opposed to SMRs. Similarly, the WE process is not deployed in any of the scenarios due to its higher OpEx requirements (£63 per MW h of H2 using an electricity price of £45 per MW h) compared to the reforming technologies (£18 per MW h of H2 using a natural gas price of £13 per MW h). Furthermore, a CapEx reduction by 40% is necessary for the WE process to be comparable to ATRs.
Large scale availability of biomass may enable gas-reliant nations to achieve net-zero emissions from a H2-based heating supply through the combination of ATRs and BG with CCS.76,77 In fact, under the assumptions of this study, the maximum achievable reduction in CO2 emissions without the use of biomass is 85%. A key problem, which is largely unaddressed in literature, relates to the effect of variable CO2 capture rates on the cost competitiveness of fossil-based production facilities compared to NETs. The possibility to achieve greater CO2 removal by increasing the capture rates beyond 90% for CCS facilities is accompanied with very low marginal costs in the case of power generation facilities.78 However, further research must be undertaken to establish the economic value in raising the capture rates beyond 94% in ATRs. Furthermore, a comparison between the different NET options to provide negative emissions services can identify cost-effective opportunities.79
At lower CO2 removal targets, natural gas is used as the principal heating fuel with ATRs dispensing H2 in favourable locations to achieve lower overall total system costs. In addition to the ATRs, SMRs with syngas capture contribute significantly towards overall H2 supply as evidenced by almost 14 GW of capacity via this technology under a CO2 reduction level of 50%. Its economic favourability is the largest driver influencing its deployment. Nevertheless, this technology does not make any contributions to the design capacity at higher CO2 removal targets due to its greater CO2 footprint.
It is important to note that the maximum design capacity across all scenarios is approximately 55 GW. Current estimates of total UK H2 production capacity varies between 3–5 GW based on capacity factors of 70–90% at an annual throughput of 27 TW h.49 Thus, the design capacity is at least an order of magnitude larger than existing capacity. This signifies the importance of technologies such as ATRs with CCS, which can be deployed in larger capacities (at GW scales) as opposed to options such as WE or BG with CCS, requiring significant scale-up before deployment. Additionally, the design capacity is equivalent to a quarter of the estimated peak hourly domestic demand of 205 GW, implying an extensive network reliance on large scale underground H2 storage.
4.2 Economic trade-offs between H2 production and storage infrastructure
The system value of storage availability in a time dependent application such as heating consumption is illustrated in Fig. 6. The system value, in this instance, is defined as the reduction in TAC per unit of storage installed.81 The curve indicates the potential for diminishing returns with increases in available storage volume. Thus, expansion of available storage through construction of additional caverns can add limited value to the system. An approximate twelve-fold increase in H2 storage capacity to 65 TW h within GB offers a 20% reduction in TAC compared to that in the absence of any storage. Importantly, the ability of production technologies to satisfy varying demands in regions without geological storage is not very well understood. The optimal technology choices from Section 4.1 may not necessarily be applicable in the absence of sufficient storage. The total design capacity requirements for a complete decarbonisation of demand with increasing availability of storage potential is depicted in Fig. 7.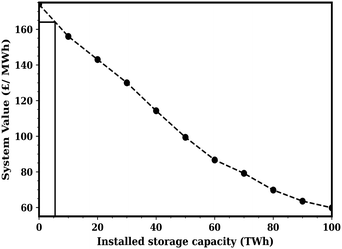 | ||
| Fig. 6 System value of H2 storage in a net zero emissions based heating supply as a function of installed storage capacity. The system value is quantified based on a reduction in TAC, relative to a supply with no storage. The polygon in the left of the figure represents the value of the existing storage potential in GB if natural gas caverns were repurposed to store H2.80 | ||
Owing to economies of scale, reforming technologies at lower sizes (400 and 700 MW) are not deployed at all under storage limitations. The WE process appears to be dominant in the complete absence of storage infrastructure although it is only utilised at peak demands due to its higher OpEx requirements. The peak day operating mix in the complete absence of storage is summarised in Section S3 of the ESI.† In general, the deployment potential of the WE process does not rely on storage availability as direct access to grid power can tackle the intermittency of renewable sources. Nevertheless, there appears to be an economic incentive to deploy this technology at scale due to its favourable ability to respond rapidly to load variations. A corollary of the above observation is that the value of flexible production in technologies is increased in storage-constrained applications. The total design capacities of both ATRs and BGs with CCS are largely invariant and independent of the amount of available storage. These technologies can be utilised to a greater extent throughout the annual time horizon.
From Fig. 7, it also appears favourable to install SMRs with syngas capture in regions with limited access to storage infrastructure. The provision of storage infrastructure enables the inflexible reformer units to operate at higher utilisation rates without the need for significant operational flexibility. SMRs with syngas capture are only utilised in periods of high demand even though their aggregate design capacity is higher than the remaining options. Negative emissions are provided via BG with CCS and used to offset the residual emissions from SMR with syngas capture.
4.3 What is the impact on resource consumption?
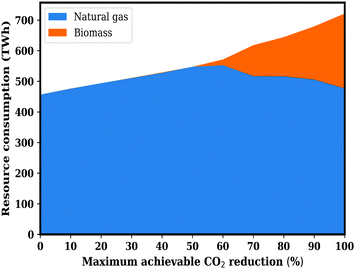
The annual resource consumption requirements were computed as an aggregate of the resource usage across all of the production technologies in the capacity mix. The power requirement across all production processes was translated into further natural gas consumption through the definition of an average conversion efficiency of 44% for the electricity grid, which is representative of the UK as reported by the IEA.82Fig. 8 displays the resource requirements for natural gas and biomass at varying levels of decarbonisation. Due to the favourable deployment of reforming technologies with CCS, natural gas continues to have significant importance in a low-carbon environment. Its consumption can be expected to increase in designs with achievable system-wide emissions reduction of 60% or below as illustrated by the figure. However, further reductions in CO2 emissions result in the consumption of biomass, which reduces the overall consumption of natural gas to figures comparable to present use. Therefore, it can be clearly stated that a least cost supply of H2 does not necessarily increase the national reliance on natural gas, especially if CO2-neutrality is the principal design constraint. The energy conversion efficiency, expressed as the share of energy output relative to the energy input for the heat supply, ranges from 58% (net-zero emissions using H2)–92% (natural gas). The adoption of a least cost network for complete decarbonisation appears to reduce the total resource conversion efficiency. This is primarily due to the increasing deployment of BG with CCS, which is less energetically efficient compared to the methane reforming routes, and direct combustion of natural gas. Improvements in the energy efficiency of NETs will support a resource efficient, sustainable transition into a net zero emissions-based H2 economy.
5 Regional transition pathway
5.1 Rate of deployment
By 2050, 48 GW of H2 production capacity (40 GW from ATRs with GHR and CCS and 8 GW from BG with CCS), which is at least an order of magnitude increase compared to present capacity, needs to be installed with large scale expansions in storage infrastructure. BG with CCS needs to be introduced as early as 2020s for cost-effective reduction in CO2 emissions. The rate of deployment of production capacity is greater in the first ten years of the transition (1.6 GW per year) than at later times (1.1 GW per year). The rate of development of storage assets across the Cheshire, East Irish Sea, East Yorkshire within GB is approximately linear at 1.7 TW h per year. Within the first 5 years of the transition, the total storage capacity developed for H2 is approximately equivalent to existing natural gas storage volume within GB. The rate of deployment of storage infrastructure increases to 3.7 TW h per year through the installation of caverns in the Dorset region from 2035 onwards. The infrastructure eventually relies on approximately 85 TW h of cavern-based H2 storage by 2050, which is within GB's capabilities.83 As a result, there is an increase in the relative share of investment that is apportioned to H2 storage with time.The maximum amount of CO2 injection capacity needed by 2050 is approximately 105 Mt per year (30 Mt per year in the East Irish Sea, 65 Mt per year in the Southern North Sea, and 9 Mt per year in the Northern North Sea). The overall requirements for CO2 storage in the North Sea over the 35 year lifetime of H2-based heating infrastructure is approximately 3.7 Gt CO2, which is within GB's capabilities based on injection rates between 1–2.5 Mt per year per well as shown in Mathias et al.56 and Bentham et al.84 The average rate of development of CO2 storage capacity is 3.1 Mt per year, which is particularly challenging given that at the time of writing, there are no operational CO2 storage projects within the region.
The absence of a commercially viable business model presently hinders the deployment of CCS infrastructure. Governments have an important role in reframing the policy initiatives to encourage investment in CCS technology. CCS supply chains are technically and commercially mature, unlike several other low-carbon technologies, and are well suited to large-scale applications as demonstrated through an array of projects.85 The urgent need to deploy infrastructure, as highlighted by this study, limits the capacity for new and immature technologies to have a material impact. In the absence of government intervention and the formulation of suitable business models, nations could expose themselves to the risk of failing to meet carbon-neutrality due to the increasing strains on immature, new technologies.
5.2 Cost-optimal regions
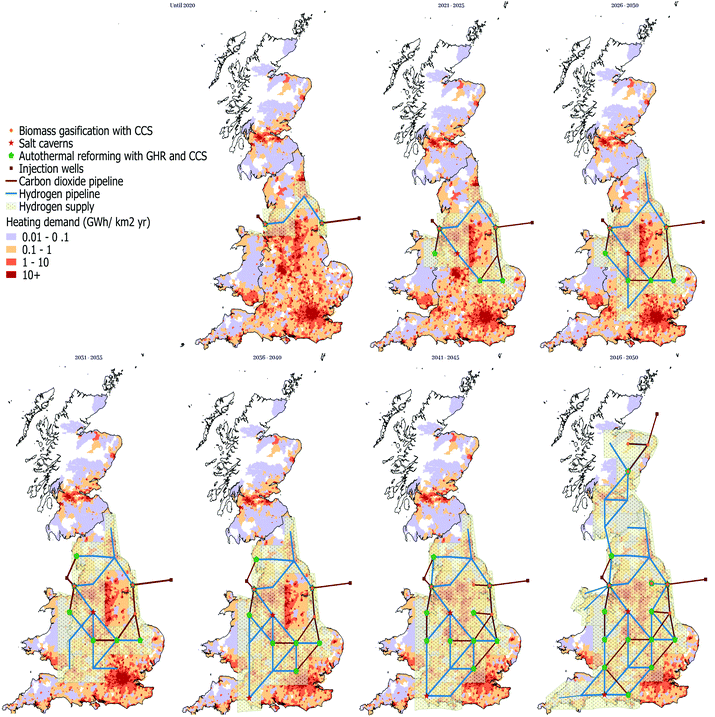
Fig. 9 depicts the regional deployment trajectory to support the complete decarbonisation of the heating sector. By 2020, approximately 10 GW of H2 production capacity is distributed over two locations, representing the centralised nature of production. Production technologies are located in coastal regions with access to H2 storage in addition to close proximity to CO2 storage. The total demand for H2 in adjoining regions appears to have an influence on optimal infrastructural locations, but to a lesser extent than the aforementioned factors. Nevertheless, the cumulative production capacity installed in a given location is dependent on the scale of demand in conjunction with availability of H2 storage.During the expansion process, network connectivity appears to be maintained between production facilities through the emergence of H2 transmission pipelines. This is not necessitated by the model constraints, which enforce an aggregate rather than a regional reduction in the CO2 emissions. An alternative mode of expansion could involve the conversion of fuel supply in a completely distinct region in which all of its adjoining neighbours are supplied with natural gas. Naturally, H2 production technologies must be installed in such a region. However, such possibilities are not realised in the optimal deployment trajectory, displaying economic benefits arising from a well connected network, potentially due to a greater utilisation of economic benefits arising from an asymmetric distribution of production capacity across a geographical region.
5.3 H2 storage is a network driver
In Fig. 9, there exists a sub-region (surrounded by the dotted region in the North East of England) which uses natural gas whilst all of its neighbouring regions utilise H2, forming a regional enclosure. This might not constitute a practicable conversion as it is difficult to isolate gas distribution supply. The gas supply in this region is only converted to H2 during 2040–2045 even though the region has high demands in addition to CO2 storage and H2 storage. Note that approximately 43% of GB's total H2 cavern storage potential is located in the three sites developed by 2025. This share is equivalent to 38 TW h of which 21 TW h is utilised by 2025. It is important to delineate this data as fuel switching from natural gas to H2 in the enclosed region would entail a near complete utilisation of the remaining 17 TW h of cavern storage potential. If converted initially, further regional expansions cannot utilise cavern storage without the integration of storage potential from the Dorset region (southernmost region with caverns). In such instances, the demand must be satisfied wholly through increases in production capacity, resulting in increased costs during expansion, which can be mitigated by the delayed conversion of the enclosed region. This is evidenced by the continued expansion of H2 network to the southern regions incorporating localised areas of high demands in addition to the development of storage infrastructure in the Dorset region by 2040. Further network expansions during 2041–2045 finally convert the aforementioned enclosed region. This emphasises the importance of H2 storage availability on the deployment rates of infrastructure and its overall utilisation for cost-effective decarbonisation.5.4 Low demand areas are more expensive
By 2050, the network extends further to regions within Scotland, resulting in a completely decarbonised heating network. The delayed conversion of Scotland stems from the increased expenditures that are incurred to satisfy a relatively sparse distribution of demand, although the absence of cavern storage is likely to be a factor of greater importance. A near complete conversion of Scotland's gas supply may not be practicable in 5 years due to the large extent of geographical areas that are involved. This is an outcome of the assumptions related to a linear reduction in emissions across the heating sector. The results indicate that localised regions with high heating demand densities are converted with priority since they offer substantial reductions in CO2 emissions intensity without incurring additional costs for transmission infrastructure. Thus, regions with low heating demand densities are converted only if higher levels of CO2 reduction are desired. A complete conversion of regional gas supply to H2 is not necessary for complete decarbonisation of the heating network. This is principally due to the availability of biomass for providing negative emissions services, enabling the continued use of natural gas in regions where it is economically unfavourable to supply with H2.6 Economic evaluation
6.1 Capital investment breakdown
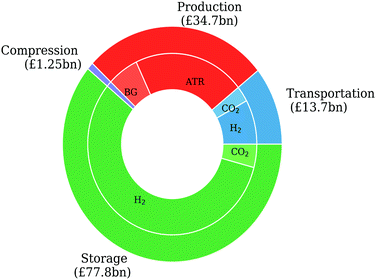
The key components of infrastructure CapEx are structured into different functional categories such as Production, Transportation, Compression and Storage with relative CapEx shares of 27%, 11%, 1% and 61% respectively as illustrated viaFig. 10. Note that the transport investments for H2 specifically refer to transmission infrastructure as opposed to distribution infrastructure. The latter is assumed to be available as a result of the conversion of cast iron pipelines through the Iron Mains Replacement Programme (IMRP) in the UK.86The total investments within each category are evaluated as an aggregate sum total of the infrastructural investments across the entirety of the system. The “Production” category contains all the investment costs associated with H2 production with integrated CO2 capture, in addition to equipment costs for compression, purification of H2 and CO2 within the battery limits of the installed plant. When technologies such as ATRs are used, total investment costs include Air Separation Unit (ASU) installation costs. The “Transportation” category contains infrastructural investments required for H2 and CO2 piping both onshore and offshore. The “Compression” category contains capital requirements for the installation of “booster” or intermediate compression stages across the length of a pipeline, when necessary. Finally, the “Storage” category contains the investment costs associated with the installation of underground H2 storage as well as CO2 storage. The largest cost component across the entire system is H2 storage which surpasses production related investments, providing greater economic value than what is achievable in its absence. ATR facilities contribute more towards production-related investments than BG with CCS due to its greater share of installation capacities. Overall transportation costs are higher for H2 compared to CO2 due to the larger pipeline network. The availability of distribution infrastructure lowers the overall investment requirements considerably as the low-pressure distribution network (218![[thin space (1/6-em)]](https://www.rsc.org/images/entities/char_2009.gif) 000 km) is much larger than the high-pressure transmission network (19
000 km) is much larger than the high-pressure transmission network (19![[thin space (1/6-em)]](https://www.rsc.org/images/entities/char_2009.gif) 600 km) for natural gas.13
600 km) for natural gas.13
The transition pathway presented in this study relies on the retirement of the first production assets with CCS in the period between 2050–2060. By that time frame, improvements in water electrolysis technology along with potentially lower electricity costs could enable a low-cost transition to an electrolytic-H2 supply. As noted above, the investment requirement for production infrastructure is 27% of the total investment capital, representing a smaller share in comparison with H2 storage and transmission infrastructure. The infrastructure investments are also necessary for electrolytic-H2 production due to the intermittency of renewable power. Furthermore, any unused CO2 transport and storage infrastructure can be used to facilitate industrial CCS and negative emissions technologies, thereby improving the robustness of infrastructure investments.
6.2 Impact of the cost of capital
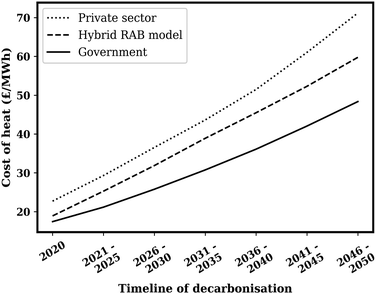
The total costs associated with a transition into a H2-based heating sector is greatly influenced by the cost of capital. The sourcing of capital for funding this enterprise remains a key challenge. Fuel poverty remains a major issue in several gas-reliant nations and potential infrastructural changes must avoid exacerbating these issues and ensure affordable access to energy services. Government financing from its generated revenue was used for gas infrastructure financing in the transition from a town gas-based heating network to natural gas in GB by 1970s.87 Although government ownership has the ability to lower the project costs compared with private financing, the procurement of necessary funding may have significant impacts on consumers' purchasing power. Alternative financing strategies could seek involvement from the private sector for financing some or all of infrastructural operations in the network. However, private sector investment is unlikely to materialise without long-term assurances and a revenue certainty from market operations.The total costs associated with the supply of heat calculated for three distinct scenarios, are shown in Fig. 11. The distinctions indicate the effect of financing via (a) private sector financing in its entirety; (b) hybrid regulated asset base (RAB) framework,88 with a lower cost of capital for transport & storage of both H2 and CO2 elements, along with private sector financing rates for the production infrastructure; (c) government financing in its entirety. For the private sector scenario, a cost of capital of 14% was assumed. The hybrid RAB model for transport & storage assumes a cost of capital of 6%,89 with private sector hurdle rates for production infrastructure. The government cost of borrowing was assumed to be 3.5%90 and in all these scenarios, an economic lifetime of 35 years was assumed. Fig. 11 shows the evolution of the cost of heat for consumers depending on the commercial frameworks that are deployed. By 2050, the cost of heat can be estimated as £48 per MW h, £60 per MW h and £71 per MW h under government, hybrid RAB and private sector cost structures respectively. This reflects cost increases of 190%, 260% and 320% relative to heat from natural gas, thus increasing the potential for more consumers to be “fuel poor” in the absence of any financial support. Nevertheless, the hybrid RAB model may prove to be important in mobilising investment through the reduction of risk (relative to private finance), thereby improving the affordability of the infrastructure.
6.3 Cost of heat supply
GSA is used based on the methodology summarised in Section 3.2 to evaluate the variability in the cost of heat supply, and derive insights into the likely level of financial support required to deploy infrastructure. 4 model parameters were selected for sensitivity analysis: gas, electricity and biomass prices in addition to cavern cost as they represent key uncertainties. The uncertainty intervals for gas and electricity price distributions are based on the projections by BEIS on future prices.13,91 Similarly, the intervals for biomass price are captured from Committee on Climate Change (CCC) projections of future prices.92 Cavern costs may vary depending on the sites and their specific construction and operation requirements. Intervals for cavern costs were conservatively chosen based on estimates of low and high cost thresholds, capturing evidence from recent technical appraisals.9,13,53 10![[thin space (1/6-em)]](https://www.rsc.org/images/entities/char_2009.gif) 000 samples were subsequently generated from a uniform distribution of the input parameters and simulated to evaluate their impact on the TAC.
000 samples were subsequently generated from a uniform distribution of the input parameters and simulated to evaluate their impact on the TAC.
Multivariate linear regression was used to identify β coefficients that rank the relative importance of these input parameters as first order sensitivity indices. The estimation procedure adopted for the formulation of the regression model involved identifying the input parameters with largest correlation on the output. The adjusted coefficient of determination, ![[R with combining macron]](https://www.rsc.org/images/entities/i_char_0052_0304.gif) 2 modifies R2 based on the number of independent variables and the sample size to ensure that overfitting of the data is avoided. Section S2 of the ESI† contains detailed equations for
2 modifies R2 based on the number of independent variables and the sample size to ensure that overfitting of the data is avoided. Section S2 of the ESI† contains detailed equations for ![[R with combining macron]](https://www.rsc.org/images/entities/i_char_0052_0304.gif) 2 and β coefficients. The simplest model form containing gas price as the sole explanatory variable results in a
2 and β coefficients. The simplest model form containing gas price as the sole explanatory variable results in a ![[R with combining macron]](https://www.rsc.org/images/entities/i_char_0052_0304.gif) 2 value of 0.505. The inclusion of biomass price and subsequently, cavern costs increase the
2 value of 0.505. The inclusion of biomass price and subsequently, cavern costs increase the ![[R with combining macron]](https://www.rsc.org/images/entities/i_char_0052_0304.gif) 2 value to 0.768 and 0.984 respectively. This leads to the conclusion that almost all of the variance in the cost of heat supply stem from the potential variability in gas, biomass prices in addition to cavern costs. The β coefficients for gas price, biomass price and cavern cost are 0.71, 0.51 and 0.47 respectively. This exposes gas price as the factor of greatest impact on the cost, followed by the biomass price and CapEx of caverns. Further details on the statistical validity of the regression models and corresponding β coefficients are described in Section S3 of the ESI.†
2 value to 0.768 and 0.984 respectively. This leads to the conclusion that almost all of the variance in the cost of heat supply stem from the potential variability in gas, biomass prices in addition to cavern costs. The β coefficients for gas price, biomass price and cavern cost are 0.71, 0.51 and 0.47 respectively. This exposes gas price as the factor of greatest impact on the cost, followed by the biomass price and CapEx of caverns. Further details on the statistical validity of the regression models and corresponding β coefficients are described in Section S3 of the ESI.†
The total costs of CO2 avoidance was obtained by normalising the output TAC vector by the CO2 emissions avoided in the design. Fig. 12 illustrates the distribution of the aforementioned metric using histograms with a bin width of 0.25. The resulting data approximates a normal distribution with a mean of £176 per ton and a standard deviation of £18 per ton. The distribution covers an interval ranging between £120–240 per ton. The levelised costs of a H2-based heat supply under a hybrid RAB model ranges between 5.2–8.6 pence per kW h compared to natural gas at 1.0–2.8 pence per kW h based on the guidance from BEIS.13,91 Over a 35 year timeframe, the total cost of heat supply may be greater by a factor of 3 on average compared to present prices.94
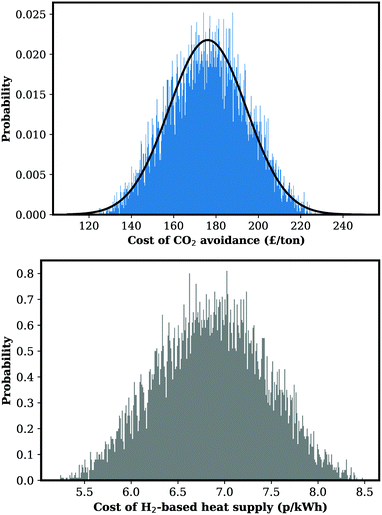 | ||
| Fig. 12 The total cost of CO2 avoidance, and heat supply as a result of deploying H2-CCS infrastructure in 2050. The cost of heat supply excludes distribution-related charges, which is typically responsible for 25% of a domestic natural gas bill.93 The relative contribution of distribution related costs to the overall cost of H2-derived heat is likely to be lower compared to natural gas. Nevertheless, the cost of a H2-based heat supply is on average, three times more expensive than natural gas at present. | ||
There is a policy gap in the domestic and commercial heating sectors in the majority of countries, which pertain to the usage of unabated natural gas without any economic penalties. The development of market reforms with appropriate levers, such as the introduction of an effective CO2 price, on unabated natural gas consumption will be necessary in the long-term. However, a complete reliance on a free-market approach without any financial support is likely to be undesirable, even with an active CO2 emissions trading market in the aforementioned sectors. This is especially the case if the CO2 price floor is insufficient to encourage investment, resulting in a delayed start to the energy transition. This precipitates the need for higher rates of technology deployment in later years in order to achieve net-zero emissions, thereby increasing the risk for supply chains and potentially compromising the transition. Therefore, financial support mechanisms are likely to be necessary in facilitating investment in low-carbon H2 production assets.
An appropriate level of financial support for a mechanism such as a Contract for Difference (CfD) was estimated by costing the production infrastructure at a cost of capital of 14%, which is typically used by the private sector. This results in a strike price for the heat service, ranging between £40 per MW h and £67 per MW h. Assuming the cost of natural gas supply as the market price for the heat service, a CfD payment between £20 per MW h and £53 per MW h may be necessary for H2 producers alone. Additionally, a CO2 price of £104–£268 per ton is necessary in order for H2 to achieve parity relative to natural gas without any financial support. Thus, higher market valuations of the externalities associated with CO2 will ensure that methane-derived H2 supply can operate independently without the need for ongoing financial subsidies. The cost of the remaining RAB for transport and storage elements amounts to £11–£18 per MW h as opposed to £19–£32 per MW h, which would be required via the private sector in the absence of a regulated framework. It is possible to reduce the overall cost of heat supply by securing natural gas and biomass supply contracts under approximately £17 per MW h and £90 per ton. Technology appraisals in cavern construction and operation will also lead to uncertainty reduction in the estimates for total costs. In addition, the efficient management of resource supply chains can reduce the total costs considerably as summarised in Section S3 of the ESI.†
Additional revenue from carbon capture and utilisation (CCU) can improve the economic viability of infrastructure investments. However, the overall global warming potential of the CCU process must be considered, along with the end-use market for CO2-derived products on a case-by-case basis. New advancements in CO2 capture materials, solvents and processes have the ability to lower the cost of CO2 abatement via both ATRs and gasification.95 However, further economic analysis must be undertaken to identify the most suitable materials for large-scale applications. Furthermore, recent developments in photocatalytic water splitting have shown the potential to operate at higher efficiencies than commercially available electrolysis technology.96 Similarly, Chen et al.97 has shown that the electro-oxidation of biomass-derived alcohols have the ability to lower the overall energy requirements relative to conventional WE. Nevertheless, additional research and development efforts are needed to increase the technology readiness levels of these technologies towards commercialisation.
7 Conclusion
ATRs with GHR and CCS have an important role (75–80% of the installed capacity) due to their ability to provide cost-effective CO2 mitigation. The deployment of larger capacity modules are preferable in regions with high demands due to economies of scale effects. A low-carbon H2-based heat supply can be developed cost-effectively through the deployment of reforming technologies with CCS and NETs using large scale H2 storage in salt caverns, and CO2 storage in deep geological reservoirs. The exact technology portfolio is likely to differ depending on the analysed region, based on spatio-temporal variations in H2 demand, geological storage, etc.It was found that a ten-fold expansion in H2 storage capacity to approximately 65 TW h could yield a reduction in total system costs by at least 20% relative to a system with no H2 storage. Both WE and H2 storage compete to provide resilience and flexibility to the designed infrastructure. The WE process is primarily deployed in the absence of H2 storage as a process for satisfying peak demands. Thus, displaying parallels with the usage of back-up fossil generation in the power sector for meeting peak demands.
The overall energy conversion efficiency of heat supply decreases from 92% (natural gas) to 58% (net-zero emissions using H2), when considering all the infrastructural operations from the battery limit of the production plant to the use. This is mainly due to the lower resource efficiency of key technologies such as BG with CCS. A complete regional conversion of natural gas supply to H2 is unnecessary for net-zero CO2 emissions due to the availability of NETs. Cost-effective regions for locating infrastructure are distinguished by their relatively high demands for H2 in addition to storage availability for both H2 and CO2. HSCs that are based on methane reforming technologies may necessitate local reinforcements to existing natural gas transmission infrastructure to manage the increased load requirements from the production facilities. Furthermore, cost-optimal regional transitions to a H2-based heat supply exploits network connectivity through H2 pipelines. This indicates that it is economically favourable to centralise H2 production and expand from existing infrastructure than have a distributed mode of production. These findings imply that cost-effective transitions into H2–CO2 infrastructure in other geographies are dependent on the identification of similar regional characteristics.
Total investment capital requirements are contingent on the CapEx of H2 storage infrastructure in addition to the production infrastructure. Transportation infrastructure for both H2 and CO2 contribute a relatively smaller share (11%) towards total investment requirements. Total system costs, comprising of both investment and operation elements, is mostly influenced by the natural gas price, followed by biomass price and cavern construction costs. The total cost of CO2 avoidance was closely approximated by a normal distribution with a mean of £176 per ton and a standard deviation of £18 per ton. The levelised cost of a H2-based heat supply ranges between 5.2–8.6 pence per kW h compared to a natural gas supply at 1.1–2.8 pence per kW h.91 Over the lifetime of the infrastructure, the total cost of heat supply may be greater by a factor of 3 on average compared to present prices. A financial support mechanism such as a CfD payment of £20–£53 per MW h is necessary for H2 producers in order to achieve price parity with natural gas until an effective CO2 price of £104–£268 per ton is reached, thereby eliminating the need for support. Furthermore, a hybrid RAB model reduces the cost contribution of transport and storage elements from £19–£32 per MW h to £11–£18 per MW h, resulting in a more affordable energy transition for the consumer. Importantly, comparable levels of financial support are likely to be required for the transition to occur in other regions, especially as natural gas is cheaper than H2 at present.
The authors note that improvements in technologies and the resource market have the potential to influence the specific infrastructural solution. However, a key insight from this study is that the high deployment rates required for carbon-neutrality by 2050 necessitates prompt action. There is insufficient time to innovate and scale-up new technologies in the period to 2050, especially as the deployment pathway is challenging to achieve with readily available technologies, which have established supply chains. Future work should analyse the role of H2 in tandem with other CO2 abatement options to better understand their influence on infrastructure planning, policy frameworks and regional productivity.
Conflicts of interest
There are no conflicts to declare.Appendices
A Resource and technology characterisation
The pressure levels of resources such as H2 and CO2 in pipelines are modelled through a discrete representation of pressure. Maximum mass flowrates in pipe flow are computed on the basis of average pipeline length (i.e., identical to the cell distance), its sizing dimensions and maximum allowable pressure drops. The process modelling software, gPROMS was used to perform pressure drop calculations using Haaland and constant friction factor correlations.98 Physical property data for H2 was obtained using the gSAFT-γ Mie component package with the exception of the fluid viscosity term, which was obtained from the National Institute of Standards and Technology (NIST).55 Maximum allowable pressure drops were determined by ensuring that the flow velocity does not exceed the erosional velocity in pipelines. The maximum flow capacity was constrained on the basis of maximum allowable flow velocity and corresponding pressure drops through pipelines of distinct sizes. Consequently, H2 transmission pipelines were constrained on the basis of a peak pressure drop of 20 bar across its pipeline length (approximately 80–100 km). This description enables the computation of investment decisions associated with intermediate compressor stations spaced along the pipeline. Pressure drops for CO2 were evaluated at a range of desired flowrates and pipeline lengths, leading to the observation that it is not a constraining factor. Thus, “booster” stations were not explicitly taken into account for dense phase CO2.
A.2.1 Steam methane reforming (SMR). The SMR process is undoubtedly the most mature and dominant process technology for the production of H2.99 Approximately half of global H2 supply is produced using this process100 in view of its attractive economical performance.101 The process uses a pre-heated feed of methane and steam which reacts in a reformer unit to produce a syngas mixture containing CO, CO2 and H2. The syngas mixture undergoes further conversion with steam in the water gas shift (WGS) reactor in order to produce more H2; this process is accompanied by a further conversion of CO into CO2. The reforming reactions are highly endothermic and require a significant supply of heat. This process typically operates at 800–1000 °C and at pressures of 20–40 bar. The effluent stream undergoes purification using technologies such as Pressure Swing Adsorption (PSA) in order to remove CO, CO2 and H2O. There are two key sources of emissions in this process: (a) from the conversion of methane/CO with steam; (b) from the combustion of methane as a fuel.
Two potential plant configurations with CCS were considered promising for cost-effective CO2 capture from the analysis presented by Amec Foster Wheeler and the International Energy Agency (IEA).43 Amine based absorption technologies can be integrated with the SMR process to capture CO2 from the syngas stream to remove 55% of all emissions at approximately 19% higher total plant costs43 than a SMR plant without CCS. In this instance, the capture location is highlighted as point 1 in Fig. 13 and the resulting configuration is hereon referred to as SMR with syngas capture. The alternative is to capture a greater quantity of CO2 from both the combustion and process gas at an overall capture rate of 90%, increasing the total system costs by 79%43 compared to a standalone SMR plant, which corresponds to point 2 in the figure. This configuration is explicitly referred to as the SMR with flue gas capture in the ensuing discussion. The increase in total system costs between the two configurations can be attributed to the dilution of the CO2 concentration in the flue gas stream. The energetic conversion efficiencies are assumed to be 73% and 70% on a higher heating value (HHV) basis for SMRs with syngas and flue gas capture respectively.42 The CapEx requirements are assumed to be £320 per kW and £80 per kW for a 1 GW facility of SMRs with syngas capture and flue gas capture on average.11 All reformer technology costing figures are equivalent to an averaged learning rate induced cost reduction of 8% from current estimates over the time horizon.102
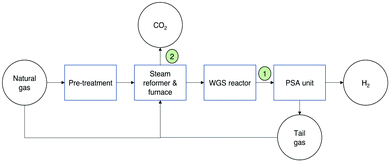 | ||
| Fig. 13 A schematic overview of the SMR process, indicating the two capture configurations included in this analysis. | ||
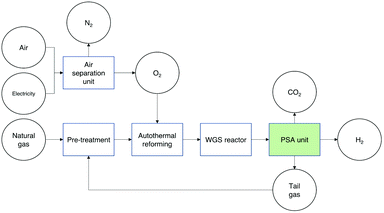
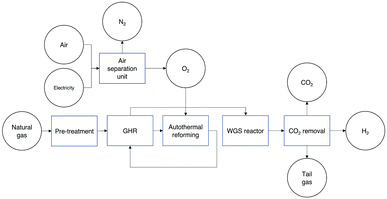
A.2.2 Auto-thermal reforming (ATR). Fig. 14 shows an ATR process, where some of the natural gas feed is partially combusted with O2 to produce syngas. Following which, the reforming reactions proceed in the same manner as in SMRs. This process is slightly exothermic with the advantage of offering good response times.103 The ATR process can be operated at comparatively higher pressures than SMR and produces a syngas mixture with a higher concentration and partial pressure of CO2/H2. This offers two key benefits: (a) it reduces the total CO2 capture costs; (b) it reduces the energy requirement for subsequent H2 compression. In addition, it can achieve higher capture rates economically in comparison to SMRs (up to 95%) due to the higher quantities of CO2 produced from the O2 fired process. In contrast to SMRs, the requirement for an Air Separation Unit (ASU) increases its power requirements. A standalone ATR plant with CCS is assumed to operate at an operating pressure of 40 barg, with an efficiency of 78%.11 The CapEx requirement is estimated as £510 per kW for a 1 GW facility over the time horizon.11
A.2.3 Gas heating reforming (GHR). GHR or heat exchanger reforming is used to exploit the high temperatures from the gaseous streams downstream of the reforming process to convert more natural gas to H2 as shown in Fig. 15. GHRs can be integrated with SMRs and ATRs and operated in both series and parallel configurations although there is limited commercial experience in its use. Parallel GHRs are better described than series GHRs at larger scales whereas a series configuration has lower methane slip in addition to higher CO2 capture rates.11,13 For this study, GHRs operated in a parallel configuration with ATRs are considered to operate at 40 barg with a process efficiency of 83%.11 The total CapEx requirements are defined as £490 per kW on the basis of a 1 GW facility.11
A.2.4 Water electrolysis (WE). In WE, water molecules are split directly into H2 and O2 using an electrolyser. Alkaline electrolysis using potassium hydroxide (KOH) electrolytes is a mature technology, which has been mainly used in WE applications. Technologies such as PEM and most recently, solid oxide electrolysis (SOE) have also been gaining in popularity.104 WE production systems operate at a variety of scales ranging from a few kW to many MWs. When the WE process is coupled with low-carbon electricity sources, the overall CO2 footprint is significantly reduced.105
In PEM electrolysis, typical output pressures are within 2–4 MPa. All of the electrolyser systems are capable of producing H2 at purities in excess of 99.95%. Both alkaline and PEM systems have high response rates, allowing for a rapid dispatch of H2 when necessary. This modelling framework only considers the use of PEM-based electrolysers for the supply of H2. It is assumed that the required power is imported from the existing electricity grid. The model formulation assumes an output pressure of 20 barg with a process efficiency of 72%.45 There is considerable scope for improvements in the process economics through economies of scale effects as current deployment has largely been limited to niche markets.106 Secondly, cost reduction potential from technology learning has been estimated to be as high as 31% in Schoots et al.102 A CapEx value of £880 per kW is assumed for the WE process on the basis of 100 MW units.11,46 The estimate used in this model formulation is equivalent to an averaged learning rate and scale induced cost reduction of 25% from current estimates.
A.2.5 Biomass gasification (BG). BG with CCS may have a significant role in the low-carbon H2 production mix due to its ability to produce H2 whilst delivering negative emissions.107 The thermal efficiency of BG is significantly lower than that of fossil fuel based gasification.107 There are concerns arising from the scarcity of biomass resources and the competition for limited resources in other sectors. BG with CCS is described in the model formulation with explicit definitions of its dependencies on the electricity/gas infrastructure. The overall process efficiency is assumed to be 40%49,108 with a H2 output pressure of 20 barg and an overall CapEx requirement of £1100 per kW on the basis of 200 MW units.11,47 The net negative emissions contribution at the point of generation is estimated as 0.42 kg CO2 per kW h.48
A.3.1 H2 transport. H2 can be transported using distribution technologies such as pipelines, compressed tube trailers, trucks, ships, etc. It is envisaged that pipelines will be utilised as the large scale of heating demand renders the aforementioned alternatives unfavourable.109 In GB, the IMRP, which converts low pressure distribution pipelines to polyethylene pipes, is scheduled to be completed in the early 2030s. Polyethylene pipes are more porous to H2 than natural gas, although this leakage is expected to be relatively small (0.001%) when compared to the total transported volume.50
Pipelines provide H2 storage opportunities through the linepack capacity of the network, which is less than a quarter of natural gas but it can be used to tackle daily demand variations.50,110 H2 transmission pipelines are typically constructed with low-carbon steel with an epoxy coating to prevent any metallic corrosion.67 At present, there are at least 1600 km of high pressure H2 pipelines in operation within the EU alone.111 The costs of constructing a new pipeline depends on many factors – pipeline diameter, the terrain, routing of pipelines, entrenchment, etc. On average, the construction costs are assumed to be 20% higher than natural gas.112 Only transmission pipelines are described in this model formulation due to the availability of existing infrastructure to support low pressure distribution of H2. H2 transmission pipelines of a variety of sizes: 18, 24, 36, 48 inches are described in the formulation.
A.3.2 CO2 transport. Similarly to H2, pipelines are the most viable and commonly used method to transport CO2.113 Gaseous CO2 is typically compressed to pressures above 8 MPa in order to increase its density and reduce transportation costs. In this state, dense phase CO2 behaves similarly to a compressible liquid with a density of approximately 900 kg m−3.114 In the US alone, at least 2500 km of pipelines are used to transport more than 40 MtCO2 per year from natural and anthropogenic sources to sites where CO2 is used for Enhanced Oil Recovery (EOR).115
The costs of CO2 transportation through pipelines depend mainly on the distance and quantity of CO2 transported. Offshore transportation is considerably more expensive than onshore transport due to the additional infrastructure requirements. In addition to region-specific factors, total costs are greater if there are intermediary compressor stations along the pipeline.116 Marine transportation of CO2via ships is not considered in this study due to the relative proximity of storage sites from the capture sources.
The model formulation assumes maximum injectivity and deliverability rates of 100 MW and 200 MW per cavern respectively, given volume/pressure constraints.13 There is uncertainty associated with these figures and they may not be representative of the geological characteristics in all of the storage sites within GB. However, these figures should be realisable as conservative estimates. The H21 North of England study revised their cavern cost estimates from £338 per MW h to £226 per MW h in their recent report.13 Energy Technologies Institute (ETI) storage appraisals indicate higher costs although there is potential to reduce total costs through sharing the above ground facilities.53 Additionally, ETI report that total costs of offshore caverns are 75% more expensive than onshore caverns when three caverns are used. However, this is likely to be a pessimistic estimate when considering a greater number of caverns per overground facility as the costs of water and brine pipelines are likely to increase onshore costs relative to offshore costs. The nominal cost for a cavern in this model formulation is assumed to be £500 per MW h with offshore caverns costing approximately 30% greater than the onshore caverns. The relative impact of these assumptions on total annualised system costs is studied in Section 6.3. All caverns are assumed to be sized at 300![[thin space (1/6-em)]](https://www.rsc.org/images/entities/char_2009.gif) 000 m3 and the working capacity is computed based on the operational pressure ranges. A series of geological deposits with formation pressures, Pmax of 105 and 270 bar are distributed across GB. The minimum cavern operating pressure, Pmin is calculated as 0.3Pmax.9 H2 volumetric energy density under these conditions is used to compute the maximum working capacity per cavern. Consequently, caverns with Pmax of 270 and 105 bar11 are assumed to have maximum working capacities of 144 and 64 GW h respectively.
000 m3 and the working capacity is computed based on the operational pressure ranges. A series of geological deposits with formation pressures, Pmax of 105 and 270 bar are distributed across GB. The minimum cavern operating pressure, Pmin is calculated as 0.3Pmax.9 H2 volumetric energy density under these conditions is used to compute the maximum working capacity per cavern. Consequently, caverns with Pmax of 270 and 105 bar11 are assumed to have maximum working capacities of 144 and 64 GW h respectively.
The availability of CO2 storage is central to any H2 network prospectively considering a reforming-based pathway. When injected, dense phase CO2 compresses and fills the pore space by displacing the fluids within the pore volume. In depleted oil and gas reservoirs, most of the surface equipment can be reutilised to reduce the total costs associated with storage. The total costs of sequestering a given quantity of CO2 depends on many factors such as the number of injection wells, well length, site development expenses, etc. The total injection rate into a storage site is determined using the number of injection wells in a site combined with the injectivity per well, which is estimated on average to be approximately 1.5 Mt of CO2 per year.56 There are uncertainties as to the maximum achievable injection rates in a given storage basin due to the uncertainties surrounding specific sub-surface interactions. There is considerable scope for improvements in the representation of region-specific geological considerations both in the case of H2 and CO2 as in d'Amore et al.118 This may require simplified representations of more detailed dynamic models that are capable of defining parameters such as injection rates based on previously injected volumes.
Acknowledgements
The authors would like to greatly acknowledge the PhD funding and support received from the ERA-NET ACT project, ELEGANCY. ACT ELEGANCY, Project No. 271498, has received funding from DETEC (CH), BMWi (DE), RVO (NL), Gassnova (NO), BEIS (UK), Gassco, Equinor and Total, and is cofunded by the European Commission under the Horizon 2020 programme, ACT Grant Agreement No. 691712. We are also thankful to Ronny Pini (Imperial College London) and Maria Yliruka (Imperial College London) for helpful discussions and input. Additionally, we would like to thank the four anonymous reviewers for their critical feedback and suggestions.Notes and references
- Committee on Climate Change, Net Zero – Technical report, May, 2019.
- H. Troup, Renewable Energy Focus, 2016, 17, 178–179 Search PubMed.
- European Commission, An EU Strategy on Heating and Cooling, European commission technical report, 2016.
- R. Gross and R. Hanna, Nat. Energy, 2019, 4, 358–364 Search PubMed.
- Department of Business Energy and Industrial Strategy (BEIS), Clean Growth – Transforming Heating – Overview of Current Evidence, 2018.
- Instituto Nacional de Estadistica y Geografia, Canada Natural Resources, SENER, U.S. Energy Information Administration and Estados Unidos Mexicanos, Underground natural gas storage, 2017.
- U.S. Energy Information Administration, Underground Natural Gas Working Storage Capacity – U.S. Energy Information Administration, 2019, https://www.eia.gov/naturalgas/storagecapacity/.
- R. G. Egging and S. A. Gabriel, Energy Policy, 2006, 34, 2762–2778 Search PubMed.
- O. Kruck, R. Prelicz and T. Rudolph, Assessment of the potential, the actors and relevant business cases for large scale and seasonal storage of renewable electricity by hydrogen under-ground storage in Europe, June, 2014.
- EU GeoCapacity, Assessing European Capacity for Geological Storage of Carbon Dioxide, Geus technical report, 2009.
- I. Walker, B. Madden and T. Foaad, Hydrogen supply chain evidence base, Department for business, energy and industrial strategy technical report, 2018.
- Department for Business Energy & Industrial Strategy, Greenhouse gas reporting: conversion factors, 2018, https://www.gov.uk/government/publications/.
- Northern Gas Networks & Equinor & Cadent, H21 North of England Report, 2018.
- European Environment Agency, Electricity generation – emission intensity, 2018, https://www.eea.europa.eu/data-and-maps/daviz/co2-emission-intensity-5.
- International Energy Agency, The Future of Hydrogen, June, 2019.
- S. A. van den Heever and I. E. Grossmann, Comput. Chem. Eng., 2003, 27, 1813–1839 Search PubMed.
- A. Almansoori and N. Shah, Chem. Eng. Res. Des., 2006, 84, 423–438 Search PubMed.
- A. Almansoori and N. Shah, Int. J. Hydrogen Energy, 2009, 34, 7883–7897 Search PubMed.
- A. Almansoori and N. Shah, Int. J. Hydrogen Energy, 2012, 37, 3965–3977 Search PubMed.
- S. De-León Almaraz, C. Azzaro-Pantel, L. Montastruc and S. Domenech, Int. J. Hydrogen Energy, 2014, 39, 11831–11845 Search PubMed.
- S. De-León Almaraz, C. Azzaro-Pantel, L. Montastruc, L. Pibouleau and O. B. Senties, Int. J. Hydrogen Energy, 2013, 38, 14121–14145 Search PubMed.
- J. Kim, Y. Lee and I. Moon, Int. J. Hydrogen Energy, 2008, 33, 4715–4729 Search PubMed.
- G. Guillén-Gosálbez, F. D. Mele and I. E. Grossmann, AIChE J., 2009, 56, 650–667 Search PubMed.
- N. Sabio, A. Kostin, G. Guillén-Gosálbez and L. Jiménez, Int. J. Hydrogen Energy, 2012, 37, 5385–5405 Search PubMed.
- N. Johnson and J. Ogden, Int. J. Hydrogen Energy, 2012, 37, 5421–5433 Search PubMed.
- N. V. S. N. Murthy Konda, N. Shah and N. P. Brandon, Int. J. Hydrogen Energy, 2011, 36, 4619–4635 Search PubMed.
- S. Samsatli and N. J. Samsatli, Appl. Energy, 2017, 220, 893–920 Search PubMed.
- S. Samsatli, I. Staffell and N. J. Samsatli, Int. J. Hydrogen Energy, 2016, 41, 447–475 Search PubMed.
- J.-H. Han, J.-H. Ryu and I.-B. Lee, Int. J. Hydrogen Energy, 2012, 37, 5328–5346 Search PubMed.
- Z. Li, D. Gao, L. Chang, P. Liu and E. N. Pistikopoulos, Int. J. Hydrogen Energy, 2008, 33, 5275–5286 Search PubMed.
- P. Nunes, F. Oliveira, S. Hamacher and A. Almansoori, Int. J. Hydrogen Energy, 2015, 40, 16408–16418 Search PubMed.
- A. Almansoori and A. Betancourt-Torcat, Energy, 2016, 111, 414–429 Search PubMed.
- M. Moreno-Benito, P. Agnolucci and L. G. Papageorgiou, Comput. Chem. Eng., 2017, 102, 110–127 Search PubMed.
- A. C. Weber and L. G. Papageorgiou, Chem. Eng. Res. Des., 2018, 131, 266–278 Search PubMed.
- S. Samsatli and N. J. Samsatli, Appl. Energy, 2019, 233–234, 854–893 Search PubMed.
- N. Johnson and C. Yang, Optimal Design of a Fossil Fuel-Based Hydrogen Infrastructure with Carbon Capture and Sequestration: Case Study in Ohio, National hydrogen association technical report, 2005.
- S. De-León Almaraz, C. Azzaro-Pantel, L. Montastruc and M. Boix, Chem. Eng. Res. Des., 2015, 104, 11–31 Search PubMed.
- Department of Business Energy and Industrial Strategy (BEIS), Sub-national gas consumption data – GOV.UK, https://www.gov.uk/government/collections/sub-national-gas-consumption-data.
- J. Rosenow, P. Guertler, S. Sorrell and N. Eyre, Energy Policy, 2018, 121, 542–552 Search PubMed.
- Office for National Statistics, Overview of the UK population, 2018, https://www.ons.gov.uk/peoplepopulationandcommunity/populationandmigration/populationestimates/articles/overviewoftheukpopulation/november2018.
- R. Sansom, Decarbonising low grade heat for low carbon future, October, 2014.
- IEAGHG, Techno - Economic Evaluation of SMR Based Standalone (Merchant) Hydrogen Plant with CCS, February, 2017.
- G. Collodi, G. Azzaro, N. Ferrari and S. Santos, Energy Procedia, 2017, 114, 2690–2712 Search PubMed.
- J. Meerman, E. Hamborg, T. van Keulen, A. Ramírez, W. Turkenburg and A. Faaij, Int. J. Greenhouse Gas Control, 2012, 9, 160–171 Search PubMed.
- D. Scamman and M. Newborough, Int. J. Hydrogen Energy, 2016, 41, 10080–10089 Search PubMed.
- O. Schmidt, A. Gambhir, I. Staffell, A. Hawkes, J. Nelson and S. Few, Int. J. Hydrogen Energy, 2017, 42, 30470–30492 Search PubMed.
- Ecofys, Bioenergy Heat Pathways to 2050 – Rapid Evidence Assessment, 2018.
- National Renewable Energy Laboratory, H2A: Hydrogen Analysis Production Case Studies, 2015, https://www.nrel.gov/hydrogen/h2a-production-case-studies.html.
- Energy Research Partnership, Potential Role of Hydrogen in the UK Energy System, October, 2016.
- D. Haeseldonckx and W. D'haeseleer, Int. J. Hydrogen Energy, 2007, 32, 1381–1386 Search PubMed.
- Zero Emissions Platform, The Costs of CO2Capture, Transport and Storage, 2011.
- Gas Storage Europe, GIE – Gas Infrastructure Europe – Maps & Data, http://www.gie.eu/maps_data/storage.asp.
- Energy Technologies Institute, The role of hydrogen storage in a clean responsive power system, 2015.
- Northern Gas Networks, The H21 City Gate Project, 2016.
- National Institute of Standards and Technology, Thermophysical Properties of Fluid Systems, https://webbook.nist.gov/chemistry/fluid/.
- S. A. Mathias, J. G. Gluyas, W. H. Goldthorpe and E. J. Mackay, Environ. Sci. Technol., 2015, 49, 13510–13518 Search PubMed.
- C. C. Pantelides, Proceedings on the second conference on foundations of computer aided operations, 1994, pp. 253–274.
- X. Zhang and R. Sargent, Comput. Chem. Eng., 1996, 20, 897–904 Search PubMed.
- G. Schilling and C. Pantelides, Comput. Chem. Eng., 1996, 20, S1221–S1226 Search PubMed.
- G. Schilling and C. Pantelides, Comput. Chem. Eng., 1999, 23, 635–655 Search PubMed.
- A. Dimitriadis, N. Shah and C. Pantelides, Comput. Chem. Eng., 1997, 21, S1061–S1066 Search PubMed.
- P. Castro, A. P. F. D. Barbosa-Pó and H. Matos, Ind. Eng. Chem. Res., 2001, 40, 2059–2068 Search PubMed.
- P. M. Castro, A. P. Barbosa-Pó and H. A. Matos, Ind. Eng. Chem. Res., 2003, 42, 3346–3360 Search PubMed.
- P. Castro, H. Matos and A. Barbosa-Póvoa, Comput. Chem. Eng., 2002, 26, 671–686 Search PubMed.
- S. Samsatli, N. J. Samsatli and N. Shah, Appl. Energy, 2015, 147, 131–160 Search PubMed.
- M. Dorrington, M. Lewitt, I. Summerfield, P. Robson and J. Howes, Desk study on the development of a hydrogen-fired appliance supply chain, July, 2016.
- P. E. Dodds, I. Staffell, A. D. Hawkes, F. Li, P. Grünewald, W. McDowall and P. Ekins, Int. J. Hydrogen Energy, 2015, 40, 2065–2083 Search PubMed.
- J. Keirstead and N. Shah, Urban energy systems: an integrated approach, Routledge, 2013, p. 312 Search PubMed.
- A. A. Saltelli, Global sensitivity analysis: the primer, John Wiley, 2008, p. 292 Search PubMed.
- S. Pye, N. Sabio and N. Strachan, Energy Policy, 2015, 87, 673–684 Search PubMed.
- GAMS, General Algebraic Modeling System – Download, https://www.gams.com/download/.
- Python.org, Python 2.7.0 Release, https://www.python.org/download/releases/2.7/.
- QGIS, QGIS – The Leading Open Source Desktop GIS, 2017, https://www.qgis.org/en/site/about/index.html.
- G. Strbac, D. Pudjianto, R. Sansom, P. Djapic, H. Ameli, N. Shah, N. Brandon and A. Hawkes, Analysis of Alternative UK Heat Decarbonisation Pathways, August, 2018.
- Element Energy & E4tech, Cost analysis of future heat infrastructure options, 2018.
- G. Fiorese and G. Guariso, Environ. Modell. Softw., 2010, 25, 702–711 Search PubMed.
- F. van der Hilst, V. Dornburg, J. Sanders, B. Elbersen, A. Graves, W. Turkenburg, H. Elbersen, J. van Dam and A. Faaij, Agric. Syst., 2010, 103, 403–417 Search PubMed.
- P. Feron, A. Cousins, K. Jiang, R. Zhai, S. Shwe Hla, R. Thiruvenkatachari and K. Burnard, Int. J. Greenhouse Gas Control, 2019, 188–202 Search PubMed.
- D. Zhang, M. Bui, M. Fajardy, P. Patrizio, F. Kraxner and N. M. Dowell, Sustainable Energy Fuels, 2019, 4, 226–253 Search PubMed.
- Department for Business Energy & Industrial Strategy, Digest of UK Energy Statistics (DUKES): natural gas, https://www.gov.uk/government/statistics/.
- C. F. Heuberger, I. Staffell, N. Shah and N. M. Dowell, Comput. Chem. Eng., 2017, 107, 247–256 Search PubMed.
- P. Taylor, O. Lavagne D'ortigue, N. Trudeau and M. Francoeur, Energy Efficiency Indicators for Public Electricity Production from Fossil Fuels, International energy agency technical report, 2008.
- D. Parkes, D. J. Evans, P. Williamson and J. D. Williams, J. Energy Storage, 2018, 18, 50–61 Search PubMed.
- M. Bentham, T. Mallows, J. Lowndes and A. Green, Energy Procedia, 2014, pp. 5103–5113 Search PubMed.
- D. M. Reiner, Nat. Energy, 2016, 1, 1–7 Search PubMed.
- P. E. Dodds and S. Demoullin, Int. J. Hydrogen Energy, 2013, 38, 7189–7200 Search PubMed.
- S. Arapostathis, P. J. Pearson and T. J. Foxon, Environ. Innov. Soc. Trans., 2014, 11, 87–102 Search PubMed.
- D. Newbery, M. Pollitt, D. Reiner and S. Taylor, Cambridge Working Papers in Economics, 2019, 1969, 6 Search PubMed.
- D. Makovsek and D. Veryard, The Regulatory Asset Base and Project Finance Models, International transport forum technical report, 2016.
- Her Majesty's Treasury, The Green Book – Central Government Guidance on Appraisal and Evaluation, 2018.
- Department for Business Energy & Industrial Strategy, 2017 Fossil Fuel Price Assumptions, 2017.
- Committee on Climate Change, Biomass in a low-carbon economy, November, 2018.
- EDF Energy, What makes up your energy bill?, 2019, https://www.edfenergy.com/for-home/help-support/what-makes-up-your-bill.
- Statista, Forecasted gas prices in the United Kingdom from 2017 to 2023 (in pence per therm*), 2019, https://www.statista.com/statistics/374970/united-kingdom-uk-gas-price-forecast/.
- Á. Morales-García, A. Fernández-Fernández, F. Viñes and F. Illas, J. Mater. Chem. A, 2018, 6, 3381–3385 Search PubMed.
- T. Takata, J. Jiang, Y. Sakata, M. Nakabayashi, N. Shibata, V. Nandal, K. Seki, T. Hisatomi and K. Domen, Nature, 2020, 581, 411–414 Search PubMed.
- Y. X. Chen, A. Lavacchi, H. A. Miller, M. Bevilacqua, J. Filippi, M. Innocenti, A. Marchionni, W. Oberhauser, L. Wang and F. Vizza, Nat. Commun., 2014, 5, 1–6 Search PubMed.
- Process Systems Enterprise Ltd, gPROMS Process Modelling Software, 2017, https://www.psenterprise.com/products/gproms.
- M. V. Twigg, Catalyst handbook, The CRC Handbook of Chemistry and Physics, 1989 Search PubMed.
- National Research Council (US) Committee on Alternatives and Strategies for Future Hydrogen Production and Use, National Academy of Engineering. and National Academy of Sciences (U.S.), The hydrogen economy: opportunities, costs, barriers, and R & D needs, National Academies Press, 2004, p. 239.
- K. Zeng and D. Zhang, Prog. Energy Combust. Sci., 2010, 36, 307–326 Search PubMed.
- K. Schoots, F. Ferioli, G. Kramer and B. van der Zwaan, Int. J. Hydrogen Energy, 2008, 33, 2630–2645 Search PubMed.
- J. Holladay, J. Hu, D. King and Y. Wang, Catal. Today, 2009, 139, 244–260 Search PubMed.
- S. Grigoriev, V. Porembsky and V. Fateev, Int. J. Hydrogen Energy, 2006, 31, 171–175 Search PubMed.
- C. Acar and I. Dincer, Causes, Impacts and Solutions to Global Warming, Springer New York, New York, NY, 2013, pp. 493–514 Search PubMed.
- E4tech Sàrl & Element Energy Ltd, Development of Water Electrolysis in the European Union – Fuel cells and Hydrogen Joint Undertaking, 2014.
- O. Yamada, Thin Solid Films, 2006, 509, 207–211 Search PubMed.
- D. Hart, J. Howes, F. Lehner, P. E. Dodds, N. Hughes, B. Fais, N. Sabio and M. Crowther, Scenarios for deployment of hydrogen in contributing to meeting carbon budgets and the 2050 target Final Report Title Scenarios for deployment of hydrogen in contributing to meeting carbon budgets and the 2050 target, 2015.
- M. Pudukudy, Z. Yaakob, M. Mohammad, B. Narayanan and K. Sopian, Renewable Sustainable Energy Rev., 2014, 30, 743–757 Search PubMed.
- H2FC Supergenhub, The role of hydrogen and fuel cells in delivering energy security for the UK, March, 2017.
- J. Perrin, R. Steinberger-Wilckens and S. C. Trümper, Deliverable 2.1 and 2.1a – “European Hydrogen Infrastructure Atlas” and “Industrial Excess Hydrogen Analysis”, 2007 Search PubMed.
- B. van der Zwaan, K. Schoots, R. Rivera-Tinoco and G. Verbong, Appl. Energy, 2011, 88, 3821–3831 Search PubMed.
- R. Svensson, M. Odenberger, F. Johnsson and L. Strömberg, Energy Convers. Manage., 2004, 45, 2343–2353 Search PubMed.
- H. A. Haugen, N. Eldrup, C. Bernstone, S. Liljemark, H. Pettersson, M. Noer, J. Holland, P. A. Nilsson, G. Hegerland and J. O. Pande, Energy Procedia, 2009, 1, 1665–1672 Search PubMed.
- P. N. Seevam, J. M. Race, M. J. Downie and P. Hopkins, 2008 7th International Pipeline Conference, 2008, vol. 1, pp. 39–51.
- Intergovernmental Panel on Climate Change, Carbon dioxide capture and storage, October, 2009.
- A. Ozarslan, Int. J. Hydrogen Energy, 2012, 37, 14265–14277 Search PubMed.
- F. D'Amore, N. Sunny, D. Iruretagoyena, F. Bezzo and N. Shah, Comput. Chem. Eng., 2019, 129, 106521 Search PubMed.
Footnotes |
| † Electronic supplementary information (ESI) available. See DOI: 10.1039/d0ee02016h |
| ‡ Non-domestic use refers to commercial buildings and small industrial sites. |
| This journal is © The Royal Society of Chemistry 2020 |

