
 Open Access Article
 This Open Access Article is licensed under a Creative Commons Attribution-Non Commercial 3.0 Unported Licence
Understanding the formation of bulk- and surface-active layered (oxy)hydroxides for water oxidation starting from a cobalt selenite precursor†
Jan Niklas
Hausmann
a,
Stefan
Mebs
b,
Konstantin
Laun
c,
Ingo
Zebger
 c,
Holger
Dau
*b,
Prashanth W.
Menezes
*a and
Matthias
Driess
*a
c,
Holger
Dau
*b,
Prashanth W.
Menezes
*a and
Matthias
Driess
*a
aDepartment of Chemistry: Metalorganics and Inorganic Materials, Technische Universität Berlin, Straße des 17 Juni 135, Sekr. C2, 10623 Berlin, Germany. E-mail: matthias.driess@tu-berlin.de; prashanth.menezes@mailbox.tu-berlin.de
bFachbereich Physik, Freie Universität Berlin, Arnimallee 14, 14195 Berlin, Germany. E-mail: holger.dau@fu-berlin.de
cDepartment of Chemistry: Physical Chemistry/Biophysical Chemistry, Technische Universität Berlin, Straße des 17 Juni 135, Sekr. C2, 10623 Berlin, Germany
First published on 4th September 2020
Abstract
The urgent need for a stable, efficient, and affordable oxygen evolution reaction (OER) catalyst has led to the investigation of a vast amount of transition metal materials with multiple different anions. In situ and post catalytic characterization shows that most materials transform during the harsh OER conditions to layered (oxy)hydroxides (LOH). Several open questions concerning these in situ formed LOH remain such as: an explanation for their strongly varying activities, or the effect of the precatalyst structure, leaching anions, and transformation conditions on the formed LOH. Herein, we report on a cobalt selenite precursor, which, depending on pH and potential, transforms irreversibly into two different LOH OER catalysts. Combining multiple electrochemical and analytical methods ex and in situ, we prove that one of these products is near-surface catalytically active and the other one throughout the bulk with an in situ average cobalt oxidation state of 3.2. We deduce a detailed structural model explaining these differences and propose general concepts relating both the precatalyst structure and the transformation conditions to the final catalyst. Further, we apply these models to the most promising non-noble metal catalyst, NiFe LOH.
Broader contextImplementing a sustainable global energy economy requires more than the construction of solar and wind power plants, as the fluctuations of these energy sources contrast the constant energy demand of society. A solution to this problem is a highly scalable energy storage technology. In this regard, fuels are advantageous as, for their scalability, only simple tanks must be constructed instead of highly resource-/energy-demanding batteries. Fuels contain reduced chemical species that can be burned using O2 under the release of energy. To close this energy storage cycle, oxidized compounds must be reduced while investing electric energy. The electrons for this process come from water (O−II) independent of whether the oxidized species are CO2 or protons. Therefore, catalytic oxygen evolution (OER) is the central process to form regenerative fuels from green electricity. The harsh conditions during OER lead to an in situ transformation of most materials. Herein, we introduce a new concept to understand this transformation while considering the substrate and the transformation conditions. Our detailed ex- and in situ investigations allow us to deduce structural relationships explaining different activities in layered double hydroxides, the most promising catalysts for the alkaline OER. |
Introduction
Highly scalable energy storage technologies are required for the implementation of a sustainable global energy economy.1–3 In this regard, green fuel formation out of water and CO2 is highly promising.4–7 For fuel formation processes, electrons are required.8 The most prominent reaction supplying electrons is the oxygen evolution reaction (OER), where electric energy is used to oxidize abundant O−II (from water).8–10 The kinetically demanding OER involves four sequential proton-coupled electron transfer steps and accounts for a significant loss of efficiency in fuel forming processes.11,12 To overcome this disadvantage, a vast amount of suitable OER catalysts based on earth-abundant transition-metals (TM) has been investigated.9,13 Initially, mainly (Fe/Co/Ni)OxHy were explored.14 However, research has shown that varying the anion can be advantageous.15 In this regard, chalcogenides,16 pnictides,17 carbides,18 borides,19 phosphates,20 phosphites,21 borates,22 borophosphates,23 and intermetallic materials24 have been tested for their suitability as OER electrode materials.9,15,25The TM compounds with these anions are expected to transform under industrially relevant OER conditions (pH > 14, current densities above 200 mA cm−2 and lifetimes up to 100![[thin space (1/6-em)]](https://www.rsc.org/images/entities/char_2009.gif) 000 h) as their anions either have redox potentials significantly lower than those of O−II or are highly soluble in water.25–27In situ and post catalytic characterization methods revealed that, even within a few hours at low current densities (10 mA cm−2) and pH 14, most of these materials undergo corrosion.18,23,24,28–38 Therefore, they are merely precatalysts, and the active species are in most cases Fe/Co/Ni layered (oxy)hydroxides (LOH). The observed transformations are consistent with the Pourbaix diagrams of iron, cobalt, and nickel (shown in Fig. S1, ESI†), as they reveal that LOH are the only thermodynamically stable oxide phases under OER conditions besides dissolved FeO42−.39–42
000 h) as their anions either have redox potentials significantly lower than those of O−II or are highly soluble in water.25–27In situ and post catalytic characterization methods revealed that, even within a few hours at low current densities (10 mA cm−2) and pH 14, most of these materials undergo corrosion.18,23,24,28–38 Therefore, they are merely precatalysts, and the active species are in most cases Fe/Co/Ni layered (oxy)hydroxides (LOH). The observed transformations are consistent with the Pourbaix diagrams of iron, cobalt, and nickel (shown in Fig. S1, ESI†), as they reveal that LOH are the only thermodynamically stable oxide phases under OER conditions besides dissolved FeO42−.39–42
Thus, during the OER, a precatalyst transforms into the active-state catalyst (see Scheme 1). The nature of this catalyst will depend on the structure of the precatalyst and on the leaching ability, redox potential, and size of its anion.25,26,31 Further, the transformation conditions (mainly pH and electrical potential) will affect the structure and catalytic properties of the active-state catalyst. In this regard, it has been shown that from one precatalyst, depending on the applied V, an OER or hydrogen evolution reaction (HER) catalyst with different structures and electronic properties can be formed.20,23,35,36 However, even though many OER precatalysts have been investigated already, the influence of the precatalyst structure, the leaching anion, and the transformation conditions on the eventually formed LOH catalyst remains as an open question.31,34,43
 | ||
| Scheme 1 Transformation of a precatalyst to the active catalyst. The reversible step on the right side shows the dynamic behavior of the catalyst, which can be assessed by in situ investigations. | ||
Although LOH share the same short-range order (layers of edge-sharing MO6 octahedra, see Fig. 1 left), they are structurally highly versatile, as the organization of these layers varies drastically.44 In crystalline forms, the layers are usually stacked in parallel (see Fig. 1 middle). Between the layers, neutral and charged species can be intercalated, affecting the layer distance.45 The layers do not have to be perfectly planar and can be bend.46 Furthermore, amorphous forms exist, where single layers (domains) are only a single or very few nanometers in diameter and the stacking is disordered (see Fig. 1 right).47–49 The domains can be connected by tetrahedral units or electrostatic interactions.48 These structural variations (tetrahedral linkage of domains, domain size, domain stacking, defects, doping…) of amorphous LOH are pivotal for their catalytic properties and can help to understand the substantially different OER performance of in situ formed LOH.23,25,26,30,31,48,50 Because the structural variations are non-periodic and highly complex, the elucidation of structure-performance relationships is challenging,51 and raises the follwing research questions:
 | ||
| Fig. 1 Structural models for LOH. Left: Top view on a layer of edge sharing [MO6] octahedra, the common structural motif of LOH. Centre: A crystalline LOH with parallel stacking of the layers. Right: An amorphous LOH with disordered layer arrangement. | ||
(a) Does the variation of pH and V afford different LOH OER catalysts from the same precatalyst?
(b) How do structural variations of amorphous LOH affect their catalytic performance?
(c) Can the structure of the LOH catalyst be predetermined by that of the precatalyst?
(d) Why are in situ formed LOH from precatalysts with leaching anions often more active than directly synthesized ones?
To answer these questions, we focused on monometallic cobalt LOH as a suitable system, as it combines a high catalytic activity per active site with sufficient conductivity and good stability under alkaline OER conditions.52,53 For the precatalyst structure, a preorganization of the cobalt in layers similar to the final LOH is desired, as this may simplify to determine structural correlations between the precatalyst and catalyst. Further, if the anion is located in the interlayer space, a rapid leaching could be beneficial for the complete transformation in cobalt LOH. Cobalt(II) selenite, CoSeO3·H2O, crystallizing in the space group P21/n, fulfills these requirements and has never been tested as an OER precatalyst.54–56 It acquires a layered structure with a layer spacing of 6.6 Å (see Fig. 2).‡ The layers are comprised of [CoO6] octahedra sharing four corners. The [CoO6] octahedra are additionally connected via [SeO3] units with selenium pointing into the interlayer space. Moreover, coordinated water resides between the [CoO6] layers. Further, CoSeO3·H2O contains SeIV, which could be an intermediate in the in situ transformation of TM selenides to the corresponding LOH,26 that show outstanding OER performances as reported recently.29,50,57–61
 | ||
| Fig. 2 Crystal structure of CoSeO3·H2O. Selenium in green, oxygen in red, hydrogen in grey, and [CoO6] octahedra in purple. Left: View along the b axis showing the layer stacking, right: view along the c axis giving a top view on a single layer.‡ | ||
Herein, we demonstrate that, depending on the pH and V, two cobalt LOH with very different catalytic properties can be formed in situ from the CoSeO3·H2O precatalyst; one is bulk OER-active and the other active only in its near-surface region. Through detailed quasi in situ and post catalytic investigations, we deduced a model explaining the different catalytic properties of LOH phase with the same short-range but different long-range orders, and propose a concept relating the precatalyst structure and the transformation conditions to the active catalyst.
Results
CoSeO3·H2O was obtained through a facile, previously reported, hydrothermal synthesis from SeO2 and Co(OAc)2 and characterized by state of the art methods: light microscopy (see Fig. 3 and Fig. S2, ESI†), scanning electron microscope (SEM) with energy dispersive X-ray (EDX) mapping (see Fig. 3 and Fig. S3, ESI†), powder X-ray diffraction (pXRD, see Fig. S4, ESI†), inductively coupled plasma optical absorption spectroscopy (ICP-OES, see Fig. S4, ESI†), X-ray photoelectron spectroscopy (XPS; see Fig. S5, ESI†), transmission electron microscopy (TEM) with selected area electron diffraction (SAED, see Fig. S6, ESI†), resonance Raman (RR, see Fig. 9), and X-ray absorption spectroscopy including extended X-ray absorption fine structure (EXAFS; see Fig. 10) and X-ray absorption near edge structure (XANES; see Fig. 10) analyses. All methods confirm the formation of a pristine CoSeO3·H2O phase with no additional surface oxidation. | ||
| Fig. 3 Left: Light microscope image showing the needle like morphology of CoSeO3·H2O, right: SEM/EDX mapping of the tip of a needle of CoSeO3·H2O revealing a homogeneous distribution of the elements (for EDX spectrum see Fig. S3, ESI†). | ||
Alkaline OER investigations
Performing cyclic voltammetry (CV) with CoSeO3·H2O deposited on fluorine doped tin oxide (FTO), we observed a broad redox feature during the first cycle, indicating a transformation of the material (see Fig. S9(a), ESI†). Further, the purple film turned black during the first CV (see Fig. S9(a) and (b), ESI†). In the second CV a current density (i) of 10 mA cm−2 was reached at an overpotential (η) of 332 mV (see Fig. S9(b), ESI†). Interestingly, a color change was already observed, when the film was exposed to the 1 M KOH for 60 s without applied potential (see Fig. S9(c), ESI†). pXRD revealed that after 60 s a phase with low crystallinity formed while after 1 h a crystalline one was obtained (see Fig. S9(d), ESI†). Based on these observations, we decided to investigate two different transformation pathways for the in situ formation of an OER catalyst from the CoSeO3·H2O precursor (see Fig. 4). The first one was a two-step process, where the precatalyst was first exposed to 1 M KOH for 1 h (Co–KOH) and subsequently for 1 h a potential of 1.56 V vs. reversible hydrogen electrode (VRHE) was applied (Co–KOH–V). In the second pathway, the same precatalyst was directly exposed to 1.56 VRHE for 1 h in the alkaline solution (Co–V).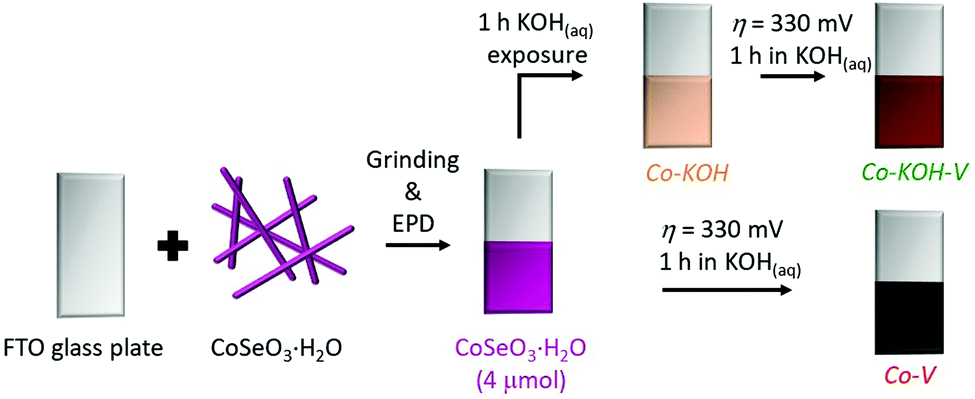 | ||
| Fig. 4 Scheme of the deposition and the two herein presented transformation pathways with the names of the obtained compounds and intermediates (KOH represents 1 h of KOH exposure and V 1 h at η = 310 mV). The obtained CoSeO3·H2O film was examined by SEM/EDX and EXAFS (see Fig. S7, S8, S29, and Table S2, ESI†). | ||
 | ||
| Fig. 5 Electrochemical investigations on FTO substrates of Co–KOH–V (in green) and Co–V (in red; both: loading 4 μmol, area 1 cm2). (a) Current responses at 1.56 VRHE. (b) CV (ν = 5 mV s−1) with a magnification of the redox peaks as inset. (c) Steady-state Tafel analyses. (d) Current densities taken from CV (ν = 1 mV s−1) normalized by the amount of CoII/III redox active sites. (e) CP measurement of Co–V at 10 mA cm−2. (f) LSVs (ν = 5 mV s−1) of several (Co/Ni/Fe)OxHy compounds in comparison to Co–KOH–V and Co–V. All measurements have been iR compensated (see ESI† for details). | ||
The CVs in Fig. 5(b) reveal that the electrocatalytic activity of Co–V (η10 = 310 mV) was considerably higher than that of Co–KOH–V (η10 = 410 mV). Further, for both samples, two well-separated reversible redox peaks are present (see inset Fig. 5(b)). These reversible features are the CoII/III and CoIII/IV redox processes.49,62 They remained unchanged when the electrolyte was changed to fresh selenium free 1 M KOH. Both redox peaks of Co–V are several times larger than those of Co–KOH–V. Integration of the CoII/III peak of Co–V disclosed that more than 40% of the cobalt atoms underwent this reversible transformation (for the integration of all redox peaks see Fig. S11, ESI†). For Co–KOH–V, it was fewer than 3% of the cobalt. For the CoIII/IV redox peak of Co–V, approximately 30% of the total cobalt sites were redox active (2.5% for Co–KOH–V).
The peak current of a redox transition in CV is a function of the scan rate (ν). For a (pseudo)capacitive redox process, the peak current is proportional to ν.63,64 Limitations by transport phenomena lead to a deviation of this behavior (ν for a diffusion controlled process). In Fig. S12 (ESI†), the peak current of the CoII/III redox feature is plotted against ν; for Co–V and Co–KOH–V, a linear relationship is obtained. Therefore, neither diffusion of base nor electron transport is significantly limiting at the investigated current densities (up to 20 mA cm−2). This is consistent with reported in situ conductivity measurements on cobalt oxyhydroxides.65,66
Electrochemical impedance spectroscopy (EIS) and long-term chronopotentiometric (CP) measurements were performed, as was linear scan voltammetry (LSV) in comparison to other (Co/Ni/Fe)OxHy compounds. EIS conducted at 1.55 VRHE yielded a semi-circular appearance in the Nyquist plot for Co–KOH–V and Co–V (see Fig. S14 (a), ESI†). The diameter is approximately ten times smaller for Co–V, indicating a strongly reduced charge transfer resistance. A faradaic efficiency of 96% was measured for Co–V (see Fig. S14(b), ESI†). A CP measurement at 10 mA cm−2 of Co–V yielded a stable performance for almost seven days (see Fig. 5 (e)). Various (Co/Ni/Fe)OxHy were prepared and loaded in the same way on FTO. Fig. 5(f) shows LSVs recorded at 5 mV s−1 of the obtained electrodes together with Co–KOH–V and Co–V on FTO. This comparison reveals that the activity of Co–KOH–V is comparable to that of the other nickel- and cobalt-based phases. Surprisingly, Co–V is drastically more active than all the other materials. Furthermore, Co–V has a far stronger pronounced redox peak prior to the OER.
Characterization of Co–KOH, Co–KOH–V and Co–V
:Se:K of 1:0.01:0.04, 1:0.01:0.10 and 1:0.04:0.50 for Co–KOH, Co–KOH–V, and Co–V, respectively. Therefore, selenium was depleted from CoSeO3·H2O in all three cases and oxidic cobalt species were formed.
Fig. 6 left depicts the pXRD patterns of the three samples taken directly from the FTO substrate. The diffractogram of Co–KOH exhibits all reflexes of crystalline β-Co(OH)2 (P![[3 with combining macron]](https://www.rsc.org/images/entities/char_0033_0304.gif) m1, a = 3.18 Å and c = 4.65 Å, JCPDS 30-443). The three reflexes present for Co–KOH–V, were assigned to β-CoOOH (Rm, a = 2.85 Å and c = 13.15 Å, JCPDS 7-169). Co–V does not contain any diffraction peaks besides those of the FTO substrate. Hence, it is X-ray amorphous.
m1, a = 3.18 Å and c = 4.65 Å, JCPDS 30-443). The three reflexes present for Co–KOH–V, were assigned to β-CoOOH (Rm, a = 2.85 Å and c = 13.15 Å, JCPDS 7-169). Co–V does not contain any diffraction peaks besides those of the FTO substrate. Hence, it is X-ray amorphous.
 | ||
| Fig. 6 Left: pXRD of Co–KOH, Co–KOH–V, and Co–V taken directly from the FTO substrate. The vertical dashed lines indicate the reflections of FTO. The oranges numbers are the millers indices of a β-Co(OH)2 phase and the green ones of a β-CoOOH one. Right: IR spectra of the same compounds. The vibrations depicted in orange belong to a β-Co(OH)2 phase. | ||
Electron diffraction is more sensitive than XRD and can disclose additional phases with a lower crystallinity. Fig. S15 (ESI†) presents the SAED patterns of all three samples. The SAED of Co–KOH confirms the presence of β-Co(OH)2 without additional diffraction spots. For Co–KOH–V, the SAED reveals the occurrence of not only β-CoOOH but also of low crystallinity β-Co(OH)2. The SAED of X-ray amorphous Co–V shows two diffraction rings referring to lattice plane spacings of 2.42 Å and 1.41 Å, which could be assigned in the structural model derived from the EXAFS and HR-TEM data (see Fig. 8 and EXAFS part).
Fig. S16 (ESI†) exhibits the XPS Co 2p and O 1s spectra of all three compounds. The post catalytic cobalt surface oxidation state is an approximately one-to-one mixture of CoII and CoIII in all three materials. Such low surface oxidation states were previously observed for CoCat materials, which have higher bulk oxidation states.68 The low surface oxidation states compared to the XANES investigations (see Fig. 10 left) could be related to a formation of Co3O4 from the amorphous species.69 The O 1s spectra show three species that were assigned to cobalt hydroxide as well as physi- and chemisorbed water.
m1) are located at 500, 441, and 311 cm−1, respectively.70 Additionally, a weak band at 582 cm−1 is present. This band is characteristic for the octahedral coordinated CoIII in CoOOH.71 Thus, Co–KOH also contains small amounts of CoIII, probably due to near-surface oxidation. The spectrum of Co–KOH–V strongly exhibits the characteristic band of CoOOH. Additionally, weak bands for the β-Co(OH)2 phase are present, consistent with the SAED. For Co–V, only the vibration for octahedrally coordinated CoIII is found. Fig. S17 (ESI†) depicts the extended IR spectra from 4000 to 250 cm−1. For Co–KOH and Co–KOH–V, the characteristic νO–H mode is present at 3622 cm−1 in form of a sharp band, indicating a well-ordered hydroxide phase.70 Interestingly, for Co–V, this vibration is absent and only a broad and very weak peak at 3420 cm−1 is present suggesting a disordered hydroxide-containing material with a broad distribution of force constants. Another reason for the low intensity is a deprotonation of the hydroxide groups by KOH as expected from the Co Pourbaix diagram in Fig. S1 (ESI†). The K to Co ratio of 1 to 2 from ICP-OES indicates that this is the case for half of the hydroxide groups. Further, for all compounds, no intense peaks indicating substantial amounts of (NO3)− or (CO3)2− intercalation are present.45
For Co–KOH and Co–KOH–V, TEM affirms the formation of hexagonal nanoplates (see Fig. S22 and S23, ESI†). HR-TEM of Co–KOH unveils lattice spacings in accordance with the crystallographic planes (001), (100), and (022) of β-Co(OH)2. For Co–KOH–V, HR-TEM resolves lattice spacings in agreement with the crystallographic planes (100), (101), and (104) of β-CoOOH. HR-TEM with a LaBF6-cathode and a point resolution of around 240 pm could not resolve lattice fringes of Co–V. Therefore, spherical aberration corrected HR-TEM with a field emission gun cathode and a point resolution of 75 pm was applied (see Fig. 7 and Fig. S25, ESI†). Surprisingly, we could resolve single atom columns of crystalline domains in this X-ray amorphous material. The domains vary in size from one to five nanometers.
 | ||
| Fig. 7 HR-TEM images with fast Fourier transforms as insets. Left: Image showing the layer stacking with the FFT of the white square revealing the layer spacing. Right: Image depicting nanocrystalline domains viewed from the top with the FFT unveiling lattice distances in the domains. The inset on the right top shows resolved single atom columns. | ||
Fast Fourier transformation of these HR-TEM images reveals four lattice distances for Co–V. Two of them are identical to the ones of the SAED (see Fig. S15, ESI†). Fig. 8 shows a structural model of a layer of edge-sharing [CoO6] octahedra. The atomic distances of this structural model were derived from the EXAFS data (see below). All four HR-TEM lattice distances could be assigned to atomic planes of this structure. The atomic planes not present in the SAED refer to oxygen distances of planes parallel to the [CoO6] layers (see Fig. 8 right). As the layers do not stack in an ordered way, no periodicity in this diffraction direction is present. Thus, these atomic distances can only be resolved by HR-TEM and not by SAED. Another remarkable feature in the HR-TEM images is the presence of areas with fringes separated by approximately 8.9 Å (see Fig. 7 left and Fig. S25, ESI†). In these areas, the layered, molecular domains stack in parallel and are seen from the side. Therefore, 8.9 Å is the average layer distance for the parallel stacking. It is likely that domains with highly disordered stacking also exist and even in the areas with “parallel” stacking, the layer distances vary and structural disorders such as line defects are present (see Fig. 7 left).
 | ||
| Fig. 8 Structural model of Co–V with the lattice distances from SAED/HR-TEM (grey lines) and the EXAFS coordination shells (white circles). On the left the top view on a domain with 51 cobalt atoms is presented and on the right the side view. This model contains 39% μ2-oxo bridged cobalt edge sites, which correlates well with the 40% of CoII/III redox active Co sites in Co–V. | ||
Further, we investigated if additional morphological changes occur during longer OER testing of Co–V. In this regard, TEM and SEM images of a Co–V sample after 48 h at 10 mA cm−2 were performed (see Fig. S26 and S27, ESI†). These images reveal that the morphology does not change significantly.
Quasi in situ investigations
As illustrated in Scheme 1, the electrocatalytic system is highly dynamic and the actual catalyst structure might differ substantially from the one investigated after the OER reaction. Therefore, we performed quasi in situ investigations by freeze quenching (−196 °C) the electrodes during catalysis and kept them in liquid nitrogen until measurement. This freeze-quench approach was introduced and verified for similar systems.49 | ||
| Fig. 9 RR spectra of CoSeO3·H2O and Co–KOH as well as in situ measured Co–KOH–V and Co–V. | ||
The Eg band of CoOOH is also present in the quasi in situ RR of Co–KOH–V together with the symmetric stretching vibration of Co–O (A1g) as a broad feature.73–76 Additionally, a small shoulder at 490 cm−1 indicates the presence of a minor phase similar to the one observed in the RR of Co–V. Fig. S28 (ESI†) shows the RR spectrum of Co–KOH–V measured after the sample was exposed to air at room temperature for 2 h. Signature bands of Co3O4 appear after the air exposure, confirming the reported reversible transformation of CoOOH to Co3O4.69 A similar behavior was observed for ex situ measurements of Co–V (see Fig. S28, ESI†).
For Co–V, the quasi in situ RR spectrum shows two bands, which we assigned to the Co–O–Co bending (474 cm−1) and the Co–O symmetric stretching (581 cm−1) vibrations48 in analogy to both crystalline LiCoO2 (487 and 595 cm−1) and amorphous CoBi (503 and 607 cm−1) that both adopt similar LOH structures like Co–V.48 The two bands of these compounds are shifted in the order CoBi > LiCoO2 > Co–V. In situ measurements of the intercalation of water into LiCoO2 and vice versa revealed that the location of these peaks is a function of the pacings (lower wavenumbers indicates a larger spacing).77,78 X-ray pair distribution function analysis disclosed a layer spacing of 6.67 Å for CoBi;47 crystallographic data unveiled a spacing of 7.01 Å for LiCoO2;79 HR-TEM investigations uncover a spacing of 8.9 Å for Co–V (see Fig. 7 and Fig. S25, ESI†). Hence, the RR shifts confirm the large layer spacing observed in the HR-TEM of Co–V. Further, Co–V has sharper Raman peaks than CoBi but significantly broader ones than LiCoO2 indicating that Co–V is more ordered than amorphous CoBi but lacks the crystallinity of LiCoO2.48
 | ||
| Fig. 10 Left: In situ XANES spectra collected at the cobalt K-edge of CoSeO3·H2O, Co–KOH, Co–KOH–V, and Co–V as well as two reference compounds for CoII and CoIII. Right: Fourier-transformed K-edge EXAFS spectra of CoSeO3·H2O, Co–KOH, Co–KOH–V, and Co–V. The black lines are the simulated spectra. The internuclear distances obtained by the EXAFS simulations are around 0.2–0.4 Å larger than the indicated reduced distances. The structural motifs represent the connectivity of the atoms causing the peaks with oxygen in red and cobalt in blue. | ||
EXAFS analysis reveals detailed structural information about amorphous and crystalline materials. Simulating the Co K-edge EXAFS region provides radii (R), the atomic nature, and population (N, EXAFS coordination number) of coordination spheres around cobalt. The accuracy decreases with the radii and increases with the atomic number of the scattering atoms. Fig. 10 shows the cobalt K-edge Fourier-transformed EXAFS spectra of the four samples CoSeO3·H2O, Co–KOH, in situ Co–KOH–V, and in situ Co–V as well as the corresponding simulations. EXAFS tables and the original spectra can be found in Fig. S31 and Tables S1–S5 (ESI†). CoSeO3·H2O powder and on FTO deposited films could be well simulated based on the reported structures determined by XRD.54,56 Co–KOH was successfully fitted based on the β-Co(OH)2 structure (Pm1, a = 3.18 Å and c = 4.65 Å, JCPDS 30-443). For Co–KOH–V, two structural models were required to obtain a conclusive simulation: β-Co(OH)2 and β-CoOOH (Rm, a = 2.85 Å and c = 13.15 Å, JCPDS 7-169). The fraction of the two phases was determined as 40% β-Co(OH)2 and 60% β-COOH. This distribution is consistent with the XANES, IR, RR, and SAED results, which also reveal the coexistence of these two phases.
For X-ray amorphous Co–V, the Fourier transformed EXAFS spectrum shows four major peaks (Fig. 10). Fig. 8 left shows a structural model with the respective coordination spheres. The first peak is the Co–O distances (1.88 Å, N = 5.3), as shown in the octahedra of Fig. 10. In the layered Co(OHx)2 structure of Fig. 8, the octahedra are distorted, but all Co–O distances are equivalent (see Fig. 12(b) for bond lengths and angles calculated based on EXAFS data). Essentially the same distortion is present in crystalline CoOOH phases, leading to a contraction of the individual Co(OHx)2 layers (the distance between two oxygen layers adjacent to the intermediate cobalt layer decreases see Fig. 8 right). The second peak is the first Co–Co coordination shell (2.83 Å, N = 5.0). The third and fourth peaks are the second and third Co–Co coordination shells (4.92 Å with N = 2.5; 5.65 Å with N = 2.7). Depending on the arrangement of the edge-sharing octahedra, two different distances are possible. Additionally, one Co–O coordination shell (3.40 Å, N = 4.5) with lower intensities was included in the EXAFS simulations, to facilitate high-quality simulation of the obtained spectrum (see Table S5, ESI† for simulation details).
The structural model in Fig. 8 was derived from the EXAFS and HR-TEM data. The white rings represent the EXAFS coordination shells. The figure includes another Co–O shell that was not included in the simulations due to its low intensity caused by the large radius and low atomic number of oxygen. The two Co–V samples freeze-quenched at 0.9 and 1.27 VRHE and the one measured ex situ could be fitted with the same structural model with minor variations (see Fig. S32 and Tables S6–S8, ESI†).
Discussion
The structure of Co–V, Co–KOH, and Co–KOH–V
We have shown that, starting from a single compound, CoSeO3·H2O, depending on V and pH (see Fig. 4), three distinct materials and among them two OER catalysts with substantially different activities and structural properties can be obtained. All three materials (Co–KOH, Co–KOH–V, and Co–V) no longer contain significant amounts of selenium and consist of layers formed by edge-sharing [CoO6] octahedra.For Co–KOH, crystalline β-Co(OH)2 with an average cobalt oxidation state of two and a layer spacing of 4.65 Å is obtained. On the surface, the sample is partly oxidized to β-CoOOH. The morphology at the nanometer and micrometer scale is also affected by the transformation; most of the initial chunks and needles of several micrometer are transformed into hexagonal nanoplates. Co–KOH–V contains two phases. One is crystalline β-CoOOH with a layer spacing of 4.38 Å and a cobalt oxidation state of three (see Fig. 12(a)). The other one is the same β-Co(OH)2 as found in Co–KOH, but with a lower crystallinity. The ratio of the two phases is approximately 60% β-COOH to 40% β-Co(OH)2. The morphology is similar to that of Co–KOH, showing hexagonal nanoplates.
In contrast to Co–KOH and Co–KOH–V, Co–V is X-ray amorphous. IR, SAED, HR-TEM, RR and EXAFS investigations disclose that it is also comprised of layers formed by edge-sharing [CoO6] octahedra (see Fig. 8). The observed EXAFS distances reveal that the [CoO6] octahedra are distorted. The O–Co–O angles were calculated from the first Co–O (1.88 Å) and Co–Co (2.83 Å) distance to be around 80 and 100° (see Fig. 12(b)). This distortion leads to a contraction of the layers (see Fig. 8 right), which previously has been related to OER activity.80 HR-TEM could resolve the single layers (domains) with a size of 1–10 nm. These domains mostly arrange in an unordered way. Thus, the material lacks a long-range order and is X-ray amorphous. In some parts of the sample, the domains are larger and stack in parallel. In these parts, a layer spacing of around 8.9 Å was unveiled by HR-TEM, suggesting a layer of tightly bound water molecules and ions (K+, CoII/III, OH−) between Co(OHx)2 sheets, in analogy to layered manganese oxides of the birnessite type.81,82 RR spectroscopy shifts confirm a large layer spacing. The cobalt oxidation state in the relaxed post catalytic state is three. ICP-OES discloses that Co–V contains one potassium per two cobalt atoms. Therefore, we conclude that the hydrogen of the Co–OH groups, directed into the interlayer space, is largely replaced by potassium. For Co–V, the formation of hexagonal nanoparticles as in Co–KOH–(V) could not be observed.
Electrochemical analysis of Co–V and Co–KOH–V
The two systems, Co–V and Co–KOH–V, were comprehensively investigated concerning their electrocatalytic properties and suitability as OER catalysts. CV measurements reveal that the electrocatalytic activity of Co–V is around 15 times higher than that of Co–KOH–V at current densities below 10 mA cm−2. A CP stability test over almost seven days without activity loss revealed that the superior performance is not a temporary phenomenon of a metastable amorphous phase but an intrinsic difference between the two systems. The comparison with other cobalt, nickel, and iron oxides and (oxy)hydroxides tested under the same conditions discloses that the activity of Co–KOH–V is mediocre, whereas the activity of Co–V is exceptionally high. The approximately one magnitude higher charge transfer resistance of Co–KOH–V confirms this activity trend. Steady-state Tafel slopes unveil two linear regions with the same slope for both catalysts. The first slope is around 46 mV dec−1 and the second around 86 mV dec−1. The presence of a second linear region implies a change in the reaction mechanism or surface coverage.9,83–85 As both systems, Co–V and Co–KOH–V, have the same two Tafel slopes, they both should have the same kind of active sites.The reaction mechanism for the OER in LOH cobalt catalysts is not comprehensively understood. However, there are two prevailing pathways in the discussion of O–O bond formation by cobalt oxyhydroxides.39,62,86,87 The two pathways are depicted in Fig. 11. Pathway (a) involves the nucleophilic attack of hydroxide on a single CoIV−δ–O−II+δ species, leading to O–O bond formation. Pathway (b) proceeds through the intramolecular oxygen coupling of two adjacent CoIV−δ–O−II+δ species, leading to a bridging peroxido intermediate. Interestingly, time-resolved IR spectroscopy suggests that both mechanisms occur simultaneously on an in situ-formed cobalt LOH at near-neutral pH.87 An increased V will lead to more CoIV−δ–O−II+δ species. Therefore, this should favor the intramolecular oxygen coupling with two adjacent CoIV−δ–O−II+δ species. Both proposed reaction mechanisms are consistent with our observation of an average in situ bulk oxidation state of 3.2 of Co–V.
 | ||
| Fig. 11 Two mechanisms for the OER on CoOxHy catalysts with different O–O bond formation steps: (a) nucleophilic attack of hydroxide and (b) intramolecular oxygen coupling. | ||
A structural model explaining the different catalytic performances
Based on the aforementioned conclusions, a model explaining the activity differences can be proposed: Co–KOH–V has large domains and a small layer spacing; thus, only cobalt sites on the near-surface of the crystalline domains contribute to the OER. Whereas, in Co–V, the domains are small and the interlayers spacing is large; thus, the electrolyte can penetrate it, resulting in a bulk active catalyst. The smaller domains also lead to more edge sites containing μ2-oxo bridged cobalt atoms, which were previously suggested to be the redox and catalytically active species (the percentage of cobalt edge sites in the model shown in Fig. 8 correlates with the ratio of CoII/III redox active species to inactive species).62 A model for each catalyst is shown in Fig. 12 together with molecular species in the absolute relative size.88 The figure shows that the layer spacing of Co–V is large enough for K+, OH−, H2O, O2, and (SeO4)2−.Several arguments can be raised to support this model such as the different layer spacings and domain sizes, the same Tafel slopes, the large Co–V redox features, and the in situ oxidation states determined by XANES. Further, normalization of the catalytic activity by the amount of CoII/III redox active sites reveals that the activity per site is the same at low current densities (<10 mA cm−2). At higher current densities, this similarity changes, probably due to mass transfer limitations.89In situ conductivity measurements of related compounds and the redox peak analysis of our report implies that electron transport is not the limiting phenomena.65,66 The large amount of potassium in Co–V and the weak OH stretching vibration show that the KOH electrolyte can penetrate the whole Co–V catalyst and deprotonate the Co–OH sites.
For iron nickel LOH, theoretical investigations relating the OER performance to the layer spacing exist.90 For layer distances above 6.5 Å, the OER mechanism (similar to the one in Fig. 11(a)) in the interlayer space was found to be analogous to the one occurring at the surface. The largest layer distance investigated was 8.0 Å.90 Thus, the spacing of 8.9 Å found for Co–V is probably large enough that the OER mechanism within the layer and on the surface are the same. A similar relationship between layer spacing and bulk activity was proposed for manganese birnessite with different intercalated alkali metals.91
Redox activity and in situ oxidation state of Co–V
Quasi in situ XANES measurements were performed before the CoII/III redox feature, in between the CoII/III and CoIII/IV redox features, and during the OER. They revealed the average oxidation states of +2.6, +3.0, and +3.2, respectively (see Fig. S28, ESI†). These oxidation states are consistent with the quantification of the redox peaks and the assigned transitions. EXAFS analysis discloses that the catalyst structure is retained during these oxidation state changes, unveiling its high flexibility. Similar redox states could be observed for bulk active CoPi at neutral pH.49,92,93 Further, CoPi also acquires a LOH structure but with smaller domains and a less ordered arrangement.48 However, in CoPi investigated at pH 13–14, the catalytic activity is lower,94 the Tafel slope higher,40 and the CoII/III and CoIII/IV CV redox features are not well separated compared to Co–V.95 These results show again that small differences in the structure of LOH can strongly affect the electrocatalytic properties. For Co–KOH–V, XANES indicated an average oxidation state of Co2.4. This result does not mean that no CoIV is formed at the surface, but as the material is not bulk redox/OER active, the average oxidation state remains low.In light of the molecular concept of the “oxo wall”, the CoIV in Co–V might be best described by the two resonance structures CoIII–O−II and CoIV![[double bond, length as m-dash]](https://www.rsc.org/images/entities/char_e001.gif) O−I (in sum CoIV−δ–O−II+δ,96 if they are viewed as localized charges, as molecular cobalt cubane models indicate.97 Alternatively, the charge could be delocalized over a complete domain. Recently, it was revealed that charge delocalization is highly sensitive to small structural changes in amorphous cobalt LOHs.48 Larger, ordered domains, short Co–O bonds, and small Co–O–Co angles lead to a Co(4p)–O(2p)–Co(3d) hybridization and charge delocalization within a domain like in CoBi.48 CoPi with a domain size of 1.1 nm, Co–O bond length of 1.92 Å, and Co–O–Co angles of 94.8° does not show such a hybridization in resonant X-ray emission and resonant inelastic X-ray scattering. In CoBi with a domain size of 2.0 nm, Co–O bond length of 1.9 Å and Co–O–Co angles of 96.3°, the same spectroscopic methods clearly indicate such a hybridization. Co–V has a domain size of around 1–5 nm, Co–O bond length of 1.88 Å and Co–O–Co angles of around 100°. Therefore, the degree of Co(4p)–O(2p)–Co(3d) hybridization and electron delocalization is expected to be comparable to or larger than in CoBi. The strong structure sensitivity implies that possibly no general answer can be given on the question whether cobalt LOH materials during catalysis are better described with localized CoIV centers or delocalized CoIII+δ oxidation states.
O−I (in sum CoIV−δ–O−II+δ,96 if they are viewed as localized charges, as molecular cobalt cubane models indicate.97 Alternatively, the charge could be delocalized over a complete domain. Recently, it was revealed that charge delocalization is highly sensitive to small structural changes in amorphous cobalt LOHs.48 Larger, ordered domains, short Co–O bonds, and small Co–O–Co angles lead to a Co(4p)–O(2p)–Co(3d) hybridization and charge delocalization within a domain like in CoBi.48 CoPi with a domain size of 1.1 nm, Co–O bond length of 1.92 Å, and Co–O–Co angles of 94.8° does not show such a hybridization in resonant X-ray emission and resonant inelastic X-ray scattering. In CoBi with a domain size of 2.0 nm, Co–O bond length of 1.9 Å and Co–O–Co angles of 96.3°, the same spectroscopic methods clearly indicate such a hybridization. Co–V has a domain size of around 1–5 nm, Co–O bond length of 1.88 Å and Co–O–Co angles of around 100°. Therefore, the degree of Co(4p)–O(2p)–Co(3d) hybridization and electron delocalization is expected to be comparable to or larger than in CoBi. The strong structure sensitivity implies that possibly no general answer can be given on the question whether cobalt LOH materials during catalysis are better described with localized CoIV centers or delocalized CoIII+δ oxidation states.
Synthetic considerations and generalization of the structural model
Co–V is dramatically more active than Co–KOH–V, due to differences in domains size and stacking. Therefore, it is important to understand the synthetic aspects that lead to such structural arrangement. Recently, pseudo in situ HR-TEM investigations unveiled that amorphous CoSx transforms to crystalline CoOOH through crystalline Co(OH)2 as intermediate.32 This transformation pathway is identical to the one of Co–KOH–V. For Co–V, the key synthetic step is the immediate application of an electrical potential. The current response shown in Fig. 5(a) reveals that almost all the (SeIVO3)2− units are oxidized to (SeVIO4)2− within the first 10 s. The starting material CoSeO3·H2O already has a layered structure with a layer spacing of 6.6 Å. [CoO6] octahedra are connected by [SeIVO3] units, which point into the interlayer space. The immediate oxidation of the [SeIVO3] units to larger tetrahedral (SeVIO4)2− must result in an increased layer distance due to steric repulsion. Further, all selenate left the structure after 1 h of electrocatalysis. Therefore, the interlayer space must be big enough to allow the diffusion of the selenate. A model with correct relative sizes of the proposed Co–V structure and a space filling model of selenate is shown in Fig. 12(c) and (d). It reveals that the layer spacing of 8.9 Å is just large enough for the selenate. Thus, the role of selenate can be best described as a nanotemplate. This consideration directly links the anion type and structure of the precatalyst to the layer spacing and structure of the LOH catalyst.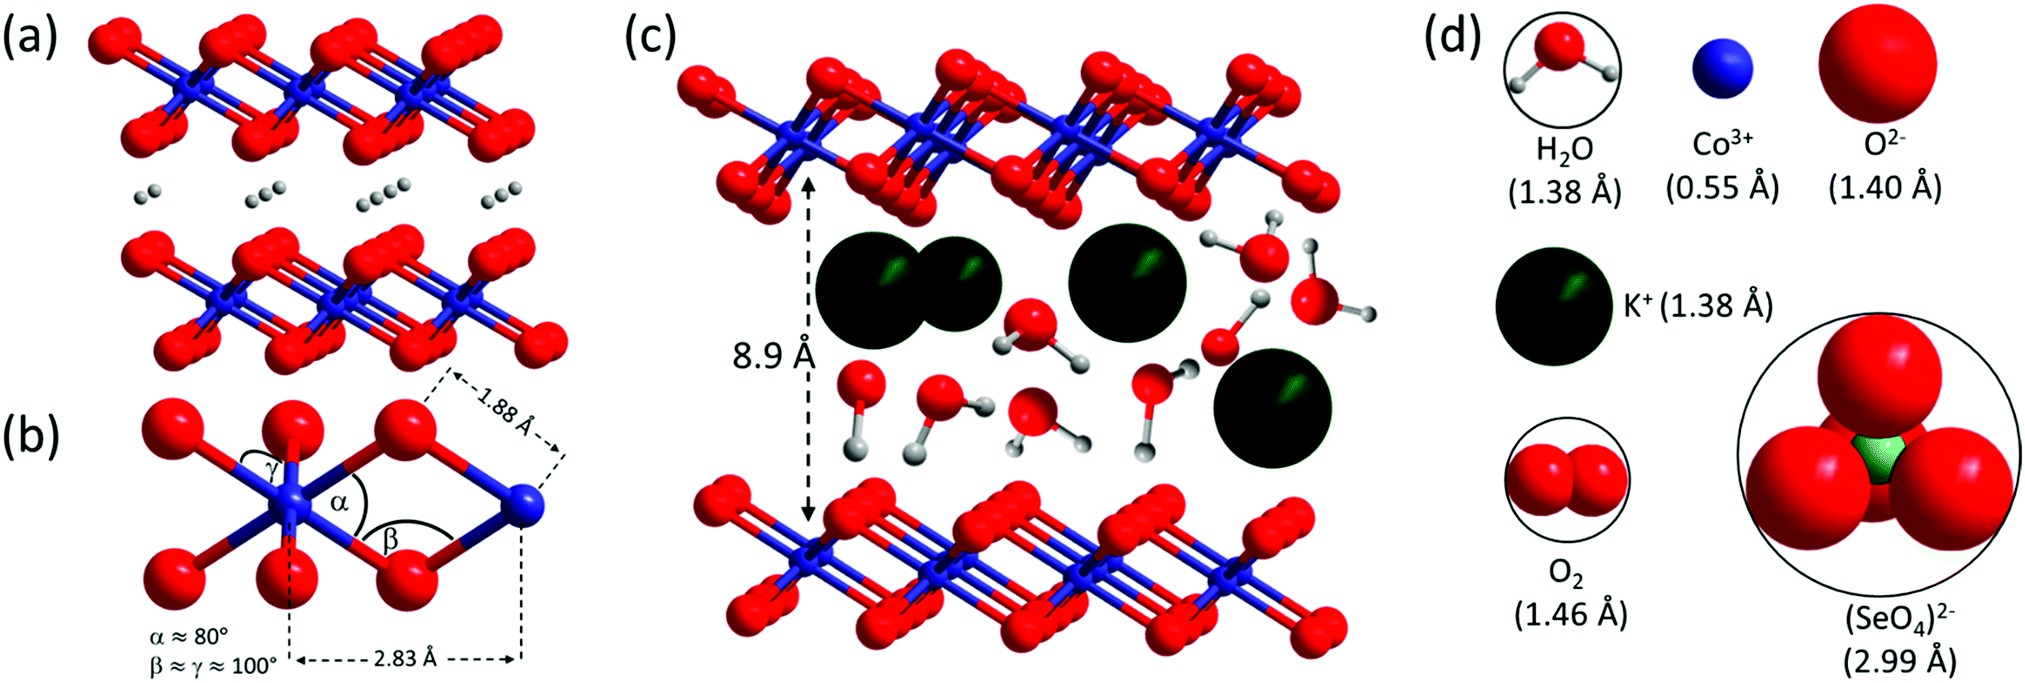 | ||
| Fig. 12 (a) Structure and layer stacking of β-CoOOH (Rm, JCPDS 7-169) as present in Co–KOH–V. (b) Structural motif of Co–V with distances obtained by EXAFS simulation and resulting bond angles. (c) Structural model of an area of Co–V with parallel domain stacking showing the layer distance in correct relation to interlayer K+, H2O, and HO−; the arrangement of the interlayer species is only illustrative and strongly simplified. (d) Different species in correct relative size to (c) with their respective radii for a coordination number of 6 in brackets.87 The radius of (SeO4)2− was determined from the crystal structure of CoSeO4 (JPCDS 53-0405) and a radius of 1.40 Å for O−II. | ||
We think that another decisive aspect for the formation of an electrolyte-penetrable, porous phase is the large volume per cobalt atom in the precatalyst structure combined with the rapid transformation. In CoSeO3·H2O, the layers are comprised of [CoO6] octahedra, which are connected via four corners to another four [CoO6] units (Co–Co distance 4.1 Å, see Fig. 2 right). In comparison, the cobalt atoms are much closer to each other in layers of LOH phases, which are comprised of edge sharing [CoO6] units with six closest cobalt neighbors at 2.83 Å (see Fig. 8). Further, CoSeO3·H2O contains water and [SeO3] in its interlayer space already. Thus, to form a non-porous densely packed CoOOH phase without interlayer cations and water starting from CoSeO3·H2O, the volume of the material would have to shrink by 65%, based on the volume per cobalt atom of the unit cells of CoSeO3·H2O (89.5 Å3 per Co) compared to β-CoOOH (30.8 Å3 per cobalt). Due to the rapid transformation and the dramatical volume difference, the thermodynamically favored dense β-CoOOH phase is avoided and instead a subnanometer porous structure with incorporated electrolyte and a volume closer to the one of CoSeO3·H2O is formed.
There is an ongoing debate whether NiFeOxHy, the currently most promising alkaline OER catalysts, is bulk or surface active.98–100 Recently, Chorkendorff and coworkers provided evidence that, for NiFeOxHy nanoparticles, the catalytic activity is limited to the near-surface region.100 However, previous investigations found that the bulk of Ni(Fe)OxHy is redox active (especially for pure nickel) and could also participate in the OER.90,99,101,102 Further, theoretical calculations revealed similar OER reaction intermediates for surface (001) and bulk sites in NiFeOOH LOH with a layer spacing of 6.5 Å to 8.0 Å, indicating that bulk activity is possible.90 Our report proves that both LOH of cobalt that are bulk active and such that are only near-surface-active exist. Applying this knowledge to NiFeOxHy, allows the observed discrepancies to be explained. In Chorkendorff's report, the NiFeOxHy was formed in situ out of metallic FeNi nanoparticles. Small layer spacing (Fe doped β-NiOOH) probably result from the high density of the metallic nanoparticles (the precatalyst) and the absence of an anion that could leach.103 Thus, it is expected that such NiFeOxHy are only near-surface-active, like Co–KOH–V. However, other synthetic routes lead to materials with a larger layer spacing and small domain sizes. Therefore, they are electrolyte-penetrable and bulk-active, like Co–V. This hypothesis is further supported by recent investigations on the layer spacing and stability of crystalline NiFeOxHy.89 These investigations revealed that slow hydroxide diffusion between the layers (d = 7.5 Å) leads to an acidification of the interlayer space, due to the OER occurring there, and finally to a dissolution of nickel and iron.
Conclusions
As predicted from a thermodynamic point of view, most materials transform during OER conditions and form LOH. To explore this transformation, we have investigated CoSeO3·H2O as an OER precatalyst and could obtain two different OER catalysts (Co–V and Co-KOH-V) by varying the pH and potential, clearly answering research question (a) from the introduction. The OER performance of Co–V is 15 times higher than that of Co–KOH–V, but Tafel analyses suggest that both catalyst materials share the same kind of active site. We derived a model that explains these findings: Co–V is bulk-active and Co–KOH–V only active in its near-surface region. Further, Co–V contains more μ2-oxo bridged cobalt edge sites, due to the smaller domains. In respect to research question (b), this model was correlated with the structures of the two catalysts. Both catalysts have the same short-range structure, layers of edge-sharing [CoO6] octahedra, but they vary strongly in the arrangement of these layers. In Co–KOH–V, the layers are large and stack in parallel with a layer spacing of 4.38 Å, forming crystalline β-CoOOH, which does not leave room for penetration of (substrate) water molecules. Conversely, in Co–V, the layers are only around 1–10 nm in size and stack in an unordered way, forming an X-ray amorphous phase. Still some of the layers stack in parallel, and in these cases, HR-TEM could visualize a layer spacing of 8.9 Å, which suggest the presence of intercalated (substrate) water, hydroxide and potassium. The structure of Co–V permits electrolyte penetration, enabling catalytic activity of the whole material. In respect to research questions (c) and (d), we explained the unique structure of Co–V by a strong contraction of the precatalyst cobalt layers and a nanotemplate effect of the rapidly forming and subsequently leaching of (SeVIO4)2−.This work shows that LOH of the same TM can have starkly different catalytic properties due to the structural differences revealed by our study. The models derived from the detailed characterization performed in this work can help to explain the apparently contradicting observation of in some cases near-surface active and in other cases bulk active iron/cobalt/nickel LOH catalysts. Another significant message conveyed herein is that, even though most materials will transform into LOH, their structures can differ pronouncedly and some of the precursor-derived OER catalyst materials are more active than catalysts obtained by straightforward synthesis of LOH. Therefore, we believe that the investigation of under OER-conditions metastable chalcogenides, pnictides, carbides, borides, phosphates, phosphites, borates, and intermetallic TM materials is of high interest, even though these anions may no longer be present in the final catalyst material.
Conflicts of interest
There are no conflicts to declare.Acknowledgements
The authors are indebted to Dr Vitaly Gutkin for XPS, Dr Stefan Behrens, Eva M. Heppke and Ina Speckman for pXRD. We thank the Helmholtz Zentrum Berlin (HZB) for providing access to the BESSY synchroton (XAS experiment at KMC-3) and Drs Ivo Zizak and Götz Schuck as well as further HZB staff for experimental support. We are grateful to the Einstein Center of Catalysis (EC2) for financial support. This project was also funded by the Deutsche Forschungsgemeinschaft (DFG, German Research Foundation) under Germany's Excellence Strategy – EXC 2008 – 390540038 – UniSysCat; the Bundesministerium für Bildung und Forschung (BMBF) provided financial support to the Operando-XAS project.Notes and references
- N. S. Lewis and D. G. Nocera, Proc. Natl. Acad. Sci. U. S. A., 2006, 103, 15729–15735 CrossRef.
- S. Chu, Y. Cui and N. Liu, Nat. Mater., 2016, 16, 16–22 CrossRef.
- T. R. Cook, D. K. Dogutan, S. Y. Reece, Y. Surendranath, T. S. Teets and D. G. Nocera, Chem. Rev., 2010, 110, 6474–6502 CrossRef.
- O. Schmidt, A. Gambhir, I. Staffell, A. Hawkes, J. Nelson and S. Few, Int. J. Hydrogen Energy, 2017, 42, 30470–30492 CrossRef.
- M. A. Pellow, C. J. M. Emmott, C. J. Barnhart and S. M. Benson, Energy Environ. Sci., 2015, 8, 1938–1952 RSC.
- W. Lubitz and W. Tumas, Chem. Rev., 2007, 107, 3900–3903 CrossRef.
- H. B. Gray, Nat. Chem., 2009, 1, 7 CrossRef.
- X. Zheng, B. Zhang, P. De Luna, Y. Liang, R. Comin, O. Voznyy, L. Han, F. P. García de Arquer, M. Liu, C. T. Dinh, T. Regier, J. J. Dynes, S. He, H. L. Xin, H. Peng, D. Prendergast, X. Du and E. H. Sargent, Nat. Chem., 2018, 10, 149–154 CrossRef.
- N.-T. Suen, S.-F. Hung, Q. Quan, N. Zhang, Y.-J. Xu and H. M. Chen, Chem. Soc. Rev., 2017, 46, 337–365 RSC.
- M. Tahir, L. Pan, F. Idrees, X. Zhang, L. Wang, J. J. Zou and Z. L. Wang, Nano Energy, 2017, 37, 136–157 CrossRef CAS.
- J. Li, R. Güttinger, R. Moré, F. Song, W. Wan and G. R. Patzke, Chem. Soc. Rev., 2017, 46, 6124–6147 RSC.
- T. J. Meyer, Nature, 2008, 451, 778–779 CrossRef CAS.
- F. Lyu, Q. Wang, S. M. Choi and Y. Yin, Small, 2019, 15, 1804201 CrossRef.
- Y. Matsumoto and E. Sato, Mater. Chem. Phys., 1986, 14, 397–426 CrossRef CAS.
- S. Anantharaj, S. R. Ede, K. Sakthikumar, K. Karthick, S. Mishra and S. Kundu, ACS Catal., 2016, 6, 8069–8097 CrossRef CAS.
- O. Mabayoje, A. Shoola, B. R. Wygant and C. B. Mullins, ACS Energy Lett., 2016, 1, 195–201 CrossRef CAS.
- N. Jiang, B. You, M. Sheng and Y. Sun, Angew. Chem., Int. Ed., 2015, 54, 6251–6254 CrossRef CAS.
- J. H. Kim, K. Kawashima, B. R. Wygant, O. Mabayoje, Y. Liu, J. H. Wang and C. B. Mullins, ACS Appl. Energy Mater., 2018, 1, 5145–5150 CAS.
- J. Masa, P. Weide, D. Peeters, I. Sinev, W. Xia, Z. Sun, C. Somsen, M. Muhler and W. Schuhmann, Adv. Energy Mater., 2016, 6, 1502313 CrossRef.
- S. Cobo, J. Heidkamp, P.-A. Jacques, J. Fize, V. Fourmond, L. Guetaz, B. Jousselme, V. Ivanova, H. Dau, S. Palacin, M. Fontecave and V. Artero, Nat. Mater., 2012, 11, 802–807 CrossRef CAS.
- P. W. Menezes, C. Panda, S. Loos, F. Bunschei-Bruns, C. Walter, M. Schwarze, X. Deng, H. Dau and M. Driess, Energy Environ. Sci., 2018, 11, 1287–1298 RSC.
- P. Chen, K. Xu, T. Zhou, Y. Tong, J. Wu, H. Cheng, X. Lu, H. Ding, C. Wu and Y. Xie, Angew. Chem., Int. Ed., 2016, 55, 2488–2492 CrossRef CAS.
- P. W. Menezes, A. Indra, I. Zaharieva, C. Walter, S. Loos, S. Hoffmann, R. Schlögl, H. Dau and M. Driess, Energy Environ. Sci., 2019, 12, 988–999 RSC.
- P. W. Menezes, C. Panda, S. Garai, C. Walter, A. Guiet and M. Driess, Angew. Chem., Int. Ed., 2018, 57, 15237–15242 CrossRef CAS.
- J. Masa and W. Schuhmann, ChemCatChem, 2019, 11, 5842–5854 CrossRef CAS.
- B. R. Wygant, K. Kawashima and C. B. Mullins, ACS Energy Lett., 2018, 3, 2956–2966 CrossRef CAS.
- S. Jin, ACS Energy Lett., 2017, 2, 1937–1938 CrossRef CAS.
- K. Liu, C. Zhang, Y. Sun, G. Zhang, X. Shen, F. Zou, H. Zhang, Z. Wu, E. C. Wegener, C. J. Taubert, J. T. Miller, Z. Peng and Y. Zhu, ACS Nano, 2018, 12, 158–167 CrossRef CAS.
- W. Chen, Y. Liu, Y. Li, J. Sun, Y. Qiu, C. Liu, G. Zhou and Y. Cui, Nano Lett., 2016, 16, 7588–7596 CrossRef CAS.
- J. N. Hausmann, E. M. Heppke, R. Beltrán-Suito, J. Schmidt, M. Mühlbauer, M. Lerch, P. W. Menezes and M. Driess, ChemCatChem, 2020, 12, 1–9 CrossRef.
- Y. Li, X. Du, J. Huang, C. Wu, Y. Sun, G. Zou, C. Yang and J. Xiong, Small, 2019, 15, 1–18 Search PubMed.
- K. Fan, H. Zou, Y. Lu, H. Chen, F. Li, J. Liu, L. Sun, L. Tong, M. F. Toney, M. Sui and J. Yu, ACS Nano, 2018, 12, 12369–12379 CrossRef CAS.
- H. Jiang, Q. He, Y. Zhang and L. Song, Acc. Chem. Res., 2018, 51, 2968–2977 CrossRef CAS.
- P. W. Menezes, C. Walter, J. N. Hausmann, R. Beltrán-Suito, C. Schlesiger, S. Praetz, V. Y. Verchenko, A. V. Shevelkov and M. Driess, Angew. Chem., Int. Ed., 2019, 58, 16569–16574 CrossRef CAS.
- P. W. Menezes, C. Panda, C. Walter, M. Schwarze and M. Driess, Adv. Funct. Mater., 2019, 29, 1808632 CrossRef.
- A. Indra, P. W. Menezes, I. Zaharieva, H. Dau and M. Driess, J. Mater. Chem. A, 2020, 8, 2637–2643 RSC.
- Y. Liu, H. Cheng, M. Lyu, S. Fan, Q. Liu, W. Zhang, Y. Zhi, C. Wang, C. Xiao, S. Wei, B. Ye and Y. Xie, J. Am. Chem. Soc., 2014, 136, 15670–15675 CrossRef CAS.
- J. Hwang, R. R. Rao, L. Giordano, Y. Katayama, Y. Yu and Y. Shao-Horn, Science, 2017, 358, 751–756 CrossRef CAS.
- M. Bajdich, M. García-Mota, A. Vojvodic, J. K. Nørskov and A. T. Bell, J. Am. Chem. Soc., 2013, 135, 13521–13530 CrossRef CAS.
- J. B. Gerken, J. G. McAlpin, J. Y. C. Chen, M. L. Rigsby, W. H. Casey, R. D. Britt and S. S. Stahl, J. Am. Chem. Soc., 2011, 133, 14431–14442 CrossRef CAS.
- B. Beverskog and I. Puigdomenech, Corros. Sci., 1996, 38, 2121–2135 CrossRef CAS.
- B. Beverskog and I. Puigdomenech, Corros. Sci., 1997, 39, 969–980 CrossRef CAS.
- K. Xu, H. Cheng, L. Liu, H. Lv, X. Wu, C. Wu and Y. Xie, Nano Lett., 2017, 17, 578–583 CrossRef CAS.
- S. Anantharaj, K. Karthick and S. Kundu, Mater. Today Energy, 2017, 6, 1–26 CrossRef.
- B. M. Hunter, W. Hieringer, J. R. Winkler, H. B. Gray and A. M. Müller, Energy Environ. Sci., 2016, 9, 1734–1743 RSC.
- M. J. DelloStritto, A. C. Thenuwara, M. L. Klein and D. R. Strongin, J. Phys. Chem. C, 2019, 123, 13593–13599 CrossRef CAS.
- C. L. Farrow, D. K. Bediako, Y. Surendranath, D. G. Nocera and S. J. L. Billinge, J. Am. Chem. Soc., 2013, 135, 1–4 CrossRef.
- G. Kwon, H. Jang, J. S. Lee, A. Mane, D. J. Mandia, S. R. Soltau, L. M. Utschig, A. B. F. Martinson, D. M. Tiede, H. Kim and J. Kim, J. Am. Chem. Soc., 2018, 140, 10710–10720 CrossRef.
- M. Risch, F. Ringleb, M. Kohlhoff, P. Bogdanoff, P. Chernev, I. Zaharieva and H. Dau, Energy Environ. Sci., 2015, 8, 661–674 RSC.
- S. Niu, W. J. Jiang, Z. Wei, T. Tang, J. Ma, J. S. Hu and L. J. Wan, J. Am. Chem. Soc., 2019, 141, 7005–7013 CrossRef CAS.
- N. Kornienko, N. Heidary, G. Cibin and E. Reisner, Chem. Sci., 2018, 9, 5322–5333 RSC.
- J. Huang, J. Chen, T. Yao, J. He, S. Jiang, Z. Sun, Q. Liu, W. Cheng, F. Hu, Y. Jiang, Z. Pan and S. Wei, Angew. Chem., Int. Ed., 2015, 54, 8722–8727 CrossRef CAS.
- M. S. Burke, S. Zou, L. J. Enman, J. E. Kellon, C. A. Gabor, E. Pledger and S. W. Boettcher, J. Phys. Chem. Lett., 2015, 6, 3737–3742 CrossRef CAS.
- Y. Song, Q. Gu, Z. Pan, L. Hu, D. Sun, Y. Meng, L. Jiang, Y. Jiang, Z. Wu and P. Yang, ACS Nano, 2018, 12, 5011–5020 CrossRef.
- L. Hu, Z. Wu, W. Tian, Y. Jiang, L. Jiang, P. Yang and Z. Pan, Nanoscale, 2018, 10, 12003–12010 RSC.
- B. Engelen, U. Bäumer, B. Hermann, H. Müller and K. Unterderweide, Z. Anorg. Allg. Chem., 1996, 622, 1886–1892 CrossRef CAS.
- X. Xu, F. Song and X. Hu, Nat. Commun., 2016, 7, 12324 CrossRef CAS.
- Z. Fang, L. Peng, H. Lv, Y. Zhu, C. Yan, S. Wang, P. Kalyani, X. Wu and G. Yu, ACS Nano, 2017, 11, 9550–9557 CrossRef CAS.
- I. H. Kwak, H. S. Im, D. M. Jang, Y. W. Kim, K. Park, Y. R. Lim, E. H. Cha and J. Park, ACS Appl. Mater. Interfaces, 2016, 8, 5327–5334 CrossRef CAS.
- C. Tang, N. Cheng, Z. Pu, W. Xing and X. Sun, Angew. Chem., Int. Ed., 2015, 54, 9351–9355 CrossRef CAS.
- J. Li, D. Fan, M. Wang, Z. Wang, Z. Liu, K. Zhao, L. Zhou and L. Mai, ChemElectroChem, 2019, 6, 331–335 CrossRef CAS.
- A. Bergmann, T. E. Jones, E. Martinez Moreno, D. Teschner, P. Chernev, M. Gliech, T. Reier, H. Dau and P. Strasser, Nat. Catal., 2018, 1, 711–719 CrossRef CAS.
- V. Augustyn, P. Simon and B. Dunn, Energy Environ. Sci., 2014, 7, 1597–1614 RSC.
- S. Ardizzone, G. Fregonara and S. Trasatti, Electrochim. Acta, 1990, 35, 263–267 CrossRef CAS.
- C. N. Brodsky, D. K. Bediako, C. Shi, T. P. Keane, C. Costentin, S. J. L. Billinge and D. G. Nocera, ACS Appl. Energy Mater., 2019, 2, 3–12 CrossRef CAS.
- M. B. Stevens, L. J. Enman, A. S. Batchellor, M. R. Cosby, A. E. Vise, C. D. M. Trang and S. W. Boettcher, Chem. Mater., 2017, 29, 120–140 CrossRef CAS.
- C. Pasquini, I. Zaharieva, D. González-Flores, P. Chernev, M. R. Mohammadi, L. Guidoni, R. D. L. Smith and H. Dau, J. Am. Chem. Soc., 2019, 141, 2938–2948 CrossRef CAS.
- J. B. Gerken, E. C. Landis, R. J. Hamers and S. S. Stahl, ChemSusChem, 2010, 3, 1176–1179 CrossRef CAS.
- A. Bergmann, E. Martinez-Moreno, D. Teschner, P. Chernev, M. Gliech, J. F. de Araújo, T. Reier, H. Dau and P. Strasser, Nat. Commun., 2015, 6, 8625 CrossRef CAS.
- C. Mockenhaupt, T. Zeiske and H. D. Lutz, J. Mol. Struct., 1998, 443, 191–196 CrossRef CAS.
- C. W. Tang, C. Bin Wang and S. H. Chien, Thermochim. Acta, 2008, 473, 68–73 CrossRef CAS.
- P. S. Peercy, Opt. Commun., 1970, 2, 270–272 CrossRef CAS.
- T. Pauporte, L. Mendoza, M. Cassir, M. C. Bernard and J. Chivot, J. Electrochem. Soc., 2005, 152, 49–53 CrossRef.
- M. Ludvigsson, J. Lindgren and J. Tegenfeldt, J. Mater. Chem., 2001, 11, 1269–1276 RSC.
- Y. C. Liu, J. A. Koza and J. A. Switzer, Electrochim. Acta, 2014, 140, 359–365 CrossRef CAS.
- B. S. Yeo and A. T. Bell, J. Am. Chem. Soc., 2011, 133, 5587–5593 CrossRef CAS.
- Y. Matsuda, N. Kuwata, T. Okawa, A. Dorai, O. Kamishima and J. Kawamura, Solid State Ionics, 2019, 335, 7–14 CrossRef CAS.
- D. Chen, D. Ding, X. Li, G. H. Waller, X. Xiong, M. A. El-Sayed and M. Liu, Chem. Mater., 2015, 27, 6608–6619 CrossRef CAS.
- L. Pinsard-Gaudart, V.-C. Ciomaga, O. Dragos, R. Guillot and N. Dragoe, J. Cryst. Growth, 2011, 334, 165–169 CrossRef CAS.
- R. D. L. Smith, C. Pasquini, S. Loos, P. Chernev, K. Klingan, P. Kubella, M. R. Mohammadi, D. Gonzalez-Flores and H. Dau, Nat. Commun., 2017, 8, 2022 CrossRef.
- J. E. Post, Proc. Natl. Acad. Sci. U. S. A., 1999, 96, 3447–3454 CrossRef CAS.
- C. Yang, G. Rousse, K. Louise Svane, P. E. Pearce, A. M. Abakumov, M. Deschamps, G. Cibin, A. V. Chadwick, D. A. Dalla Corte, H. Anton Hansen, T. Vegge, J. M. Tarascon and A. Grimaud, Nat. Commun., 2020, 11, 1–10 Search PubMed.
- Y.-H. Fang and Z.-P. Liu, ACS Catal., 2014, 4, 4364–4376 CrossRef CAS.
- T. Shinagawa, A. T. Garcia-Esparza and K. Takanabe, Sci. Rep., 2015, 5, 1–21 Search PubMed.
- J. T. Mefford, Z. Zhao, M. Bajdich and W. C. Chueh, Energy Environ. Sci., 2020, 13, 622–634 RSC.
- A. M. Ullman, C. N. Brodsky, N. Li, S. L. Zheng and D. G. Nocera, J. Am. Chem. Soc., 2016, 138, 4229–4236 CrossRef CAS.
- M. Zhang, M. De Respinis and H. Frei, Nat. Chem., 2014, 6, 362–367 CrossRef CAS.
- R. D. Shannon, Acta Crystallogr., Sect. A: Found. Adv., 1976, 32, 751–767 CrossRef.
- R. Chen, S. Hung, D. Zhou, J. Gao, C. Yang, H. Tao, H. Bin Yang, L. Zhang, L. Zhang, Q. Xiong, H. M. Chen and B. Liu, Adv. Mater., 2019, 31, 1903909 CrossRef CAS.
- A. D. Doyle, M. Bajdich and A. Vojvodic, Catal. Lett., 2017, 147, 1533–1539 CrossRef.
- Q. Kang, L. Vernisse, R. C. Remsing, A. C. Thenuwara, S. L. Shumlas, I. G. McKendry, M. L. Klein, E. Borguet, M. J. Zdilla and D. R. Strongin, J. Am. Chem. Soc., 2017, 139, 1863–1870 CrossRef CAS.
- D. González-Flores, I. Sánchez, I. Zaharieva, K. Klingan, J. Heidkamp, P. Chernev, P. W. Menezes, M. Driess, H. Dau and M. L. Montero, Angew. Chem., Int. Ed., 2015, 54, 2472–2476 CrossRef.
- M. Risch, K. Klingan, F. Ringleb, P. Chernev, I. Zaharieva, A. Fischer and H. Dau, ChemSusChem, 2012, 5, 542–549 CrossRef CAS.
- C. C. L. McCrory, S. Jung, J. C. Peters and T. F. Jaramillo, J. Am. Chem. Soc., 2013, 135, 16977–16987 CrossRef CAS.
- S. W. Lee, C. Carlton, M. Risch, Y. Surendranath, S. Chen, S. Furutsuki, A. Yamada, D. G. Nocera and Y. Shao-Horn, J. Am. Chem. Soc., 2012, 134, 16959–16962 CrossRef CAS.
- J. R. Winkler and H. B. Gray, Struct. Bonding, 2012, 142, 17–28 CrossRef CAS.
- C. N. Brodsky, R. G. Hadt, D. Hayes, B. J. Reinhart, N. Li, L. X. Chen and D. G. Nocera, Proc. Natl. Acad. Sci. U. S. A., 2017, 114, 3855–3860 CrossRef CAS.
- R. L. Doyle and M. E. G. Lyons, Phys. Chem. Chem. Phys., 2013, 15, 5224 RSC.
- A. S. Batchellor and S. W. Boettcher, ACS Catal., 2015, 5, 6680–6689 CrossRef CAS.
- C. Roy, B. Sebok, S. B. Scott, E. M. Fiordaliso, J. E. Sørensen, A. Bodin, D. B. Trimarco, C. D. Damsgaard, P. C. K. Vesborg, O. Hansen, I. E. L. Stephens, J. Kibsgaard and I. Chorkendorff, Nat. Catal., 2018, 1, 820–829 CrossRef CAS.
- L. Trotochaud, J. K. Ranney, K. N. Williams and S. W. Boettcher, J. Am. Chem. Soc., 2012, 134, 17253–17261 CrossRef CAS.
- M. Görlin, P. Chernev, J. F. De Araújo, T. Reier, S. Dresp, B. Paul, R. Krähnert, H. Dau and P. Strasser, J. Am. Chem. Soc., 2016, 138, 5603–5614 CrossRef.
- S. Loos, I. Zaharieva, P. Chernev, A. Lißner and H. Dau, ChemSusChem, 2019, 12, 1966–1976 CrossRef CAS.
Footnotes |
| † Electronic supplementary information (ESI) available. See DOI: 10.1039/d0ee01912g |
| ‡ The correct formula of the compound would be Co(H2O)[SeO3], as the water coordinates to the cobalt and is not crystal water. However, we refer to it as CoSeO3·H2O to be consistent with previous reports. |
| This journal is © The Royal Society of Chemistry 2020 |