
 Open Access Article
 This Open Access Article is licensed under a
 Creative Commons Attribution 3.0 Unported Licence
A revised mechanistic model for sodium insertion in hard carbons†
Heather
Au
 a,
Hande
Alptekin
a,
Anders C. S.
Jensen
ab,
Emilia
Olsson
abc,
Christopher A.
O’Keefe
d,
Thomas
Smith
d,
Maria
Crespo-Ribadeneyra
a,
Thomas F.
Headen
e,
Clare P.
Grey
d,
Qiong
Cai
c,
Alan J.
Drew
b and
Maria-Magdalena
Titirici
*a
a,
Hande
Alptekin
a,
Anders C. S.
Jensen
ab,
Emilia
Olsson
abc,
Christopher A.
O’Keefe
d,
Thomas
Smith
d,
Maria
Crespo-Ribadeneyra
a,
Thomas F.
Headen
e,
Clare P.
Grey
d,
Qiong
Cai
c,
Alan J.
Drew
b and
Maria-Magdalena
Titirici
*a
aDepartment of Chemical Engineering, Imperial College London, London, SW7 2AZ, UK. E-mail: m.titirici@imperial.ac.uk
bSchool of Physics and Astronomy and Materials Research Institute, Queen Mary University of London, London, E1 4NS, UK
cDepartment of Chemical and Process Engineering, University of Surrey, Guildford, GU2 7XH, UK
dDepartment of Chemistry, University of Cambridge, Cambridge, CB2 1EW, UK
eISIS Pulsed Neutron and Muon Source, Rutherford Appleton Laboratory, STFC, Didcot OX11 0QX, UK
First published on 7th August 2020
Abstract
Hard carbons have shown considerable promise as anodes for emerging sodium-ion battery technologies. Current understanding of sodium-storage behaviour in hard carbons attributes capacity to filling of graphitic interlayers and pores, and adsorption at defects, although there is still considerable debate regarding the voltages at which these mechanisms occur. Here, ex situ23Na solid-state NMR and total scattering studies on a systematically tuned series of hard carbons revealed the formation of increasingly metallic sodium clusters in direct correlation to the growing pore size, occurring only in samples which exhibited a low voltage plateau. Combining experimental results with DFT calculations, we propose a revised mechanistic model in which sodium ions store first simultaneously and continuously at defects, within interlayers and on pore surfaces. Once these higher energy binding sites are filled, pore filling occurs during the plateau region, where the densely confined sodium takes on a greater degree of metallicity.
Broader contextSodium-ion batteries (NIBs) have shown potential as a cost-effective successor to lithium-ion batteries (LIBs) for large-scale, low cost electrical energy storage applications. However, graphite (the standard anode material in LIB technology) is unsuitable for sodium-ion storage; identifying suitable alternative materials is, therefore, of interest to the research community. Disordered ‘hard’ carbons are considered promising anode materials, but an incomplete understanding of the sodium storage mechanism prevents improved rational design of higher performing anodes. In this work, we prepared a series of carbons with systematically tuned pore size, degree of defects and graphitic structure to understand important fundamentals of sodium storage behaviour. We have demonstrated that while particular carbon motifs are responsible for certain storage processes at different voltages, these derived capacities are not independent of each other, and that retaining overall connectivity and diffusion channels is crucial. Optimising the performance of hard carbons is therefore a balance between maintaining open diffusion pathways and maximising the number of accessible storage sites. Our findings provide insight into the future design and development of hard carbons for NIBs, to produce optimised materials which will contribute to the advancement of sodium-ion technologies. |
Introduction
As the global energy demand increases, the development of effective and sustainable energy storage systems is becoming critically important. Whilst lithium-ion batteries (LIBs) are an established technology,1 the uneven global distribution and limited supply of lithium reserves greatly restricts their use for large-scale energy storage applications. Sodium-ion batteries (NIBs) are considered a natural successor to LIBs because of their similar chemical and electrochemical properties,2 offering a more sustainable and lower cost alternative. However, one significant limitation in the progress of NIB technology has been the development of suitable anode materials.3 Graphite anodes are widely used in LIBs, forming the stage one graphite intercalation compound (GIC) LiC6 with a reversible capacity of 372 mA h g−1.4 On the other hand, in conventional electrolytes sodium ions cannot intercalate into graphite to any great extent (NaC64),5 and therefore graphite is unsuitable for NIB applications.Instead, since the first report by Stevens and Dahn in 2000,6 much research has been conducted into non-graphitic hard carbons as NIB anodes, and these materials have exhibited promising reversible capacities around 300 mA h g−1.3,4,7,8 Generally, carbons were obtained from simple sugars, natural biomass or polymer precursors, and converted either by direct pyrolysis, microwave irradiation, hydrothermal carbonisation or a combination of these processes.9–18 Hydrothermal carbons, in particular, are well-suited for energy storage applications since the spherical morphology obtained after treatment enables uniform charge distribution across particle surfaces and a better packing density in the electrode, whilst the low surface area-to-volume ratio can minimise the extent of the solid electrolyte interphase (SEI) formed in the first cycle.9,19
Hard carbons are composed of randomly-oriented, curved and defective graphene nanosheets, turbostratically stacked with large interlayer distances,20,21 providing sodium storage capacity at defects and sheet edges, within pores, and between expanded graphene layers. For hard carbons, the characteristic charge–discharge profiles typically exhibit a sloping region between 1.0 and 0.1 V, and a plateau below 0.1 V. In previous studies, these two regions have generally been attributed to distinct sodium storage mechanisms. The early model proposed by Stevens and Dahn based on small and wide angle X-ray scattering (SAXS, WAXS) analysis assigned sodium intercalation to the sloping voltage region, and micropore filling to the low voltage plateau;22,23 this model was later supported by operando nuclear magnetic resonance (NMR) spectroscopy.24 In contrast, an alternative model was proposed consisting of surface and defect adsorption in the sloping region followed by interlayer intercalation in the low voltage plateau, with sodium plating occurring close to 0 V.25 Subsequent reports have suggested different combinations of these various Na storage processes,26–32 but always as individual contributions to distinct sections of the voltage profile, with little discussion on how the capacities arising from these various structural motifs may be interdependent. Moreover, several of these studies dismiss pore filling based on the low pore volumes observed using gas adsorption techniques.30,31 In addition, the exact nature of the sodium stored within the pores is disputed, with some observing metallic sodium24,32,33 whilst only ionic sodium is present in other systems.28,30 The development of operando and in situ measurements in techniques such as SAXS, WAXS, X-ray diffraction (XRD),22,23,28,34 Raman35 and NMR24,36 spectroscopy has enabled these studies, but there is still considerable debate regarding the sodium storage mechanisms at different voltages.
In this work, a series of hard carbons with systematically tuned porosity, pore connectivity, number of defects, and graphitic structure, was prepared by hydrothermal treatment of glucose followed by high temperature pyrolysis. A correlation between the microstructure and sodium storage behaviour was established with ex situ23Na NMR spectroscopy, X-ray and neutron scattering, and supported with density functional theory (DFT) calculations. While other studies have focused on particular individual techniques to elucidate the storage mechanisms, our work brings together complementary methods to not only extensively characterise the carbon structural evolution with temperature, but also the sodium environment during electrochemical cycling, to provide fundamental understanding of sodium storage behaviour in hard carbons. In particular, the NMR measurements demonstrated the increasingly metallic nature of the stored sodium with increasing pore size. This quasi-metallic environment was only present in the carbons that exhibited a low voltage plateau, supporting the mechanistic assignment of pore filling during this region. However, while higher pyrolysis temperatures increase pore capacity, diffusion pathways within graphite interlayers and across defects are reduced, rendering some pores inaccessible and limiting sodium storage in the sloping region; optimising the performance of hard carbons is therefore a balance between maintaining an expanded interlayer distance, the number of defects, and open diffusion pathways, whilst also maximising the size of accessible pores.
Experimental
Materials synthesis
Hard carbons were prepared by hydrothermal carbonisation (HTC) of glucose. In a typical batch, 10 g glucose (D-(+)-glucose, ≥99.5%, Sigma-Aldrich) was dissolved in 90 mL deionised water. The solution was placed in a sealed 200 mL autoclave reactor vessel and heated at 230 °C for 12 hours. After reaction, the resulting solid (GHTC) was separated from the supernatant and dried under vacuum at 80 °C overnight, and then further carbonised at 1000, 1300, 1500, 1700 or 1900 °C for 2 hours under a nitrogen atmosphere, to yield the five materials G1000, G1300, G1500, G1700, and G1900 (overall yield 23–26%).Materials characterisation
Scanning electron microscopy (SEM) was carried out using a FEI Inspect-F SEM at 10 kV. The carbon samples were mounted onto stainless steel stubs with double-sided carbon tape. X-ray photoelectron spectroscopy (XPS) data were recorded using a ThermoFisher Nexsa X-ray spectrometer equipped with an Al Kα monochromated X-ray source. Survey scans were acquired using 200 eV pass energy, 1 eV step size and 200 ms (10 ms × 20 scans) dwell times. All high-resolution spectra were acquired using 50 eV pass energy, 0.1 eV step size and 1 s (50 ms × 20 scans) dwell times. Samples were prepared by pressing the sample onto double-sided carbon tape. Pressure during measurement acquisition was ≤1 × 10⁻⁹ mbar. Atomic compositions were calculated from averaged spectra obtained from 3 areas per sample. Transmission electron microscopy (TEM) was carried out using a JEOL 2100Plus TEM at 200 kV operating voltage. Samples were prepared on 300 copper mesh holey carbon grids (Agar Scientific) by drop-casting dilute carbon dispersions onto a grid supported by filter paper and drying under vacuum. Raman spectra were collected on a Renishaw inVia Reflex spectrometer (1000–3000 cm−1) using a 633 nm laser. Measurements of 5 areas per sample were collected and averaged. The average in-plane distances, La, were determined from the intensity ratio of the D- and G-bands.37 Small/wide angle X-ray scattering (SAXS/WAXS) was measured on a Xenocs nano-InXider with a Cu Kα source and a two-detector setup for combined SAXS/WAXS measurements. Powder samples were packed in 2 mm Kapton capillaries and measured for 10 min. The empty capillary was measured separately and used for background subtraction. Neutron total scattering was carried out at the NIMROD38 instrument at ISIS (Harwell, UK). Each sample was measured for 2 hours and data corrections and reduction were performed using Gudrun.39 The N2 and CO2 adsorption isotherms were obtained at 77 K and 273 K, respectively, using a Quantachrome NOVA 4200 or Autosorb iQ-C instrument. The specific surface areas were calculated with the multipoint Brunauer–Emmett–Teller (BET) method for N2 or Dubinin-Radushkevich method for CO2, and pore size distributions (PSD) were obtained using a non-local density functional theory (NLDFT) model from the adsorption line of the isotherm.Electrochemical characterisation
Electrodes were prepared from slurries of 90 wt% hard carbon and 10 wt% sodium carboxymethyl cellulose binder (Mw ∼ 250![[thin space (1/6-em)]](https://www.rsc.org/images/entities/char_2009.gif) 000, Sigma Aldrich) in water, applied in a 250 μm layer on Al foil (conductive carbon coated, 18 μm, MTI corporation). The foils were cut to size (13 mm diameter) and dried under vacuum at 80 °C overnight, before being placed in the glovebox for final assembly. The electrolyte and cell preparation were conducted in an argon-filled glovebox with H2O < 0.5 ppm, O2 < 0.5 ppm. Sodium hexafluorophosphate (NaPF6, Alfa Aesar, ≥99%) was first dried at 80 °C under vacuum for 16 h. A 1:1 mixture, by volume, of ethylene carbonate (EC, anhydrous 99%, Sigma Aldrich) and dimethyl carbonate (DMC, anhydrous ≥99%, Sigma Aldrich) was dried over 4 Å molecular sieves (20 vol%) for one day before use, and the solvent extracted from the top fraction to avoid contamination. A 1 M electrolyte solution was prepared by stirring NaPF6 in EC/DMC until fully dissolved. To assemble the cell, a carbon anode, glass fibre separator (Whatman GF/B glass microfibre, 18 mm diameter) saturated with electrolyte (150 μL), and sodium metal sheet (sodium ingot, 99.8% metals basis, Alfa Aesar) were assembled in a CR2032 coin cell. Galvanostatic charge/discharge profiles and rate capability were measured on a BaSyTec CTS battery testing system in the potential window 0.005-2.5 V vs. Na+/Na, at current densities from 30 to 600 mA g−1 (0.1–2C). All voltages quoted in the text are vs. Na+/Na, unless stated otherwise. Cyclic voltammetry was performed on a Biologic VSP-300 potentiostat at a scan rate of 0.1 mV s−1. Measurements were repeated 3 times; voltage–capacity profiles presented below are of one individual measurement, while the capacity vs. temperature plot is averaged data.
000, Sigma Aldrich) in water, applied in a 250 μm layer on Al foil (conductive carbon coated, 18 μm, MTI corporation). The foils were cut to size (13 mm diameter) and dried under vacuum at 80 °C overnight, before being placed in the glovebox for final assembly. The electrolyte and cell preparation were conducted in an argon-filled glovebox with H2O < 0.5 ppm, O2 < 0.5 ppm. Sodium hexafluorophosphate (NaPF6, Alfa Aesar, ≥99%) was first dried at 80 °C under vacuum for 16 h. A 1:1 mixture, by volume, of ethylene carbonate (EC, anhydrous 99%, Sigma Aldrich) and dimethyl carbonate (DMC, anhydrous ≥99%, Sigma Aldrich) was dried over 4 Å molecular sieves (20 vol%) for one day before use, and the solvent extracted from the top fraction to avoid contamination. A 1 M electrolyte solution was prepared by stirring NaPF6 in EC/DMC until fully dissolved. To assemble the cell, a carbon anode, glass fibre separator (Whatman GF/B glass microfibre, 18 mm diameter) saturated with electrolyte (150 μL), and sodium metal sheet (sodium ingot, 99.8% metals basis, Alfa Aesar) were assembled in a CR2032 coin cell. Galvanostatic charge/discharge profiles and rate capability were measured on a BaSyTec CTS battery testing system in the potential window 0.005-2.5 V vs. Na+/Na, at current densities from 30 to 600 mA g−1 (0.1–2C). All voltages quoted in the text are vs. Na+/Na, unless stated otherwise. Cyclic voltammetry was performed on a Biologic VSP-300 potentiostat at a scan rate of 0.1 mV s−1. Measurements were repeated 3 times; voltage–capacity profiles presented below are of one individual measurement, while the capacity vs. temperature plot is averaged data.
Solid-state nuclear magnetic resonance (NMR) spectroscopy
The cells were cycled on a Lanhe battery cycler at a rate of 0.05C until the lower cutoff voltage of 5 mV was reached. The cells were then disassembled in an argon atmosphere and the carbon electrodes were rinsed with DMC and dried under vacuum. The carbon films were separated from the aluminium current collectors, ground in a mortar and pestle, and packed into 1.3 mm outer diameter zirconia rotors. 23Na solid-state NMR experiments were conducted on a Bruker Avance III console equipped with a 16.4 T magnet (corresponding to Larmor frequencies of ν0(1H) = 700 MHz, ν0(23Na) = 185.3 MHz). A Bruker 1.3 mm double channel magic-angle spinning (MAS) probe was used with a spinning frequency of 60 kHz. Due to the short transverse relaxation time constants (T2) of the quasi-metallic Na environments, a Hahn echo experiment could not be used as there was significant signal decay during the echo delay period resulting in very low signal-to-noise ratios. Therefore, a Bloch decay pulse sequence was used with an optimized 45° pulse length of 0.95 μs (corresponding to 132 kHz of rf power), a 50 ms recycle delay, and 40912 transients were collected for a total experimental time of 55 minutes. Spectra were obtained with the application of 1500 Hz of exponential apodization, zero filling, followed by Fourier transformation. The use of a Bloch decay experiment results in the unavoidable truncation of the beginning of the FID, resulting in spinning sidebands which are out of phase; however, this does not interfere with the position or appearance of the isotropic peaks. 23Na chemical shifts were calibrated using solid NaCl as an external secondary reference (7.21 ppm relative to 1 M NaCl(aq) at 0.0 ppm).Density functional theory (DFT) calculations
To form an atomic scale insight into sodium storage in hard carbon motifs, six different carbon models were prepared: pristine graphitic bilayer (simulating the intercalation of sodium in graphitic stacks), graphitic bilayer with an oxygen defect, pristine graphene surface (adsorption of sodium on the hard carbon basal plane), and three oxygen-containing graphene surfaces (adsorption of sodium on defect sites on the hard carbon basal plane). Oxygen defects were chosen based on data from XPS measurements. Schematics of the computational models are included in the ESI† (Fig. S8). The effect of increasing sodium concentration in the graphitic bilayer model has previously been characterised.40 For these atomic scale simulations, spin-polarised density functional theory (DFT) calculations as implemented in the Vienna Ab initio Simulation Package (VASP, version 5.3.5)41–45 were employed. To model the ion-electron interaction the projector-augmented wave method (PAW) was utilized,46 and the plane wave cut-off (800 eV) and k-space integrals (9 × 9 × 1 and 5 × 5 × 2 Γ-centred Monkhorst–Pack grid, for the surface and bulk models, respectively) were chosen so that the total energy was converged to 1 meV per atom.47 The exchange–correlation energy (electronic convergence criteria of 10−5 eV and ionic convergence criteria of 10−3 eV Å−1) was described by the generalised gradient approximation (GGA) with the Perdew–Burke–Ernzerhof (PBE)48,49 functional. Dispersion corrections (DFT-D3 method with Becke–Johnson damping) were included in all calculations to account for the polarisability of the graphitic structures and the metals.50–54 To model sodium intercalation in graphitic layers, a 4 × 4 × 2 supercell (64 atoms) was used, and for the sodium adsorption at a basal plane, or surface, a graphene monolayer containing 72 atoms and a vacuum gap between monolayers of 15 Å was employed. These models have previously been used to study sodium adsorption and migration at defect sites,55 and to study sodium intercalation and migration as a function of interlayer distance.40,56 The sodium binding energy, Eb, was calculated according to eqn (1):57 | (1) |
Results & discussion
Synthesis and structural characterisation of glucose-derived hard carbons
A series of hard carbons was prepared by hydrothermal carbonisation (HTC)58 of glucose (denoted GHTC), followed by pyrolysis at different temperatures (1000 °C, 1300 °C, 1500 °C, 1700 °C, 1900 °C) to remove heteroatom defects, introduce conductivity, and tune porosity, yielding the five samples G1000, G1300, G1500, G1700 and G1900. The resulting carbons retained their spherical morphology after high temperature carbonisation (Fig. 1a and b) whilst the pyrolysis temperature had little effect on particle size with all samples showing agglomerated carbon spheres in the range 200 nm–5 μm (Fig. S1, ESI†). The variation in electrochemical behaviour can therefore be fully attributed to the materials’ structural and compositional differences.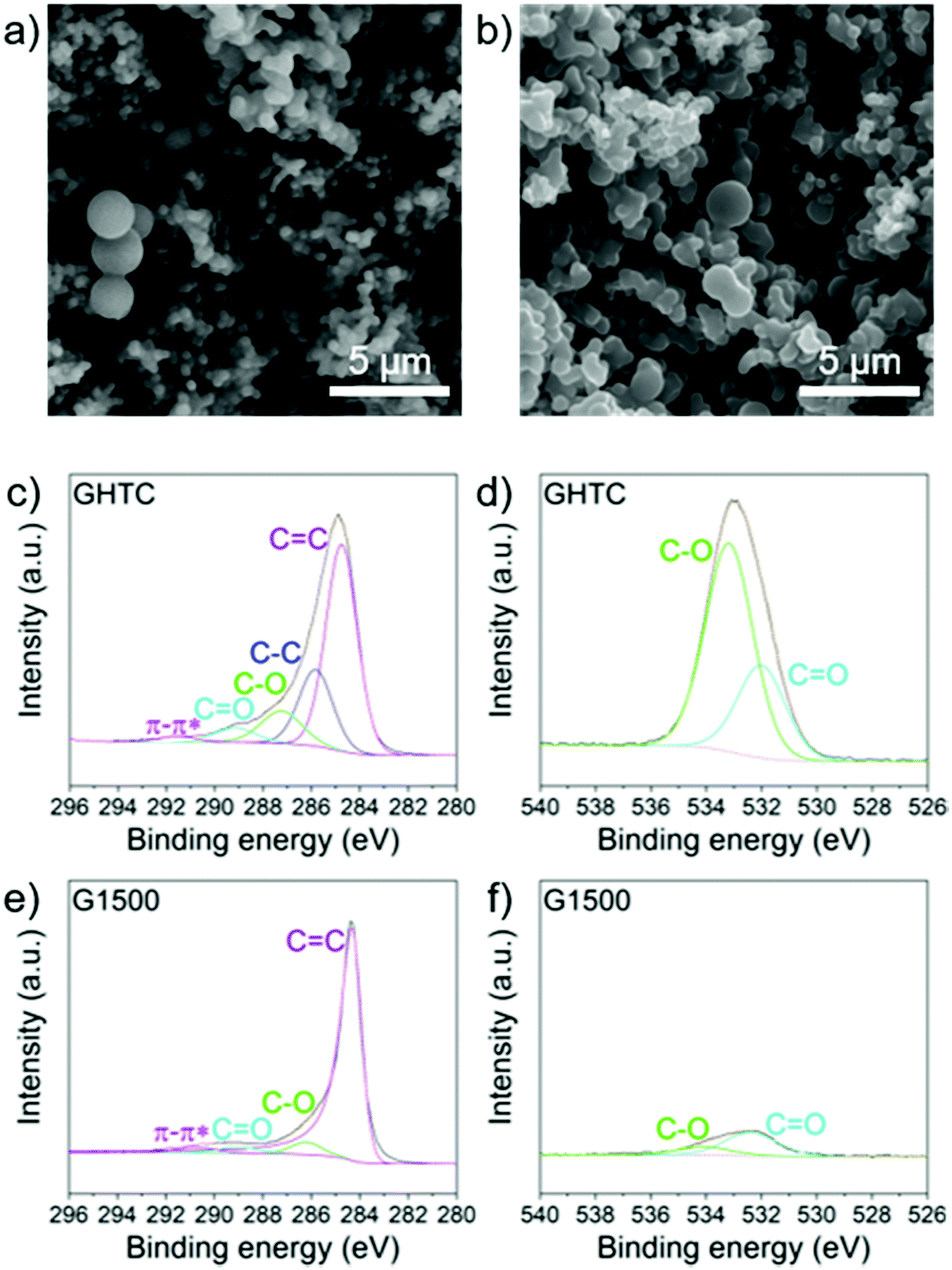 | ||
| Fig. 1 SEM images of (a) GHTC and (b) G1500; scale bars 5 μm; core level (c) C1s and (d) O1s spectra for GHTC; core level (e) C1s and (f) O1s spectra for G1500. | ||
Subsequent high temperature heat treatment successfully removed polar surface groups and heteroatom defects, as confirmed by X-ray photoelectron spectroscopy (XPS) (Fig. 1c–f and Fig. S2, ESI†). In the high resolution O1s spectrum of GHTC, peaks at 533.2 eV and 532.0 eV can be assigned to C–O and C![[double bond, length as m-dash]](https://www.rsc.org/images/entities/char_e001.gif) O bonds respectively (Fig. 1d), corresponding to deconvoluted peaks at 287.3 eV and 289.2 eV in the C1s core-level spectrum (Fig. 1c).59 After pyrolysis, these C–O and CO peaks are significantly weaker indicating a substantial reduction in oxygen functionalities (Fig. 1e and f). Analysis of the higher resolution data indicates a composition of 18.1 at% O and 81.9 at% C after HTC; this ratio is significantly decreased after high temperature carbonisation, with a decreasing amount of O with increasing temperature (5.9–1.3 at%, Table 1).
O bonds respectively (Fig. 1d), corresponding to deconvoluted peaks at 287.3 eV and 289.2 eV in the C1s core-level spectrum (Fig. 1c).59 After pyrolysis, these C–O and CO peaks are significantly weaker indicating a substantial reduction in oxygen functionalities (Fig. 1e and f). Analysis of the higher resolution data indicates a composition of 18.1 at% O and 81.9 at% C after HTC; this ratio is significantly decreased after high temperature carbonisation, with a decreasing amount of O with increasing temperature (5.9–1.3 at%, Table 1).
| Sample | C at% | O at% | C/O | L a (nm)37 | S BET (N2)a (m2 g−1) | S DR (CO2)b (m2 g−1) |
|---|---|---|---|---|---|---|
| a Calculated using the Brunauer–Emmett–Teller (BET) method. b Calculated using the Dubinin–Radushkevich method. | ||||||
| GHTC | 81.9 | 18.1 | 4.5 | — | — | — |
| G1000 | 94.1 | 5.9 | 15.9 | 0.8 | 382 | 786 |
| G1300 | 96.0 | 4.0 | 24.3 | 1.0 | 10 | 128 |
| G1500 | 96.7 | 3.3 | 29.0 | 1.0 | 11 | 74 |
| G1700 | 97.7 | 2.3 | 43.9 | 1.2 | 7 | 15 |
| G1900 | 98.7 | 1.3 | 74.9 | 1.2 | 7 | 18 |
The microstructure of these materials was tuned by varying the pyrolysis temperature between 1000 and 1900 °C. TEM images reveal structures typical of hard carbons composed of mostly disordered domains with some regions of graphitic stacking (Fig. 2a–e). At 1000 °C, amorphous domains dominate, whereas in the samples treated at 1700 and 1900 °C, larger areas of graphitic stacking become apparent, since greater order is introduced with increasing carbonisation temperature. These results are consistent with the rearrangement of disordered crosslinked carbon regions into a coherent sp2 network, alongside the loss of oxygen functionalities. Further evidence for the evolution of structural ordering with temperature was obtained by Raman spectroscopy (Fig. 2f). Hard carbons generally exhibit broad signals around 1350 and 1580 cm-1 (D- and G-band, respectively), related to in-plane sp2 C-bond breathing and stretching modes, and often no 2D signal at ∼2700 cm−1, which provides information regarding graphitic layer stacking and coherence.37,60 The Raman spectrum of G1000 is characteristic of hard carbon, with very broad D and G bands and an extremely weak 2D signal; with increasing pyrolysis temperature, the peaks narrow and sharpen, and the intensity ratio ID/IG increases (Fig. 2f). This ID/IG trend is consistent with the loss of residual oxygen functionalities and increasing in-plane ordering (La = 0.8 nm in G1000 to La = 1.2 nm in G1900, Table 1),61 and the sharpening of signals implies conversion of rings with order other than six into aromatic rings.60 Furthermore, a 2D signal appears in the samples pyrolysed at 1700 °C and above, implying that some graphitic layer coherence is developing, consistent with the observations made by TEM.
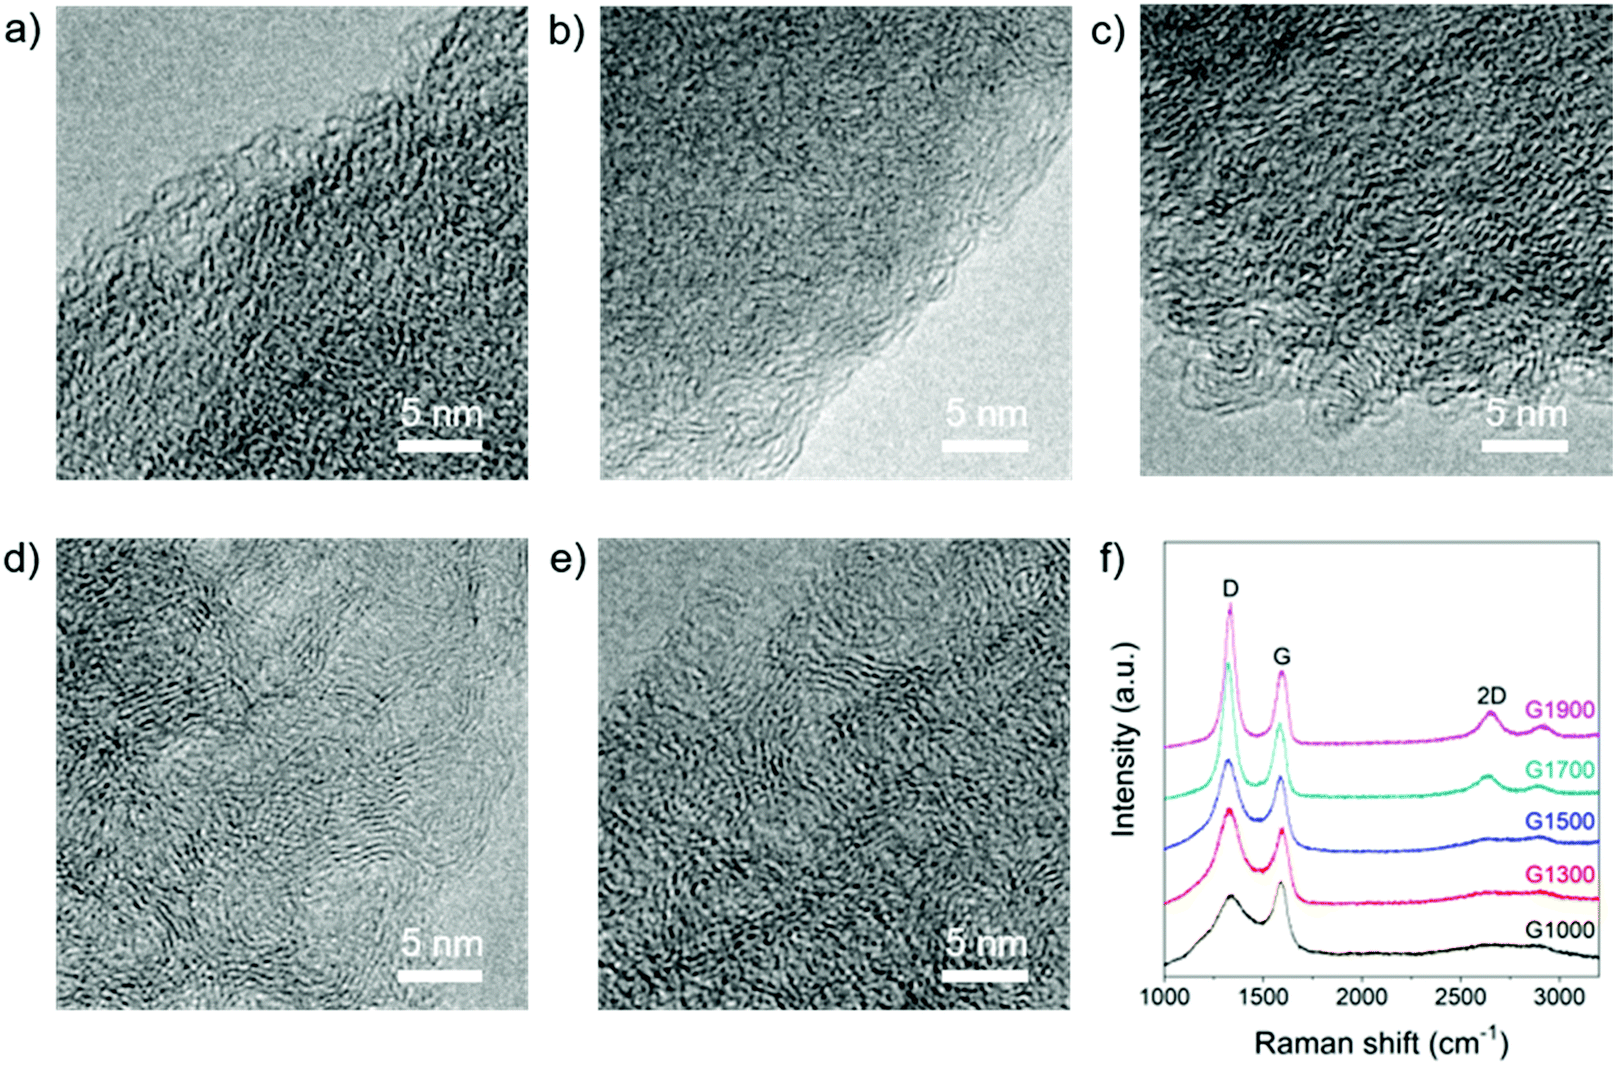 | ||
| Fig. 2 TEM images of (a) G1000, (b) G1300, (c) G1500, (d) G1700, and (e) G1900; scale bars 5 nm; (f) Raman spectra of G1000, G1300, G1500, G1700 and G1900, λexc = 633 nm. | ||
The development of structural ordering is also observed in the neutron total scattering (Fig. 3a) and SAXS/WAXS (Fig. S3, ESI†) patterns, where both the interlayer distance (d002) and the in-plane distance (d100) approach the values for graphite with increasing temperature (Fig. 5b and Fig. S4, ESI†). Furthermore, an increase in the stack thickness and in-plane crystallite size (Fig. 3e and f) was calculated, with stacks of 2–3 graphene layers with 1.5–2 nm wide basal planes for the lower temperature G1000–G1500 samples, and stacks of up to 10–15 graphene layers with 4 nm wide basal planes for the G1900 sample. These results are consistent with the qualitative observations made by TEM and the trend in La (Table 1) calculated from Raman data, although the results from Raman may be considered an underestimate due to the dominant effects of small crystallites.60 In the pair distribution functions (PDF) (Fig. 3b) and difference PDFs (Fig. 3c), the signal at ∼1.4 Å (d1, Fig. S4a, ESI†) indicates that the carbon material after HTC contains mostly sp2-hybridised carbon, but with a substantial amount of sp3-hybridised carbon, observed by the shoulder on the peak, around 1.5 Å. These sp3 carbons disappear after heating to 1000 °C, indicated by the negative peak in the difference PDF at ∼1.6 Å (Fig. 3c), consistent with XPS results (Fig. 1c and e). The appearance of the signal at 2.8 Å (d3, Fig. S4a, ESI†), characteristic of the C1–C4 distance in a benzene ring, confirms the growth of aromatic domains within the material. The largest change in PDF is observed between GHTC and G1000, indicating that the initial graphitisation takes place at low temperature as expected (Fig. 3c). The next significant structural change occurs from G1500 to G1700 where the development of longer-range order is evident from the increased signal at higher distances (Fig. 3c). This observation also corresponds to the trends in graphitic ordering and domain size obtained from analysis of the 002 and 100 peaks (Fig. 3e, f and Fig. S4, ESI†), where the largest structural difference occurs between these two pyrolysis temperatures; similarly, in the Raman spectra, the 2D band only appears above 1700 °C. These results suggest that below 1500 °C, nucleation of graphitic regions is the predominant reaction occurring within the material, without large changes to the domain size. Above 1500 °C, growth of the graphitic domains and ordering of the stacked planes are the dominant processes, although in some regions rearrangement is constrained, reflected in the double peak model required to fit the 002 peak in the high temperature data (Fig. S3, ESI†).
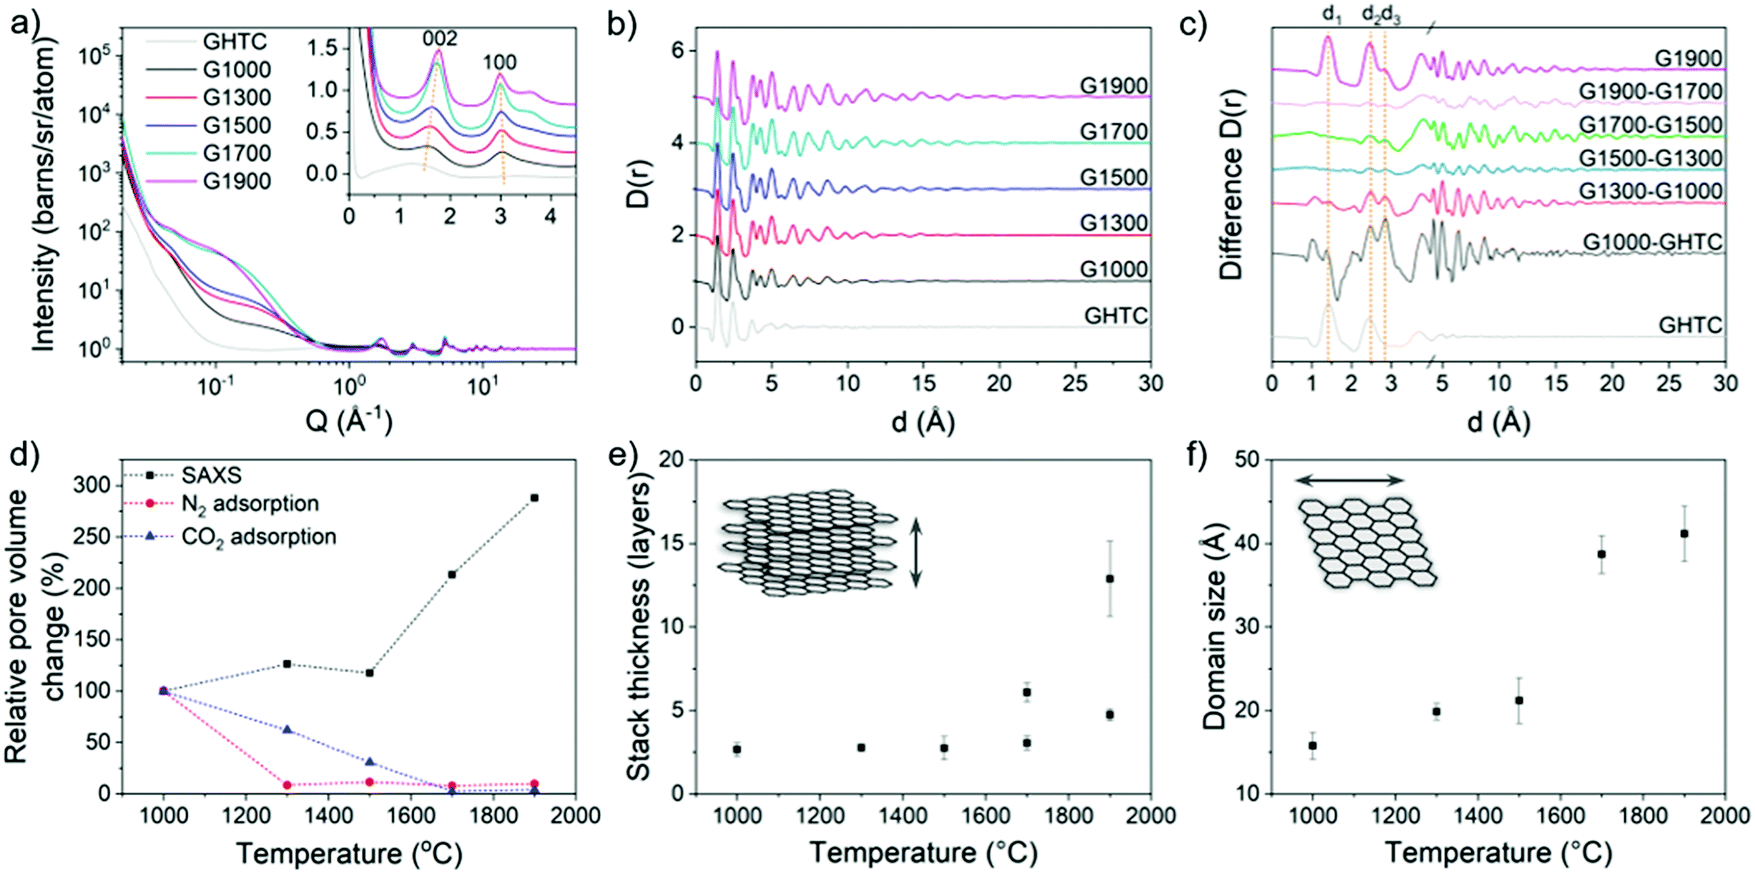 | ||
| Fig. 3 (a) Structure factor (S(Q)), and (b) PDF (D(r)) of the carbons before and after high temperature treatment. The SANS region was removed before Fourier transform to the PDF to remove pore–pore correlations; (c) difference PDF between each temperature with the PDF of GHTC and G1900 included for reference; (d) relative change in the pore volume probed by N2 and CO2 gas adsorption and the intensity of the Guinier plateau in the small angle region weighted by pore volume; (e) stack thickness, and (f) domain size of the graphitic regions derived from the width of the 002 and 100 peaks. Additional SAXS data and example model fits are shown in Fig. S3 (ESI†). | ||
The pore diameters were also calculated from the Guinier-Porod region22,62 in the small angle neutron scattering (SANS) (Fig. 3a) and SAXS (Fig. S3 and S4, ESI†) data and were found to be very similar in size to the corresponding basal planes; dimensions of 1–2 nm for G1000–G1500 and up to a maximum size of 5 nm for G1900 (Fig. 4b) were observed. These results suggest that even though isolated graphitic regions are able to grow laterally with increasing carbonisation temperature, significant crosslinking between domains prevents full graphitisation, resulting in the formation of voids between graphene basal planes, with these graphene layers making up the pore walls. As such, the pore size is dependent on the lateral size of the basal plane (Fig. 4c). The lack of any structure factor peaks suggests that the pores are relatively dilute, as there would otherwise be pore-pore correlation peaks in the SAXS/SANS region. The relative pore volumes, obtained using the Guinier–Porod model22 (eqn (S1)–(S3), ESI†), for the G1000–G1500 materials remain similar, suggesting only limited pore creation within this temperature range (Fig. 3d). Above 1500 °C, a significant change in pore volume was observed, increasing by a factor of three between G1500 and G1900. In contrast, the total pore volume determined from N2 adsorption significantly decreased, with a 90% loss between G1000 and G1300 (Fig. 3d and Fig. S5, Table S1, ESI†). Correspondingly, the glucose-derived carbon pyrolysed at 1000 °C has the highest specific surface area of 382 m2 g−1; at temperatures above 1000 °C, the surface area decreases dramatically to ∼10 m2 g−1 (Table 1). The pore volume and surface area values calculated from the CO2 adsorption isotherms are generally higher than those from N2 measurements, since CO2 can probe smaller pores, and decrease more gradually with elevated temperatures (Fig. 3d and Fig. S5 ESI,†Table 1), whilst the pore size distributions from both measurements indicate that the materials are mostly micro- and mesoporous (Fig. S5, ESI†). The discrepancy with the trends observed from SAXS/SANS analysis suggests that although porosity is developing as the carbons are heated, above 1000 °C the larger pores and subsequently the micropores close off during pyrolysis, becoming inaccessible to gas molecules, but remain observable by X-ray and neutron scattering.
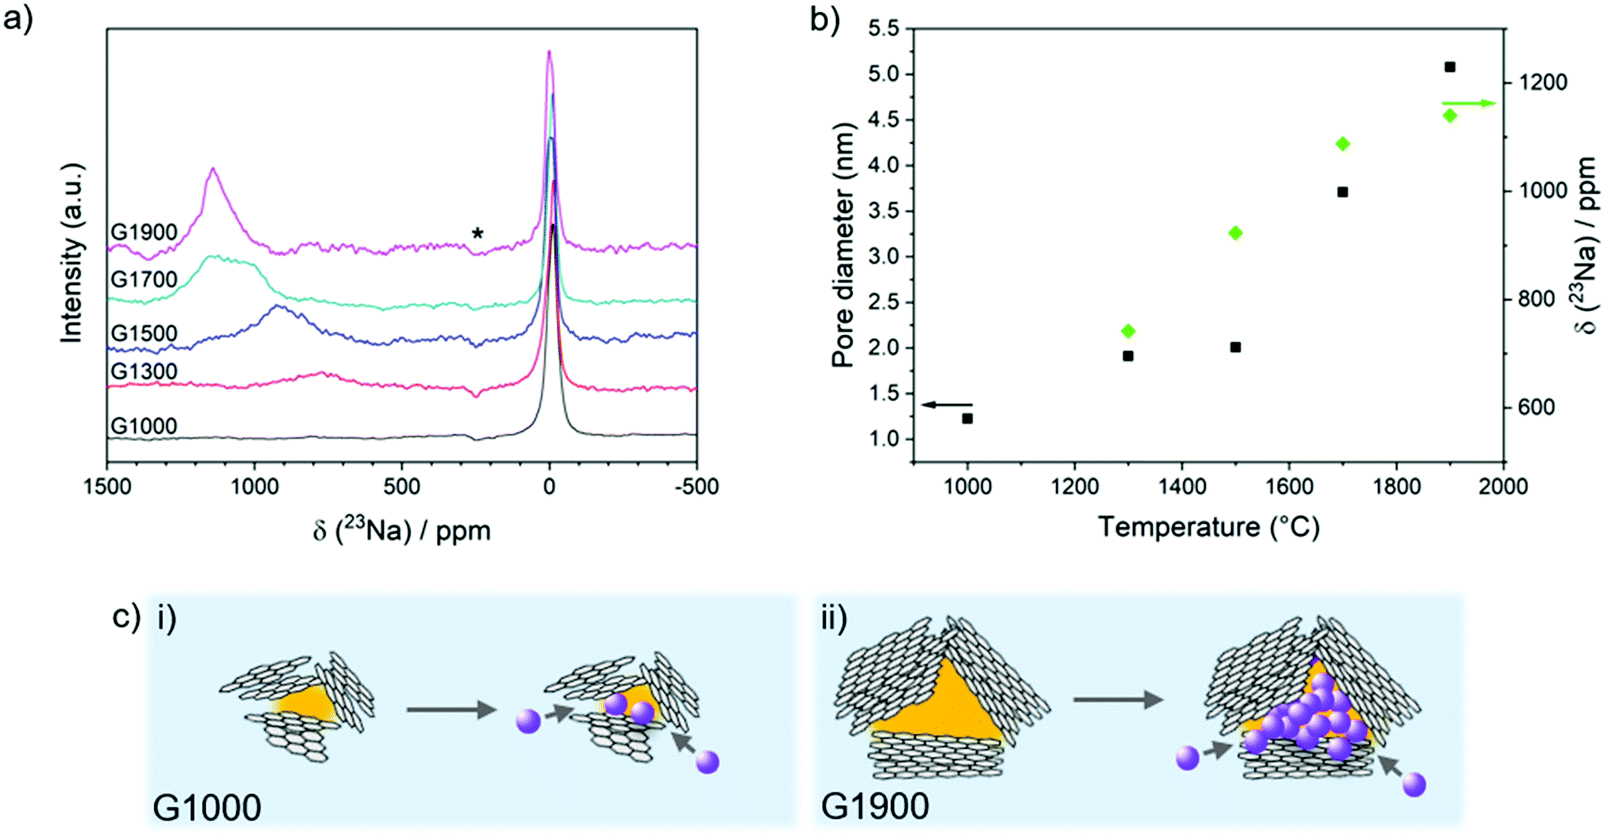 | ||
| Fig. 4 (a) Ex situ23Na MAS NMR of G1000–G1900 after discharging to 5 mV, spinning sidebands (which are out of phase, see Experimental section for discussion) are indicated by an asterisk; (b) relationship between the pore diameter, quasi-metallic Na peak shift and sample pyrolysis temperature; (c) schematic illustration of pore size dependence on basal plane lateral size, in (i) G1000, where no metallic sodium is observed in the small pores, and (ii) G1900, where significant metal clustering is possible in larger pores. | ||
Overall, the characterisation indicates that although the particle morphology is maintained after carbonisation, the structures of the glucose-derived carbons are highly tuneable by altering the pyrolysis temperature, with greater ordering arising from fewer defects, increasing aromaticity, decreasing interlayer spacing, and larger crystallite size. Pore size and surface area are also highly dependent on the temperature of carbonisation with the development of larger, closed pores above 1500 °C.
Electrochemical performance in Na-ion half cells
In order to investigate the structural influences on the performance and storage mechanism in NIBs, electrochemical testing of the materials was carried out in half cells using sodium metal as the counter electrode, in the voltage window 0.005–2.5 V. During galvanostatic cycling at 30 mA g−1, the carbons exhibit a range of reversible capacities (96–293 mA h g−1) and first cycle Coulombic efficiencies (FCCE) (39–96%) (Fig. 5a and Table S1, ESI†), with the highest performing G1500 comparing reasonably with other previously reported carbonaceous materials.2 The discharge curves of the samples show varying profiles, from which insight into the sodium storage mechanism may be gained; G1300 and G1500 derive their capacity from both the slope and plateau regions (Fig. 5b and Table S1, ESI†), whereas G1700 and G1900 both show mainly plateau capacity. Conversely, the capacity of G1000 is exclusively in the sloping region, and is highly irreversible in the first cycle, consistent with having the highest surface area available for SEI formation, and many defect sites and oxygen functionalities where sodium may remain trapped. A corresponding reduction peak is observed in the cyclic voltammogram between 0.7 and 0 V in the first cycle (Fig. S6, ESI†), and similar smaller irreversible peaks appear in the other samples, reflecting the irreversible capacity processes occurring in the first cycle.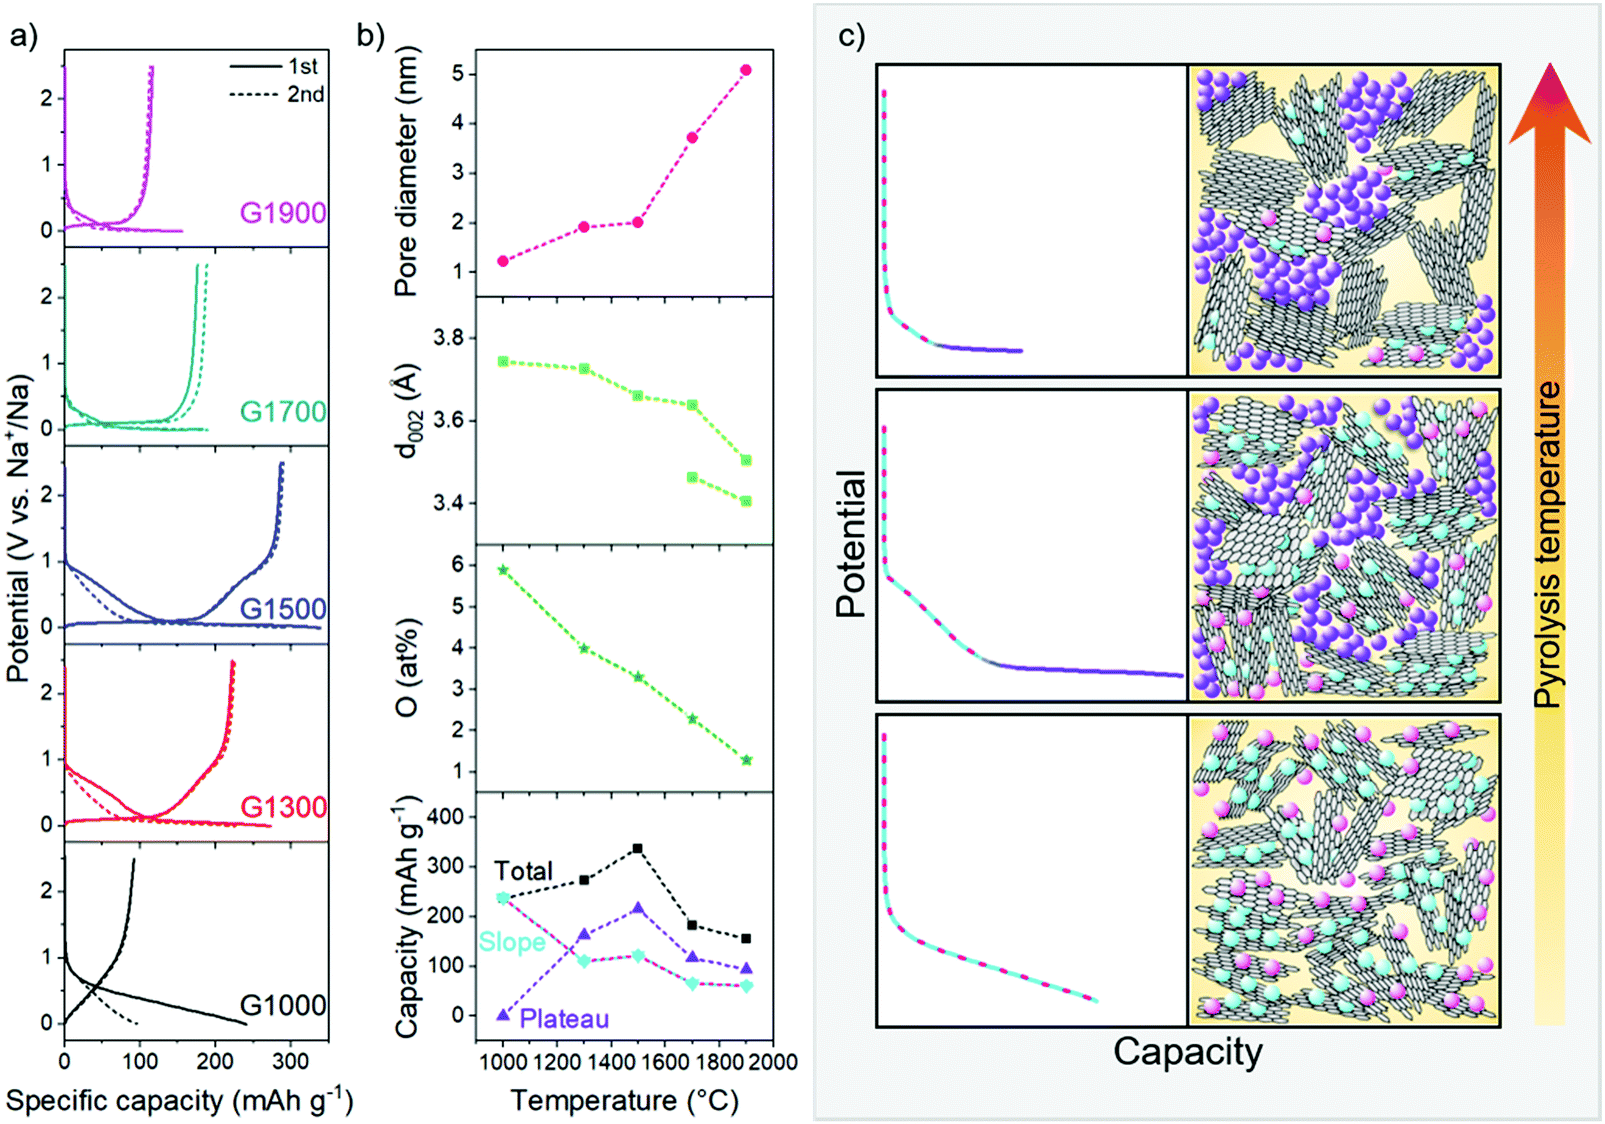 | ||
| Fig. 5 (a) Galvanostatic charge/discharge profiles for G1000–G1900 in the first and second cycles; (b) summary of the structural evolution of the hard carbons and capacity contributions with increasing pyrolysis temperature (lines are a guide for the eye only); (c) schematic illustration of the proposed sodium storage mechanism; stack thickness and plane size are not to scale, and defects and curvature are not explicitly shown. | ||
Ex situ 23Na NMR of the sodiated carbons
Analysis of the ex situ23Na magic-angle spinning (MAS) ssNMR spectra of the fully sodiated materials provides insight into how the sodium storage environments vary according to the carbon structure (Fig. 4a). A sharp peak is observed at around 0 ppm for all of the carbons, which is attributed to diamagnetic sodium in the residual electrolyte salt and SEI layer.24 In the spectrum of G1300, a broad peak is observed centred at about 750 ppm (Fig. 4b). This shift falls well outside the range of diamagnetic sodium compounds, indicating that this species is exhibiting a Knight shift caused by the presence of conduction electrons (metallic sodium exhibits a peak at 1135 ppm).63 In the lowest temperature-treated material, this quasi-metallic peak is non-existent, implying that sodium stored in the sloping region is mainly ionic in nature, consistent with sodium adsorbed at defects, interlayers or pore surfaces.24 With higher heat treatment, the quasi-metallic peak grows in intensity and shifts to higher frequency, closer to that of sodium metal (Fig. 4b). In G1900, the presence of metallic sodium is clear from the strong peak observed at 1135 ppm. Interestingly, in these samples which were discharged to 5 mV, metallic sodium was observed before reaching 0 V, contrary to previous reports.25,28,30,32 One study attributed this difference to the presence of FEC in the electrolyte,33 but the suppression of metallic sodium may also have been due to smaller pores inhibiting cluster growth, as well as resistances inherent to the particular cell setup, leading to overpotentials which may have caused the cell to reach its cut off voltage before the pores were fully filled. The growing metallic character of the sodium corresponds to the increasing pore size with temperature and is consistent with the growth of sodium clusters within the pores (Fig. 4b and c).33 Here, beyond the first adsorbed monolayer, sodium ions must necessarily be reduced to minimise charge repulsion which would otherwise prevent confinement of many sodium ions within one space. Therefore, the larger the pore and subsequently the cluster, the greater the metallic character of the sodium environment, corresponding to the progressive shift of the sodium peak to higher frequencies with increased temperatures.Sodium storage mechanisms in hard carbons
Combining the materials analysis and electrochemical characterisation allows us to correlate the hard carbon structure with the different sodium storage processes occurring during cell discharge. With increasing carbonisation temperature, the pore size increases, whilst the O/C ratio, degree of defects and graphitic interlayer spacing all decrease (Fig. 5b); concurrently, in their voltage profiles, the capacity contribution from the sloping region generally decreases, whilst the plateau region increases, before dropping off at higher temperatures. In our revised mechanistic model, we propose that during the initial stages of sodiation, between 2.5 and 0.1 V, sodium storage occurs simultaneously at defects, within interlayer galleries and at pore surfaces. Once these sites are filled, residual pore filling takes place, below 0.1 V, until full sodiation is achieved.In the sloping region, the changing voltage profile is a result of a combination of energetically different processes, as well as the continuous structural distortion arising from the interlayer expansion which accompanies the insertion of sodium ions.40,64 While sodium diffusion within curved pores is rapid compared to inside graphitic interlayer galleries56 and across heteroatom defects,55 the ions are less strongly bound at these pore surfaces.56 Therefore, interlayer intercalation and filling of defect sites occur preferentially to pore filling. DFT calculations of sodium binding in bilayer and monolayer graphitic models (Fig. S9, ESI†) indicate that different defect types influence the energetics of sodium storage differently, both at the defect site and at sites adjoining the defect. These simulations show that oxygen defects in the graphitic bilayer and on the surface lead to stronger sodium adsorption energies, especially at low sodium loading, similar to previous studies where carbon vacancies in bilayer graphene have also shown favourable sodium storage.35,65,66 Furthermore, the effect of oxygen-containing defects in the carbon structures is not localised and can also improve the sodium storage at sites away from the defects, although at higher sodium concentrations, or higher specific capacities, the effect is reduced (Fig. S9, ESI†). Similarly, sodium intercalation in the graphitic bilayer model is mainly affected by the presence of the 2OC bilayer defect (Fig. S8, ESI†) at xNa < 3. At higher Na concentrations, the added Na start to fill the non-defective sites, so the calculated binding energies approach those of the non-defective graphitic bilayer (Fig. S9, ESI†). Comparing all the simulated systems (Fig. S9, ESI†), at low xNa (corresponding to low specific capacity), sodium storage at surface defects dominates, whereas as soon as the defect sites become saturated, sodium intercalation in expanded graphitic bilayers becomes energetically favourable too. Some studies have previously attributed the sloping region capacity to defect adsorption only;25,27,30 with this series of materials, considering the scenario in which each sodium binds to one oxygen-containing defect, the maximum theoretical capacity derived from defect adsorption (Table S2, ESI†) can only account for 48–79% of the total sloping capacity. Therefore, in combination with these and previous simulated results,40,55,56 both sodium adsorption and intercalation in defective and turbostratic carbon regions contribute to the experimentally observed sloping voltage profiles. Furthermore, the strong binding energies of sodium at certain defect sites at low loading (−3.05 eV for one Na on the OC defect, and −2.08 eV on the 3OC defect) could contribute to the irreversible capacity observed in the first cycle (Fig. 5a and Table S2, ESI†), with sodium remaining trapped at these sites. In the second cycle and beyond, with the addition of further Na, these ‘occupied’ heteroatom defects would still influence the local sodium storage, although with weaker effect (Fig. S9, ESI†), and the binding in subsequent cycles might therefore be expected to be reversible (Fig. S7, ESI†). These observations are reflected in the shape of the sloping capacity profile (Fig. 5a), where a shorter, lower voltage slope during the second sodiation supports the assertion that lower energy binding occurs after the first cycle. G1000, which has the highest concentration of oxygen-containing defects (5.9 at%) and the widest interlayer spacing (3.9 Å), exhibits the largest sloping capacity and the lowest Coulombic efficiency; the sloping capacity decreases with higher carbonisation temperatures, corresponding to the decrease in interlayer spacing and number of defects (Fig. 5b), leading to fewer available sites for sodium storage. In addition, the onset voltage of the sloping region for the two high temperature materials is also lower (∼0.5 V vs. ∼1 V in G1000–G1500), indicative of the absence of defects as higher energy sodium binding sites (Fig. 5a), consistent with the DFT binding energies (Fig. S9, ESI†).
Once all the available interlayer and defect sites are occupied, we hypothesise that residual filling of the pores takes place until the electrode is fully sodiated. Insertion of sodium into pores results in negligible structural distortion so the binding site energy remains almost constant; in addition, the sodium binding energy is weak,56 and pore filling therefore corresponds to the low voltage plateau below 0.1 V. The NMR results support this mechanistic assertion, where the quasi-metallic environment was only observed in the carbons that exhibited plateau capacity (Fig. 4). However, the plateau capacity does not monotonically increase with pore size but reaches a maximum at 1500 °C (Fig. 5b). While the pore size continues to increase, the decrease in expanded graphitic stacks results in fewer diffusion pathways reaching the pores, and consequently some pores become inaccessible for sodium storage, corresponding to a smaller plateau capacity. The decrease in diffusion pathways also contributes to the diminishing performance at higher current densities, where G1700 and G1900 exhibit the poorest electrochemical performance across the range of current densities (Fig. S7, ESI†).
To summarise, G1000 has the highest concentration of defects and the widest interlayer spacing available for sodium storage, although the strong binding energies at certain defect sites could result in irreversible storage with sodium remaining trapped at these sites, consistent with the large capacity loss observed after the first cycle (Fig. 5a). While an in depth discussion on the formation or composition of an SEI layer is not within the scope of this work, the high available surface area of G1000 (Table 1) will also contribute to significant irreversible sodium loss due to SEI formation. Pore filling is minimal due to the small diameter of the pores, resulting in a discharge profile entirely composed of sloping capacity (Fig. 5c bottom panel). At intermediate pyrolysis temperatures, the number of oxygen defects decreases, and the interlayer spacing narrows slightly, but storage capacity from pores increases with the larger pore size; a decreasing slope capacity and a greater contribution from the plateau region are therefore observed in G1300 and G1500 (Fig. 5c middle panel). In addition, as the accessible surface area is greatly reduced (Table 1), the degree of SEI formed is suppressed, and consequently the FCCE markedly improves. In G1700 and G1900, the number of defects is very low, and there are even fewer expanded graphitic domains accessible for sodium intercalation as the interlayer spacing narrows; therefore, the capacity in the sloping region decreases significantly. Furthermore, whilst the pore size continues to increase, diffusion pathways are closed off, and consequently some pores become inaccessible for sodium storage, corresponding to a smaller plateau capacity (Fig. 5c top panel).
Overall, the correlation between pore size, quasi-metallic sodium and plateau capacity provides strong evidence that pore filling occurs in the plateau region. Although a similar trend in pore size and sodium metallicity was observed by Morita et al.,33 the voltage profiles of their carbons showed insufficiently distinct characteristics and thus the link to plateau capacity was inconclusive; in addition, while Stratford et al. observed the appearance of quasi-metallic sodium environments in the plateau region,24 the pore structure of the carbon was not well-defined, and association with pore filling was based on the previous hypothesis proposed by Stevens and Dahn.22 Building on these works, our study demonstrates that the quasi-metallic sodium environment correlates directly to increasing pore size and is only observed in materials which exhibit a plateau capacity, providing strong evidence that pore filling is indeed the final sodiation process to occur at low voltages. Our revised model is in good agreement with the original proposed by Stevens and Dahn,22 and several others.15,24,27,28,32 However, we believe that each of these models alone insufficiently describes the processes occurring during the slope region, and that, based on the structural trends in these materials, it is reasonable to hypothesise that the slope capacity may be assigned to simultaneous and continuous processes of defect adsorption, interlayer intercalation, and adsorption on pore surfaces. Furthermore, the plateau capacity derived from pore filling is not independent of the structural characteristics associated with sloping capacity; as the graphitic interlayer spacings decrease, there are fewer diffusion pathways allowing sodium ions to reach the pores, rendering them inaccessible for sodium storage. Therefore, when tailoring the structure of the carbon electrode, one must consider that while particular carbon motifs are responsible for certain storage processes at different voltages, their derived capacities are related. For example, large pores are beneficial for sodium storage, but only if there are enough accessible channels provided by defects and sufficiently wide interlayer spacings to allow sodium diffusion into the pores. Moreover, the degree to which pore surfaces are accessible to electrolyte or sodium ions is crucial in determining not only the sodium storage capability in the low voltage plateau region, but also the extent of irreversible sodium loss in the first cycle: ‘open’ pores with high accessible surface area lead to large SEI formation and low FCCE, whereas fully ‘closed’ pores cannot be reached by sodium ions, greatly reducing overall capacity. The highest performance of the carbon pyrolysed at 1500 °C therefore results from the optimal combination of intermediate pore size with wide interlayer spacings which provide storage for Na+ and diffusion channels for sodium ions, but not electrolyte, into pores, as well as defects which serve as additional adsorption sites. We hypothesise that an ‘ideal’ carbon electrode would be composed of large, interconnected pores with expanded layer spacings of ∼3.65 Å to allow diffusion of sodium ions, but not other electrolyte molecules, into the pores. The presence of oxygen defects can also be beneficial for diffusion and storage, although further study is required into which other functional species would be best to promote reversible binding. We have employed a simple pyrolysis step to simultaneously tune pore size, interlayer spacing and defect concentration, but porosity was gained at the expense of interlayer and defect diffusion pathways. Future syntheses would introduce larger porosity in the initial steps, in order to achieve an optimised balance of pore size and diffusion channels with a lower carbonisation temperature, which would also be of environmental benefit. One limitation of increased sodium storage in pores is that the process occurs close to 0 V where sodium plating may occur, especially at higher C rates. However, in a full cell setup, this effect would be mitigated. In this paper, we have included limited discussion on behaviour at high current densities, but for high-performing electrodes we would expect that maintaining open diffusion channels for sodium ions is paramount.
Conclusions
A series of hard carbons was prepared by hydrothermal carbonisation of glucose followed by high temperature treatment and the development of the carbon structure with pyrolysis was extensively characterised. A relationship between defect concentration, interlayer spacing, porosity and electrochemical behaviour was established, where the sloping region capacity is attributed to simultaneous and continuous sodium storage at defects, within interlayers and on pore surfaces, across a range of different binding energies. Subsequently, pore filling occurs during the low voltage plateau region, becoming increasingly metallic with increasing pore size, as demonstrated by ex situ23Na NMR. However, despite the higher porosity, the closing of diffusion pathways at high temperature results in an overall lower capacity, as these pores become inaccessible to sodium. At the same time, the high surface area of the G1000 carbon resulted in a large irreversible capacity, and the material carbonised at 1500 °C exhibited the highest capacity, confirming that a balance between these different structural factors is crucial to improved electrochemical performance. These findings provide insight into the future design and development of hard carbons for NIBs, to achieve materials with optimised interlayer spacings, open diffusion channels, defects, and porosity.Author contributions
H. Au designed the study and drafted the article. H. Au and H. Al. synthesised the hard carbon samples and conducted the electrochemical testing for the NIB cells. H. Au obtained the SEM, XPS, TEM and Raman data. H. Au and H. Al. conducted the gas adsorption experiments. A. C. S. J. conducted the SAXS/WAXS measurements and analysis. A. C. S. J. and T. F. H. performed the SANS/WANS measurements and analysis. E. O. performed the DFT simulations and analysis. C. A. O. and T. S. performed the NMR measurements. M. C. R. performed electrical resistivity measurements. H. Al., A. C. S. J., E. O., C. A. O. revised and edited the manuscript. C. P. G., Q. C., A. J. D. and M.-M. T. provided supervision and funding, and revised and edited the final manuscript.Conflicts of interest
The authors declare no competing interests.Acknowledgements
The authors would like to thank the Engineering and Physical Sciences Research Council for funding (EP/R021554/1, EP/S018204/2). E. O. would like to acknowledge the use of Athena at HPC Midlands+, which was funded by the EPSRC under grant EP/P020232/1, and the Eureka HPC cluster at the University of Surrey. We are grateful to the UK Materials and Molecular Modelling Hub for computational resources, which is partially funded by EPSRC (EP/P020194/1). We would also like to thank Iuliia Elizarova for help with pyrolysis of the G1700 and G1900 materials.References
- J. M. Tarascon and M. Armand, Nature, 2001, 414, 359 CrossRef CAS PubMed.
- D. Saurel, B. Orayech, B. Xiao, D. Carriazo, X. Li and T. Rojo, Adv. Energy Mater., 2018, 0, 1703268 CrossRef.
- Y. Li, Y. Lu, C. Zhao, Y.-S. Hu, M.-M. Titirici, H. Li, X. Huang and L. Chen, Energy Storage Mater., 2017, 7, 130–151 CrossRef.
- W. Luo, F. Shen, C. Bommier, H. Zhu, X. Ji and L. Hu, Acc. Chem. Res., 2016, 49, 231–240 CrossRef CAS PubMed.
- A. Metrot, D. Guerard, D. Billaud and A. Herold, Synth. Met., 1980, 1, 363–369 CrossRef CAS.
- D. A. Stevens and J. R. Dahn, J. Electrochem. Soc., 2000, 147, 1271–1273 CrossRef CAS.
- E. Irisarri, A. Ponrouch and M. R. Palacin, J. Electrochem. Soc., 2015, 162, A2476–A2482 CrossRef CAS.
- C. Bommier, D. Mitlin and X. Ji, Prog. Mater. Sci., 2018, 97, 170–203 CrossRef CAS.
- H.-L. Wang, Z.-Q. Shi, J. Jin, C.-B. Chong and C.-Y. Wang, J. Electroanal. Chem., 2015, 755, 87–91 CrossRef CAS.
- J. Ding, H. Wang, Z. Li, A. Kohandehghan, K. Cui, Z. Xu, B. Zahiri, X. Tan, E. M. Lotfabad, B. C. Olsen and D. Mitlin, ACS Nano, 2013, 7, 11004–11015 CrossRef CAS PubMed.
- J. Li, H. Qi, Q. Wang, Z. Xu, Y. Liu, Q. Li, X. Kong and J. Huang, Electrochim. Acta, 2018, 271, 92–102 CrossRef CAS.
- Y. Li, Y. S. Hu, M. M. Titirici, L. Chen and X. Huang, Adv. Energy Mater., 2016, 6, 1600659 CrossRef.
- Y. Li, S. Xu, X. Wu, J. Yu, Y. Wang, Y.-S. Hu, H. Li, L. Chen and X. Huang, J. Mater. Chem. A, 2015, 3, 71–77 RSC.
- R. Väli, A. Jänes, T. Thomberg and E. Lust, J. Electrochem. Soc., 2016, 163, A1619–A1626 CrossRef.
- F. Xie, Z. Xu, A. C. S. Jensen, H. Au, Y. Lu, V. Araullo-Peters, A. J. Drew, Y.-S. Hu and M.-M. Titirici, Adv. Funct. Mater., 2019, 29, 1901072 CrossRef.
- Z. Xu, F. Xie, J. Wang, H. Au, M. Tebyetekerwa, Z. Guo, S. Yang, Y.-S. Hu and M.-M. Titirici, Adv. Funct. Mater., 2019, 0, 1903895 CrossRef.
- P. Zheng, T. Liu, X. Yuan, L. Zhang, Y. Liu, J. Huang and S. Guo, Sci. Rep., 2016, 6, 26246 CrossRef CAS.
- T. Chen, L. Pan, T. Lu, C. Fu, D. H. C. Chua and Z. Sun, J. Mater. Chem. A, 2014, 2, 1263–1267 RSC.
- V. G. Pol, E. Lee, D. Zhou, F. Dogan, J. M. Calderon-Moreno and C. S. Johnson, Electrochim. Acta, 2014, 127, 61–67 CrossRef CAS.
- R. E. Franklin and J. T. Randall, Proc. R. Soc. London, Ser. A, 1951, 209, 196–218 CAS.
- P. J. F. Harris, J. Mater. Sci., 2013, 48, 565–577 CrossRef CAS.
- D. A. Stevens and J. R. Dahn, J. Electrochem. Soc., 2000, 147, 4428–4431 CrossRef CAS.
- D. A. Stevens and J. R. Dahn, J. Electrochem. Soc., 2001, 148, A803–A811 CrossRef CAS.
- J. M. Stratford, P. K. Allan, O. Pecher, P. A. Chater and C. P. Grey, Chem. Commun., 2016, 52, 12430–12433 RSC.
- C. Bommier, T. W. Surta, M. Dolgos and X. Ji, Nano Lett., 2015, 15, 5888–5892 CrossRef CAS PubMed.
- S. Alvin, D. Yoon, C. Chandra, H. S. Cahyadi, J.-H. Park, W. Chang, K. Y. Chung and J. Kim, Carbon, 2019, 145, 67–81 CrossRef CAS.
- P. Bai, Y. He, X. Zou, X. Zhao, P. Xiong and Y. Xu, Adv. Energy Mater., 2018, 0, 1703217 CrossRef.
- B. Zhang, C. M. Ghimbeu, C. Laberty, C. Vix-Guterl and J.-M. Tarascon, Adv. Energy Mater., 2016, 6, 1501588 CrossRef.
- N. Sun, Z. Guan, Y. Liu, Y. Cao, Q. Zhu, H. Liu, Z. Wang, P. Zhang and B. Xu, Adv. Energy Mater., 2019, 9, 1901351 CrossRef.
- S. Qiu, L. Xiao, M. L. Sushko, K. S. Han, Y. Shao, M. Yan, X. Liang, L. Mai, J. Feng, Y. Cao, X. Ai, H. Yang and J. Liu, Adv. Energy Mater., 2017, 7, 1700403 CrossRef.
- C. Matei Ghimbeu, J. Górka, V. Simone, L. Simonin, S. Martinet and C. Vix-Guterl, Nano Energy, 2018, 44, 327–335 CrossRef CAS.
- Y. Morikawa, S. i. Nishimura, R. i. Hashimoto, M. Ohnuma and A. Yamada, Adv. Energy Mater., 2020, 10, 1903176, DOI:10.1002/aenm.201903176.
- R. Morita, K. Gotoh, K. Kubota, S. Komaba, K. Hashi, T. Shimizu and H. Ishida, Carbon, 2019, 145, 712–715 CrossRef CAS.
- J. K. Mathiesen, R. Väli, M. Härmas, E. Lust, J. Fold von Bülow, K. M. Ø. Jensen and P. Norby, J. Mater. Chem. A, 2019, 7, 11709–11717 RSC.
- M. Anji Reddy, M. Helen, A. Groß, M. Fichtner and H. Euchner, ACS Energy Lett., 2018, 3, 2851–2857 CrossRef CAS.
- J. M. Bray, C. L. Doswell, G. E. Pavlovskaya, L. Chen, B. Kishore, H. Au, H. Alptekin, E. Kendrick, M.-M. Titirici, T. Meersmann and M. M. Britton, Nat. Commun., 2020, 11, 2083 CrossRef CAS PubMed.
- A. C. Ferrari and D. M. Basko, Nat. Nanotechnol., 2013, 8, 235–246 CrossRef CAS PubMed.
- D. T. Bowron, A. K. Soper, K. Jones, S. Ansell, S. Birch, J. Norris, L. Perrott, D. Riedel, N. J. Rhodes, S. R. Wakefield, A. Botti, M.-A. Ricci, F. Grazzi and M. Zoppi, Rev. Sci. Instrum., 2010, 81, 033905 CrossRef CAS PubMed.
- A. Soper, GudrunN and GudrunX. Programs for correcting raw neutron and X-ray total scattering data to differential cross section (http://purl.org/net/epubs/work/56240).
- A. C. S. Jensen, E. Olsson, H. Au, H. Alptekin, Z. Q. Yang, S. Cottrell, K. Yokoyama, Q. Cai, M. M. Titirici and A. J. Drew, J. Mater. Chem. A, 2020, 8, 743–749 RSC.
- G. Kresse and J. Furthmüller, Comput. Mater. Sci., 1996, 6, 15–50 CrossRef CAS.
- G. Kresse and J. Furthmüller, Phys. Rev. B: Condens. Matter Mater. Phys., 1996, 54, 11169–11186 CrossRef CAS PubMed.
- G. Kresse and J. Hafner, Phys. Rev. B: Condens. Matter Mater. Phys., 1993, 47, 558–561 CrossRef CAS PubMed.
- G. Kresse and J. Hafner, Phys. Rev. B: Condens. Matter Mater. Phys., 1994, 49, 14251–14269 CrossRef CAS PubMed.
- Y. Ma, P. O. Lehtinen, A. S. Foster and R. M. Nieminen, New J. Phys., 2004, 6, 68 CrossRef.
- P. E. Blöchl, Phys. Rev. B: Condens. Matter Mater. Phys., 1994, 50, 17953–17979 CrossRef PubMed.
- H. J. Monkhorst and J. D. Pack, Phys. Rev. B: Condens. Matter Mater. Phys., 1976, 13, 5188–5192 CrossRef.
- J. P. Perdew, K. Burke and M. Ernzerhof, Phys. Rev. Lett., 1996, 77, 3865–3868 CrossRef CAS PubMed.
- J. P. Perdew, K. Burke and M. Ernzerhof, Phys. Rev. Lett., 1997, 78, 1396 CrossRef CAS.
- X. Fan, W. T. Zheng and J.-L. Kuo, ACS Appl. Mater. Interfaces, 2012, 4, 2432–2438 CrossRef CAS PubMed.
- X. Fan, W. T. Zheng, J.-L. Kuo and D. J. Singh, ACS Appl. Mater. Interfaces, 2013, 5, 7793–7797 CrossRef CAS PubMed.
- M. Amft, S. Lebègue, O. Eriksson and N. V. Skorodumova, J. Phys.: Condens. Matter, 2011, 23, 395001 CrossRef PubMed.
- S. Lee, M. Lee, H. Choi, D. S. Yoo and Y.-C. Chung, Int. J. Hydrogen Energy, 2013, 38, 4611–4617 CrossRef CAS.
- S. Grimme, S. Ehrlich and L. Goerigk, J. Comput. Chem., 2011, 32, 1456–1465 CrossRef CAS PubMed.
- E. Olsson, G. Chai, M. Dove and Q. Cai, Nanoscale, 2019, 11, 5274–5284 RSC.
- E. Olsson, J. Cottom, H. Au, Z. Guo, A. C. S. Jensen, H. Alptekin, A. J. Drew, M. Titirici and Q. Cai, Adv. Funct. Mater., 2020, 30, 1908209 CrossRef CAS.
- X. Sun, Z. Wang and Y. Q. Fu, Carbon, 2017, 116, 415–421 CrossRef CAS.
- M.-M. Titirici, R. J. White, C. Falco and M. Sevilla, Energy Environ. Sci., 2012, 5, 6796–6822 RSC.
- G. P. López, D. G. Castner and B. D. Ratner, Surf. Interface Anal., 1991, 17, 267–272 CrossRef.
- A. C. Ferrari and J. Robertson, Phys. Rev. B: Condens. Matter Mater. Phys., 2000, 61, 14095–14107 CrossRef CAS.
- F. Tuinstra and J. L. Koenig, J. Chem. Phys., 1970, 53, 1126–1130 CrossRef CAS.
- B. Hammouda, J. Appl. Crystallogr., 2010, 43, 716–719 CrossRef CAS.
- K. Gotoh, T. Ishikawa, S. Shimadzu, N. Yabuuchi, S. Komaba, K. Takeda, A. Goto, K. Deguchi, S. Ohki, K. Hashi, T. Shimizu and H. Ishida, J. Power Sources, 2013, 225, 137–140 CrossRef CAS.
- J. Xu, Y. Dou, Z. Wei, J. Ma, Y. Deng, Y. Li, H. Liu and S. Dou, Adv. Sci., 2017, 4, 1700146 CrossRef PubMed.
- P.-C. Tsai, S.-C. Chung, S.-K. Lin and A. Yamada, J. Mater. Chem. A, 2015, 3, 9763–9768 RSC.
- Z. Jian, C. Bommier, L. Luo, Z. Li, W. Wang, C. Wang, P. A. Greaney and X. Ji, Chem. Mater., 2017, 29, 2314–2320 CrossRef CAS.
Footnote |
| † Electronic supplementary information (ESI) available. See DOI: 10.1039/d0ee01363c |
| This journal is © The Royal Society of Chemistry 2020 |