 Open Access Article
Creative Commons Attribution 3.0 Unported Licence
Exploring new sources of efficiency in process-driven materials screening for post-combustion carbon capture†
Amir
H. Farmahini
 *a,
Daniel
Friedrich
 b,
Stefano
Brandani
 a and
Lev
Sarkisov
*a
aSchool of Engineering, Institute of Materials and Processes, The University of Edinburgh, Sanderson Building, EH9 3FB, UK. E-mail: A.Farmahini@ed.ac.uk; Lev.Sarkisov@ed.ac.uk
bSchool of Engineering, Institute for Energy Systems, The University of Edinburgh, Sanderson Building, EH9 3FB, UK
First published on 21st February 2020
Abstract
Performance-based screening of porous materials for CO2 capture and gas separation requires development of multiscale simulation workflows where physiochemical characteristics of adsorbents are obtained from molecular simulations, while separation performance of materials is evaluated at the process level by comparing overall energy efficiency and productivity in a particular process configuration. Practical implementation of these workflows requires: (a) accurate calculation of various material properties some of which are poorly estimated so far (e.g. specific heat capacity), (b) consistent treatment of the process variables that cannot be calculated from molecular simulations but are crucial for process modelling (e.g. pellet size and porosity), (c) improving computational efficiency of the workflows by reducing the search space in process optimization. In this study, we focus on four representative materials in the context of the vacuum swing adsorption process for carbon capture to probe these issues. We report on several observations with important implications for the theoretically achievable process efficiency, the computational efficiency of the multiscale workflows and on the consistency of materials rankings. We demonstrate that if size and porosity of adsorbent pellets are optimized, efficiency and productivity of the process can be substantially improved. We show the maximum performance of a material achievable in a particular process depends on a complex combination of both intrinsic material properties and process variables. This is evident from the ranking of the materials being different for a process with optimizable pellet size and porosity, compared to the reference case where these two properties are fixed. Analysis of the cycles on the Pareto fronts reveals common patterns for these variables for all the materials under consideration. We demonstrate that this observation reflects some optimum balance in the competition between diffusive processes into the pellet and convection flow processes across the bed. We attempt to capture this balance in a universal dimensionless metric which is explicitly proposed here for the first time. Application of such universal metrics could be very important in improving the efficiency of the optimization algorithms by narrowing down the multidimensional search space.
Broader contextCarbon dioxide capture from industrial streams, such as power plant flue gas, is an important strategy in control of green-house gas emissions and in climate change mitigation. Pressure-swing adsorption (PSA) technologies have been considered as an energy efficient alternative to the conventional amine-based absorption processes. At the heart of the PSA process is the adsorbent material. It has been proposed that promising materials for carbon capture must exist among tens of thousands of already synthesized and potentially millions of hypothetical MOF and ZIF structures. Computational screening strategies have been employed to identify these materials, with more recent studies based on realistic process simulations. In this article, we show that the optimal performance of a material, and hence its ranking, is not only a function of its intrinsic adsorptive properties, but also depends on other variables such as how the material is structured within the adsorption column and the characteristics of the cycle. We discover some common patterns among the processes corresponding to the optimal performance of the materials and reflect these patterns in a universal metric that can be exploited to accelerate computational screening of materials for energy efficient carbon capture. |
1. Introduction
Over the course of the last decade, application of computational materials screening has gained momentum among material scientists, chemists and chemical engineers as a strategy to search for the best performing materials for a variety of different separation applications, especially for adsorptive gas separation1–8 and CO2 capture.7,9–16 This interest has led to the development of different screening strategies, adoption of various modelling techniques, and suggestion of a number of performance metrics for materials ranking.7,12,14,16–20 One important outcome of the recent developments in this area is the realization that adsorbent metrics (usually obtained from molecular simulations) do not directly correlate with process performance properties such as productivity and energy consumption of a particular separation process, hence should not be used as standalone criteria for materials screening.21 A group of recent studies has proposed that to realistically predict performance of porous materials in pressure or vacuum swing adsorption (PSA/VSA) processes, one need to adopt a multiscale screening strategy where a series of molecular simulation techniques are combined with process modelling and optimization.17,21,22 In this approach, key characteristic properties of adsorbent materials, such as equilibrium adsorption isotherms and micropore diffusivity of gas components, are calculated from microscale molecular simulations, however the actual performance of materials (e.g. productivity, energy consumption, purity and recovery of the product) is evaluated at the process level22,23 using optimization of PSA/VSA processes. The current research thrust is to extend these strategies to screen a large number of porous materials available within recently assembled databases of porous solids, such as CSD,24 CoRE-MOFs25 and DZS.26 For this to be achieved, a few important considerations should be made:(a) Performance-based screening of porous materials in VSA/PSA processes significantly depends on the implementation of the system at the process level (i.e. process configuration and model assumptions). Any screening conducted solely based on intrinsic physiochemical properties of adsorbent materials may lead to incorrect order of materials in the ranking.21,23 Also, it is challenging to consistently compare ranking of the materials produced for different process configurations (e.g. rankings produced based on basic 4-step VSA/PSA versus 4-step VSA/PSA with LPP or more complex process cycles27).
(b) Accurate calculation of intrinsic adsorbent properties are essential for realistic performance-based ranking of porous materials. There are some characteristics of the porous solids that are so far poorly estimated in multiscale screening approaches (e.g. specific heat capacity).
(c) Development of self-sufficient and fully in silico materials screening strategies requires consistent implementation of process parameters that are not available from molecular simulations (e.g. pellet size, pellet porosity). These parameters can be explored as new sources of efficiency for process performance.
(d) High-throughput performance-based screening of large databases of porous materials requires access to robust, automated and computationally efficient multiscale workflows where various modelling modules operating at molecular simulation and process modelling/optimization levels are connected to one another so that the data can be seamlessly passed on from one simulation level to the other as calculations progress from microscale systems to macroscale processes. However, such multiscale workflows are computationally very demanding, considering a series of consecutive molecular simulations must be completed in advance to estimate key physical properties of materials. This stage is then followed by process modelling and optimization which normally requires thousands of process configurations to be examined for each material. Thus, an important element in successful implementation of multiscale screening approaches is to minimize the computational burden of the workflows by exploiting the hidden relationships between various optimization variables. These relationships can be used as new sources of computational efficiency to reduce the optimization search space. This approach can particularly benefit from advanced numerical methods and emerging machine-learning techniques.28,29
In our recent publication,23 we discussed some of the challenges associated with the implementation of such multiscale workflows including estimation of pellet size and pellet porosity as two important parameters that are required for process modelling but are not available from molecular simulations. In a specific case study of VSA process for separation of CO2/N2 mixture using Zeolite 13X,23 we demonstrated that variation of pellet size and pellet porosity have a significant impact on process performance and efficiency. We also showed that the optimal values for these properties seem to correspond to some complex trade-offs between efficient mass transfer into the pellets and pressure drop across the bed.
This investigation led us to pose the following questions: are there unique values of optimal pellet size and pellet porosity exclusive to each material or there are some universal values of these properties dictated by some other factors? Answering these questions will have important implications for process optimization and computational screening strategies: in the first case, process optimization should treat these properties as optimization variables in order to achieve the best performance for a specific material; whereas in the second case, the same values of pellet size and pellet porosity can be used for all materials, significantly improving computational efficiency of materials screening process. Motivated by these questions, we extended our investigation by exploring the impact of pellet size and pellet porosity, as new sources of process efficiency, on separation performance of four different materials (Cu-BTC, MOF74-Ni, Silicalite-1, Zeolite 13X) in a similar VSA cycle. Our new study suggests that there are some characteristics of the VSA process including correlations of pellet size and pellet porosity that are common for all materials at the optimal performance; this has led us to develop a new metric associated with these conditions which is discussed in the current paper. Existence of such metrics is extremely important for improving computational efficiency of materials screening approaches, as they would make it possible to expedite process optimization by limiting the search space to the most relevant process conditions. This metric also reflects the complex interplay between different competing phenomena which ultimately drive the process optimization towards higher efficiency and productivity.
In the process of addressing the above questions, we also explored what data is needed and what data is available for each material case. Generally, three groups of properties/parameters are required for process modelling: (a) properties of the crystal material (e.g. adsorption data, microporosity, crystal density, thermal properties), (b) properties of the structure of the adsorbent within the column (e.g. pellet size, pellet density, amount of binder, pellet packing density), and finally, (c) properties of the process unit (e.g. column size, column wall length, material of the shell, etc.). Among these properties, the last category is explicitly specified for the reference process model and is not of a concern here. Also, depending on the model, some of the properties listed above may not be needed. One particular property that is required for a non-isothermal VSA model (which will be the likely industrial case) is heat capacity of the adsorbent materials. It has been customary to assume that separation performance of porous materials in PSA/VSA processes is not very sensitive to the variation of adsorbent specific heat capacity (Cp)17,21,22 and that specific heat capacities of typical porous materials are largely similar.30–32 This justified the use of some average but representative values (i.e. proxy values) for this parameter in all previous PSA-based screening studies.11,17,22 This is in part due to the fact that specific heat capacity of a very limited number of porous materials (such as MOFs) has been reported experimentally31–33 and the alternative ways, if not derived from experiment (e.g. empirical group contribution method31) mainly rely on quantum mechanical calculations34–36 which are deemed to be computationally expensive. Here, we use this opportunity to reflect on the impact of using some proxy values of Cp on process performance and material ranking. Although generally a secondary effect, the extent of the uncertainty introduced by using a proxy value for Cp (rather than its true intrinsic value) depends on the diversity of the materials under study, structural flexibility of their porous frameworks (reflected in the level of phonon vibrations) and the level of accuracy required for materials ranking. For example, for a very small group of metal–organic frameworks investigated so far (<30 out of thousands of known MOFs), values of specific heat capacity vary between 700 to 1500 J kg−1 K−1.31–33 The wider this range is, the more difficult it would be to propose a reasonably representative proxy value for all of them.
The current article is organized in four main sections. In the next section, we explain the methodology and provide details of the molecular and process simulations. The results section first focuses on the equilibrium adsorption data obtained from molecular simulations and particular features of the adsorption isotherms. Next, we investigate the sensitivity of the process simulations to the data used for heat capacity of the materials under consideration. The article then reports on improvement of the process performance achieved through simultaneous optimization of pellet size and pellet porosity. It also explores universality of these properties across different materials for the particular VSA process considered here. The last part of the results section is dedicated to exploring the relationships between the decision variables for the cycles laying on the Pareto front and to the metrics that may capture these relationships. The implications of the existence of these metrics are reviewed in the final section, discussed along with some concluding remarks.
2. Computational details
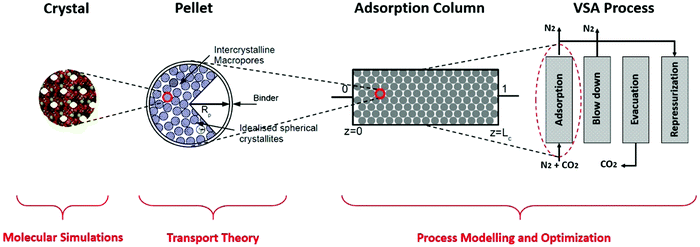
We investigate process-level performance of four different porous solids namely Cu-BTC (HKUST-1), MOF74-Ni (CPO27-Ni), Silicalite-1 (MFI) and Zeolite 13X for adsorptive separation of CO2 from a gas mixture containing 15% CO2 + 85% N2 using vacuum swing adsorption (VSA) process with the light product pressurization (LPP). These four materials are selected to represent both zeolites and metal–organic frameworks (MOFs) families of materials. We compare performance of these materials in a simplified post-combustion carbon capture process by probing the effects of specific heat capacity, and by exploring the pellet size and pellet porosity as additional sources of process efficiency. Materials performance is calculated based on the overall energy consumption and productivity of the separation process for each material. We rationalize the observed trends by invoking the time constant analysis and detailed understanding of the properties of the cycles on the resulting Pareto front.As demonstrated in our previous publication,23 our multiscale computational framework combines grand canonical Monte Carlo (GCMC) simulation with process modelling and optimization to simulate a four-step vacuum swing adsorption cycle with light product pressurization (4-step VSA-LPP). A schematic representation of this framework is shown in Fig. 1.
Here, structural characteristics of adsorbents (such as their pore volume and crystal density) in addition to adsorption isotherms of CO2 and N2 are calculated using molecular simulation techniques at the crystal level. Properties such as macropore diffusivity (e.g. Knudsen, molecular and pellet diffusivities) are estimated using established transport theories for adsorbent pellets which are made of crystallites (small crystals of the porous material glued together by an inert binder). Performance of the four-step VSA-LPP cycle is predicted using process modelling and optimization.
2.1. Molecular simulation
We perform grand canonical Monte Carlo (GCMC) simulations to generate single-component adsorption isotherms of CO2 and N2 in Cu-BTC, MOF74-Ni, Silicalite-1 and Zeolite 13X at several temperatures. The temperatures are chosen in such a way to produce adsorption isotherms with sufficiently diverse shape (linear vs. rectangular) within the operating conditions relevant to post-combustion carbon capture process. Details of the crystallographic data and force field information used in our GCMC simulations are provided in Table S1 of the ESI† document. The choice of the force field requires an additional comment. In a separate thread of research our intention is to evaluate the accuracy of the state-of-the-art molecular simulations in prediction of adsorption isotherms for various classes of porous materials. Therefore, force fields summarized in the ESI† correspond to the specialized developments for each set of material and adsorbate molecule which are shown to reasonably reproduce reference data. Currently, no universally transferable force field is available even within a particular class of porous materials such as MOFs.We note that, only for simulation of nitrogen adsorption in MOF74-Ni, we had to rely on the use of a force field which was unable to reproduce experimental data accurately. The Universal Force Field (UFF) is a generic force field known to provide poor estimates of binding energies for adsorption of CO2 and N2 in MOFs with coordinatively unsaturated metal sites (open-metal sites),37,38 where MOF74 class of materials is a prominent example.39–41 In this type of MOFs, the coordinatively unsaturated metals provide favourable adsorption sites to which CO2 and N2 have strong affinity. As shown by multiple researchers, the binding energy of adsorbate molecules attracted to these metal sites cannot be correctly modelled using generic force fields.39,40,42 To accurately estimate the binding energies in such systems, force fields derived from quantum-mechanical calculations must be employed to treat variation of chemical environment at the vicinity of open metals.39 Hitherto, a handful of first-principle force fields have been developed to correctly model adsorption of CO2 in open-metal site MOF74s,39–44 one of which is also used in this study for adsorption of CO2 in MOF74-Ni.40 However, to the best of our knowledge, there is only one such force field developed for adsorption of nitrogen (i.e. Mg-MOF74).39 For other MOF74s, we have no choice but to rely on generic force fields. This will affect accuracy of our molecular simulations for adsorption of nitrogen in MOF74-Ni which will be discussed in Section 3.1.
In this study, all GCMC simulations are performed using RASPA 2.0 simulation package.45 Simulations are sufficiently run to ensure the systems are fully equilibrated before any statistical data is collected. Four different trial MC moves, including insertion, deletion, translation and rotation, are attempted. All materials simulated in this study are assumed to have rigid frameworks consisting of an array of unit cells in the periodic boundary conditions. Properties of adsorbent frameworks are provided in Table S2 of the ESI.† Molecular visualizations of the adsorbent materials used in this study are provided in Fig. 2.
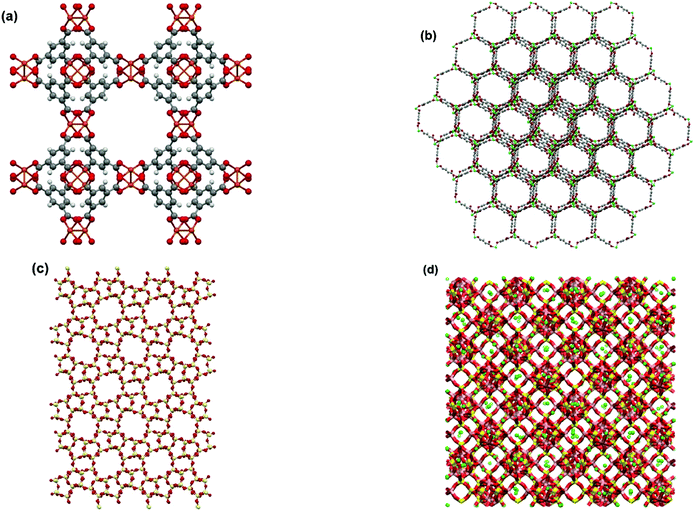 | ||
| Fig. 2 Molecular visualizations of adsorbent frameworks for (a) Cu-BTC, (b) MOF74-Ni, (c) Silicalite-1 and (d) Zeolite 13X. | ||
The 12-6 Lennard-Jones (LJ) potential model is employed to calculate dispersion interactions, while long-range electrostatic interactions are treated using the Ewald summation. Details of the potential cut-off distances for both dispersion and electrostatic interactions in real space are also provided in Table S2 of the ESI.† To speed up our GCMC simulations, we use grid potentials with 0.1 Å resolution for both LJ and electrostatic interactions. To consistently convert pressure values to fugacity, we employ the Peng-Robinson equation of state throughout this study.
We note that for the case of Zeolite 13X (Na-exchanged faujasite), positions of Na+ cations are not fixed in contrast to framework atoms of the faujasite. These cations are allowed to access the Sodalite (β-cage) cages of faujasite, however molecules from the outside of the framework cannot penetrate into these cages.46–48 Therefore, adsorption of CO2 and N2 molecules into Sodalite cages is prevented by blocking them during GCMC simulations. Atomistic modelling of the Na-FAU structure is detailed in our previous publication.23
2.2. Process modelling
As described in our previous publication,23 we have developed a multiscale modelling platform for simulation of a cyclic vacuum swing adsorption process with light product pressurization (VSA-LPP) to separate binary mixture of 15% CO2 and 85% N2. The VSA-LPP model is implemented in our in-house adsorption cycle simulator, CySim,49 and consists of four consecutive steps detailed below (also depicted in Fig. 3):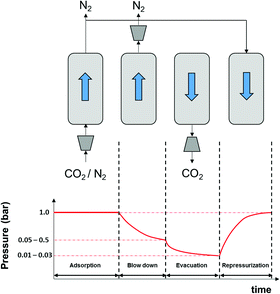 | ||
| Fig. 3 Schematic depiction of the employed VSA-LPP process consisting of four consecutive steps: (1) adsorption, (2) blowdown, (3) evacuation and (4) light product pressurization. | ||
(1) Adsorption step: adsorption at atmospheric pressure with feed.
(2) Blow-down step: co-current blowdown to an intermediate pressure to remove nitrogen.
(3) Evacuation process: counter-current evacuation to low pressure to obtain CO2 product.
(4) Pressurization: counter-current pressurization with light product.
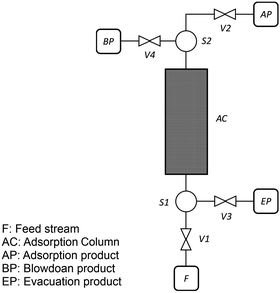
The above cycle is the simplest process that has been experimentally shown to recover 90% of CO2 with a purity greater than 95%.50 However, this is only achieved by using very low evacuation pressures (Pevac < 0.04 bar).51 In order to achieve the same purity-recovery using the commonly used industrial pumps, more complex VSA cycles (e.g. 6-step dual reflux VSA) will be needed.51 Further details regarding the process flowsheet of the 4-step VSA-LPP cycle are shown in Fig. 4.
As shown in this figure, there are four streams in the flowsheet including two splitters, four valves and one adsorption column. During the adsorption step, valves V1 and V2 are open, however valves V3 and V4 are closed. This introduces feed stream F into the adsorption column, AC. Adsorption product is then stored in stream unit AP. During the second step (i.e. blowdown) valve V4 is opened, while valves V1 and V2 are now closed. The blowdown product is stored in the stream unit BP. By closing valve V4 and opening valve V3 during the evacuation step, the product of this step can be stored in the unit EP. Finally, during LPP step, only V2 is open and adsorption product is used to re-pressurize the column. The behaviour of the adsorption column and its auxiliary units are described by mass, momentum and energy balances that form a system of differential algebraic equations implemented in CySim using the SUNDIALS library.49,52 The complete set of the equations along with the boundary conditions and other technical details of the model are provided elsewhere.53 We note that our process simulator (CySim) has been previously shown to reproduce both experimental49,54–56 and published modelling data23 accurately.
Here, we reiterate the following model assumptions for the VSA-LPP model which are consistent with the previously published process models for the four-step VSA with LPP:22,51,57
1. Ideal gas law is valid.
2. Axial dispersed plug flow in the column takes place.
3. The pressure drop across the column is described by the Ergun equation.
4. Non-isothermal model accounts for energy balances inside the column. The heat transfer between the column, column wall and ambient environment is employed.
5. The adsorption equilibrium is described by the dual-site Langmuir model.
6. The mass transfer mechanism is controlled by diffusion through macropores with contributions from Knudsen and molecular diffusion mechanisms.58,59 The mass transfer rate equation is described by the linear driving force (LDF) approximation.
Similar to the cases of Zeolite 13X58 and MOF74-Ni,60 transport of CO2 and N2 in other two materials studied here is also controlled by macropore diffusion, which is the most likely scenario for all pelletized microporous materials that have pore openings greater than 4 Å within their crystal structure.61,62 During optimization, CySim makes sure that all simulations achieve a cyclic steady state (CSS) condition by checking simulations against the specific criteria explained here. Based on our preliminary tests, the system achieves CSS before the number of cycles exceeds 700 or when the following mathematical criteria are met:
 | (1) |
 | (2) |
Multi-objective optimisation of the 4-step VSA-LPP process is carried out by coupling CySim with the Platypus framework in Python,63 which uses the third generation of non-dominated sorting genetic algorithm (NSGA-III).64 In a recent study conducted by Rajendran and co-workers, the ability of multi-objective optimization techniques to guide the design of VSA processes has been validated against experimental process data.65 Here, for a given adsorbent, the objective is to minimize energy penalty of the process while at the same time trying to maximize its productivity, which is how much CO2 product is produced during the evacuation step of the process per unit of volume of the adsorbent per unit of time. The optimization is subject to two constraints requiring purity and recovery of CO2 product to be always higher than 95% and 90% respectively. Mathematical definitions of purity, recovery and productivity are provided in our recent publication.23
The Pareto front (energy-productivity trade-off curve) produced as a result of process optimization is monitored periodically for its variation in the minimum energy and maximum productivity and when no significant change in the progress of the Pareto front is observed, it is assumed to be converged. Our analysis shows that a maximum of 30![[thin space (1/6-em)]](https://www.rsc.org/images/entities/char_2009.gif) 000 CySim evaluations within the genetic algorithm (GA) is adequate for the Pareto front to converge. We assume 100% efficiency in the energy consumption of the isentropic compression processes. The decision variables for the process optimization are the durations of adsorption step (tads), blowdown step (tbd) and evacuation step (tevac), pressures in the evacuation (Pevac) and the blowdown (Pbd) steps, feed flow rate (F) and coefficient of the valves (CV) used in the blowdown and evacuation steps in addition to the radius (Rp) and porosity (εp) of adsorbent pellet. Here, we note that valve coefficient is a measure for the size of the valve. It has the unit of m2 × 10−2.5. The meaning of this coefficient is clear from eqn (3) provided below:
000 CySim evaluations within the genetic algorithm (GA) is adequate for the Pareto front to converge. We assume 100% efficiency in the energy consumption of the isentropic compression processes. The decision variables for the process optimization are the durations of adsorption step (tads), blowdown step (tbd) and evacuation step (tevac), pressures in the evacuation (Pevac) and the blowdown (Pbd) steps, feed flow rate (F) and coefficient of the valves (CV) used in the blowdown and evacuation steps in addition to the radius (Rp) and porosity (εp) of adsorbent pellet. Here, we note that valve coefficient is a measure for the size of the valve. It has the unit of m2 × 10−2.5. The meaning of this coefficient is clear from eqn (3) provided below:
 | (3) |
The upper and lower limits of the decision variables are provided in Table 1. Similar to our previous study,23 we use an adsorption column with the length and internal radius of 1.0 m and 0.1445 m respectively. The feed pressure is fixed at slightly above atmospheric pressure and the adsorption product stream AP is set to 1.0 atm. Valve V2 has a large valve coefficient ensuring the column outlet to be at atmospheric pressure. We also fix the duration of the LPP step to 20 seconds, which is the lower bound for the adsorption step time. As mentioned above, the optimizations are performed for 30![[thin space (1/6-em)]](https://www.rsc.org/images/entities/char_2009.gif) 000 GA evaluations. Other parameters relevant to our process simulation set-ups are provided in Table S3 of the ESI.†
000 GA evaluations. Other parameters relevant to our process simulation set-ups are provided in Table S3 of the ESI.†
| Decision variable | t ads [s] | t bd [s] | t evac [s] | P bd [bar] | P evac [bar] | C BdV [m2 × 10−2.5] | Feed [mol s−1] | C EvacV [m2 × 10−2.5] | R p [mm] | ε p [—] |
|---|---|---|---|---|---|---|---|---|---|---|
| Lower bound | 20 | 1 | 10 | 0.05 | 0.01 | 0.05 | 0.01 | 0.1 | 0.5 | 0.1 |
| Upper bound | 200 | 200 | 200 | 0.50 | 0.03 | 0.50 | 2.50 | 2.0 | 2.5 | 0.8 |
We have previously validated our multiscale modelling approach and its model assumptions by reproducing energy-productivity Pareto front of Zeolite 13X for separation of CO2–N2 mixtures as published in the literature.23
3. Results and discussion
3.1. Modelling adsorption isotherms
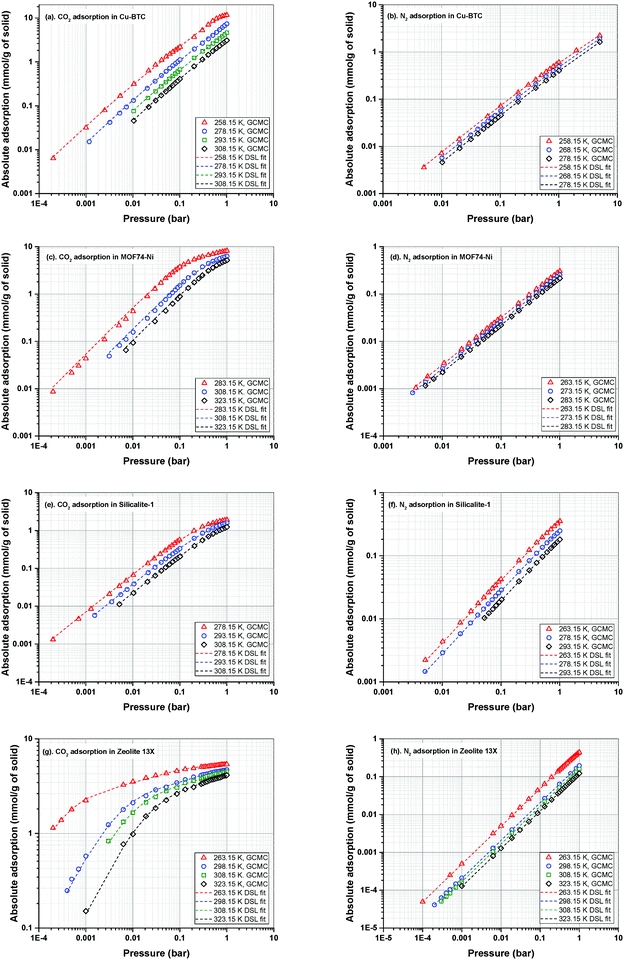
Adsorption isotherms of CO2 and N2 are predicted using GCMC simulations at three different temperatures relevant to working temperatures of a conventional VSA process for post-combustion carbon capture. All simulated adsorption isotherms are scaled down to account for the mass fraction of pellet binder in experiment. The exact amount of binder is typically estimated to be around 15–25%.66 Here, we use a scaling factor of 20% as obtained for adsorption in Zeolite 13X in our previous publication.23The dual-site Langmuir (DSL) adsorption model is used to fit the adsorption data obtained from GCMC simulations. For fitting, we have adopted the fitting method explained in our previous publication.23 In this method, a procedure is employed where the importance of the Henry's constant of CO2 adsorption in the accuracy of the 4-step VSA-LPP model is recognized. This approach also emphasizes the significance of the lower temperature adsorption isotherms as they contain more information about the parameters of the model compared to higher temperature data. GCMC simulated adsorption isotherms of CO2 and N2 in Cu-BTC, MOF74-Ni, Silicalite-1 and Zeolite 13X along their corresponding DSL-fitted isotherms are shown in Fig. 5. Details of the fitting parameters for the DSL isotherms are provided in Table S4 of the ESI.†
Here, we note that the simulated adsorption isotherms of N2 in MOF74-Ni (Fig. 5(d)) largely underestimate experimental data reported in the literature60 which is shown in Fig. S2 of the ESI.† As discussed in Section 2.1, this is due to inaccuracy of currently available generic force fields in capturing binding energy of nitrogen in the vicinity of unsaturated nickel atoms (i.e. open metal sites) within the structure of MOF74-Ni. In our recent publication, we demonstrated that inaccurate representation of nitrogen adsorption at the molecular level has a large impact on energy-productivity predictions at the process level for post-combustion carbon capture.23 This observation has been previously reported by other researchers as the process level screening of porous materials attracts more attention among scientists.19,21,67 Yet, the need for development of accurate first-principle force fields for molecular simulation of nitrogen adsorption has remained widely unrecognised among the molecular simulation community.
Therefore, for the sake of the current study, GCMC simulated adsorption isotherms of N2 for MOF74-Ni should not be compared against what is known to be typical experimental isotherms of nitrogen for this material. It is also important to note that, this study is not meant to reproduce the exact performance of porous materials in experiments. Instead, the goal is to investigate and reveal the interplay of various factors in the process performance which could be potentially used to improve the efficiency of the VSA-LPP process and the computational efficiency of multiscale simulation workflows. Hence, the conclusions made at the end of this study are not affected by the artificial behaviour of nitrogen adsorption isotherms for MOF74-Ni which are presented in Fig. 5(d).
Adsorption isotherms of the four materials considered here feature various characteristics which are important for their process-level performance. Fig. 6 compares N2 and CO2 adsorption isotherms of these materials at 298.15 K, which is the operating temperature of our VSA cycle. As shown in Fig. 6(a), all sub-atmospheric adsorption isotherms of nitrogen are completely linear, however adsorption isotherms of CO2 exhibit very different shapes and level of non-linearity for different materials, which is shown in Fig. 6(b).
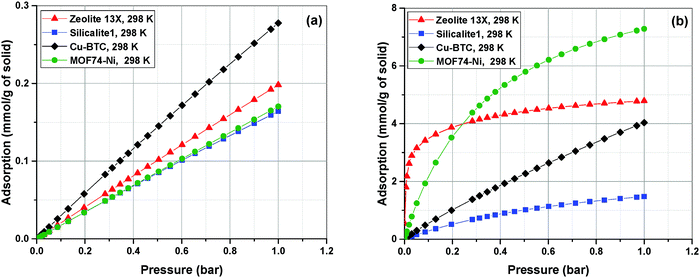 | ||
| Fig. 6 Adsorption isotherms of N2 (a) and CO2 (b) in four different materials as predicted by the DSL model. | ||
As depicted in this figure, CO2 isotherms are very diverse in terms of their maximum adsorption capacities, level of non-linearities (shape of the isotherm) and Henry's constants (slope of the isotherm at low pressures). For instance, the non-linear shapes of the CO2 isotherms for Zeolite-13X and MOF74-Ni are in sharp contrast to almost linear forms of Cu-BTC and Silicalite-1, which will have important implications for separation performance of these materials in the VSA cycle. Likewise, largely different values of Henry's constant (KH) are expected to dictate very different diffusion rates during desorption process, when such low pressures are achieved in the VSA cycle. As illustrated in Fig. 6(b), Zeolite 13X has the highest KH value, while Silicalite-1 demonstrates the lowest KH. It can also be seen that MOF74-Ni possesses the highest adsorption capacity at 1 bar, while Zeolite-13X has a significantly smaller capacity at this pressure despite its large KH. This is associated with smaller total pore volume of Zeolite-13X compared to MOF74-Ni. Different characteristics of adsorption isotherms, similar to what observed here, will play important roles in process-level separation performance of adsorbent materials which have been already discussed in the literature.17,68 In the following sections of this article, we will focus on the process-level properties which have important effects on separation performance of adsorbent materials.
3.2. Effect of adsorbent heat capacity on performance-based screening of porous materials
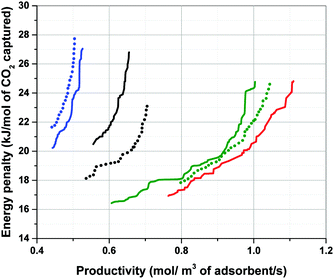
As briefly mentioned in the introduction, specific heat capacity (Cp) of adsorbent materials is one of the parameters required for process modelling of PSA/VSA processes under non-isothermal conditions. It has been customary to assume that the separation performance of porous solids in such processes is not very sensitive to variation of Cp.17,21,22 It is also presumed that specific heat capacities of typical porous materials are within a very similar range so that one could safely use a typical value of Cp for all the materials used in a screening study without the need to calculate this property independently.11,17,22 Unfortunately, specific heat capacity of very few porous materials has been measured experimentally,31–33 which is particularly true for large and diverse family of MOFs. In this section, we analyse sensitivity of process performance in our VSA-LPP cycle to variation of Cp based on the experimental values reported in the literature for Cu-BTC, MOF74-Ni, Silicalite-1 and Zeolite 13X. Fig. 7 illustrates how positions of the Pareto fronts change in response to variation of Cp by comparing the following two scenarios:(1) For the first scenario, experimental Cp value of each material (as obtained from the literature) is used to predict performance of the VSA-LPP process. Here, it is assumed that the specific heat capacities of pelletized samples are identical to those of their crystal structures (i.e. binder has no thermal effect). For this, following literature values are used for specific heat capacity of each material: Cu-BTC = 1457 J kg−1 K−1;69,70 MOF74-Ni = 1100 J kg−1 K−1;‡![[thin space (1/6-em)]](https://www.rsc.org/images/entities/char_2009.gif) 60 Silicalite-1 = 771 J kg−1 K−1;71 Zeolite 13X = 920 J kg−1 K−1.72
60 Silicalite-1 = 771 J kg−1 K−1;71 Zeolite 13X = 920 J kg−1 K−1.72
(2) For the second scenario, it is assumed that the specific heat capacity of all materials is similar to that of Zeolite 13X (i.e. 920 J kg−1 K−1), thus Cp = 920 J kg−1 K−1 is consistently used for process simulation of all materials. Using a single proxy value for Cp as the specific heat capacity of other materials in a screening study is similar to the approach adopted by Khurana et al.17 for performance-based screening of 74 porous materials for post-combustion carbon capture.
According to Fig. 7, performance of materials is overestimated (i.e. the position of Pareto front is shifted towards bottom-right corner of the graph) when a proxy value larger than actual Cp of the material is used in process simulation (which is the case for Silicalite-1). In contrast, performance of materials is underestimated (i.e. the position of Pareto front is shifted towards top-left corner of the graph) when a proxy value smaller than actual Cp of the material is used (that is the case for Cu-BTC and MOF74-Ni). As evident in this figure, displacement of Pareto fronts is more apparent, when the proxy value of Cp represents a particularly poor estimate of the actual heat capacity of the material which is the case for Cu-BTC here (1457 vs. 920 J kg−1 K−1). Within large databases of structurally and chemically diverse materials it is not necessarily obvious which of the material will present a strong deviation from some chosen proxy values. Therefore, our study suggests that although the ranking does not seem to be very sensitive to variation of Cp, process performance can still vary considerably if a poor estimate of the actual heat capacity is used for process simulation. To what extent the errors introduced in position of the Pareto fronts can be tolerated largely depends on diversity of the materials under study, structural flexibility of their crystalline frameworks (which is reflected in their phonon vibrational frequencies) and the level of accuracy required for materials screening. Several methods have been proposed to estimate the specific heat capacity of porous materials including group contribution methods,31 classical molecular simulations based on optimized force fields30 and quantum mechanical calculations through analysis of phonon frequencies.34–36 These methods can be used to increase accuracy of multiscale simulation workflows in predicting separation performance of porous materials, and will be investigated in our future publication.
3.3. Simultaneous optimization of pellet size and porosity
In our recent publication we demonstrated how separation performance of the VSA-LPP process can be tuned by manipulating size and porosity of the adsorbent pellet.23 In this section we seek to find out whether universal values of optimal pellet size and porosity exist across different materials. For this, we treat size and porosity of the pellet as two additional decision variables, which are simultaneously optimized along with eight other decision variables in the process. The optimal values of these properties established in our previous study for Zeolite 13X indicate some trade-offs between competing effects and it is instructive to briefly review how these trade-offs emerge. Therefore, we begin this section by introducing several essential elements of the VSA process, whereas for the complete picture the reader is referred to our previous publication.23In a conventional PSA/VSA process, adsorbents are used in the form of pellets, which are made of small crystallites held together by an inert binder. Schematic structure of an adsorbent pellet is provided in Fig. 8.
As depicted in this figure, the space between crystallites in the pellet constitutes inter-crystallite macroporosity of the sample material. As mentioned before, transport of CO2 and N2 is controlled by these macropores in any pelletized microporous material that have pore openings greater than 4 Å within their crystalline structures.61,62 This has been experimentally demonstrated for diffusion of CO2 in pelletized samples of Zeolite 13X58 and MOF74-Ni.60
Here, we start with the overall mass balance for the adsorption column which can be formulated as follows:
 | (4) |
| Qi = εpcmi + (1 − εp)qi | (5) |
 | (6) |
 | (7) |
 | (8) |
 and
and  are molecular, Knudsen, macropore and effective macropore diffusivities of component i, respectively. The formalism presented above provides a helpful framework to rationalize the existence of optimal values of pellet size and pellet porosity. From eqn (8), it is clear that smaller particles should lead to higher LDF coefficient and lower resistance to mass transfer. Reduced mass transfer resistance in turn will move the process closer to an equilibrium-controlled process which could potentially improve efficiency of the process. On the other hand, smaller pellet size will cause higher pressure drops across the column, as described by the Ergun equation:
 | (9) |
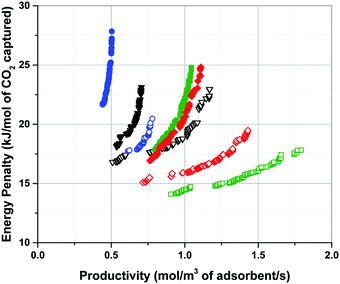
With the complex interplay between various competing effects reviewed here, we now turn our attention to the case study of performance of four materials in the 4-step VSA-LPP process. Our investigations show that one could indeed achieve a better separation performance (i.e. lower energy penalty and higher productivity) in this process for all materials when size and porosity of adsorbent pellet are simultaneously optimized. Fig. 9 compares fully converged Pareto fronts of Cu-BTC, MOF74-Ni, Silicalite-1 and Zeolite 13X for two different cases: (1) when the process is optimized using all the decision variables provided in Table 1, including size and porosity of the pellet (i.e. optimization with 10 decision variables); (2) when the size and porosity of the pellet are fixed at Rp = 1 mm and εp = 0.27 respectively. In this case, the process is optimized using the remaining 8 decision variables listed in Table 1. Values of Rp = 1 mm and εp = 0.27 are the ones used in our previous study of the VSA-LPP cycle with Zeolite 13X as adsorbent23 and are obtained from experiment.58 As evident from Fig. 9, Pareto fronts obtained through optimization of 10 decision variables are consistently better than their counterparts obtained based on optimization of 8 decision variables which is when size and porosity of adsorbent pellets are kept constant at some chosen reference values.
Additionally, Fig. 9 reveals another interesting behaviour of the process arising from simultaneous optimization of pellet size and pellet porosity. As shown in this figure, not only concurrent optimization of pellet size and pellet porosity makes it possible to significantly enhance separation performance of the VSA-LPP cycle, it also leads to a different order of top performing materials for this process. As shown in this figure, positions of Zeolite 13X and MOF74-Ni (as the two best materials in this figure) are swapped once the size and porosity of pellets are allowed to vary. This finding will have profound implications for screening studies of porous materials, considering it shows that material hierarchies produced based on similar performance metrics at fixed values of pellet size and pellet porosity are subject to change, if optimum values of these parameters (and possibly other process variables) are considered.
To obtain additional insight on the role of pellet size and pellet porosity for enhanced separation performance of materials, we set to investigate how the mass transfer kinetics is altered in a system with optimizable pellet morphology. For this, we calculate diffusional time-constant of CO2 during the evacuation step of the VSA-LPP cycle, where macropore diffusivity is the controlling mechanism. Diffusional time-constant reflects on the characteristic time required for the diffusion across the pellet of size Rp as described by
 | (10) |
 | (11) |
 represents the local slope of the adsorption isotherm, and Dmacro and Demacro are macropore and effective macropore diffusivities as defined in the notation for eqn (8).
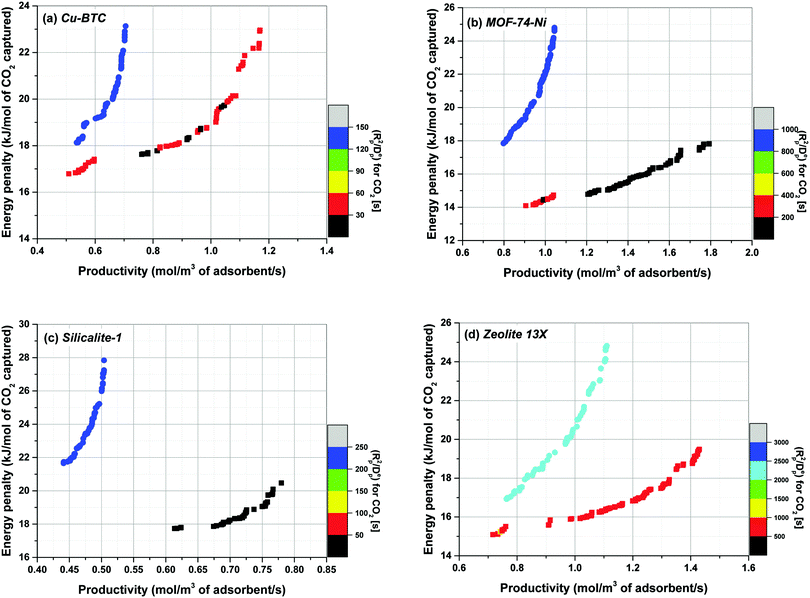
Variation of the diffusional time-constant (tdiff) for CO2 across Pareto fronts of four different materials is illustrated in Fig. 10 for both optimization cases presented in Fig. 9 (i.e. optimization using 8 and 10 decision variables). Here,  for each material is calculated at the limit of 0.01 bar when the adsorbed CO2 is ultimately evacuated.
As shown in Fig. 10, tdiff is consistently larger for the Pareto fronts obtained using fixed values of pellet size and pellet porosity (i.e. Rp = 1 mm, εp = 0.27). In contrast, when Rp and εp are allowed to vary during optimization, tdiff is noticeably decreased which is a clear indication of enhanced kinetics giving rise to better separation performance of the system. The enhanced performance detected here is a result of increased pellet porosity to some optimum values greater than εp = 0.27. Interestingly, at the same time, the optimization arrives to slightly larger values of Rp, which according to the analysis above should lead to more hindered mass transfer. Nevertheless, the process still favours larger values of Rp considering they give rise to lower pressure drops according to eqn (9). Therefore, it is clearly the combined effect of Rp and εp values that leads to the overall improved mass transfer into the pellets. Having said that, there will be a limit to the kinetic improvements achieved through optimization of pellet morphology beyond which the process performance will drop again due to a combination of different factors. Before proceeding to a deeper discussion related to the complex interplay observed here, we will first focus on some findings related to distribution of optimal pellet size and pellet porosity across Pareto fronts of different materials.
3.4. Are there universal values for pellet size and pellet porosity?
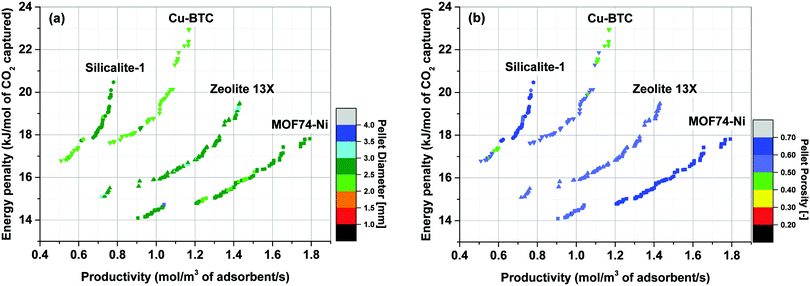
Simultaneous optimization of pellet size and pellet porosity not only allows a typical PSA/VSA process to perform with lower energy requirement while having higher productivities, it also provides an opportunity to propose new process-level metrics which can be used in the context of materials screening. Our study shows that there seem to be some levels of universality in optimum values of pellet size and pellet porosity in the VSA-LPP process, at least within the four materials studied here. This means that optimum size and porosity of adsorbent pellets always fall within a relatively narrow but somewhat similar range which seems to be independent of adsorbents intrinsic properties. This is evident from Fig. 11 where variations of pellet diameter (dp = 2Rp) and pellet porosity (εp) across Pareto fronts of Cu-BTC, MOF74-Ni, Silicalite-1 and Zeolite 13X are shown.Analysis of Fig. 11(a) shows that ∼95% of all the points located on Pareto fronts of the above four materials favour an optimum pellet diameter between 2.0 and 3.0 mm, out of which ∼80% of the points are spread between 2.5 and 3.0 mm. A histogram in Fig. 12(a) details the distribution of pellet diameters for the Pareto fronts shown in Fig. 11(a). Likewise, analysis of Fig. 11(b) indicates that more than 96% of all the points located on the Pareto fronts have an optimum pellet porosity between 0.5–0.7. As detailed in Fig. 12(b), pellet porosity of ∼54% of all the points are located between 0.5 and 0.6, while for ∼43% of them pellet porosity falls between 0.6 and 0.7. Similar information can be obtained from the detailed distribution of the pellet diameter and pellet porosity across Pareto fronts of the individual materials as shown in eight separate histograms in Fig. S3 of the ESI.†
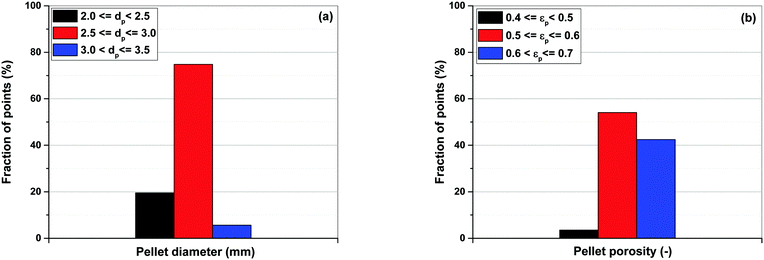 | ||
| Fig. 12 Distribution of pellet diameters (a) and pellet porosities (b) on Pareto fronts of Cu-BTC, MOF74-Ni, Silicalite-1 and Zeolite 13X associated with Fig. 11. | ||
The somewhat similar values of pellet diameter and pellet porosity (universality of Rp and εp) reported here could suggest the use of these two parameters as new process-level metrics for identifying the best performing adsorbents in materials screening studies. These metrics can facilitate more efficient screening of porous materials by narrowing the highly multidimensional optimization space to smaller regions where most promising process configurations are likely to be located. We acknowledge that this hypothesis is currently only tested for the four porous materials studied here, and a more extensive investigation with a larger pool of materials is required to draw a general conclusion. Nevertheless, given the four materials investigated in this study represent a fairly diverse group of porous solids (siliceous and ion-exchanged zeolites, as well as open-metal site MOFs), we believe there is a good chance that this type of metrics can be effectively used for screening larger groups of porous materials within the same context studied here.
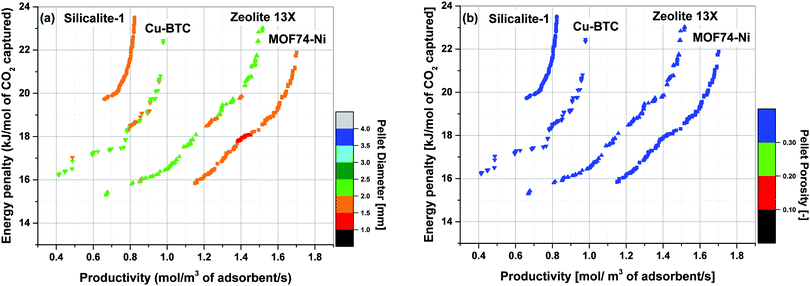
Here, we note that although the optimal values of pellet porosity reported above exceed typical experimental values, other adsorbent optimization studies do suggest a similar range (0.4 < εp < 0.6).74 Production of pellets with very high porosity may be limited by their mechanical stability under cyclic VSA conditions, although we do not exclude that under encouraging economic incentives, some novel ways to produce high porosity pellets will eventually develop (e.g. 3D printing). Therefore, we revisit the process optimization problem described above under an additional constraint of upper pellet porosity (εp = 0.4) for all the materials. The results for variation of pellet size and pellet porosity of this new calculation are presented in Fig. 13.
As shown in Fig. 13(b), limiting the upper boundary of the pellet porosity to εp = 0.4 results in a situation where optimal values of εp for all the points located on the Pareto fronts become essentially very close to this upper limit. In fact, our optimizations show that 100% of the process configurations adjust themselves to εp values between 0.39 and 0.4. This is consistent with the previous results shown in Fig. 11(b) signifying that, if allowed by a wider optimization boundary, the process tends to achieve its best performance at εp > 0.4 which is restricted in the case shown in Fig. 13. Smaller values of εp increases diffusional time-constant as defined by eqn (10) resulting in a reduced mass-transfer into the pellets. To maintain performance, process optimizer will adjust to smaller sizes of pellet (Rp) which helps to counter that effect, considering at smaller pellet size diffusional time-constant will decrease. This is consistent with what is shown in Fig. 13(a) where pellet diameter of ∼95% of all the points on the Pareto fronts fall into a range between 1.5 to 2.5 mm (Fig. 14) which is clearly smaller than what is observed before in Fig. 11. Similar information can be obtained from the detailed distribution of pellet diameters across Pareto fronts of the individual materials as reported in Fig. S4 of the ESI.†
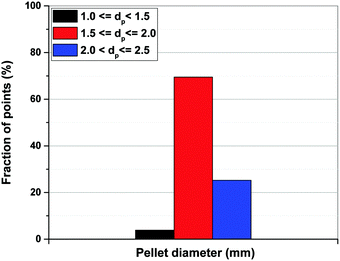 | ||
| Fig. 14 Distribution of pellet diameters on Pareto fronts of Cu-BTC, MOF74-Ni, Silicalite-1 and Zeolite 13X associated with Fig. 13. | ||
Based on what was reported in this section about variation of pellet size and pellet porosity under different optimization constraints (Fig. 11 and 13), it is clear that these two properties respond to the perturbation in one another through a complex interplay between pressure drop (eqn (9)) and diffusional time-constant for mass transfer across pellets (eqn (10)). It was shown that when mass transfer is reduced by forcing the system to smaller values of pellet porosity (εp < 0.4), the process responds by switching to smaller values of Rp to improve diffusional time-constant as far as the trade-off between energy penalties associated with larger pressure drops and faster mass transfers allows. Conversely, when εp is allowed to increase (0.1 < εp < 0.8), the system can afford to go to larger values of Rp to reduce pressure drop and maintain the same fine balance.
3.5. A new correlation to search for optimum solutions
As mentioned earlier in the introduction, multiscale screening of porous materials constitutes workflows of consecutive simulations which are computationally very demanding. To efficiently adopt such multiscale simulation workflows for screening of larger groups of materials, computational burden of the workflow must be reduced. Usually, one of the most computer-intensive stages of the workflow is process optimization whose final product is obtained in the form of a Pareto front (i.e. trade-off curve between energy penalty and productivity of the process). In the previous section of this paper, we showed that several properties such as the diffusional time-constant, pellet size and pellet porosity exhibit certain common trends characteristic for the conditions on the Pareto fronts for the materials under consideration. In addition to that, we have already speculated (in our previous23 and the current article) on the possible trade-offs between energy penalties associated with the increased pressure drop, fast cycles and enhanced mass transfer as the pellet size decreases and pellet porosity increases. This prompted a hypothesis that the Pareto fronts in these processes indeed correspond to some optimal balance between these trends, which is likely to be reflected in some relations between the values of decision variables on the Pareto front. Moreover, these relations might be universal and independent of the materials. The universality of these process properties can be exploited to reduce the search space during optimization in order to arrive at the optimal solution (i.e. the Pareto front) in a shorter time. In the current section, we use a similar approach, but this time we try to find a more general metric to search for the approximate position of the Pareto front during process optimization.Here, we recognize two characteristic time scales associated with our system:
(a) Diffusional time-constant as described by eqn (10).
(b) The mean residence-time for the convective flow through the adsorption column.
As described earlier, diffusional time-constant reflects the characteristic time required for the diffusion across the pellet of size Rp. We can envision, that if the gas flow through the system is considerably faster compared to the diffusion process, process productivity will be low because CO2 will eventually break through without being completely adsorbed. On the other hand, if the flow of gas is very slow compared to the pellet diffusion process, negative effect of a slow cycle will also decrease productivity of the process. Hence, intuitively, the second time scale is associated with the flow of the gas through the system, which can be encoded in the mean residence-time (in other words, the first moment of the residence time distribution):
 | (12) |
 is the secant of the isotherm (in other words, the working capacity). This equation can be recast in terms of the interstitial flow velocity, v:
 | (13) |
 | (14) |
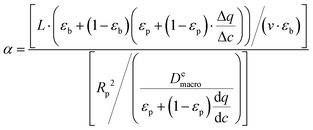
According, to the formulae provided above:
 | (15) |
In this expression, the terms containing either secant of the isotherm  or the local slope of the isotherm
  will be significantly higher in magnitude compared to all other terms (with porosities taking values of 0 < εp < 1 and 0 < εb < 1); therefore these other terms can be eliminated to produce a simplified and approximate expression:
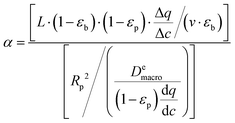 | (16) |
To understand the behavior of this property, consider a simplified case, where the isotherm is strictly linear with a slope equal to K. In this case, both the local slope and the secant are also equal to the slope of the isotherm, and hence to each other:  . Consequently, the above expression can be rewritten as:
 | (17) |
 | (18) |
 | (19) |
Even a simpler property can be introduced if we eliminate the bed porosity (as it is a fixed property in our system):
 | (20) |
 ). In the last equation, we keep L to make the property dimensionless. In fact, the structure of dimensionless parameter α is very similar to that of the Péclet number, which is used to describe the ratio of characteristic residence and diffusion times in the reactor. In the context of PSA/VSA process, the Péclet number is mainly studied to understand correlations of axial dispersion flow in packed bed columns which is jointly caused by molecular diffusion and turbulent flow around adsorbent pellets in the column.75,76 Hence, to avoid the confusion, we simply call the property defined above as α.
As shown in the previous section, the optimization process will be driven to improve its diffusion performance (smaller Rp and larger εp) but this can happen only up to a point beyond which having very small Rp will lead to energy costs associated with the pressure drop across the bed; or having too large of the εp will incur additional inefficiencies associated with the amount of the active material in the column being too small. Hence, the property defined above is likely to converge to some characteristic values during optimization. Nevertheless, the analysis presented so far has been based on the condition of a linear isotherm. To what extend is this condition relevant to the actual dynamic process and the non-linear isotherms associated with the materials under consideration? Our analyses show that the cycle optimization drives the process to operate along more linear portions of the CO2 isotherm. This leads to lower than expected working capacities during a single cycle, however the negative effect is compensated by the efficient evacuation step. In Table S5 of the ESI,† we provide detailed analyses of several configurations (corresponding to various points on the Pareto fronts of different materials) to demonstrate that our system does operate with relatively low working capacities along some portions of CO2 isotherm that have lower curvature (smaller non-linearity). This behaviour is associated with particular properties of the 4-step VSA-LPP cycle and the imposed constraints (specifically, the 90% recovery of CO2). However, on the hindsight, this may not be very surprising after all: previous studies suggest that CO2 isotherms with lower curvature is beneficial in VSA cycles for post-combustion CO2 capture, although complete linearity of CO2 isotherms are not necessarily preferable.68,77
Hence, to summarize, it may be possible that other cycles (for various materials) also operate close to some linear portions of the adsorption isotherm with lower curvature. In this case, we theorize that the optimization process is likely to arrive to a particular trade-off between the pellet size and pellet porosity (essentially, diffusional time-constant) and convective flow rate as encoded in the dimensionless parameter of α which should have a narrowly varying value for points closer to/on the Pareto front. This property is expected to be material-independent, as the final expression does not contain anymore the actual characteristics of the adsorption isotherm (i.e. ).
).
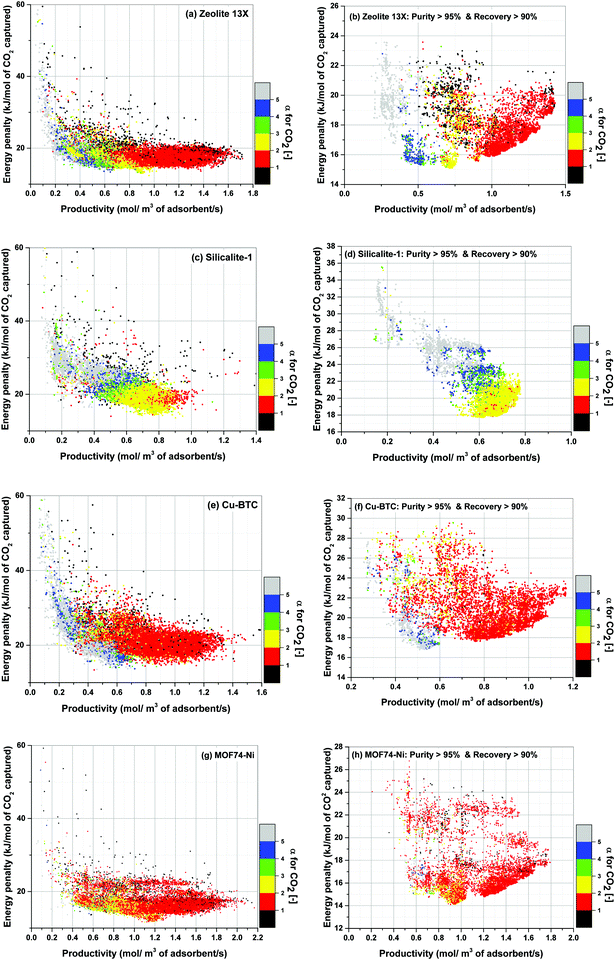
Using the above definition, we calculate α for all process configurations simulated during optimization of each material. The results show gradual evolution of α as process optimization is progressed towards position of the converged Pareto fronts. This is demonstrated in Fig. 15 where distinct colour grouping shows process-evolution of parameter α.
Fig. 15(a), (c), (e) and (g) clearly show that as productivity of the system increases, α switches from one colour band to another colour band starting with the grey band at the lowest productivities (α > 5). It then progresses towards higher values of productivity following the illustrated trend: blue (4 < α < 5), green (3 < α < 4), yellow (2 < α < 3) and red (1 < α < 2). Although there are some overlapping areas between different colour bands, the trend described above remains generally valid for all four materials studied here which is particularly evident for the case of Zeolite 13X (Fig. 15(a)), Silicalite-1 (Fig. 15(c)) and Cu-BTC (Fig. 15(e)).
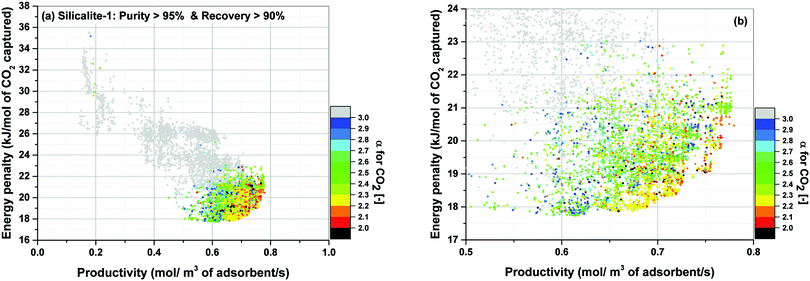
For the location of Pareto fronts, we need to look at the subsets of the process configurations whose purity and recovery are greater than 95% and 90% respectively which are shown in Fig. 15(b), (d), (f) and (h). It is evident in these figures that, except for Silicalite-1, Pareto fronts of all other materials fall within the red band where 1 < α < 2. If resolution of the colour grouping scheme is increased (Fig. 16), we will notice that even for the case of Silicalite-1, α is predominantly located within 2.0 < α < 2.3 which is essentially in the vicinity of the red band.
Therefore, it can be reasonably concluded that parameter α is always between 1.0 and 2.3 at points located on the Pareto front for all the materials studied here. The significance of this observation will be more obvious when we notice that α actually varies within a much wider range of values throughout process optimization for each material (e.g. from 0.01 to 269). Although this is not easily detectable from Fig. 15, it can be seen in a histogram provided in Fig. S7 of the ESI.†
The process-evolution of parameter α and its grouping behaviour as reported in this study is quite important for materials screening, considering it provides a material-independent correlation between some of the process variables, which can be then used to guess the approximate location of the Pareto fronts without the need for performing expensive brute-force optimizations. In other words, if one can demonstrate that α always lies within a narrow range of values for a large group of materials, it would be relatively easy to guide process optimizer to solely explore the optimization space within that narrow range to search for the position of a converged Pareto front, which will be otherwise a computationally expensive task. For instance, the proposed α value can be implemented as a constraint in the process optimization to limit variation of flow rate, pellet size and pellet porosity beyond certain values.
The analysis presented in this study reveals the correlation between pellet size, pellet porosity and convective flow rate, however it is not a substitute for a more in-depth investigation on the relationships between other decision variables on the Pareto front. To discover the complex relationships between various process parameters, we will require further understanding of the fundamental processes during the steady-state PSA/VSA cycle operation, which could be aided by the novel machine-learning techniques.28,53,78 Ultimately, revealing the hidden relationships between the process parameters can be exploited for reducing the dimensionality of the optimization space, and to develop more efficient optimization algorithms. This will be pursued in our future studies.
4. Conclusion
Practical implementation of self-sufficient and fully in silico multiscale workflows for performance-based screening of porous materials requires (a) accurate calculation of various properties of materials some of which are poorly estimated so far (e.g. specific heat capacity), (b) consistent treatment of the process variables that cannot be estimated from molecular simulations but are crucial for process modelling (e.g. pellet size, pellet porosity); and (c) computational efficiency of the workflow to be able to scan through a significant number of materials and process configurations. In this paper, we attempted to explore these issues and highlight their importance by:(1) Analysis of the sensitivity of the process performance to the variation of specific heat capacity of adsorbent materials.
(2) Including pellet size and pellet porosity as additional decision variables in the process optimization and monitoring the response of the process to this new flexibility.
(3) Proposing new universal metrics to search for the approximate position of the Pareto front without the need for brute force optimization; hence, potentially, reducing the computational requirements of process optimization.
In the following, we summarize our findings for each of the above investigations:
Specific heat capacity: one particular property that is important for accurate implementation of non-isothermal VSA models is specific heat capacity of adsorbent materials. We investigated sensitivity of process performance to variation of this property and showed that the current practices in the use of empirical proxy values for Cp reduce the accuracy of performance-based materials rankings. This is likely to be a particular issue for a large database of chemically and structurally diverse materials whose energy-productivity Pareto fronts can be very close to each other; thus higher screening accuracies are required. We therefore propose to adopt more reliable computational techniques for estimation of adsorbents heat capacity (e.g. phonon analysis method). In our future publication, we will implement first-principles methods into our multiscale screening workflow to reliably estimate specific heat capacity of porous materials and improve accuracy of our materials ranking.
Pellet size and porosity: we proposed to treat size and porosity of adsorbent pellets as two additional decision variables for optimization of VSA processes, considering they cannot be calculated from molecular simulations. With the pellet size and pellet porosity being treated as decision variables, several avenues to achieve a better separation performance become available to the process optimizer: by increasing the pellet porosity, reducing the pellet size and some combinations of these factors in conjunction with other decision variables. We argue that optimal values of pellet size and pellet porosity correspond to a complex trade-off between efficient mass transfer into the pellets, pressure drop and convective flow rate across the bed. Not only we showed that simultaneous optimization of pellet size and pellet porosity significantly improves process performance, we also suggested that simultaneous optimization of these two parameters is essential for consistent ranking of porous materials. Our results demonstrate that the ranking of materials according to the limiting Pareto fronts (with fixed pellet size and pellet porosity) is different compared to the ranking obtained from simulations optimization of these two parameters. We showed that upon optimization, we arrive to pellet porosities which are quite higher compared to the conventionally accepted values, reflecting the current industrial practices that are governed by the factors of mechanical stability of the pellets in cyclic processes. This, however, poses an interesting new question. Can performance of materials in PSA/VSA processes be improved by creating more sparse adsorbents with better mechanical stability (e.g. structured adsorbents)? The answer to this question will depend on the economic incentives and the availability of new technologies (e.g. 3D printing) to produce new generations of novel adsorbents79,80 such as monoliths and shaped adsorbent materials (granulated MOF81,82) which are designed to enhance process performance (enhanced mass transfer, reduced pressure drop, improved thermal management), while increasing physical stability of adsorbents.83–85
Efficiency of multiscale workflows: process optimization is one of the most computationally demanding elements of a multiscale workflow for performance-based materials screening. Efficiency of process optimization can be largely improved, if it could be demonstrated that optimal values of different process variables on the energy-productivity Pareto front are universal for all materials or at least within a group of materials which are being investigated. For this, we looked into universality of pellet size and pellet porosity across four different materials and showed that size and porosity of adsorbent pellets for all of these materials fall within a more or less similar range of values on the Pareto fronts, which can be used to guide the search for optimal process conditions. We showed that the Pareto fronts, resulting from optimization of ten decision variables (including size and porosity of pellets), reflect some trade-offs between the tendency of the process to search for better mass-transfer conditions (higher porosity, smaller pellet size) and the counteracting factors associated with the pressure drop and cycle frequency. We proposed that this trade-offs can be effectively captured in a dimensionless parameter (i.e. parameter α) related to the diffusional- and convection-time constants. Although the current investigation is only limited to four materials, the preliminary results are promising. The proposed dimensionless parameter tends to take a narrow range of values on the Pareto fronts for all four materials considered in this study. Considering effects of several competing mechanisms including mass-transfer, convective flow rate and pressure drop are simultaneously realized through this dimensionless parameter, it can be used to more efficiently search for the location of the Pareto fronts in high-throughput materials screening in which materials are ranked based on the position of their energy-productivity trade-off curves. Our study also highlights importance of new investigations focused on decoding the complex relationships between various process variables in expediting process optimization and materials screening. This branch of study can particularly benefit from the fast evolving machine learning techniques.
In this article, we discussed that the reason behind universality of our dimensionless parameter α is the special behaviour of the 4-step VSA-LPP cycle in which process optimizer drives the system to operate with relatively low working capacities along somewhat linear portions of the adsorption isotherm. If working capacity of the process was to be improved, more complex cycle configurations would be required which would be associated with higher capital costs. To date, the community working on high-throughput screening of porous materials has been predominantly focused on the intrinsic physiochemical properties of the adsorbents, such as adsorption isotherms, selectivity, Henry's constant, etc. However, our investigations show that the actual process, its efficiency and productivity depend on a multitude of factors, with only a subset of them being related to the properties of the materials. This very important observation leads to a rather philosophical conclusion in which we can no longer state superiority of one material over the other solely based on its intrinsic characteristics, but we can only attempt to find promising materials for a particular separation process, in a particular process configuration, and under very well-defined operating assumptions.
Conflicts of interest
There are no conflicts to declare.Acknowledgements
This work has been supported by the UK Engineering and Physical Sciences Research Council (EPSRC), grant EP/N007859/1. The project has made use of the computational resources provided by the Edinburgh Compute and Data Facility (ECDF) (http://www.ecdf.ed.ac.uk/). We thank Dr Shreenath Krishnamurthy for sharing the results of his measurements for specific heat capacity of MOF74-Ni.References
- J. Kim, M. Abouelnasr, L.-C. Lin and B. Smit, J. Am. Chem. Soc., 2013, 135, 7545–7552 CrossRef CAS PubMed.
- A. Mace, S. Barthel and B. Smit, J. Chem. Theory Comput., 2019, 15, 2127–2141 CrossRef CAS PubMed.
- W. Sun, L.-C. Lin, X. Peng and B. Smit, AIChE J., 2014, 60, 2314–2323 CrossRef CAS.
- C. E. Wilmer, M. Leaf, C. Y. Lee, O. K. Farha, B. G. Hauser, J. T. Hupp and R. Q. Snurr, Nat. Chem., 2012, 4, 83–89 CrossRef CAS PubMed.
- P. Ryan, O. K. Farha, L. J. Broadbelt and R. Q. Snurr, AIChE J., 2011, 57, 1759–1766 CrossRef CAS.
- N. Chandrasekhar and D. S. Sholl, J. Phys. Chem. C, 2015, 119, 26319–26326 CrossRef CAS.
- H. Fang, A. Kulkarni, P. Kamakoti, R. Awati, P. I. Ravikovitch and D. S. Sholl, Chem. Mater., 2016, 28, 3887–3896 CrossRef CAS.
- P. Canepa, C. A. Arter, E. M. Conwill, D. H. Johnson, B. A. Shoemaker, K. Z. Soliman and T. Thonhauser, J. Mater. Chem. A, 2013, 1, 13597–13604 RSC.
- H. Bae, M. Park, B. Jang, Y. Kang, J. Park, H. Lee, H. Chung, C. Chung, S. Hong, Y. Kwon, B. I. Yakobson and H. Lee, Sci. Rep., 2016, 6, 21788 CrossRef CAS PubMed.
- A. N. Dickey, A. Ö. Yazaydın, R. R. Willis and R. Q. Snurr, Can. J. Chem. Eng., 2012, 90, 825–832 CrossRef CAS.
- J. M. Huck, L.-C. Lin, A. H. Berger, M. N. Shahrak, R. L. Martin, A. S. Bhown, M. Haranczyk, K. Reuter and B. Smit, Energy Environ. Sci., 2014, 7, 4132–4146 RSC.
- L.-C. Lin, A. H. Berger, R. L. Martin, J. Kim, J. A. Swisher, K. Jariwala, C. H. Rycroft, A. S. Bhown, M. W. Deem, M. Haranczyk and B. Smit, Nat. Mater., 2012, 11, 633–641 CrossRef CAS PubMed.
- Z. Qiao, K. Zhang and J. Jiang, J. Mater. Chem. A, 2016, 4, 2105–2114 RSC.
- V. Subramanian Balashankar and A. Rajendran, ACS Sustainable Chem. Eng., 2019, 7, 17747–17755 CrossRef CAS.
- C. Y. Lau, M. T. Dunstan, W. Hu, C. P. Grey and S. A. Scott, Energy Environ. Sci., 2017, 10, 818–831 RSC.
- C. E. Wilmer, O. K. Farha, Y.-S. Bae, J. T. Hupp and R. Q. Snurr, Energy Environ. Sci., 2012, 5, 9849–9856 RSC.
- M. Khurana and S. Farooq, Ind. Eng. Chem. Res., 2016, 55, 2447–2460 CrossRef CAS.
- J. Park, R. P. Lively and D. S. Sholl, J. Mater. Chem. A, 2017, 5, 12258–12265 RSC.
- K. T. Leperi, Y. G. Chung, F. You and R. Q. Snurr, ACS Sustainable Chem. Eng., 2019, 7, 11529–11539 CrossRef CAS.
- D. Danaci, M. Bui, N. Mac Dowell and C. Petit, Mol. Syst. Des. Eng., 2020, 5, 212–231 RSC.
- A. K. Rajagopalan, A. M. Avila and A. Rajendran, Int. J. Greenhouse Gas Control, 2016, 46, 76–85 CrossRef CAS.
- A. Nalaparaju, M. Khurana, S. Farooq, I. A. Karimi and J. W. Jiang, Chem. Eng. Sci., 2015, 124, 70–78 CrossRef CAS.
- A. H. Farmahini, S. Krishnamurthy, D. Friedrich, S. Brandani and L. Sarkisov, Ind. Eng. Chem. Res., 2018, 57, 15491–15511 CAS.
- C. R. Groom, I. J. Bruno, M. P. Lightfoot and S. C. Ward, Acta Crystallogr., Sect. B: Struct. Sci., Cryst. Eng. Mater., 2016, 72, 171–179 CrossRef CAS PubMed.
- Y. G. Chung, J. Camp, M. Haranczyk, B. J. Sikora, W. Bury, V. Krungleviciute, T. Yildirim, O. K. Farha, D. S. Sholl and R. Q. Snurr, Chem. Mater., 2014, 26, 6185–6192 CrossRef CAS.
- C. Baerlocher and L. B. McCusker, Database of Zeolite Structures, International Zeolite Association.
- S. G. Subraveti, K. N. Pai, A. K. Rajagopalan, N. S. Wilkins, A. Rajendran, A. Jayaraman and G. Alptekin, Appl. Energy, 2019, 254, 113624 CrossRef CAS.
- S. G. Subraveti, Z. Li, V. Prasad and A. Rajendran, Ind. Eng. Chem. Res., 2019, 58, 20412–20422 CrossRef CAS.
- K. T. Leperi, D. Yancy-Caballero, R. Q. Snurr and F. You, Ind. Eng. Chem. Res., 2019, 58, 18241–18252 CrossRef CAS.
- J. Wieme, S. Vandenbrande, A. Lamaire, V. Kapil, L. Vanduyfhuys and V. Van Speybroeck, ACS Appl. Mater. Interfaces, 2019, 11, 38697–38707 CrossRef CAS PubMed.
- F. A. Kloutse, R. Zacharia, D. Cossement and R. Chahine, Microporous Mesoporous Mater., 2015, 217, 1–5 CrossRef CAS.
- B. Mu and K. S. Walton, J. Phys. Chem. C, 2011, 115, 22748–22754 CrossRef CAS.
- L.-F. Song, C.-H. Jiang, J. Zhang, L.-X. Sun, F. Xu, W.-S. You, Y. Zhao, Z.-H. Zhang, M.-H. Wang, Y. Sawada, Z. Cao and J.-L. Zeng, J. Therm. Anal. Calorim., 2010, 100, 679–684 CrossRef CAS.
- A. Togo and I. Tanaka, Scr. Mater., 2015, 108, 1–5 CrossRef CAS.
- J. K. Bristow, J. M. Skelton, K. L. Svane, A. Walsh and J. D. Gale, Phys. Chem. Chem. Phys., 2016, 18, 29316–29329 RSC.
- V. Kapil, J. Wieme, S. Vandenbrande, A. Lamaire, V. Van Speybroeck and M. Ceriotti, J. Chem. Theory Comput., 2019, 15, 3237–3249 CrossRef CAS PubMed.
- Y. Liu, J. Liu and Y. S. Lin, Microporous Mesoporous Mater., 2015, 214, 242–245 CrossRef CAS.
- C. Campbell, C. A. Ferreiro-Rangel, M. Fischer, J. R. B. Gomes and M. Jorge, J. Phys. Chem. C, 2017, 121, 441–458 CrossRef CAS.
- A. L. Dzubak, L.-C. Lin, J. Kim, J. A. Swisher, R. Poloni, S. N. Maximoff, B. Smit and L. Gagliardi, Nat. Chem., 2012, 4, 810 CrossRef CAS PubMed.
- R. Mercado, B. Vlaisavljevich, L.-C. Lin, K. Lee, Y. Lee, J. A. Mason, D. J. Xiao, M. I. Gonzalez, M. T. Kapelewski, J. B. Neaton and B. Smit, J. Phys. Chem. C, 2016, 120, 12590–12604 CrossRef CAS.
- E. Haldoupis, J. Borycz, H. Shi, K. D. Vogiatzis, P. Bai, W. L. Queen, L. Gagliardi and J. I. Siepmann, J. Phys. Chem. C, 2015, 119, 16058–16071 CrossRef CAS.
- T. M. Becker, J. Heinen, D. Dubbeldam, L.-C. Lin and T. J. H. Vlugt, J. Phys. Chem. C, 2017, 121, 4659–4673 CrossRef CAS PubMed.
- J. Borycz, L.-C. Lin, E. D. Bloch, J. Kim, A. L. Dzubak, R. Maurice, D. Semrouni, K. Lee, B. Smit and L. Gagliardi, J. Phys. Chem. C, 2014, 118, 12230–12240 CrossRef CAS.
- T. M. Becker, L.-C. Lin, D. Dubbeldam and T. J. H. Vlugt, J. Phys. Chem. C, 2018, 122, 24488–24498 CrossRef CAS PubMed.
- D. Dubbeldam, S. Calero, D. E. Ellis and R. Q. Snurr, Mol. Simul., 2016, 42, 81–101 CrossRef CAS.
- L. Joos, J. A. Swisher and B. Smit, Langmuir, 2013, 29, 15936–15942 CrossRef CAS PubMed.
- N. D. Hutson, B. A. Reisner, R. T. Yang and B. H. Toby, Chem. Mater., 2000, 12, 3020–3031 CrossRef CAS.
- V. Bojan and P. L. Alexander, Modell. Simul. Mater. Sci. Eng., 2016, 24, 045002 CrossRef.
- D. Friedrich, M.-C. Ferrari and S. Brandani, Ind. Eng. Chem. Res., 2013, 52, 8897–8905 CrossRef CAS.
- S. Krishnamurthy, V. R. Rao, S. Guntuka, P. Sharratt, R. Haghpanah, A. Rajendran, M. Amanullah, I. A. Karimi and S. Farooq, AIChE J., 2014, 60, 1830–1842 CrossRef CAS.
- M. Khurana and S. Farooq, Chem. Eng. Sci., 2016, 152, 507–515 CrossRef CAS.
- A. C. Hindmarsh, P. N. Brown, K. E. Grant, S. L. Lee, R. Serban, D. E. Shumaker and C. S. Woodward, ACM Trans. Math. Softw., 2005, 31, 363–396 CrossRef.
- J. Beck, D. Friedrich, S. Brandani and E. S. Fraga, Comput. Chem. Eng., 2015, 82, 318–329 CrossRef CAS.
- W. Dang, D. Friedrich and S. Brandani, Chem. Eng. Sci., 2019, 115423, DOI:10.1016/j.ces.2019.115423.
- D. Friedrich, E. Mangano and S. Brandani, Chem. Eng. Sci., 2015, 126, 616–624 CrossRef CAS.
- J. A. A. Gibson, E. Mangano, E. Shiko, A. G. Greenaway, A. V. Gromov, M. M. Lozinska, D. Friedrich, E. E. B. Campbell, P. A. Wright and S. Brandani, Ind. Eng. Chem. Res., 2016, 55, 3840–3851 CrossRef CAS.
- R. Haghpanah, A. Majumder, R. Nilam, A. Rajendran, S. Farooq, I. A. Karimi and M. Amanullah, Ind. Eng. Chem. Res., 2013, 52, 4249–4265 CrossRef CAS.
- X. Hu, E. Mangano, D. Friedrich, H. Ahn and S. Brandani, Adsorption, 2014, 20, 121–135 CrossRef CAS.
- T. J. Giesy, Y. Wang and M. D. LeVan, Ind. Eng. Chem. Res., 2012, 51, 11509–11517 CrossRef CAS.
- S. Krishnamurthy, R. Blom, M. C. Ferrari and S. Brandani, Adsorption, 2019 DOI:10.1007/s10450-019-00162-x.
- J. C. Abanades, B. Arias, A. Lyngfelt, T. Mattisson, D. E. Wiley, H. Li, M. T. Ho, E. Mangano and S. Brandani, Int. J. Greenhouse Gas Control, 2015, 40, 126–166 CrossRef CAS.
- D. M. Ruthven, Principles of Adsorption and Adsorption Processes, John Wiley & Sons, 1984 Search PubMed.
- D. Hadka, Platypus – Multiobjective Optimization in Python, http://github.com/Project-Platypus/Platypus.
- K. Deb and H. Jain, IEEE Trans. Evol. Comput., 2014, 18, 577–601 Search PubMed.
- L. Estupiñan Perez, P. Sarkar and A. Rajendran, Sep. Purif. Technol., 2019, 224, 553–563 CrossRef.
- S. Brandani, E. Mangano and L. Sarkisov, Adsorption, 2016, 22, 261–276 CrossRef CAS.
- A. K. Rajagopalan and A. Rajendran, Int. J. Greenhouse Gas Control, 2018, 78, 437–447 CrossRef CAS.
- M. Khurana and S. Farooq, AIChE J., 2017, 63, 2987–2995 CrossRef CAS.
- B. Silva, I. Solomon, A. M. Ribeiro, U. H. Lee, Y. K. Hwang, J.-S. Chang, J. M. Loureiro and A. E. Rodrigues, Sep. Purif. Technol., 2013, 118, 744–756 CrossRef CAS.
- M. G. Plaza, A. M. Ribeiro, A. Ferreira, J. C. Santos, U. H. Lee, J.-S. Chang, J. M. Loureiro and A. E. Rodrigues, Sep. Purif. Technol., 2012, 90, 109–119 CrossRef CAS.
- G. K. Johnson, I. R. Tasker, D. A. Howell and J. V. Smith, J. Chem. Thermodyn., 1987, 19, 617–632 CrossRef CAS.
- D. Schawe, Doctor of Engineering (Dr Ing.), University of Stuttgart, 2001.
- E. Glueckauf, Trans. Faraday Soc., 1955, 51, 1540–1551 RSC.
- G. Ye, X. Duan, K. Zhu, X. Zhou, M.-O. Coppens and W. Yuan, Chem. Eng. Sci., 2015, 132, 108–117 CrossRef CAS.
- J. M. P. Q. Delgado, Heat Mass Transfer, 2006, 42, 279–310 CrossRef CAS.
- S. O. Rastegar and T. Gu, J. Chromatogr. A, 2017, 1490, 133–137 CrossRef CAS PubMed.
- D. M. Ruthven, S. Farooq and K. S. Knaebel, Pressure Swing Adsorption, John Wiley & Sons, New York, 1993 Search PubMed.
- F. Ye, S. Ma, L. Tong, J. Xiao, P. Bénard and R. Chahine, Int. J. Hydrogen Energy, 2019, 44, 5334–5344 CrossRef CAS.
- F. Rezaei and P. Webley, Sep. Purif. Technol., 2010, 70, 243–256 CrossRef CAS.
- F. Rezaei and P. Webley, Chem. Eng. Sci., 2009, 64, 5182–5191 CrossRef CAS.
- J. Ren, N. M. Musyoka, H. W. Langmi, A. Swartbooi, B. C. North and M. Mathe, Int. J. Hydrogen Energy, 2015, 40, 4617–4622 CrossRef CAS.
- A. H. Valekar, K.-H. Cho, U. H. Lee, J. S. Lee, J. W. Yoon, Y. K. Hwang, S. G. Lee, S. J. Cho and J.-S. Chang, RSC Adv., 2017, 7, 55767–55777 RSC.
- S. A. Moggach, T. D. Bennett and A. K. Cheetham, Angew. Chem., Int. Ed., 2009, 48, 7087–7089 CrossRef CAS.
- K. W. Chapman, G. J. Halder and P. J. Chupas, J. Am. Chem. Soc., 2009, 131, 17546–17547 CrossRef CAS PubMed.
- L. R. Redfern, L. Robison, M. C. Wasson, S. Goswami, J. Lyu, T. Islamoglu, K. W. Chapman and O. K. Farha, J. Am. Chem. Soc., 2019, 141, 4365–4371 CrossRef CAS.
Footnotes |
| † Electronic supplementary information (ESI) available. See DOI: 10.1039/c9ee03977e |
| ‡ Specific heat capacity of pelletized MOF74-Ni measured by Krishnamurthy et al.60 using the thermogravimetric differential scanning calorimetry (TGA-DSC) method. We obtained this information through direct communication with the authors, although they have not reported this value in their recent publication. |
| This journal is © The Royal Society of Chemistry 2020 |

