 Open Access Article
Synthesis and structural, electrochemical and photophysical studies of triferrocenyl-substituted 1,3,5-triphenylbenzene: a cyan-light emitting molecule showing aggregation-induced enhanced emission†
Artur
Kasprzak
 *a,
Piotr A.
Guńka
 a,
Agata
Kowalczyk
 b and
Anna M.
Nowicka
 b
b
aFaculty of Chemistry, Warsaw University of Technology, Noakowskiego Str. 3, 00-664 Warsaw, Poland. E-mail: akasprzak@ch.pw.edu.pl
bFaculty of Chemistry, University of Warsaw, Pasteura Str. 1, 02-093 Warsaw, Poland
First published on 7th October 2020
Abstract
Triferrocenyl-substituted 1,3,5-triphenylbenzene was successfully synthesized in high yield. Single-crystal X-ray diffraction experiments revealed that the internal rotations of the ferrocenyl moieties are significantly restricted in the solid phase and that there are no significant π stacking interactions therein. The photoluminescence of the crystals is essentially the same as that of dilute chloroform solutions. However, studies of this cyan-light emitting substance in mixtures of chloroform and methanol revealed the aggregation-induced enhanced emission (AIEE) feature that boosts its fluorescence quantum yield from 13% up to 74%. We demonstrate the AIEE effect for a new class of easy-to-prepare aromatic molecules containing several metallocene units for the first time.
Introduction
Metallocene-tethered aromatic molecules constitute an interesting class of compounds commonly featuring beneficial physicochemical features. Ferrocene (Fc) is one of the most intensively studied metallocenes in terms of the design of functional organic materials, because of its air stability, good electronic properties and wide range of possible chemical modifications.1 Additionally, Fc-conjugated fused aromatic compounds can be used as functional organic molecules, like organic receptors2 or (pro)drugs.3 The synthesis of molecules bearing several Fc moieties has been widely investigated over the years. The reports deal with the preparation of, e.g., fluorene4a or biphenyl4b derivatives, Fc-based dendrimer-shaped molecules,4c,d Fc-templated macrocycles4e,f or cage compounds.4g,h The research works showed that the installation of several Fc moieties into the aromatic backbone may enable tuning the physicochemical properties of the molecule and its functions. For instance, the presence of Fc substituents boosted the light absorption of an aromatic dendrimer4d or multicharged methylium compounds.4cAggregation-induced effects constitute interesting photophysical features that are important for the design of new, efficient light-emitting systems. In particular, the aggregation-induced enhanced emission (AIEE) effect is a unique phenomenon that enables one to boost the fluorescence quantum yields of light-emitting compounds.5,6 In general, the AIEE effect originates from the paradigm that some specific luminophores might exhibit higher light-emission features in the form of aggregates in comparison with a well-dispersed solution state. The AIEE effect is commonly induced by varying the ratio between a good and poor solvent; if some specific aggregates are formed, the changes in the emission spectra of the studied compound shall be observed. The AIEE phenomena were reported to date for various aromatic systems, including buckybowl-shaped molecules,7a,b pyrrole derivatives,7c,d triphenylamine derivatives,7e aromatic Schiff bases7f or some ruthenium complexes.7g 1,3,5-Triphenylbenzene moiety, a π-electron rich system, is one of the most explored aromatic skeletons employed for the construction of molecules exhibiting interesting photophysical properties, including aggregation-induced effects.8 One may state that the factors influencing the wide use of the 1,3,5-triphenylbenzene motif for the construction of luminescent probes, beyond satisfactory fluorescence quantum yields for such systems, are its thermal and photophysical stabilities, as well as the possibility to functionalize the aromatic skeleton with various functional groups.
However, to the best of our knowledge, the reports dealing with the aggregation-induced effects with Fc derivatives are still sparse, since this effect was reported only for (i) mono-ferrocenyl imines derived from 2-hydroxyaniline and 4-nitrohyroxyaniline5a or (ii) mono-ferrocenyl ester of coumarin derivatives.5b Herein, we investigated the synthesis, structural and photophysical features of newly synthesized triferrocenyl-substituted 1,3,5-triphenylbenzene. We found that this easy-to-synthesize compound is especially attractive from the viewpoint of organic electronics, since it exhibits efficient cyan-light emission that can be further enhanced by the aggregation effect. To the best of our knowledge, the AIEE effect has not been reported to date for Fc-functionalized C3-symmetric aromatics.
Experimental section
Materials and methods
Chemical reagents and solvents were commercially purchased and purified according to the standard methods, if necessary. The NMR experiments were carried out using a Varian VNMRS 500 MHz spectrometer (1H NMR at 500 MHz or 13C NMR at 125 MHz) equipped with a multinuclear z-gradient inverse probe head. Unless otherwise stated, the spectra were recorded at 25 °C. Standard 5 mm NMR tubes were used. 1H and 13C chemical shifts (δ) were reported in parts per million (ppm) relative to the solvent signal: CDCl3, δH (residual CHCl3) 7.26 ppm and δC 77.2 ppm. NMR spectra were analyzed with the MestReNova v12.0 software (Mestrelab Research S.L). The Fourier-transform infrared (FT-IR) spectra were recorded in the attenuated total reflectance (ATR) mode using a Thermo Nicolet Avatar 370 spectrometer with a spectral resolution of 2 cm−1 (100 scans). The wavenumbers for the absorption band ν were reported in cm−1. The UV-vis and PL measurements were performed using a Cytation 3 Cell Multi-Mode Reader (BioTek Instruments, Inc.) with the spectral resolution of 1 nm. For the UV-vis and PL measurements, the wavelengths for the absorption or emission maxima λmax were reported in nm. TOF-HRMS (ESI) measurements were performed using a Q-Exactive ThermoScientific spectrometer. The melting point was determined on a Stanford Research Systems MPA 100 and was uncorrected. Dynamic light scattering (DLS) measurements were performed using a Malvern Zetasizer instrument.Powder X-ray diffraction measurements were carried out at room temperature using a Bruker D8 Advance diffractometer equipped with a position-sensitive LYNXEYE detector and a Cu sealed tube (λ = 1.5418 Å). Diffraction patterns were recorded in the Bragg–Brentano horizontal geometry from 5° to 30° (2θ) with steps of 0.03° and 576 s per step. The diffractometer incident beam path was equipped with a 2.5° Soller slit and a 1.14° fixed divergence slit, while the diffracted beam path was equipped with a programmable antiscatter slit (fixed at 2.20°), a Ni β-filter, and a 2.5° Soller slit.
Cyclic voltammetry (CV) was performed in the three-electrode system using an Autolab Eco Chemie potentiostat, model PGSTAT 12. The disc glassy carbon electrode (GC, ϕ = 3 mm, BAS Instruments) was used as a working electrode, an Ag/AgCl/3 M KCl as a reference electrode and a platinum wire as the auxiliary electrode. During all measurements, to minimize the electrical noise, the electrochemical cell was kept in a Faraday cage. The measurements were carried out with deoxygenated solutions.
The microscopic observations were performed using a FESEM Merlin (Zeiss Germany) with an Inlens secondary electron detector. Evaporation of the metallic ultrathin layer was done using an SC7620 Mini Sputter Coater/Glow Discharge System Quorum (England) using an Au–Pd alloy target. The average thickness of the sputtered layer was a few nm. All images were taken at a low EHT of 3 kV.
1,3,5-Tris(4-aminophenyl)benzene was synthesized in two steps according to the literature procedure.4h
Synthesis of triferrocenyl-substituted 1,3,5-triphenylbenzene (3)
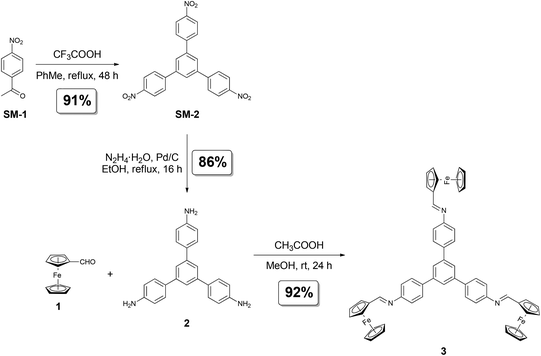
A solution of ferrocenecarboxaldehyde (Fc-CHO, 1; 97.6 mg, 0.465 mmol, and 400 mol%) and 1,3,5-triphenylbenzene (2; 40.0 mg, 0.114 mmol, and 100 mol%) in methanol (6 mL) was stirred for 5 minutes at room temperature. Glacial acetic acid (50 μL) was added in one portion and the mixture turned turbid within 2 minutes. The reaction mixture was stirred at room temperature for 24 hours. The formed solid was filtered off and washed with methanol (15 mL). The solid residue was suspended in methanol (30 mL), sonicated for 15 minutes at room temperature, filtered off, washed with methanol (5 mL) and then dried at room temperature for 24 hours to give compound 3 (98.5 mg; 92% yield) as an orange solid.Mp: >300 °C; 1H NMR (CDCl3, 500 MHz, ppm), δH 8.49 (s, 3H), 7.89 (s, 3H), 7.82–7.79 (m, 6H), 7.30–7.28 (m, 6H), 4.85–4.84 (m, 6H), 4.50–4.48 (m, 6H), 4.26 (s, 15H); 13C{1H} NMR (CDCl3, 125 MHz, ppm), δC 161.6 (3C), 128.4 (3C), 128.3 (3C), 128.2 (6C), 124.6 (3C), 121.3 (6C), 115.6 (3C), 73.3 (3C), 71.6 (6C), 69.5 (15C), 69.3 (6C); FT-IR (ATR), v 3080, 3025, 2880, 1625, 1590, 1495, 1460, 1180, 1100, 1000, 815 cm−1; TOF-HRMS (ESI): calcd for C57H46Fe3N3 [M + H]+ = 940.1735, found: m/z 940.1710.
Photophysical studies of 3
The UV-vis spectrum of 3 was measured in CHCl3. The concentration of the sample was 2 × 10⁻⁵ M.The PL spectra of 3 were measured in CHCl3 or CHCl3–CH3OH mixtures with different CH3OH volume fractions. The concentrations of the samples were 2 × 10⁻⁶ M. The preparation of the samples for PL spectra measurement in CHCl3–CH3OH solvent systems was as follows. A stock CHCl3 solution of 3 was prepared and an aliquot of the stock solution was transferred to a vial. The poor solvent (CH3OH) was added to furnish the 2 × 10⁻⁶ M mixtures in which the CH3OH volume fractions (fCH3OH) were 0.0–0.9 (for example, fCH3OH = 0.5 stands for the CHCl3![[thin space (1/6-em)]](https://www.rsc.org/images/entities/char_2009.gif) :
:![[thin space (1/6-em)]](https://www.rsc.org/images/entities/char_2009.gif) MeOH volumetric ratio of 50
MeOH volumetric ratio of 50![[thin space (1/6-em)]](https://www.rsc.org/images/entities/char_2009.gif) :
:![[thin space (1/6-em)]](https://www.rsc.org/images/entities/char_2009.gif) 50). These mixtures were shaken (400 rpm) for ca. 2 minutes before the measurement. The fluorescence intensity increased significantly up to 3 minutes, then a slight increase was found up to 5 minutes and finally it reached a constant value up to 24 hours (see Fig. S3, ESI†). Similar trends were reported for other compounds exhibiting the AIEE effect, see for example ref. 7a Note that no decrease in fluorescence intensity after 24 hours indicates the stability of the studied aggregates.
50). These mixtures were shaken (400 rpm) for ca. 2 minutes before the measurement. The fluorescence intensity increased significantly up to 3 minutes, then a slight increase was found up to 5 minutes and finally it reached a constant value up to 24 hours (see Fig. S3, ESI†). Similar trends were reported for other compounds exhibiting the AIEE effect, see for example ref. 7a Note that no decrease in fluorescence intensity after 24 hours indicates the stability of the studied aggregates.
For the estimation of ΦF of 3, the relative method was used.9 The concentration of the samples was 2 × 10⁻⁶ M and the excitation wavelength was 360 nm. Coumarin 15310 was used as a standard. For the calculation of ΦF, the following equation was applied:
Results and discussion
1,3,5-Tris(4-aminophenyl)benzene (2) was obtained in two steps starting from 4-nitroacetophenone (SM-1; Scheme 1). The first reaction step (Scheme 1a) covered the acid-catalyzed cyclization reaction starting from 4-nitroacetophenone (SM-1). The resultant 1,3,5-tris(4-nitrophenyl)benzene (SM-2) was hydrogenated (Scheme 1b) to the corresponding amine-contacting compound 2. The synthesis path to obtain target compound 3 (Scheme 1c) included the imine bond formation reaction between ferrocenecarboxaldehyde (Fc-CHO; 1) and as-obtained C3-symmetric 1,3,5-tris(4-aminophenyl)benzene (2). Efficient (isolated yield of 92%) and chromatography-free isolation of the target compound was achieved; pure 3 was isolated by means of two filtration steps. The second filtration step was preceded by the sonication of crude 3 in methanolic suspension. In the course of our synthetic studies on 3, we have observed that complete removal of unreacted Fc-CHO (1) from the product is the major obstacle, i.e., simply washing the crude product on the filter with an excess of methanol has not yielded pure 3.11 The above-mentioned sonication step was found to be crucial for the complete removal of the unreacted 1. Noteworthy, the method can be considered time-, solvent- and cost-saving as no chromatographic purification is involved. Additionally, in comparison to many reported methods for the synthesis of fused aromatic compounds bearing several Fc moieties,4a–g our synthetic strategy is facile, efficient and easy-to-perform.The formation of the desired product was confirmed by NMR spectroscopy, Fourier-transform infrared spectroscopy (FT-IR) and high resolution mass spectrometry (HRMS).12 It is noteworthy that the 1H NMR spectrum of 313 featured the characteristic peaks coming from the Fc (HCp) and 1,3,5-triphenylbenzene (HAr) moieties, as well as from the imine-type linkers (Himine; δH = 8.49 ppm). Interestingly, the presence of one set of signals (7 peaks in total) suggested that 3 is symmetric in solution (average C3 symmetry). The spectral data indicate that the Fc moieties of 3 might freely rotate around the single-bond axis in the solution. Thus, the major factor standing for the potential average symmetry in solution for 3 in the NMR experiment was the fast rotation of Fc substituents around the single bonds within NMR timescale, which resulted in signal averaging. FT-IR spectrum of 314a featured the characteristic absorption bands originating from the C–H vibrations within Fc moieties (e.g., 815, 1495 cm−1) and C![[double bond, length as m-dash]](https://www.rsc.org/images/entities/char_e001.gif) N vibrations within the imine linkages (1625 cm−1).
N vibrations within the imine linkages (1625 cm−1).
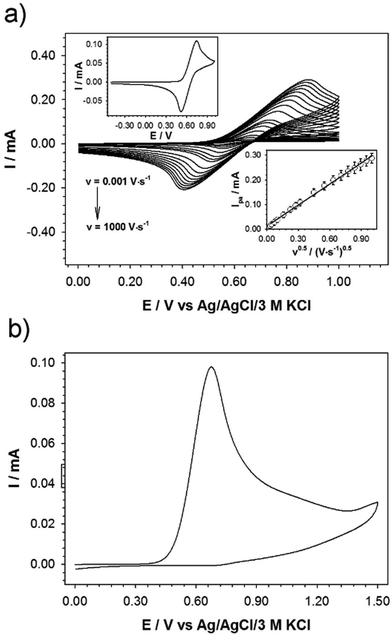
The electrochemical properties of 3 were studied in dichloromethane (DCM) with the addition of excess of supporting electrolyte (γ = 100): tetrabutylammonium hexafluorophosphate (TBAHFP). The studied ferrocene derivative contains three ferrocene moieties; however, the distance of ferrocene units from the central benzene core is large enough that the Fc units are sufficiently remote from one another. Due to the lack of electronic communication between the redox (Fc) units, only one pair of current signals corresponding to the Fe2+/3+ redox couple in the ferrocene molecules is visible in the cyclic voltammogram. The presence of one pair of current signals indicates that three Fc units are equivalent and oxidized or reduced at the same potential. Cyclic voltammograms of the studied compound at glassy carbon electrode were performed at a concentration of 3.4 mM in DCM and at various scan rates ranging from 0.001–1 V s−1 (Fig. 1a). The linear dependence of current signal intensity versus the square root of the scan rate (see bottom inset in Fig. 1a) confirmed the diffusional character of the electrochemical reaction. In general, the peak current of diffusion controlled reversible or quasi-reversible electrochemical reaction follows the Randles–Sevcik equation:14b
 is the concentration of the electroactive species and v is the scan rate of voltammograms. From the slope of the plot Ipa = f(v0.5), the diffusion coefficient for the studied ferrocene derivative was determined and equalled 7.16 × 10⁻⁷ cm2 s−1. Diffusion coefficient is the electrochemical parameter describing the diffusional transport for the species that are involved in the electrochemical process. The diffusion coefficient values of 3 and native Fc (7.72 × 10⁻⁵ cm2 s−1)14c are similar which means that the 1,3,5-triphenylbenzene skeleton does not affect significantly the mobility of Fc units in this derivative. In turn, from the intercept of the dependences ln(Ipa) = f(Epa − Ef), the electron-transfer rate constant (k0 = 2.69 × 10⁻⁴ cm s−1) was determined according to the formula:
where Ipa is a current intensity of the anodic peak, n is the number of electrons exchanged during the electrode process, F is the Faraday constant, A is the electrode surface area,
 is the concentration of the electroactive species, Epa is the potential of the anodic peak, Ef is the formal potential, R is the gas constant, T is the temperature and α is the transition coefficient.
Due to the electrophilic nature, the imine bond can be broken relatively easily, e.g. by applying given oxidants or too high potential. The stability of the imine bond was checked electrochemically. The electrode surface was modified with the 3 solution (3.40 mM with 340 mM TBAHFP) by placing the 7 μL-droplet and left to dry. Then the cyclic voltammogram was recorded in the pure electrolyte solution in DCM (see Fig. 1b). The absence of the reduction peak confirmed that the ferrocene units were removed from the layer at the electrode surface.
Single crystals of compound 3 suitable for single-crystal X-ray diffraction were grown after numerous attempts from a mixture of methylene chloride and acetonitrile.15 The compound tends to grow from CHCl3 solutions in the form of intergrown needles that are too small for successful single-crystal X-ray diffraction structural determination. Compound 3 crystallizes in the monoclinic P21/c space group with one molecule in the asymmetric unit (see Fig. 2 for molecular structure and atom numbering scheme). The molecule exhibits the symmetry of the C1 point group in the solid state which is lower than that in the solution. This indicates that the internal rotations are restricted in the solid state and the molecules adopt such a conformation as to maximize packing and intermolecular interactions energy in the crystal. The bridging phenylene moieties are twisted out of the plane of the central benzene ring more significantly than in an analogous cage4h in which all cyclopentadienyl rings are fastened together by two stacked 1,3,5-triphenylbenzene moieties. This is evidenced by the values of torsion angles of +27.5(11)° (C9–C10–C13–C14), −48.3(12)° (C36–C31–C17–C18) and −32.4(11)° (C24–C19–C15–C16) that are significantly higher than in the latter compound: +21.4(3)°.4h This twist is a balance between avoiding the steric clash of hydrogen atoms and maximizing the packing in the crystalline state. The analysis of the crystal structure indicates that there are no significant directional interactions including π stacking between neighboring molecules. The two crystals that were big enough to diffract X-rays reasonably were both twinned and the twin law found was 180° rotation around the [100]* direction in the reciprocal space. The analysis of crystal morphology, crystal structure and the twin law allowed us to conclude that the weakest interactions in the structure occur between the layers parallel to the (100) lattice planes and this leads to twinning. We propose the composition plane to be perpendicular to the twin axis and illustrate it in Fig. S8.†
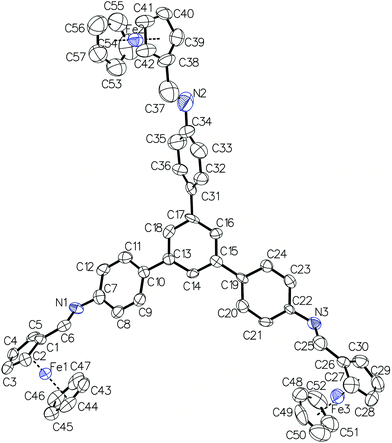 | ||
| Fig. 2 Molecular structure of 3 with atom numbering scheme. Thermal ellipsoids are drawn at 50% probability level and hydrogen atoms are omitted for clarity. | ||
The photophysical properties of 3 were studied with UV-vis and photoluminescence (PL) spectroscopy. UV-vis spectroscopy revealed two absorption maxima originating from the presence of two structural motifs in 3 in CHCl3 solution, namely 1,3,5-triphenylbenzene (λabs = 260 nm) and Fc (λabs = 350 nm, overlapping the absorption band of imine moiety; see Fig. S9†).16 The spectra of 3 in diluted CHCl3 solution (2 × 10⁻⁵ M) and the solid state are very similar with a small red-shift in the absorption maximum of the 1,3,5-triphenylbenzene moiety which may be caused by hindered intramolecular rotations in the solid state.
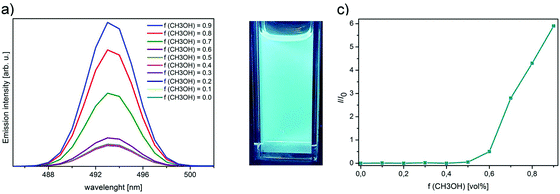
PL spectroscopy provided an insight into the light emission features of 3. Cyan-light emission with 3 was observed in CHCl3 solution (λem = 493 nm; excitation wavelength (λex) 360 nm;17Fig. 3a). A hypsochromic shift for 3 in comparison with parent 1,3,5-triphenylbenzene (λem = 354 nm)19 was ascribed to the π-conjugation, resulting from the presence of Fc moiety, an electron-rich aromatic system. The fluorescence quantum yield (ΦF) of 3, estimated by the relative method, equalled 13% (Table 1, entry 1).18 For comparison, ΦF for the unsubstituted 1,3,5-triphenylbenzene equals to ca. 10%.19 These values suggest that linking Fc with the 1,3,5-triphenylbenzene backbone with imine bonds did not result in a significant increase in ΦF value. The PL spectra of crystals and that of a diluted CHCl3 solution of 3 (2 × 10⁻⁶ M) are very similar which confirms our conclusion from the X-ray diffraction study that there are no significant π stacking interactions between the molecules of 3 in the crystal (see Fig. S1†). Had there been significant π stacking interactions in the crystal, we would have observed PL quenching due to ACQ (aggregation-caused quenching).6a Nonetheless, the increasing concentration of 3 in CHCl3 solutions does lead to significant π stacking interactions between molecules of 3 as evidenced by the quenching of PL (see Fig. S2†).
| Entry | f CH3OH | Φ F |
|---|---|---|
| a Estimated by the relative method. | ||
| 1 | 0.0 | 13% |
| 2 | 0.1 | |
| 3 | 0.2 | |
| 4 | 0.3 | |
| 5 | 0.4 | |
| 6 | 0.5 | |
| 7 | 0.6 | 21% |
| 8 | 0.7 | 48% |
| 9 | 0.8 | 59% |
| 10 | 0.9 | 74% |
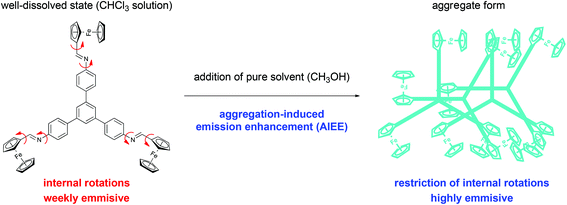
Inspired by our structural analyses on 3 described above and the literature reports on aggregation-induced effects with 1,3,5-triphenylbenenes8 and Fc-templated imines,5a we studied the potential AIEE effect in 3. We hypothesized that the restricted internal rotations of Fc moieties and the lack of strong intermolecular interactions observed in crystals will give rise to emission enhancement in the aggregate form.20a,b We also expected that with proper selection of solvents, we might induce aggregation without the formation of π–π stacking interactions quenching PL. If there were strong π–π stacking interactions, we would expect an aggregation-caused quenching phenomenon, as discussed in several reviews.20e We hypothesized that the lack of this stacking and the possibility to prevent the spontaneous rotation of Fc moieties in the aggregate form (as compared to a well-dissolved state) might induce the aggregation-induced emission enhancement. Our hypothesis is graphically represented in Scheme 2. To probe this, the emission spectra of 3 dissolved in mixtures composed of CHCl3 and CH3OH were measured (Fig. 3b). CHCl3 was a good solvent (3 is soluble in CHCl3), whilst CH3OH acted as a poor solvent (3 is insoluble in CH3OH). We suspected that varying the ratios between these solvents might induce the aggregation of 3. As the CH3OH volume fraction (fCH3OH) was increased gradually, an increase in the emission intensity was indeed observed. It was ascribed to the aggregate formation, suggesting the AIEE effect with 3. Importantly, dynamic light scattering (DLS) analysis supported the aggregate formation;20b,c,d the mean particle size for the sample with fCH3OH = 0.9 equalled ca. 160 nm (monodisperse particle size distribution;21a see Fig. S10†). For comparison, for the sample with fCH3OH = 0.0 (no CH3OH added), no detectable peak was found in DLS analysis, because 3 was in the molecular well-dissolved state.20b Importantly, the aggregates exhibited stability in time interval, since our preliminary experiments revealed no decrease in aggregates’ fluorescence intensity even after 24 hours (see discussion in “Experimental section”).21b
The aggregates were further analysed with powder X-ray diffraction (PXRD). The powder diffraction pattern of the lyophilized aggregates obtained from the solution with fCH3OH = 0.9 revealed a significant amount of an amorphous phase in the aggregate (see Fig. S11†). Together with the PL spectra presented in Fig. 2 and Fig. S1,† this analysis suggests that the amorphous phase gave rise to the AIEE effect. We suspect that the small amount of crystalline phase revealed by PXRD was formed after lyophilisation. The powder diffraction pattern of the sample recorded after 2.5 months revealed a higher content of the crystalline phase. This together with the PL spectra presented in Fig. 2 and Fig. S1,† showing that the emission from the crystalline phase of 3 is comparable to that from the chloroform solution, suggests that it is the amorphous or nano/micro-crystalline phase that gives rise to the AIEE effect. To obtain further insight into the structure of the aggregated 3, scanning electron microscope (SEM) studies were carried out (Fig. 4). The SEM images of the aggregates (Fig. 4b) revealed the formation of the amorphous phase. In contrast, the sample of non-aggregated 3 (Fig. 4a; crystals that were grown for X-ray diffraction studies were subjected to this experiment) comprises only needle-type crystalline objects. Please note that these observations are consistent with the outcomes of PXRD analyses.
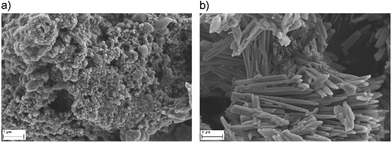 | ||
| Fig. 4 SEM image of (a) the lyophilized aggregates of 3 (from solution with fCH3OH = 0.9); (b) the sample of non-aggregated 3 (crystals that were grown for X-ray diffraction studies). | ||
The enhancement in the emission intensity was observed for the samples with fCH3OH higher than 0.6 (Fig. 3c). The ΦF values estimated for different solvent compositions are listed in Table 1. The most significant enhancement in ΦF was found for the samples with fCH3OH ≥ 0.7 and reached 74% for the sample with fCH3OH = 0.9. It is worth stressing that such a satisfactory ΦF value is sparse in the chemistry of Fc-tethered aromatic molecules. Most plausibly, the presence of three Fc moieties that were linked to 1,3,5-triphenylbenenze backbone facilitated the aggregation behaviour of 3 in the CHCl3–CH3OH solvent system; the flexibility of Fc units in 3 was diminished in the aggregate form, which resulted in the significant ΦF increase by the AIEE effect.20a,b,d,23 It is noteworthy that the ΦF of 3 is more satisfactory than the respective values for other Fc- or 1,3,5-triphenyl-benzene containing molecules (Table 2, entries 2–6), also taking into account the existence of aggregation-induced effects for these compounds. For one case, namely N,N-dihexylbenzenamine-containing biphenyl-bridged 1,3,5-triphenylbenzene22 (Table 2, entry 7), ΦF is comparable with the respective value for 3. However, the synthesis of 3 is more convenient (chromatography-free method for 3versus series of column chromatography purifications for ref. 22) and more effective (combined yields: ca. 73% for 3versus ca. 50% for ref. 20).
| Entry | Compound | Max. ΦF | Ref. |
|---|---|---|---|
| a Aggregation-induced effects. | |||
| 1 | 3 | 74% | This work |
| 2 | Mono-ferrocenyl imines derived from 2-hydroxyaniline and 4-nitrohyroxyaniline | 4%a | 5a |
| 3 | Ferrocenyl ester of coumarin derivative | 52%a | 5b |
| 4 | Lactone-bridged 1,3,5-triphenylbenzene | 21% | 8c |
| 5 | Triphenylamine-functionalized 1,3,5-triphenylbenzene | 26%a | 8d |
| 6 | Tristyrylbenzene-containing 1,3,5-triphenylbenzene | ca. 20%a | 8e |
| 7 | Various styrene-functionalized 1,3,5-triphenylbenzenes | 36–82% | 21 |
Conclusions
In conclusion, we showed that novel organometallic 1,3,5-triphenylbenzene derivative 3 bearing three ferrocene moieties can be effectively synthesized employing the easy-to-perform, chromatography-free method. The X-ray diffraction structural study allowed concluding that there are no significant π stacking interactions in the studied crystals of compound 3 and led to the discovery of an aggregation-induced emission effect for it. Compound 3 is an attractive molecule for organic electronics, since it shows an efficient cyan-light emission feature together with the aggregation-induced enhanced emission effect and high fluorescence quantum yields reaching 74%. Thus, our work demonstrates a new, simple way to obtain molecules bearing several metallocene residues and exhibiting intriguing photophysical properties. We believe our work opens up new avenues in merging the chemistry of ferrocene and fused aromatic molecules and their unexplored properties, toward the design of functional organic compounds.Conflicts of interest
There are no conflicts to declare.Acknowledgements
Financial support from the Warsaw University of Technology (WUT) is acknowledged. A. M. N., A. K., and A. K. acknowledge the National Science Centre (Poland) for financial support (grant no. 2019/35/B/ST4/02497). The authors thank Dr Maciej Dranka (WUT) for his assistance in single-crystal X-ray analyses.Notes and references
- (a) D. Astruc, Eur. J. Inorg. Chem., 2017, 6 CrossRef CAS; (b) K. Heinze and H. Lang, Organometallics, 2013, 32, 5623 CrossRef CAS.
- (a) T. Romero, A. Caballero, A. Tarraga and P. Molina, Org. Lett., 2009, 11, 3466 CrossRef CAS; (b) L. Zhou, X.-T. Fan, Y.-D. Xu and Q.-Y. Cao, New J. Chem., 2015, 39, 8087 RSC; (c) C. Bucher, C. H. Devillers, J.-C. Moutet, G. Royal and E. Saint-Aman, Coord. Chem. Rev., 2009, 253, 21 CrossRef CAS.
- (a) S. Daum, V. F. Chekhun, I. N. Todor, N. Y. Lukianova, Y. V. Shvets, L. Sellner, K. Putzker, J. Lewis, T. Zenz, I. A. M. de Graaf, G. M. M. Groothuis, A. Casini, O. Zozulia, F. Hampel and A. Mokhir, J. Med. Chem., 2015, 58, 2015 CrossRef CAS; (b) H. Hagen, P. Marzenell, E. Jentzsch, F. Wenz, M. R. Veldwijk and A. Mokhir, J. Med. Chem., 2012, 55, 924 CrossRef CAS.
- (a) W.-Y. Wong, G.-L. Lu, K.-H. Choi and Y.-H. Guo, J. Organomet. Chem., 2005, 690, 177 CrossRef CAS; (b) C. B. Hollandsworth, W. G. Hollis Jr., C. Slebodnick and P. A. Deck, Organometallics, 1999, 18, 3610 CrossRef CAS; (c) C. Villalonga-Barber, B. R. Steele, V. Kovac, M. Micha-Screttas and C. G. Screttas, J. Organomet. Chem., 2006, 691, 2785 CrossRef CAS; (d) P. Rajakumar, R. Anandhan and A. Kannan, Aust. J. Chem., 2012, 65, 1457 CrossRef CAS; (e) M. S. Inkpen, S. Scheerer, M. Linseis, A. J. P. White, R. F. Winter, T. Albrecht and N. J. Long, Nat. Chem., 2016, 8, 825 CrossRef CAS; (f) L. E. Wilson, C. Hassenrgck, R. F. Winter, A. J. P. White, T. Albrecht and N. J. Long, Angew. Chem., Int. Ed., 2017, 56, 6838 CrossRef CAS; (g) K. Moon and A. E. Kaifer, J. Am. Chem. Soc., 2004, 126, 15016 CrossRef CAS; (h) A. Kasprzak and P. A. Guńka, Dalton Trans., 2020, 49, 6974 RSC.
- (a) E. David, K. Thirumoorthy and N. Palanisami, Appl. Organomet. Chem., 2018, 32, e4522 CrossRef; (b) D. Zhang, L. Zhu, H. Li and J. Su, Front. Chem. China, 2010, 5, 241 CrossRef.
- (a) Y. Hong, J. W. Y. Lam and B. Z. Tang, Chem. Soc. Rev., 2011, 40, 5361 RSC; (b) J. Mei, N. L. C. Leung, R. T. K. Kwok, J. W. Y. Lam and B. Z. Tang, Chem. Rev., 2015, 115, 11718 CrossRef CAS.
- (a) P. Kaewmati, Y. Yakiyama, H. Ohtsu, M. Kawano, S. Haesuwannakij, S. Higashibayashi and H. Sakurai, Mater. Chem. Front., 2018, 2, 514 RSC; (b) M. Saito, H. Shinokubo and H. Sakurai, Mater. Chem. Front., 2018, 2, 635 RSC; (c) L. Zhang, K. Liang, L. Dong, P. Yang, Y. Li, X. Feng, J. Zhi, J. Shi, B. Tong and Y. Dong, New J. Chem., 2017, 41, 8877 RSC; (d) X. Feng, B. Tong, J. Shen, J. Shi, T. Han, L. Chen, J. Zhi, P. Lu, Y. Ma and Y. Dong, J. Phys. Chem. B, 2010, 114, 16731 CrossRef CAS; (e) T. Usuki, M. Shimada, Y. Yamanoi, T. Ohto, H. Tada, H. Kasai, E. Nishibori and H. Nishihara, ACS Appl. Mater. Interfaces, 2018, 10, 12164 CrossRef CAS; (f) N. Miengmern, A. Koonwong, S. Sriyab, A. Suramitr, R. P. Poo-arporn, S. Hannongbua and S. Suramitr, J. Lumin., 2019, 210, 493 CrossRef CAS; (g) E. Babu, P. M. Mareeswaran, M. M. Krishnan, V. Sathish, P. Thanasekaran and S. Rajagopal, Inorg. Chem. Commun., 2018, 98, 7 CrossRef CAS.
- (a) P. Vishnoi, D. Kaleeswaran and R. Murugavel, RSC Adv., 2018, 8, 17535 RSC; (b) O. Simalou, R. Lu, P. Xue, P. Gong and T. Zhang, Eur. J. Org. Chem., 2014, 2907 CrossRef CAS; (c) H. A. Hintz, N. J. Sortedahl, S. M. Meyer, D. A. Decato and B. J. Dahl, Tetrahedron Lett., 2017, 58, 4703 CrossRef CAS; (d) P. Das, A. Kumar, A. Chowdhury and P. S. Mukherjee, ACS Omega, 2018, 3, 13757 CrossRef CAS; (e) H. Zhang, F. Rominger, U. H. F. Bunz and J. Freudenberg, Chem. – Eur. J., 2019, 25, 11218 CAS.
- For the details of this methodology, see for example: M. Urban, K. Durka, P. Jankowski, J. Serwatowski and S. Lulinski, J. Org. Chem., 2017, 82, 8234 CrossRef CAS.
- According to IUPAC data, see: A. M. Brouwer, Pure Appl. Chem., 2011, 83, 2213 CAS.
- For each reaction batch, 1H NMR analysis revealed the presence of unreacted 1 in crude 3 after the first filtration process. The sonication step enabled the complete removal of unreacted 1.
- For full compound characterization data, see ESI.†.
- For the 1H NMR spectrum of 3, see Fig. S4, ESI.†.
- (a) For the FT-IR spectrum of 3, see Fig. S6, ESI;†; (b) A. J. Bard and L. R. Faulkner, Electrochemical methods: Fundamentals and Applications, Wiley, New York, 1980 Search PubMed; (c) N. S. Neghmouche and T. Lanez, ILCPA, 2013, 4, 37–45 Search PubMed.
- ESI as well as CCDC 2004930† contain supporting crystallographic data for this paper.
- For the UV-Vis spectra, see section S6, ESI.†.
- The strongest relative emission intensity with 3 was found for the excitation wavelength of 355 nm.
- For the details of this methodology, see for example: M. Urban, K. Durka, P. Jankowski, J. Serwatowski and S. Lulinski, J. Org. Chem., 2017, 82, 8234 CrossRef CAS.
- B. Schmidt, M. Rinke and M. Güsten, J. Photochem. Photobiol., A, 1989, 49, 131 CrossRef CAS.
- (a) L. Wen, C. Zang, Y. Gao, Y. Tao, G. Li, G. Shan, H. Sun, W. Xie and Z. Su, Dyes Pigm., 2020, 173, 107912 CrossRef CAS; (b) T. S. Reddy, J. Hwang and M.-S. Choi, Dyes Pigm., 2018, 158, 412 CrossRef CAS; (c) A. Shao, Z. Guo, S. Zhu, S. Zhu, P. Shi, H. Tian and W. Zhu, Chem. Sci., 2014, 5, 1383 RSC; (d) Y. Ooyama, M. Sugino, T. EnoKi, K. Yamamoto, N. Tsunoji and J. Ohshita, New J. Chem., 2017, 41, 4747 RSC; (e) Y. Hong, J. W. Y. Lama and B. Z. Tang, Chem. Commun., 2009, 4332–4353 RSC.
- (a) For the size distribution diagram, see section S10, ESI;†; (b) Zeta potential (ZP) measurements were also performed. However, the lack of functional groups able to be easily protonated/deprotonated in 3 both in well dissolved state (CHCl3 solution) and in aggregate form (CHCl3 + CH3(OH) caused no significant changes in ZP values between the samples.
- F. Terenziani, C. Le Droumaguet, C. Katan, O. Mongin and M. Blanchard-Desce, ChemPhysChem, 2007, 8, 723 CrossRef CAS.
- J. Brunel, O. Mongin, A. Jutand, I. Ledoux, J. Zyss and M. Blanchard-Desce, Chem. Mater., 2003, 15, 4139 CrossRef CAS.
Footnote |
| † Electronic supplementary information (ESI) available: Compounds characterization data, spectra, crystallographic data. CCDC 2004930. For ESI and crystallographic data in CIF or other electronic format see DOI: 10.1039/d0dt02948c |
| This journal is © The Royal Society of Chemistry 2020 |


