 Open Access Article
Creative Commons Attribution 3.0 Unported Licence
Hydrogen peroxide assisted photorelease of an anthraquinone-based ligand from [Ru(2,2′-bipyridine)2(9,10-dioxo-9,10-dihydroanthracen-1-olate)]Cl in aqueous solution†
L.
Zeng
 a,
D.
Sirbu
 b,
P. G.
Waddell
c,
N. V.
Tkachenko
 d,
M. R.
Probert
c and
A. C.
Benniston
 *a
*a
aMolecular Photonics Laboratory, Chemistry-School of Natural and Environmental Sciences, Newcastle University, Newcastle upon Tyne, NE1 7RU, UK. E-mail: andrew.benniston@ncl.ac.uk
bSchool of Mathematics, Statistics & Physics, Newcastle University, Newcastle upon Tyne, NE1 7RU, UK
cCrystallography Laboratory, Chemistry-School of Natural and Environmental Sciences, Newcastle University, Newcastle upon Tyne, NE1 7RU, UK
dFaculty of Engineering and Natural Sciences, Tampere University, P.O. Box 541, FI-33720 Tampere, Finland
First published on 19th August 2020
Abstract
A new class of light-activated ruthenium(II) complex was designed as a potential blocker of biological functioning, especially for targeting redox reactions within mitochondria under light activation. Based on our concepts the complex [Ru(bipy)2(1-hydroxyanthra-9,10 quinone)]Cl (RU1) was prepared and studied to understand the preliminary reaction mechanisms and its excited state behaviour through a series of stability tests, electrochemistry, UV–Visible kinetics and femtosecond transient absorption spectroscopy experiments. Under white light in the presence of H2O2 two different reactions (fast and slow) appear to take place. The complex loses the quinone-based ligand and a resulting Ru(III) or Ru(V) species is produced. The complex RU1 shows potential to consume H2O2 from the one carbon metabolism in mitochondria, and hence may cut the energy cycle pathway of tumor cells.
Introduction
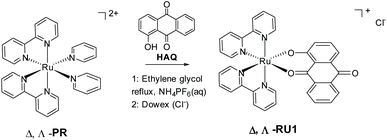
The cellular uptake of metallodrugs at the nucleus is much less than that on other subcellular organelles such as mitochondria.1,2 In classical biochemistry textbooks mitochondria is known to be the major place where cells can make energy from aerobic respiration processes, and it is also called the “power house” of a cell. Mitochondria also contain their own genetic materials and systems through its genome, and can function as semi-autonomous organelles. Because of this, and besides simply providing energy to cells, they also serve as a checkpoint in cellular metabolism such as cell differentiation, activation of signaling pathways and programmed cell apoptosis.2–4 Considering these important features, metabolism in mitochondria is believed to be a potential target site for the treatment of cancer, because if they disfunction at any point in the metabolism cycle cells are unlikely to survive.5–12 Many different metabolism pathways have been investigated as a possible targeting site for cancer treatment. Here regulation of intracellular reactive oxygen species (ROS) levels is our research direction. The electron transport chain (ETC) on the mitochondria, which is also called the respiratory chain, is the main site of intracellular ROS production; 95% of ROS (including the oxygen anion (O2−), hydrogen peroxide (H2O2), hydroxyl radical (HO˙), oxygen (O2) and hypochlorous acid (HOCl)) in most mammalian cells are produced from here.13 In a normal cell oxidation and antioxidant systems are usually maintained in a relatively balanced level, and the increase of oxidation level or the decrease of anti-oxidation ability will lead to the increase of ROS in the body, which will be followed by a series of changes.14,15 Compared with normal cells, ROS level in tumor cells is higher than that in normal cells due to both environmental and internal mechanisms, so tumor cells are usually under oxidative stress, and the sensitivity of tumor cells to ROS is higher than that of normal cells. Nevertheless, at the same time a tumor cell has its own unique antioxidant capacity, which can control the level of ROS within a range suitable for their biological function. So ROS will not accumulate to a high level that promote cell death and acute cell damage.16–18 Hydrogen peroxide is a common intermediate product of cellular oxygen metabolism in aerobic organisms. The earliest idea was that H2O2 was derived from the superoxide anion (O2˙−) which is generated by the ETC and then converted into H2O2 by superoxide dismutase 2 (SOD2) or voltage-dependent anion channels (VDACs).19 In the process of cancerization normal cells will produce a large amount of H2O2 which will accumulate in tumor cells to counterbalance the increased antioxidant capacity of cancer cells. In order not to build up large amounts of ROS, a high concentration of H2O2 will also promote cell division to prevent oxidative stress (OS). Tumor cells have a strong dependence on H2O2 and are very sensitive to its changes, which means it cannot tolerate excessive increase or decrease of its amount.12,20 Based on this observation the concept was to use a ruthenium complex to consume H2O2 based on the following reasons: one is to accumulate other ROS by prohibiting cell division due to the lack of H2O2, and secondly to affect its redox balance to achieve the purpose of treatment.An archetypical photoreactive complex is [Ru(bipy)3]2+, where bipy = 2,2′-bipyridine, which can behave as a photooxidant (Ru3+) or a photoreductant (bipy˙−) in the excited state.21 Quenching by either an oxidant or reductant is possible and has been extensively studied in the context of artificial photosynthesis (i.e., water splitting).22 As far as we are aware from the literature there are no reports of excited state quenching of [Ru(bipy)3]2+ by peroxide; in fact, reports highlighted H2O2 formation from the reduction of O2.23 Hence, modification of the complex appeared to be required, and so we rationalized that incorporation of an anthraquinone-based ligand would fulfill several beneficial requirements (Scheme 1). The low reduction potential often associated with an anthraquinone would selectively localize the excited electron at the site.24 Also, the single electron reduced C![[double bond, length as m-dash]](https://www.rsc.org/images/entities/char_e001.gif) O group in the excited state would afford a protonation site, and thus a potential pH dependency to any redox reactions.25 The hard donor oxygen atoms would in addition facilitate stabilization of the Ru3+ oxidation state, hence perturbing the redox potential at the metal centre.26 Release of the anthraquinone ligand could also introduce an additional species to perturb the complicated redox chemistry within mitochondria.27 To these ends, the chirally pure complex RU1 was targeted containing the deprotonated form of 1-hydroxyanthra-9,10-quinone (HAQ). Even though chirality at the metal centre was not critical for the current studies there is an interest in these type of complexes for binding to DNA.28 The method employed, as developed by von Zelewsky,29 is as straight forward as the classic approach using racemic [Ru(bipy2)Cl2].
O group in the excited state would afford a protonation site, and thus a potential pH dependency to any redox reactions.25 The hard donor oxygen atoms would in addition facilitate stabilization of the Ru3+ oxidation state, hence perturbing the redox potential at the metal centre.26 Release of the anthraquinone ligand could also introduce an additional species to perturb the complicated redox chemistry within mitochondria.27 To these ends, the chirally pure complex RU1 was targeted containing the deprotonated form of 1-hydroxyanthra-9,10-quinone (HAQ). Even though chirality at the metal centre was not critical for the current studies there is an interest in these type of complexes for binding to DNA.28 The method employed, as developed by von Zelewsky,29 is as straight forward as the classic approach using racemic [Ru(bipy2)Cl2].
Results and discussion
Characterization
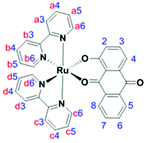
The optically pure new compounds Λ- and Δ-RU1 were synthesized in a single step by treating the resolved ruthenium complexes29Λ-PR or Δ-PR with HAQ (Scheme 1). The reaction was easily monitored due to the colour change from red-orange to deep purple. The base Et3N was used to deprotonate the 1-hydroxyanthra-9,10-quinone. The two enantiomeric complexes RU1 were firstly isolated as their PF6− salts. While column chromatography purification is often required to obtain pure complexes this procedure was not necessary for RU1. Both complexes were isolated as black solids with yields around 50–60%. To obtain water-soluble versions the PF6− anion was exchanged for Cl− using a Dowex resin.The complexes Λ, Δ-RU1 were characterized by 700 MHz high-field NMR including 1-D 1H and 13C NMR spectroscopy (see ESI†). Also, 2D COSY and HSQC spectra were recorded to investigate the proton-proton correlations and proton-carbon correlations. The NMR spectroscopic data are consistent with the proton and carbon numbering of RU1. The low symmetry of RU1 is a consequence of the HAQ ligand. For the bipyridine segment the low symmetry gives rise to protons in different environments. The below assignments agree with those previously reported for cis-[Ru(bpy)2L]n+ (L = other ligand) complexes in the literature, taking into account the close proximity of certain protons to the aromatic rings. For example, H6a and H6c are more directed to the ring current of the anthraquinone-based ligand while H6b and H6d are more directed to the ring current of a bipyridine segment. Because the anthraquinone-based ligand is more electron rich than the bipyridine fragments, the ligand therefore has a larger ring current resulting in a greater upfield shift for H6a and H6c compared to H6b and H6d.30–37 The proton H8 has an upfield chemical shift since it is directed towards the bipyridine group's ring current. In the free ligand, H3 has an upfield chemical shift relative to H4. The numbering scheme for RU1 and assignment for the signals are in Table 1.
| Fragment | H2 | H3 | H4 | H5 | H6 | H7 | H8 |
|---|---|---|---|---|---|---|---|
| HAQ = 1-hydroxyanthra-9,10-quinone ligand; coupling constants (J) in Hz are given in the brackets. d = doublet, t = triplet, m = multiplet. | |||||||
| HAQ | 6.79 d (7.2) | 7.34 t (7.9) | 7.37 d (8.8) | 8.07 d (7.8) | 7.68 t (7.5) | 7.55 t (7.6) | 7.64 d (7.7) |
| bpya | 8.44 d (8.4) | 7.90 m | 7.21 t (6.6) | 7.90 m | |||
| bpyb | 8.52 d (8.4) | 8.09 t (7.8) | 7.60 t (6.6) | 8.83 d (5.2) | |||
| bpyc | 8.41 d (8.4) | 7.81 m | 7.17 t (6.6) | 7.81 m | |||
| bpyd | 8.52 d (8.4) | 8.11 t (7.7) | 7.49 t (6.6) | 8.63 d (5.2) | |||
The ESI-MS mass spectrum for RU1 displayed a cluster of intense molecular peaks centered at m/z = 637.0813, which are consistent with the structure for the singly-charged species [RU1-PF6]+. The observed and expected isotopic pattern corresponding to the loss of one hexafluorophosphate anion were in good agreement.
Single-crystals of RU1 were grown using the slow diffusion method by layering a solution of RU1 in CH3CN on top of an aqueous solution of KPF6 in an NMR tube. The CH3CN layer and aqueous layer slowly mixed together over time and black, needle-like crystals formed at the interface of the two layers. These crystals were analysed by single-crystal X-ray diffraction.
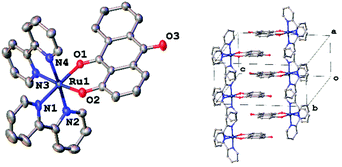
The molecular structure of RU1 is labelled and illustrated in Fig. 1. Selected bond lengths and angles along with DFT modelling results are shown in Table 2. The asymmetric unit consists of one RU1 cation and one PF6− anion. The deprotonated 1-hydroxyanthra-9,10-quinone binds to the ruthenium ion in a bidentate coordination mode. The two bonds between the ruthenium and oxygen atoms Ru–O1 and Ru–O2 have average bond lengths of 2.038(4) Å and 2.052(4) Å. There is very little variation in the Ru–N bond lengths which are observed to be statistically similar. The structure is best described as exhibiting a distorted octahedral coordination geometry. The deprotonated 1-hydroxyanthra-9,10-quinone ligand is slightly bowed with a fold angle of 8.617(2)° between the two benzene rings. The experimental results were compared with a structure obtained by DFT computational studies (Gaussian 09 (B3LYP/3-21G*/6-311G).38 The calculated bond lengths and bond angles are similar with those observed in the crystal structure. The packing diagram reveals that the RU1 cations form columns along the crystallographic [100] direction with each cation related to the next by inversion symmetry. Given the orientation of adjacent groups in this direction these columns are most likely formed of parallel offset π–π interactions. The closest Ru⋯Ru distances in the structure (7.610(2) Å) are also observed along the [100] direction.
| a Value is the experimental value representing average bond lengths and angles, the number in the bracket is standard deviation of the bond lengths. b Value is calculated bond lengths and angles from DFT calculation in the gas phase using Gaussian 09 (B3LYP) and a split basis set: Ru 3-21G*; C, H, O, N 6-311G. | ||
|---|---|---|
| Atoms | Bond lengtha/Å | Bond lengthb/Å |
| Ru1–O1 | 2.038 (4) | 2.088 |
| Ru1–O2 | 2.052 (4) | 2.075 |
| Ru1–N1 | 2.043 (5) | 2.068 |
| Ru1–N2 | 2.048 (5) | 2.091 |
| Ru1–N3 | 2.038 (5) | 2.082 |
| Ru1–N4 | 2.040 (5) | 2.090 |
| O1–C1 | 1.283 (6) | 1.297 |
| O2–C2 | 1.298 (7) | 1.325 |
| Atoms | Bond anglesa/° | Bond anglesb/° |
| O1–Ru1–N1 | 177.42 (18) | 172.67 |
| O2–Ru1–N3 | 174.72 (18) | 172.30 |
| N4–Ru1–N2 | 176.09 (19) | 177.38 |
Electrochemistry
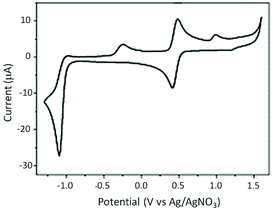
The redox behaviour of the complex RU1 was performed by CV experiments in dry and deoxygenated CH3CN using a platinum working electrode with TBAPF6 (0.1 M) as the background supporting electrolyte versus an Ag/AgNO3 reference (Fig. 2). The complex exhibits one dominant reversible wave at E1/2 = +0.45 V. The ΔE = 70 mV is typical for a one-electron diffusion controlled process and represents the Ru(III)/Ru(II) redox couple. Upon reductive scanning at a scan rate of 0.1 V s−1, there is one irreversible reduction peak at E1 = −1.10 V which is associated with two electron reduction of the anthraquinone-based ligand. The lack of reversibility of the wave would suggest that after two-electron reduction there is a chemical reaction. This is likely protonation by any water that is often found even in dried CH3CN ([Ru(bipy)2AQ]+ + 2e− + H+ → [Ru(bipy)2AQH]). Scanning back to positive potentials produced a partial wave at E2 = −0.26 V which is doubtless partial reoxidation of the protonated dianion ligand ([Ru(bipy)2AQH] → [Ru(bipy)2AQH]+ + e−). It was noticed that the wave at E2 = −0.26 V disappeared as the scan rate increased. At the faster scan rate the protonation step is slow enough such that the redox process at the electrode can compete and the wave at E1 = −1.10 V becomes more reversible.Absorption and circular dichroism
UV–Visible spectra were recorded for RU1 in both CH3CN and H2O respectively. Also, a spectrum of [Ru(bipy)3](PF6)2 in CH3CN was recorded for a comparison; in the visible light absorption region (380 to 740 nm), there is a strong absorption band at 450 nm due to the 1MLCT transition.39 The electronic spectra of RU1 in both CH3CN and H2O mainly have two well-resolved bands at λmax = 423 nm/561 nm, 440 nm/582 nm, respectively, accompanied by a low-energy broad tail. By using a comparison with the spectrum of [Ru(bipy)3](PF6)2 the bands at 423 nm and 440 nm are attributed to the 1MLCT, corresponding to an electron transition from the ruthenium metal center to a bipyridine ligand. The bands at 561 nm and 580 nm are dominated by 1MLCT transitions from the ruthenium metal center to the anthraquinone-based ligand. The molar absorption coefficients are 15![[thin space (1/6-em)]](https://www.rsc.org/images/entities/char_2009.gif) 000 M−1 cm−1 in CH3CN and 8000 M−1 cm−1 in H2O. The broad and much weaker absorption tail around 700 nm is possibly due to the spin-forbidden singlet to triplet MLCT transition (Fig. 3),40–42 or the LLCT transition associated with electron migration from the quinone-based ligand to a bipy group.43
000 M−1 cm−1 in CH3CN and 8000 M−1 cm−1 in H2O. The broad and much weaker absorption tail around 700 nm is possibly due to the spin-forbidden singlet to triplet MLCT transition (Fig. 3),40–42 or the LLCT transition associated with electron migration from the quinone-based ligand to a bipy group.43
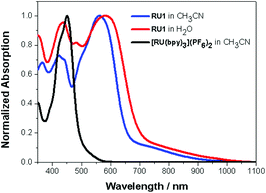 | ||
| Fig. 3 Normalized UV–Vis absorption spectra of RU1 in CH3CN (blue), H2O (red) and [Ru(bipy)3](PF6)2 in CH3CN (black). | ||
The absolute configurations of Λ-RU1 and Δ-RU1 were investigated by circular dichroism (CD) in both CH3CN and H2O. Within experimental error, the spectra of both compounds are the mirror images of each other with strong opposite but equal Cotton Effects as expected for enantiomeric pairs. Seven clear signals are observable in both CH3CN and H2O (see ESI†).44–47
Transient absorption spectroscopy
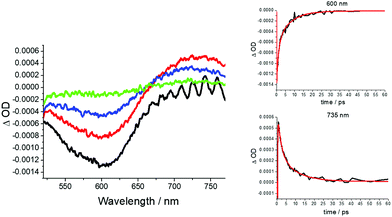
Since no apparent room temperature luminescence was observed for RU1 in solution, femtosecond pump–probe transient absorption spectroscopy was employed to investigate its excited state properties. The complex RU1 in H2O (pH 7) was excited at 500 nm with an ultrashort 100 fs laser pulse, and 100 time-resolved spectra were recorded in the 0.1 to 300 ps time frame (Fig. 4). At a very early time delay, there is a clear bleach centered around 600 nm consistent with depletion of the ground state complex. Well within 1 ps a new positive transient feature is unmistakably observed towards the red-end of the spectrum and this is assigned to the MLCT excited state. The kinetics for recovery of the ground-state bleach and the decay of the transient profile are in good agreement, supporting the direct restoration of the ground state (Fig. 4 inserts). Multi-wavelength global analysis of the decay kinetics required three exponentials resulting in time constants of 0.14 ps, 0.70 ps and 5.3 ps. The first point of note is the ultrashort lifetime of the excited state as opposed to the normal long-lived 3MLCT state observed for [Ru(bipy)3]2+.48 It is well established that intersystem crossing of the 1MLCT to the 3MLCT in [Ru(bipy)3]2+ is ultrafast (<30 fs).49 It is reasonable to assume the same process would occur in RU1, especially since at the excitation wavelength of 500 nm (Fig. 3) a proportion of photons go into forming a similar looking 1MLCT state (i.e., [Ru(III)(bipy˙−)(bipy)AQ]+). It is also likely that the preferentially formed lower in energy 1MLCT state (i.e., [Ru(III)(bipy)2AQ˙−]+ would also undergo rapid intersystem crossing to the 3MLCT state. The 0.14 ps time constant is outside the limit of representing intersystem crossing and is more likely a relaxation timescale as the complex vibrationally cools. The simplest explanation for the 0.70 ps time constant is it exemplifies the relaxation of the upper-lying 3MLCT state (bipy-based) to the lower-lying 3MLCT state (quinone-based); this latter state then returns to the ground state in 5.3 ps. The ultrashort lifetime is likely linked to the fact that the 3MLCT state (quinone-based) is so low in energy that it is strongly coupled to the ground state (energy-gap law).50 The simplest analogues of RU1 are the catechol-based complexes as described by Lever and co-workers,51 for which there are no reported excited state lifetimes. Other complexes containing directly metal attached anthraquinone units (e.g., emodin) are known but no lifetime data are given.52Similar pump–probe experiments performed in the pH 2 and 4 did not reveal any tangible changes in the transient profiles or decay kinetics. Likewise, no effect on the excited-state lifetime was observed for RU1 in the presence of H2O2 as discussed later. This finding would appear to rule out any major complex formation between the two species in the ground state prior to excitation.
Light activated ligand disassociation
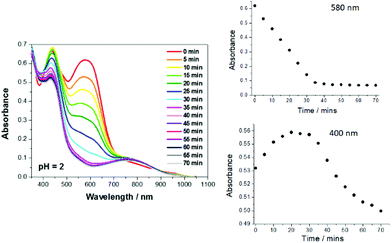
Given the ultrafast excited state decay of RU1, and the lack of any effect on its lifetime by the presence of peroxide, it was unexpected that clear alterations were observed under steady-state light activation conditions (Fig. 5). As a typical example the reaction of RU1 in an aqueous solution treated with H2O2 at pH 2 is used to highlight certain features. The UV–Vis spectra of the solution were recorded every 5 min till 70 min, when the colour of the solution was almost clear. The spectral change at 580 nm versus time is the most distinctive feature (Fig. 5). The disappearance of the absorption band can be due to complete disassociation of the quinone-based ligand, or the oxidation of Ru2+ to Ru3+ which would essentially switch off the MLCT transition. A very subtle effect is observed at around 400 nm where over some 20 min the absorbance increased slightly and then decreased steadily over time. The spectrum recorded after 70 min showed a clear broad band centered at 752 nm. The spectrum is remarkably similar to that recorded for the in situ generated complex [Ru(III)(bipy)2AQ]2+ (see ESI†).53 It does appear that the first part of the photoreaction is formation of the oxidised metal centre. However, there is likely an additional very slow photodriven reaction that results in loss of the quinone-based ligand. A sample of RU1 in D2O irradiated for several hours showed clear alterations in the collected 1H NMR spectra, and resulted in the precipitation of a white solid (see ESI†). Large chemical shifts were also observed for several resonances supporting the generation of paramagnetic species such as Ru(III)-d5 or even Ru(V)-d3. Existence of a higher oxidation ruthenium species was confirmed by collection of an electrospray mass spectrum of the irradiated mixture. A cluster of peaks at m/z = 445/447 was observed which can be assigned to species such as [Ru(V)(bipy)2O2]+ (445) or [Ru(III)(bipy)2(OH)2]+ (447) (see ESI†). These species presumably originate from an aqua complex initially formed from water molecules occupying vacant coordination sites.A similar photo-driven degradation of RU1 in the presence of peroxide was observed in the pH range 2–7, albeit that the reaction did slow down as the solution became neutral. Under the basic conditions of pH 8–10 the reaction was extremely slow, but at pH >11 decomposition of the complex again became clear. At high pH it is likely that reactions involving hydroxide ion become important, since it is recognized that [Ru(bipy)3]2+ is subject to decomposition by hydroxide attack at the bipy ligand.
There are several additional points of note regarding the decomposition of the complex. The solution when left in the dark showed very little change supporting that light is required at some point to initiate the reaction. In the absence of both hydrogen peroxide and oxygen the decomposition reaction is again non-existent under light illumination. However, there is a very clear reaction when both oxygen and hydrogen peroxide are present both in the dark and under light stimulation (see ESI†). Control experiments performed using [Ru(bipy)3]2+ under conditions discussed above proved that peroxide assisted decomposition of RU1 must arise because of the presence of the anthraquinone ligand. The decomposition of the complex is the same for both isomers and likely results in racemization.
Degradation kinetics and model
The kinetics for the degradation reaction as monitored at the main absorption band 580 nm versus time is zero order (Fig. 5). This situation is not unprecedented for photoactivated reactions.54 Analysis of the data at pH 2 by conversion of absorbance to concentration and using eqn (1) afforded kobs = 3 × 10⁻⁸ M s−1, where [C] is the concentration of RU1 at time t and its initial concentration is [C]0. The corresponding half-life (t1/2 = [C]0/2kobs) is 22 min.| [C] = [C]0 − kobs × t | (1) |
The kinetics of degradation were also analysed from pH 3–7 in a similar manner to above (see ESI†) and the results are collected in Table 3. The abrupt change in kobs between pH 6–7 would suggest that this point represents the pKa for the excited state of RU1 located at the C–O unit.
| pH | k obs (10−8 M s−1) | t 1/2 (min) |
|---|---|---|
| 2 | 3.0 | 22 |
| 3 | 3.0 | 24 |
| 4 | 3.0 | 26 |
| 5 | 4.0 | 21 |
| 6 | 5.0 | 24 |
| 7 | 0.9 | 148 |
The pKa (eqn (2)) for hydrogen peroxide is 11.8,55 signifying that under the conditions described the ratio [HO2−]/[H2O2] falls within the range 1.6 × 10⁻¹⁰ to 1.6 × 10⁻⁵. Consequently, the probability of any ground state equilibrium complex with the cation RU1, because of ion-pair formation, would be extremely low. Certainly, the concentration of any ion-pair complex would have been far too small to show up as lifetime changes in the pump–probe experiments discussed previously.
| H2O2 ⇌ HO2− + H+ | (2) |
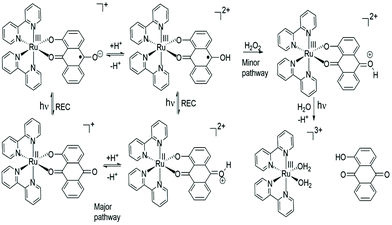
The major pathway for RU1 following excitation is assigned to a four-cycle system as illustrated in Fig. 6. The pKa of the conjugate acid of anthraquinone (ANQ) is −8.2 in H2O.56 Given this pKa value and the lack of evidence for protonation of the ground state complex it is proposed that following excitation the C–O˙− radical is protonated;57 the pKa being around 6.5 which is reasonable since the pKa of the conjugate acid of ANQ˙− is ca. 5.3 in DMF.58 The protonated version of RU1 following charge recombination then rapidly loses a proton to complete the cycle. To account for the slow decomposition of RU1 a very minor pathway must exist that removes an electron from the quinone-based ligand to generate the ruthenium(III) complex (cf.Fig. 5).59 The one electron reduction of hydrogen peroxide in the presence of acid (eqn (3)) has a standard redox potential E° = +0.80 V (vs. NHE).60 In addition, the hydroxyl radical formed is an extremely strong oxidizing agent (eqn (4)) with E° = +2.73 V (vs. NHE).60
| H2O2 + H+ + e− ⇌ HO˙ + H2O | (3) |
| HO˙ + H+ + e− ⇌ H2O | (4) |
One electron oxidation of photoexcited RU1 by H2O2 appears to be a feasible reaction61 and as a result would produce a highly oxidising radical, which may go on to oxidise a further ground state complex. Hence, the input of one photon could in principle result in the formation of two ruthenium(III) complexes. Over a much longer timescale the ruthenium(III) complex (Fig. 6) decomposes further, possibly promoted by light, to release HAQ. There are likely further redox reactions involving the [Ru(bipy)2(OH2)2]3+ ion, because of the excess peroxide present in solution.
Conclusion
The incorporation of an anthraquinone-based ligand onto the “Ru(bipy)2” fragment is a facile way to produce a complex (i.e., RU1) that absorbs further to the red. This positive feature is unfortunately accompanied by the loss of any discernable phosphorescence. The efficient non-radiative excited state deactivation is doubtless the result of strong excited to ground-state coupling. The poor emission does rule out the use of RU1 as a luminescent probe. However, it is a photoactivatable complex that can consume hydrogen peroxide, albeit the reaction is slow under the conditions employed and operates best at low pH. The pH of the inner membrane of normal mitochondria is around 7, and so it has the potential to operate as a peroxide concentration disruptor.62 Clearly, there are many other redox active species (e.g., NAD+/NADH, FAD+/FADH) within mitochondria that could interact with the excited state of RU1. We expect to test these concepts in follow up work in the future, exploring the localization of RU1 in mitochondria and its toxicity under light illumination.Experimental
Materials
All the chemicals were purchased from commercial sources and used as received without further purification. For the studies undertaken in water, ruthenium hexafluorophosphate salts were converted to chloride salts by using Amberlite® IRA-410 chloride form. Aqueous solutions were prepared using a PURELAB® Option-Q water purification system. High-field nuclear magnetic resonance (NMR) spectra including 1H NMR, 13C NMR, COSY, HSQC, HMBC were collected on Bruker Advance III HD 700 MHz spectrometer. Chemical shifts for all complexes were reported relative to acetonitrile-d3 (Cambridge Isotope Laboratories, CD3CN, 99.8%) at δ = 1.940 ppm. High-resolution electron spin ionization (ESI) mass spectrometry was collected by the National Mass Spectrometry Facility (NMSF) in Swansea.Synthetic procedures
X-Ray crystallography
Crystal structure data for RU1 were collected at 100 K on beamline I19 at Diamond Light Source using synchrotron radiation (λ = 0.68890 Å).63,64 These data were processed using the software APEX3 (Bruker, 2015). The structure of RU1 was solved using XT65 and refined using XL66 through the Olex2 interface.67 All non-hydrogen atoms were refined anisotropically. Hydrogen atoms were positioned with idealized geometry and their displacement parameters were restrained using a riding model with U(H) set to be 1.2 times the Ueq value of the parent atom.Computer calculations
Computational calculations were performed using a 32-bit version of Gaussian0968 on a quadruple-core Intel Xeon system with 4GB RAM. The calculations were run in parallel, fully utilising the multi-core processor. Becke's three paramater exchange correlation functional and the Lee, Yang and Parr correlation functional that recovers dynamic electron correlation (B3LYP) coupled to a split basis set was used in all calculations. The ground-state structure for RU1 was calculated using a 3-21G* basis set for the ruthenium ion and 6-311G for all other atoms. Energy minimisation calculations were monitored using Molden and run in parallel with frequency calculations to ensure optimised geometries represented local minima.Circular dichroism (CD) spectra
CD spectra were measured by a JASCO 810 spectropolarimeter (JASCO International Co., Ltd). The spectra were obtained in acetonitrile at 20 °C using a 1 cm path length quartz cuvette (Starna® Scientific Ltd). Each spectrum was accumulated from 3 scans between the range of 200–950 nm, at a scan rate of 100 nm min−1 with a standard sensitivity and continuous scan mode. The data were recorded every 0.2 nm. Concentrations of Λ or Δ-RU1 were prepared in a 1 × 10⁻³ M stock solution and adjusted to an appropriate concentration where the HT [V] was lower than 600 V.Electrochemistry
Cyclic voltammetry experiments were used to determine the redox potentials of the individual components of RU1. Measurements were performed using a fully automated CH Instruments Electrochemical Analyzer and a three electrode set-up on BASi® C-3 Cell Stand at room temperature. The three electrode set-up consisted of a platinum working electrode, a platinum wire counter electrode and an Ag/AgNO3 reference electrode. All studies were carried out in deoxygenated and anhydrous CH3CN containing TBAPF6 (0.1 M) as the background electrolyte. Solution concentrations were 0.1 mM.Photochemical kinetic studies
UV–visible absorption properties under different conditions of RU1 were collected on Shimadzu Spectrophotometer UV-1800 at a resolution of 0.5 nm with medium scan speed from range 300–1100 nm. For stability and photobleaching test, solar simulators calibrated with an AM 1.5G filter and equipped with a 150 W Xe lamp (SS-150 Series, Sciencetech Inc.) was used as the light source. For the degradation kinetic studies, pH 2–13 aqueous solutions were used. The pH values were measured using a Jenway 3310 pH meter, utilizing a three point calibration with pH = 4.0, 7.0, and 10.0 buffer solutions. For all solutions the pH in time was measured and adjusted as necessary to keep it constant. The photochemical degradation reactions were initiated by adding freshly prepared 0.4 M H2O2 to 5 × 10⁻⁴ M RU1 aqueous solution with different pHs. The solution was degassed for few minutes and irradiated under white light at R.T. At appropriate time intervals, UV–Vis absorption spectra were measured. All kinetic experiments were performed in duplicate.Transient absorption spectroscopy
Excited state dynamic processes in femtoseconds to nanoseconds time scales were studied using the pump–probe method as described in detail elsewhere.69 The fundamental light source at 800 nm was generated by a Ti:sapphire laser system (Libra F laser system, Coherent Inc.) which produced 1 mJ pulses with duration 100 fs at a 1 kHz repetition rate. Majority (∼90%) of the fundamental beam power was delivered to Optical Parametric Amplifier (OPA) (TOPAS C, Light Conversion Ltd) and was tuned to generate pump pulses at 410, 470 or 500 nm for RU1. The pump beam diameter at the sample was around 0.5 mm and the power was attenuated by optical filters to excitation density at the sample <0.1 mJ cm−2. A small amount (∼10%) of the Libra-output light was delivered to the measurement system (ExiPro, CDP Inc.) which utilized a sapphire plate as a White Light Continuum (WLC) generator to produce the probe beam. The probe beam was then split into two parts: the probe signal and probe reference beams (∼0.1 mm diameter). The delay time limit for the machine is ∼6 ns. The signal and reference beams were passed through the sample and their spectra were measured by monochromator with a pair of array detectors. The gap between the wavelength ranges is due to strong WLC distortions caused by the fundamental (800 nm) pulse of the Libra laser. The transient absorption spectra were obtained by comparing responses with and without excitation using a chopper synchronized with the fundamental laser pulses and blocking every second pump pulse. ExiPro Program (CDP Corp.) was used to control the experiment and calculate the spectra. The sample solutions for pump–probe measurements were prepared to have absorbance between 0.2–0.8 optical densities (OD) in 2 mm cuvette used for the measurements and equipped with magnetic stirred bar. The optical scheme was aligned for maximum overlap of the pump and prove signal through the whole cuvette thickness. Zero reference time was found by looking for the start of signal build-up, with the delay line first set for the pump pulse hitting the sample after the probe pulse and moving the delay line so that pump started to overlap the probe in time. Steady state absorption spectra were measured before and after the pump–probe measurement to confirm that the sample did not change during the measurement.Conflicts of interest
There are no conflicts of interest.Acknowledgements
We thank the Royal Society of Chemistry Researcher Mobility Grant for financial support. We also thank the National Mass Spectrometry Facility at Swansea University for collecting mass spectra of the compounds and Dr Helen Waller from FMS at Newcastle University for help with the CD spectra. We would also like to thank Diamond Light Source for access to beamline I19.References
- C. A. Puckett and J. K. Barton, J. Am. Chem. Soc., 2007, 129, 46–47 CrossRef CAS PubMed.
- E. M. Simcox and A. K. Reeve, in Mitochondrial Dysfunction in Neurodegenerative Disorders, Springer, 2016, pp. 3–30 Search PubMed.
- D. L. Nelson, A. L. Lehninger and M. M. Cox, Lehninger principles of biochemistry, Macmillan, 2008 Search PubMed.
- M. Groessl, O. Zava and P. J. Dyson, Metallomics, 2011, 3, 591–599 RSC.
- S. Fulda, L. Galluzzi and G. Kroemer, Nat. Rev. Drug Discovery, 2010, 9, 447 CrossRef CAS PubMed.
- V. Gogvadze, S. Orrenius and B. Zhivotovsky, Trends Cell Biol., 2008, 18, 165–173 CrossRef CAS PubMed.
- G. Kroemer, Oncogene, 2006, 25, 4630 CrossRef CAS PubMed.
- D. C. Wallace, Gene, 2005, 354, 169 CrossRef CAS PubMed.
- D. C. Wallace, Nat. Rev. Cancer, 2012, 12, 685 CrossRef CAS PubMed.
- S. Vyas, E. Zaganjor and M. C. Haigis, Cell, 2016, 166, 555–566 CrossRef CAS PubMed.
- W.-X. Zong, J. D. Rabinowitz and E. White, Mol. Cell, 2016, 61, 667–676 CrossRef CAS PubMed.
- S. E. Weinberg and N. S. Chandel, Nat. Chem. Biol., 2015, 11, 9 CrossRef CAS PubMed.
- M. P. Murphy, Biochem. J., 2009, 417, 1–13 CrossRef CAS PubMed.
- H. U. Simon, A. Haj-Yehia and F. Levi-Schaffer, Apoptosis, 2000, 5, 415–418 CrossRef CAS PubMed.
- E. Birben, U. M. Sahiner, C. Sackesen, S. Erzurum and O. Kalayci, World Allergy Organ. J., 2012, 5, 9 CrossRef CAS PubMed.
- A. M. Pickering, R. A. Linder, H. Zhang, H. J. Forman and K. J. A. Davies, J. Biol. Chem., 2012, 287, 10021–10031 CrossRef CAS PubMed.
- P. T. Schumacker, Cancer Cells, 2006, 10, 175–176 CrossRef CAS PubMed.
- G.-Y. Liou and P. Storz, Free Radical Res., 2010, 44, 479–496 CrossRef CAS PubMed.
- L. A. Sena and N. S. Chandel, Mol. Cell, 2012, 48, 158–167 CrossRef CAS PubMed.
- T. P. Szatrowski and C. F. Nathan, Cancer Res., 1991, 51, 794–798 CAS.
- T. J. Meyer, Acc. Chem. Res., 1989, 22, 163–170 CrossRef CAS.
- S. Berardi, S. Drouet, L. Francàs, C. Gimbert-Suriñach, M. Guttentag, C. Richmond, T. Stoll and A. Llobert, Chem. Soc. Rev., 2014, 43, 7501–7519 RSC.
- M. Kimura and S. Doi, J. Chem. Soc., Dalton Trans., 1983, 37–43 RSC.
- W. Kaim and G. K. Lahiri, Coord. Chem. Rev., 2019, 393, 1–8 CrossRef CAS.
- J. Wang, J. Kou, X. Hou, Z. Zhao and H. Chao, Inorg. Chim. Acta, 2017, 454, 176–183 CrossRef CAS.
- M. A. Ansari, A. Mandal, A. Paretzki, K. Beyer, J. Fielder, W. Kaim and G. K. Lahiri, Inorg. Chem., 2016, 55, 5655–5670 CrossRef CAS PubMed.
- J. Ježek, K. F. Cooper and R. Strich, Antioxidants, 2018, 7, 13 CrossRef PubMed.
- A. Ambroise and B. G. Maiya, Inorg. Chem., 2000, 39, 4256–4263 CrossRef CAS PubMed.
- B. Kolp, H. Viebrock, A. von Zelewsky and D. Abeln, Inorg. Chem., 2001, 40, 1196–1198 CrossRef CAS PubMed.
- A. DelMedico, W. J. Pietro and A. B. P. Lever, Inorg. Chim. Acta, 1998, 281, 126–133 CrossRef CAS.
- C. J. da Cunha, S. S. Fielder, D. V. Stynes, H. Masui, P. R. Auburn and A. B. P. Lever, Inorg. Chim. Acta, 1996, 242, 293–302 CrossRef CAS.
- R. Hage, R. Prins, J. G. Haasnoot, J. Reedijk and J. G. Vos, J. Chem. Soc., Dalton Trans., 1987, 1389–1395 RSC.
- E. C. Constable and J. Lewis, Inorg. Chim. Acta, 1983, 70, 251–253 CrossRef CAS.
- R. P. Thummel, F. Lefoulon and J. D. Korp, Inorg. Chem., 1987, 26, 2370–2376 CrossRef CAS.
- R. Hage, A. H. J. Dijkhuis, J. G. Haasnoot, R. Prins, J. Reedijk, B. E. Buchanan and J. G. Vos, Inorg. Chem., 1988, 27, 2185–2189 CrossRef CAS.
- C. J. da Cunha, E. S. Dodsworth, M. A. Monteiro and A. B. P. Lever, Inorg. Chem., 1999, 38, 5399–5409 CrossRef CAS.
- F. Elytle, L. M. Petrosky and L. R. Carlson, Anal. Chim. Acta, 1971, 57, 239–247 CrossRef.
- A detailed discussion of the DFT calculations is included in the ESI,† incorporating the location of the Kohn-Sham molecular orbitals and their contributions to the absorption profile. Also included is structural alterations to the complex upon formation of the triplet state and its oxidized state.
- D. W. Thompson, A. Ito and T. J. Meyer, Pure Appl. Chem., 2013, 85, 1257–1305 CAS.
- K. Kalyanasundaram, Coord. Chem. Rev., 1982, 46, 159–244 CrossRef CAS.
- M. Maestri, V. Balzani, C. Deuschel-Cornioley and A. Von Zelewsky, Adv. Photochem., 1992, 17, 1–68 CAS.
- J. P. Sauvage, J. P. Collin, J. C. Chambron, S. Guillerez, C. Coudret, V. Balzani, F. Barigelletti, L. De Cola and L. Flamigni, Chem. Rev., 1994, 94, 993–1019 CrossRef CAS.
- H. Masui, A. B. P. Lever and P. R. Auburn, Inorg. Chem., 1991, 30, 2402–2410 CrossRef CAS.
- W. R. Browne, C. M. O'Connor, C. Villani and J. G. Vos, Inorg. Chem., 2001, 40, 5461–5464 CrossRef CAS PubMed.
- N. Berova, K. Nakanishi, R. W. Woody and R. Woody, Circular dichroism: principles and applications, John Wiley & Sons, 2000 Search PubMed.
- W. R. Browne, D. Hesek, J. F. Gallagher, C. M. O'Connor, J. S. Killeen, F. Aoki, H. Ishida, Y. Inoue, C. Villani and J. G. Vos, Dalton Trans., 2003, 2597–2602 RSC.
- H. Eyring, H.-C. Liu and D. Caldwell, Chem. Rev., 1968, 68, 525–540 CrossRef CAS.
- D. M. Roundhill, Photochemistry, Photophysics, and Photoredox Reactions of Ru(bpy)32+ and Related Complexes. In: Photochemistry and Photophysics of Metal Complexes, Modern Inorganic Chemistry, Springer, Boston, MA, 1994 Search PubMed.
- S. Yoon, P. Kukura, C. M. Stuart and R. A. Mathies, Mol. Phys., 2006, 104, 1275–1282 CrossRef CAS.
- R. Englman and J. Jortner, Mol. Phys., 1970, 18, 145–164 CrossRef CAS.
- M. Haga, E. S. Dodsworth and A. B. P. Lever, Inorg. Chem., 1986, 25, 447–453 CrossRef CAS.
- Z. Zhang, X.-H. Wu, F.-Q. Sun, F. Shan, J.-C. Chen, L.-M. Chen, Y.-S. Zhou and W.-J. Mei, Inorg. Chim. Acta, 2014, 418, 23–29 CrossRef CAS.
- A TD-DFT calculated absorption spectrum for the oxidized complex located the transition maximum at ca. 830 nm, and assigned it to mixed ligand-to-metal charge transfer (LMCT) and n–π* transitions.
- (a) H. Li, K. Ren and D. C. Neckers, J. Org. Chem., 2001, 66, 8556–8562 CrossRef CAS PubMed; (b) M. H. Hall, H. Lu and P. B. Shevlin, J. Am. Chem. Soc., 2001, 123, 1349–1354 CrossRef CAS.
- Value at 20 °C. F. A. Cotton and G. Wilkinson, Advanced Inorganic Chemistry: A Comprehensive Text, John Wiley & Sons, 4th edn, 1980 Search PubMed.
- J. Hankache, D. Hanss and O. S. Wenger, J. Phys. Chem. A, 2012, 116, 3347–3358 CrossRef CAS PubMed.
- The process is likely proton-coupled in which a proton from a hydrogen bonded water molecule at the C
![[double bond, length as m-dash]](https://www.rsc.org/images/entities/char_e001.gif) O group is transferred simultaneously with the electron transfer. See: A. Dey, J. Dana, S. Aute, A. Das and H. N. Ghosh, Photochem. Photobiol. Sci., 2019, 18, 2430–2441 RSC.
O group is transferred simultaneously with the electron transfer. See: A. Dey, J. Dana, S. Aute, A. Das and H. N. Ghosh, Photochem. Photobiol. Sci., 2019, 18, 2430–2441 RSC. - A. Babaei, P. A. Connor, A. J. McQuillan and S. Umpathy, J. Chem. Educ., 1997, 74, 1200–1204 CrossRef CAS.
- It is possible that a small percentage of H2O2 is hydrogen bonded to the quinone oxygen and following proton-coupled electron transfer generates HO2− in close proximity to the excited state complex. Oxidation then occurs within the ion-pair formed. This mechanism would alleviate the need to rely on a bimolecular quenching process.
- Standard redox potentials at pH 7 are +0.39 V (H2O2) and +2.31 V (HO˙). See: D. A. Armstrong, R. E. Huie, S. Lymar, W. H. Koppenol, G. Merényi, P. Neta, D. M. Stanbury, S. Steenken and P. Wardman, BioInorg. React. Mech., 2013, 9, 59–61 CAS.
- It is not possible to accurately determine the driving force for the reaction since the E° value for RU1 is unknown. However, the value must be lower than for [Ru(bipy)3]2+ (E° = 2.10 eV), and assuming the change is roughly the difference in the λmax values, then E° for the complex would be around 1.4 eV. The excited state redox potential
 is ca. −0.95 V vs. Ag/AgNO3 meaning the excited state is a powerful reducing agent. The oxidising power of the complex is not possible to determine since the quinone redox couple is irreversible and a two electron process.
 - The calculated partition coefficient (log
![[thin space (1/6-em)]](https://www.rsc.org/images/entities/char_2009.gif) P) for RU1 in an octanol/water mixture was measured to be −0.59. Effective mitochondria targeting compounds such as cationic rhodamines have log
P) for RU1 in an octanol/water mixture was measured to be −0.59. Effective mitochondria targeting compounds such as cationic rhodamines have log![[thin space (1/6-em)]](https://www.rsc.org/images/entities/char_2009.gif) P values in the range −0.62 to 1.60, see: I. Belostotsky, S. M. da Silva, M. G. Paez and G. L. Indig, Biotech. Histochem., 2011, 86, 302 CrossRef CAS PubMed Given the log
P values in the range −0.62 to 1.60, see: I. Belostotsky, S. M. da Silva, M. G. Paez and G. L. Indig, Biotech. Histochem., 2011, 86, 302 CrossRef CAS PubMed Given the log![[thin space (1/6-em)]](https://www.rsc.org/images/entities/char_2009.gif) P value and previous examples of metal-based mono-cationic complexes RU1 would be expected to enter mitochondria.
P value and previous examples of metal-based mono-cationic complexes RU1 would be expected to enter mitochondria. - D. R. Allen, H. Nowell, S. A. Barnett, M. R. Warren, A. Wilcox, J. Christensen, L. K. Saunders, A. Peach, M. T. Hooper, L. Zaja, S. Patel, L. Cahill, R. Marshall, S. Trimnell, A. J. Foster, T. Bates, S. Lay, M. A. Williams, P. V. Hathaway, G. Winter, M. Gerstel and R. W. Wooley, Crystals, 2017, 7, 336 CrossRef.
- N. T. Johnson, P. G. Waddell, W. Clegg and M. R. Probert, Crystals, 2017, 7, 360 CrossRef.
- G. M. Sheldrick, Acta Crystallogr., Sect. A: Found. Adv., 2015, 71, 3–8 CrossRef PubMed.
- G. M. Sheldrick, Acta Crystallogr., Sect. A: Found. Crystallogr., 2008, 64, 112–122 CrossRef CAS PubMed.
- O. V. Dolomanov, L. J. Bourhis, R. J. Gildea, J. A. K. Howard and H. Puschmann, J. Appl. Crystallogr., 2009, 42, 339–341 CrossRef CAS.
- M. J. Frisch, G. W. Trucks, H. B. Schlegel, G. E. Scuseria, M. A. Robb, J. R. Cheeseman, G. Scalmani, V. Barone, B. Mennucci, G. A. Petersson, H. Nakatsuji, M. Caricato, X. Li, H. P. Hratchian, A. F. Izmaylov, J. Bloino, G. Zheng, J. L. Sonnenberg, M. Hada, M. Ehara, K. Toyota, R. Fukuda, J. Hasegawa, M. Ishida, T. Nakajima, Y. Honda, O. Kitao, H. Nakai, T. Vreven, J. A. Montgomery Jr., J. E. Peralta, F. Ogliaro, M. Bearpark, J. J. Heyd, E. Brothers, K. N. Kudin, V. N. Staroverov, T. Keith, R. Kobayashi, J. Normand, K. Raghavachari, A. Rendell, J. C. Burant, S. S. Iyengar, J. Tomasi, M. Cossi, N. Rega, J. M. Millam, M. Klene, J. E. Knox, J. B. Cross, V. Bakken, C. Adamo, J. Jaramillo, R. Gomperts, R. E. Stratmann, O. Yazyev, A. J. Austin, R. Cammi, C. Pomelli, J. W. Ochterski, R. L. Martin, K. Morokuma, V. G. Zakrzewski, G. A. Voth, P. Salvador, J. J. Dannenberg, S. Dapprich, A. D. Daniels, O. Farkas, J. B. Foresman, J. V. Ortiz, J. Cioslowski and D. J. Fox, Gaussian 09, Revision D.01, Gaussian, Inc., Wallingford, CT, 2013 Search PubMed.
- (a) F. Abou-Chahine, D. Fujii, H. Imahori, H. Nakano, N. V. Tkachenko, Y. Matano and H. Lemmetyinen, J. Phys. Chem. B, 2015, 119, 7328–7337 CrossRef CAS PubMed; (b) D. Sirbu, C. Turta, A. C. Benniston, F. Abou-Chahine, H. Lemmetyinen, N. V. Tkachenko, C. Wood and E. Gibson, RSC Adv., 2014, 4, 22733–22742 RSC.
Footnote |
| † Electronic supplementary information (ESI) available. CCDC 2013315. For ESI and crystallographic data in CIF or other electronic format see DOI: 10.1039/d0dt02339f |
| This journal is © The Royal Society of Chemistry 2020 |

